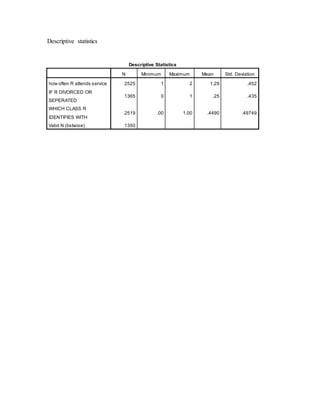
1. Descriptive statistics
Descriptive Statistics
N Minimum Maximum Mean Std. Deviation
how often R attends service 2525 1 2 1.29 .452
IF R DIVORCED OR
SEPERATED
1365 0 1 .25 .435
WHICH CLASS R
IDENTIFIES WITH
2519 .00 1.00 .4490 .49749
Valid N (listwise) 1350
5. Crosstabs
Figure 1- divorce and attend
Case Processing Summary
Cases
Valid Missing Total
N
Perce
nt N
Perce
nt N
Perce
nt
IF R
DIVORCED
OR
SEPERATED
* how often R
attends
service
1356 53.4% 1182 46.6% 2538
100.0
%
IF R DIVORCED OR SEPERATED * how often R
attends service Crosstabulation
Count
how often R attends
service
Total1 2
IF R
DIVORCED
OR
SEPERATED
0 647 366 1013
1
230 113 343
Total 877 479 1356
6. Figure 2- divorce and class
Case Processing Summary
Cases
Valid Missing Total
N Percent N Percent N Percent
IF R
DIVORCED OR
SEPERATED *
WHICH CLASS
R IDENTIFIES
WITH
1357 53.5% 1181 46.5% 2538 100.0%
IF R DIVORCED OR SEPERATED * WHICH CLASS R
IDENTIFIES WITH Crosstabulation
Count
WHICH CLASS R
IDENTIFIES WITH
Total0 1
IF R
DIVORCED OR
SEPERATED
0 481 531 1012
1
174 171 345
Total 655 702 1357
7. Regression
Figure 1- bivariate analysis of divorce and attend
Model Summary
Mod
el R
R
Squar
e
Adjusted
R Square
Std. Error
of the
Estimate
1 .029a .001 .000 .435
a. Predictors: (Constant), how often R attends
service
Coefficientsa
Model
Unstandardized
Coefficients
Standardiz
ed
Coefficient
s
t Sig.B Std. Error Beta
1 (Constant) .289 .035 8.140 .000
how often R
attends
service
-.026 .025 -.029 -1.067 .286
a. Dependent Variable: IF R DIVORCED OR SEPERATED
8. Figure 2 –bivariate analysis of divorce and class
Model Summary
Mod
el R
R
Squar
e
Adjusted
R Square
Std. Error
of the
Estimate
1 .025a .001 .000 .436
a. Predictors: (Constant), WHICH CLASS R
IDENTIFIES WITH
Coefficientsa
Model
Unstandardized
Coefficients
Standardiz
ed
Coefficient
s
t Sig.B Std. Error Beta
1 (Constant) .266 .017 15.607 .000
WHICH
CLASS R
IDENTIFIES
WITH
-.022 .024 -.025 -.932 .351
a. Dependent Variable: IF R DIVORCED OR SEPERATED
9. Figure 3- multivariate analysis
Model Summary
Mod
el R
R
Squar
e
Adjusted
R Square
Std. Error
of the
Estimate
1 .039a .002 .000 .435
a. Predictors: (Constant), WHICH CLASS R
IDENTIFIES WITH, how often R attends service
Coefficientsa
Model
Unstandardized
Coefficients
Standardiz
ed
Coefficient
s
t Sig.B Std. Error Beta
1 (Constant) .302 .038 7.960 .000
how often R
attends
service
-.028 .025 -.030 -1.120 .263
WHICH
CLASS R
IDENTIFIES
WITH
-.022 .024 -.025 -.920 .357
a. Dependent Variable: IF R DIVORCED OR SEPERATED