2. DECLARATION
I, Chisoni Mumba do hereby declare that the contents of the dissertation being
submitted herein are my original work and they have not been previously submitted to
any University for the award of a degree or any other qualification.
Signature……………………………………….Date…………………………………
ii
3. CERTIFICATE OF APPROVAL
This dissertation submitted by, Chisoni Mumba is approved as fulfilling the
requirements for the award of the degree of Master of Science in Livestock Economics
iii
at the University of Zambia.
………………………………….. ……………………………………….
Supervisor Signature
Examiner ------------------------------- Sign ---------------------- Date ----------------------
Examiner ------------------------------- Sign ---------------------- Date ----------------------
Examiner ------------------------------- Sign ---------------------- Date ----------------------
4. ABSTRACT
A cross sectional study was carried out with specific objectives of assessing the relative
profitability of smallholder dairy farming and determining the socio-economic factors
affecting it, in six of the then nine provinces of Zambia. Data used to achieve these
objectives were obtained from 157 smallholder dairy households, which were randomly
selected using a multi-stage sampling design and analyzed using descriptive statistics,
gross margin analysis and regression analysis. The study was driven by the lack of
research-based information in this area despite the involvement of an overwhelming
number of donor funded projects and the Government in promoting smallholder dairy
farming.
The results indicate an estimated average milk sale price of ZMK 2002.05 per litre,
while the estimated average cost of production was ZMK 828.20 per litre. Thus, the
estimated gross margin per litre was at ZMK 1173.85, representing 57.9 percent of the
average sale price of milk. Findings on econometric analysis of the socio-economic
factors indicated that dairy cow herd size and distance travelled to deliver milk to milk
collection centers had a statistically significant effect on the profitability of smallholder
dairy farming, other factors being held constant.
These results suggest that the Zambian smallholder dairy enterprise is a viable venture
and could play an important role in rural poverty reduction, employment and wealth
creation, as well as in enhancing household nutrition and food security. However, long
distances to the milk collection centers (market), lack of resources and a scarcity of high
milk yielding dairy breeds to increase dairy herd sizes are some of the major hindrances
to the viability of smallholder dairying in Zambia.
From the above study findings, it is recommended that the Government, donors and
other service providers need to allocate more resources towards smallholder dairy
development particularly in the areas of animal breeding, marketing, value addition,
infrastructure development, water harvesting mechanisms and knowledge transfer.
Further projects should also consider constructing more milk collection centers near
smallholder dairy farmers in order to reduce the distance travelled to deliver milk to the
market.
iv
5. DEDICATION
This work is especially dedicated to my dearest wife Abigail Banda and my children
Rukaya, Rashida and Aadam, my father and mother who, for their love, shared with me
the challenges and hardships during my studies at the University of Zambia. I thank
them all immeasurably for their moral support and understanding when I could not avail
myself as much as I should have done during the period of my studies. To you all, this is
v
the reward of your endurance.
6. ACKNOWLEDGEMENTS
I owe a deep and sincere debt of gratitude to Golden Valley Agricultural Research Trust
(GART), Zambia National and Welfare Trust (ZANZAWE) and the University of
Zambia, for financial and logistical support towards this study; my supervisors Professor
K. L. Samui, Professor G. S. Pandey, Dr. B. M. Hang’ombe and Dr. G. Tembo for their
continuous and constructive input. Their valuable suggestions and professional guidance
vi
enriched this study at every stage.
Further, I would like to express my heartfelt appreciation to all the lecturers in the
Department of Disease Control and indeed academic members of staff of the School of
Veterinary Medicine for their input.
Last but not the least; I would like to thank all respondents to my questionnaire survey
and all those who assisted in carrying out this survey.
7. TABLE OF CONTENTS
DECLARATION ............................................................................................................... i
CERTIFICATE OF APPROVAL .................................................................................... iii
ABSTRACT ..................................................................................................................... iv
DEDICATION .................................................................................................................. v
ACKNOWLEDGEMENTS ............................................................................................. vi
LIST OF ABBREVIATIONS ......................................................................................... xii
CHAPTER ONE ............................................................................................................... 1
BACKGROUND TO THE STUDY ................................................................................. 1
1.1 Introduction .................................................................................................................. 1
1.2 Global Perspective on Milk Production .................................................................... 2
1.2.1 Global Perspective on Milk Consumption .................................................. 3
1.3 Zambian Perspective on Milk Production ................................................................ 4
1.3.1 Dairy Subsector ........................................................................................... 4
1.3.2 Milk Production and Consumption in Zambia ............................................ 5
1.3.3 Milk Marketing in Zambia .......................................................................... 5
1.4 Statement of the Problem ............................................................................................ 6
1.4.1 Rationale of the Study ................................................................................. 7
1.5 Objectives of the Study ............................................................................................... 8
1.5.1 General Objective........................................................................................ 8
1.5.2 Specific Objectives...................................................................................... 8
1.6 Operational Definitions ............................................................................................... 9
vii
8. CHAPTER TWO ............................................................................................................ 10
LITERATURE REVIEW................................................................................................ 10
2.1 Introduction ................................................................................................................ 10
2.2 Profitability of Smallholder Dairy Production ....................................................... 10
2.3 Measures of Profitability .......................................................................................... 11
2.3.1. Uses of Gross Margin Analysis ................................................................ 12
2.3.2 Limitations of Gross Margin Analysis as an Indicator of Enterprise
Profitability .............................................................................................................. 13
CHAPTER THREE ......................................................................................................... 14
DATA SOURCES AND METHODOLOGY ................................................................. 14
3.1 Introduction ................................................................................................................ 14
3.2 Research Design and Description of Study Sites .................................................. 14
3.3 Study Sample and Sampling Technique ................................................................. 15
3.4 Data Collection Instruments ..................................................................................... 16
3.4.1 Structured Questionnaire ........................................................................... 17
3.4.2 Document Review ..................................................................................... 17
3.5 Pre-testing of the Data Collection Tools ................................................................ 17
3.6 Data Analysis ............................................................................................................. 18
3.6.1 Socio-economic Characteristics ................................................................ 18
3.6.2 Calculation of Gross Margins ................................................................... 18
3.6.3 Econometric Specification and Estimation of the Empirical Model ......... 22
3.6.4 Model Estimation (Specification Analysis) .............................................. 24
3.6.5 Summary Model Estimation (Specification Analysis ............................... 25
viii
9. CHAPTER FOUR ........................................................................................................... 26
RESULTS ....................................................................................................................... 26
4.1 Introduction ................................................................................................................ 26
4.2 Socioeconomic Characteristics of Respondents .................................................... 26
4.3 Descriptive Statistics for Milk Production ............................................................. 29
4.4 Profitability (Gross Margins) of Smallholder Dairy Farming ............................. 30
4.4.1 Cost of Production and Gross Margins from each Province Expressed as a
Percentage ................................................................................................................ 31
4.4.2 Provincial Variations in the Cost of Production and Profitability ............ 32
4.5 Socio-economic Factors Affecting Profitability of Smallholder Dairying ........ 34
4.5.1 Model Estimation: Choice of a Functional Form ...................................... 34
4.5.2 Model Estimation: Heteroskedasticity Test (Examination of Residuals) . 34
4.5.3 Model Estimation: Multicollinearity Test using Correlation Matrix and
Variance Inflation factor (VIF) ................................................................................ 35
4.5.4 Multiple Regression Estimates of the Socio-economic Factors Affecting
Profitability of Smallholder Dairy Farming............................................................. 37
4.6 Contribution of Smallholder Dairying to Rural Socio-economic Development .......... 38
CHAPTER FIVE ............................................................................................................. 41
DISCUSION ................................................................................................................... 41
5.1 Socio-economic Characteristics and their Effects on Profitability of
Smallholder Dairy Farming (Multiple Regression Analysis) .......................................... 41
5.2 Cost of Milk Production and Gross Margins ........................................................ 44
5.3 Provincial Variations in the Cost and Returns of Milk Production..................... 44
5.4 Contribution of Smallholder Dairy to Rural Socio-economic Development ..... 46
ix
10. CHAPTER SIX ............................................................................................................... 49
CONCLUSIONS AND RECOMMENDATIONS ......................................................... 49
6.1 Conclusions ................................................................................................................ 49
6.2. Recommendations ...................................................................................................... 49
CHAPTER SEVEN ......................................................................................................... 51
REFERENCES ................................................................................................................ 51
CHAPTER EIGHT ......................................................................................................... 57
APPENDICES ................................................................................................................ 57
8.1 Appendix I: Questionnaire used in Data Collection.............................................. 57
x
11. LIST OF TABLES
Table 1: Socioeconomic characteristics of respondents.................................................. 28
Table 2: Descriptive Statistics ......................................................................................... 29
Table 3: Average price received and cost of production milk in ZMK/L ....................... 30
Table 4: Average price received and gross margin in ZMK/L ....................................... 31
Table 5: One way analysis of variance of arithmetic means of cost of production ........ 33
Table 6: One way analysis of variance for arithmetic means of profits.......................... 33
Table 7: Curve estimation for annual gross margin against dairy cow herd size ........... 34
Table 8: Multicollinearity test with the correlation matrix ............................................. 36
Table 9: Collinearity test using tolerance and variance inflation factor (VIF) ............... 36
Table 10: Multiple regression estimates of factors affecting profitability of smallholder
dairy enterprise. ............................................................................................................... 37
Table 11: Contribution of smallholder dairying to rural socio-economic development . 39
LIST OF FIGURES
Figure 1: Map of Zambia showing study sites (districts). ............................................... 15
Figure 2: Graph of cost of production versus profit expressed as a percentage ............. 32
Figure 3: Histogram of Y=ZRESID, X=ZPRED ............................................................ 35
Figure 4: Decent house (right) built from income generated from smallholder dairy
farming by a widow in Monze district. Old house (left). ................................................ 40
xi
12. LIST OF ABBREVIATIONS
AAEA American Agricultural Economics Association
ANOVA Analysis of Variance
xii
CAR Cost and Returns
CBA Cost Benefit Analysis
CEA Cost Effective Analysis
CUA Cost Utility Analysis
CSO Central Statistical Office
EU European Union
FDI Foreign Direct Investment
GART Golden Valley Agricultural Research Trust
GMA Gross Margin Analysis
HI Heifer International
MCC Milk Collection Center
NGO Non Governmental Organisation
PBA Partial Budget Analysis
SPSS Statistical Package for the Social Sciences
UHT Ultra-High-Temperature
UNZA University of Zambia
ZMK Zambian Kwacha
ZATAC Zambia Agribusiness Technical Advisory Center
13. CHAPTER ONE
1
BACKGROUND TO THE STUDY
1.1 Introduction
Smallholder dairy farming is very important as it produces the much needed commodity
for the life of animals and humans. Milk has been described as nature’s most perfect
food, as it is the sole source of nourishment for newborn mammals (Schmidt et al.,
1988). It is very important in the human diet because of two important ingredients
namely protein and calcium. Protein provides many of the amino acids often deficient in
the cereal food grains. Dairy products provide the most important amino acids required
for body building as well as tissue repairs in human beings (Osotimehin et al., 2006).
Calcium is the nutrient most likely to be lacking in diets of persons who do not consume
milk or milk products hence adequate calcium intake is difficult to attain in the human
diet if milk or milk products are excluded (Schmidt et al., 1988). Milk also contains
essential vitamins and minerals. Vitamins have many roles in the body, including
metabolism co-factors, oxygen transport and antioxidants (Fox and McSweeney, 1998).
They help the body use carbohydrate, protein and fat. Minerals also have many roles
including enzyme functions, bone formation, water balance maintenance and oxygen
transport (Fox and McSweeney, 1998). There is some evidence that milk and milk
products exhibit a cholesterol lowering effect thus preventing incidences of
atherosclerosis and coronary heart disease (Schmidt et al., 1988).
14. 1.2 Global Perspective on Milk Production
It is estimated that almost 150 million farm households, i.e. more than 750 million
people, are engaged in milk production worldwide, the majority of whom are in
developing countries (FAO, 2010). Annual milk consumption growth rates in these
countries averaged 3.5 to 4.0 percent over the decade 1995-2005, at least double the
growth rates of 1.4 to 2.0 percent for major staple foods over the same period (FAO,
2010). The dairy sector provides income and employment to many, often poor, people.
It is estimated that 12 to 14 percent of the world population, or 750-900 million people,
live on dairy farms or within dairy farming households and the production of one
million litres of milk per year on smallholder dairy farms creates approximately 200 on-farm
jobs (FAO, 2010). Smallholder dairy farming promotes regular monetary earnings
to people who access cash once a season after they sell their harvested crops. The
regular monthly monetary earnings from the sale of milk and milk products have
favorable effects on the cash flow charts of rural households and assist in improving the
lifestyles of the rural people. Smallholder dairying also helps people to get involved in
the mainstream cash economy and poverty alleviation ventures of their countries. It
increases the milk production base of the country, improves household nutrition,
empowers women and youths in income generation ventures and overall agricultural
development. It assists farmers to diversify, spread farming risks and creates opportunity
for some idling resources like crop residues to enter the human food chain hence
utilizing marginal form of resources (Ngongoni et al., 2006).
2
15. 1.2.1 Global Perspective on Milk Consumption
Based on milk equivalents (ME), average per capita global milk consumption amounts
to about 100 kg of milk per year, with very significant differences between countries or
regions (FAO, 2010). Per capita consumption in Western Europe is in excess of 300
litres of milk per year compared with less than 30 litres (and sometimes even as little as
10 litres) in some African and Asian countries (FAO, 2010). In the past, increases in
global milk demand were mainly driven by population growth, whereas currently they
are also increasingly fuelled by rising per capita milk consumption in some highly
populated developing countries. Increasing income levels are expected to raise the
demand for milk and dairy products by more than 1.8 percent per annum (FAO, 2010).
Should increases in milk production not follow suit, dairy prices will rise significantly
over past levels. South Asia and European Union (EU) countries are the most important
dairy regions, accounting for 44 percent of global milk production. In the period 2002 to
2007, world milk production grew by 13 percent, or by an average of 15 million tons of
energy corrected milk (ECM) per year – mainly through production increases in China,
India and Pakistan (Saha et al., 2004; EU, 2009). Overall, therefore, developing
countries, which rely predominantly on smallholder dairy production systems, have
increased their share in world milk production.
3
16. 1.3 Zambian Perspective on Milk Production
4
1.3.1 Dairy Subsector
Zambia has three main types of dairy producers, namely: (1) traditional farmers; (2)
smallholder dairy farmers; and (3) large scale commercial dairy farmers (Phiri, 1995;
Neven et al., 2006). Traditional small scale producers hold the largest number of cattle,
but given that their cattle consist mostly of local breeds (zebu), they represent only an
estimated 45 percent of milk production and an estimated 25 percent of marketed raw
milk in Zambia (Kaluba, 1992; Neven et al., 2006). Most of the milk produced is either
consumed by the household or sold in informal rural markets and consumed as raw
milk. Some traditional small scale producers sell their milk to milk collection centers
who in turn sell either to processors or directly to consumers.
Smallholder dairy farmers originate either from the ranks of the traditional small scale
farmers or represent new entrants into the sub-sector (e.g., retirees who invested their
pension in a dairy farm). Most of them are organized in cooperative societies around
milk collection centers from where processors collect the raw milk. These smallholder
dairy farmers use mostly mixed-breed cows and unlike traditional small scale producers,
they sell the bulk of their output to processors in the formal market or consumers in the
informal market. These are the farmers that this study targeted.
Large scale commercial dairy farmers are capital-intensive and have larger herds of
purebred dairy cows. This set-up gives them greater control over production and hence
they are able to concentrate production in the dry season when prices are at peak. Large
17. scale commercial dairy farmers sell in both informal and formal markets and supply
about 80 percent of the milk into the formal dairy channels (Neven et al., 2006).
1.3.2 Milk Production and Consumption in Zambia
Zambia has a population of over 13 million of which 61 percent resides in rural areas
with agriculture as their main source of livelihood (CSO, 2010). Smallholder dairying in
Zambia is practiced in a production system that integrates crop and dairy farming.
Smallholder dairying can play an important role in poverty reduction, creation of
employment opportunities and wealth as well as in enhancing household nutrition/food
security of the rural population, the majority of which live below the poverty datum line.
Milk production in Zambia is estimated at over 215 million litres per year and about 115
million litres is the share from smallholder dairy farmers (Pandey, 2010). The Zambian
per capita milk consumption is estimated at 24 litres against the level recommended by
FAO, which is about 200 litres per person per year (Pandey, 2010). The average per
capita consumption in sub-Saharan Africa is at 36 litres with Kenya being the highest at
about 100 litres per person per year (Thorpe et al., 2000; Muriuki et al., 2001; Pandey,
5
2010).
1.3.3 Milk Marketing in Zambia
Market development is very important for dairy or any other agricultural production to
thrive (Mullins, 1995). Since 1991 the Government of Zambia has liberalized its
markets leading to fundamental structural changes in the agri-food sector (Saasa, 1996).
Parastatal companies were privatized, commodity markets were deregulated and foreign
18. direct investment (FDI) was both encouraged and facilitated. This resulted in new
investments by international firms in some sectors of the country’s agri-food system,
most notably in retail distribution and food processing. These companies introduced
modern procurement strategies that have started to change the institutional,
organizational and technological characteristics of the supply chain. Currently, the
smallholder dairy farmers supply their milk to milk collection centers on a daily basis.
Membership to these milk collection centers is through payment of a fee and a farmer
automatically becomes a shareholder. It is the duty of milk collection centers to store
milk in refrigerated cooler tanks and market it. Parmalat, Zambeef, Dairy King and other
dairy processing companies enter into contracts with these milk collection centers. The
farmers are paid at the end of the month by the appropriate centers upon receiving
payments from the processors. However, the Zambian milk market is currently under
threat from cheaper low quality milk imported from the Common Market for East and
Southern Africa (COMESA) Region (Kamayoyo, 2010). Prices are currently regulated
by processors who have established a new quality-based raw milk pricing schedule,
similar to that applied in industrialized countries. Price is calculated using complex
formulas based on bacterial count and butterfat content of milk amongst others.
6
1.4 Statement of the Problem
Zambia has about 2,500 smallholder dairy farmers affiliated to dairy cooperatives whose
capacities in smallholder dairy farming are being strengthened by resource persons,
including materials & financial support mainly from Golden Valley Agricultural
Research Trust (GART), Heifer International, Land ‘O’ Lakes International and many
19. other Non Governmental Organisation (NGOs) in collaboration with the Government of
Zambia (Pandey and Muliokela, 2006). Despite the involvement of these donor funded
projects and Government in promoting smallholder dairy farming, there is lack of the
much needed solid empirical evidence on the viability of smallholder dairy farming in
Zambia. However, so many studies have been carried out in different countries in Africa
and other continents (Baltenweck et al., 1998; Mburu et al., 2007; Otieno et al., 2009;
Kavoi et al., 2010). Similar studies are also being carried out annually in European
countries (EU, 2009). This study therefore seeks to reduce the existing knowledge gap
in Zambia and to contribute to the general body of knowledge in terms of study design,
7
approach and analysis of results.
1.4.1 Rationale of the Study
The rationale for economic analysis in smallholder dairy farming arises from the fact
that resources in a dairy enterprise namely human resource, facilities, equipment, raw
materials and others, are all scarce commodities. This means that choices have to be
made about where to deploy these scarce resources. Economic evaluation/analysis
provides a scientific and systematic method for making these choices (Zweifel et al.,
2009). Research based information on economic analysis of the relative profitability of
smallholder dairy farming is lacking in Zambia. The findings from this study will
therefore provide baseline data for policy makers, donors, development planners and
farmers when making decisions related to the profitability of smallholder dairy
enterprises in Zambia. It is also important in issues relating to farm-level decision
making, policy and government program evaluation, performance analysis, and resource
20. allocation to smallholder dairy farming. The importance of this study to this field can
8
therefore not be over-emphasized.
1.5 Objectives of the Study
1.5.1 General Objective
The general objective of the study was to determine the relative profitability of
smallholder dairy farming in Zambia.
1.5.2 Specific Objectives
The specific objectives of the study were as follows;
i) To assess the provincial variations in relative profitability of smallholder dairy
enterprise in Zambia.
ii) To determine the socio-economic factors and their effects on the profitability of
smallholder dairy farming in Zambia.
iii) To assess the socio-economic contribution of smallholder dairy farming to rural
development.
21. 9
1.6 Operational Definitions
Smallholder dairy farmer: according to FAO (2007), smallholder dairy farmer refers
to a farmer with one to four dairy cows. The smallholder dairy farmers use mostly
mixed-breed cows and sell the bulk of their output to processors in the formal market
through cooperatives or consumers in the informal market.
Formal markets: refer to the dairy companies that operate the processing facilities in a
dairy zone (i.e. collecting centers set up at community level) that usually buy the milk
either directly from the farmers or via some agent (FAO, 2007).
Informal markets: refer to milk sellers and buyers in a neighborhood or village. It
includes smallholder dairy farmers who sell some of the farm produce to the local
market (FAO, 2007).
Dairy value chain: refers to the various stages through which milk and milk products
pass from farm to the final consumer (FAO, 2007).
Enterprise: is any coherent portion of the general input-output structure of the business
that can be separated and analyzed as a distinct entity (AAEA, 1998).
Fixed costs: These are costs which cannot easily be allocated to the different enterprises
on the farm and do not change if the size of the enterprise is altered (Gordijn and
Whitehead, 2005).
Variable costs: these are costs that satisfy two criteria; they must be specific to a single
enterprise, and they must vary approximately in proportion to the size of the enterprise
output. Therefore they only occur if production takes place (Gordijn and Whitehead,
2005).
22. CHAPTER TWO
10
LITERATURE REVIEW
2.1 Introduction
The literature reviewed in this chapter highlights what others have written about
profitability of smallholder dairy farming and the factors affecting it, under the
subheadings:- profitability of smallholder dairy farming; measures of profitability; uses
of gross margin analysis and its limitations.
2.2 Profitability of Smallholder Dairy Production
Many studies have been carried out to assess the viability or relative profitability of
smallholder dairy farming and the critical factors affecting it. There is a rich history of
researchers using gross margin analysis as a tool to determine efficiency and
profitability of dairy systems, and regression analysis to determine factors affecting
these systems (Cain et al., 2007). Mburu et al. (2007) carried out similar works to assess
the profitability in different agro ecological zones in the Kenya highlands, but his study
had limitations of valuation of manure and sale of calves as there was lack of accurate
market prices for these secondary outputs. A study by Osotimehin et al. (2006)
examined the profitability as well as operational efficiency of milk processing enterprise
in Kogi state, Nigeria using budgetary analysis. This resulted in the calculation of net
farm income for processors hence omitting the profitability for dairy farmers. A study
on the measurement of economic efficiency for smallholder dairy cattle in the marginal
zones of Kenya by Kavoi et al. (2010) preferred to use the cost function approach over
23. the profit function approach to avoid problems of estimation that may arise in situations
where farm households realize zero or negative profits at the prevailing market prices.
However, this study dwelt more on the socio-economic factors affecting the economic
efficiency for smallholder dairy cattle, using multiple regression analysis. Otieno et al.
(2009) carried out some work on economic evaluation of relative profitability in small
holder dairy farms in western Kenya. He used farmers’ profit levels generated by gross
margin analysis in comparing their relative efficiency in dairy farming using regression
analysis. This empirical literature on profitability of smallholder dairy enterprise formed
the basis for carrying out an economic analysis of the viability of smallholder dairy
farming in Zambia. However, unlike the previous ones, the current study took into
account the socio-economic factors affecting smallholder dairy farmers using multiple
11
regression analysis.
2.3 Measures of Profitability
There are five basic methods of economic analysis or measures of profitability namely
gross margin analysis (GMA), partial budgeting analysis (PBA), cost effective analysis
(CEA), cost utility analysis (CUA) and cost-benefit analysis (CBA) (Dijkhuizen and
Huirne, 1997; Zweifel et al., 2009). The current study used gross margin analysis to
calculate profits of dairying at an individual farm level due to the fact that it is the
simplest and most practical method of assessing enterprise profitability and it is widely
used in farm management economics (Dijkhuizen and Huirne, 1997). In complete
enterprise costing (PBA and CBA) the fixed costs are also allocated, unlike for gross
margin analysis where only the outputs and variable costs are allocated to individual
24. enterprises. This result in a net profit per enterprise with all costs allocated, and enables
the calculation of costs per tonne of grain or per litre of milk produced on the farm and
break-even budgets. The strength of such techniques is that they help to identify all costs
involved in a particular enterprise. Despite its apparent simplicity, however, the full cost
approach is fraught with difficulties as awkward and sometimes arbitrary decisions have
to be made concerning the allocation of overhead expenses between enterprises (Firth,
2002). Net profit figures per enterprise tend to ignore the interrelated nature of
enterprises and are thus less useful for most farm enterprise systems (Firth and
Lennartsson, 1999). However, despite being the best measure of relative enterprise
profitability, gross margin analysis has its own limitations as well, as explained in
12
section 2.3.2.
2.3.1. Uses of Gross Margin Analysis
The many purposes for which gross margin estimates are developed broadly include
farm-level decision making, policy and government program analysis, performance
analysis and the study of resource allocation issues (AAEA, 1998). Farm-level decision
analysis examines options for a given farm in the coming year, and for longer-range
periods using projected information. Policy analysis often uses historical cost
information for a group of farms producing the same commodity, to analyze the likely
impacts of a proposed policy change. The study of efficiency of resource allocation
usually involves details on the components of cost and returns for a composite of farms.
Economic or financial performance of a particular enterprise can involve both historical
and projected cost information for a single farm and/or a group of farms. To address
25. these various information requirements, gross margin estimates are prepared to provide
measures of the costs of producing a unit of a commodity for a specific farm, for a
representative farm in a region, or for a representative farm in a nation as a whole
13
(AAEA, 1998).
2.3.2 Limitations of Gross Margin Analysis as an Indicator of Enterprise
Profitability
Gross margins should only be compared with figures from farms with similar
characteristics and production systems. With this reservation in mind, the comparisons
can give a useful indication of the production and economic efficiency of an enterprise.
Comparison of gross margins between enterprises with different fixed cost structures
can be misleading (Firth, 2002). In the current study, smallholder dairy farmers had
similar characteristics and production systems. The gross margin does not measure net
profit of an enterprise as it only takes variable costs into account. Therefore, it should be
clearly stated that the results obtained in the current study are gross margins and not net
profits, even though the former is a good measure of enterprise profitability. Labour can
be difficult to allocate as most businesses have permanent labour and casual labour. In a
gross margin analysis of a dairy enterprise, the tendency is to focus on the casual labour
associated with that particular activity such as cattle herding or milking (Firth, 2002).
Therefore casual (hired) labour took care of this aspect of fixed cost in this study.
26. CHAPTER THREE
DATA SOURCES AND METHODOLOGY
14
3.1 Introduction
This chapter presents the research design and description of study sites, study sample
and sampling technique, data collection instruments and data analysis. It ends with the
discussion on the conceptual framework for multiple regression analysis on socio-economic
factors affecting the profitability of smallholder dairy farming in Zambia.
3.2 Research Design and Description of Study Sites
A cross-sectional survey design employing quantitative data collection techniques was
used. The study sites included 12 districts from 6 provinces; namely Central Province
(Kabwe and Chibombo districts), Southern Province (Mazabuka, Monze, Choma and
Kalomo districts), Eastern Province (Chipata district), Copperbelt Province (Luanshya
district), Lusaka Province (Kafue district) and Western Province (Mongu and Senanga
districts). The choice of these provinces was driven by the presence of substantial
numbers of dairy cooperative societies which assisted in terms of milk marketing and
whose capacities in smallholder dairying are being strengthened through the provision
of resource persons, materials and financial support mainly by the Golden Valley
Agricultural Research Trust (GART) and non-governmental organizations (NGOs) in
collaboration with the Government of Zambia (Pandey and Muliokela, 2006). The study
sites are shown in Figure 1.
27. Figure 1: Map of Zambia showing study sites (districts).
15
Mongu
Senanga
Chipata
Luanshya
Kafue
Mazabuka
Monze
Choma
Kalomo
Kabwe
Chibombo
Batoka
EP
LP NP
CP
LSP
NWP
WP SP
CBP
Source: http://mapsof.net/zambia/static-maps/png/zambia-map
3.3 Study Sample and Sampling Technique
KEY
LP=Luapula Province
LSP=Lusaka Province
NP=Northern Province
EP=Eastern Province
CP=Central Province
WP=Western Province
SP=Southern Province
CBP=Copper belt
Province
NWP=North-western
Province
Multi-stage sampling which included both purposive and random sampling was
employed in this study. Patton (1990) claims that: “The logic and power of purposive
sampling lies in selecting information-rich cases for an in-depth study. Information-rich
cases are those from which one can learn a great deal about issues of central importance
to the research. In this study, information rich cases were those farmers regularly
delivering milk to milk collection centers (MCCs) over a period of one year (August
2009 to July 2010). In the first stage, the country was divided into nine (now ten)
provinces on the basis of administrative demarcations; in the second stage, six out of the
then nine provinces were purposively selected based on the presence of smallholder
dairy activities; in the third stage, twelve districts were also purposively selected from
28. the six provinces based on the same criterion as in stage two; in the fourth stage, a list of
smallholder dairy farmers was developed by first going through the records of respective
milk collection centers (MCCs) in the selected districts and then coming up with a
sampling frame. In the final stage, sample sizes were calculated proportionate to the
number of farmers on the compiled list and random sampling was used to obtain a sub-sample
for each of the districts following the methods described by Osotimehin et al.
(2006), as well as Nimoh et al. (2012) who carried out studies using similar
methodology. A total of 157 smallholder dairy households were involved in the study
and primary data were collected through personal interviews using a structured
questionnaire as described by Thrusfield (1986). Secondary data were collected from
milk collection centers using document reviews as described by Weiss (1998).
16
3.4 Data Collection Instruments
The study used triangulation in data collection through the use of interviews and
reviewing of documents. Silverman (2000) points out that triangulation in data
collection involves the use of two or more methods and can help to explain the richness
and complexity of data. This avoids a situation where research results are generated
exclusively on one method (Patton, 1990; Freebody, 2003). The assumption is that some
of the methods have weaknesses and exclusive reliance on one could bias or even distort
the researcher’s work.
29. 17
3.4.1 Structured Questionnaire
Interview-based structured questionnaires were administered to 157 smallholder dairy
farmers. The information collected included socioeconomic characteristics, quantities
and costs of all variable inputs and prices of milk. The questionnaire development
procedure followed the method described by Thrusfield (1986) and Osotimehin et al.
(2006) and included open-ended and closed types of questions. The structured
questionnaire was prepared in English and translated in local languages during
interviews. The questionnaire was administered by the researcher in all the study sites.
3.4.2 Document Review
Documents were reviewed to determine the quantities of milk delivered to the milk
collection centers and the total amounts paid to the farmers over a period of one year
(August 2009 to July 2010). Records of accounts were sourced from milk collection
centers and reviewed. Weiss (1998) holds the view that documents are “a good place to
search for answers as they provide a useful check on information gathered in an
interview.” She further states that when “other techniques fail to resolve a question,
documentary evidence can provide a convincing answer.”
3.5 Pre-testing of the Data Collection Tools
Pre-testing of the data collection tools was carried out at Mapepe Dairy Cooperative
Society in Kafue District. The Cooperative Society was chosen because it had similar
characteristics with the dairy cooperative societies under study. Fifteen smallholder
dairy farmers were interviewed in order to determine the effectiveness of the research
30. tools primarily with regard to the clarity, strengths and weakness of some of the items in
the tools as well as to test whether the instruments would get the intended responses.
18
3.6 Data Analysis
The data collected were coded and entered into Microsoft excel for calculation of gross
margins and Statistical Package for the Social Sciences (SPSS) for descriptive statistics
and multiple regression analysis.
3.6.1 Socio-economic Characteristics
Descriptive statistics were used to describe the socio-economic characteristics of the
respondents using SPSS. The one way analysis of variance (ANOVA) was used to
compare the arithmetic means of the cost of production and annual gross margin in each
district.
3.6.2 Calculation of Gross Margins
Gross margins were calculated for each respondent using Microsoft Excel spread sheets
to estimate costs and returns of the smallholder dairy enterprise. In this study, gross
margin analysis was used to calculate gross margins of dairying at an individual farm
level. Gross margins were calculated as mean revenues less mean variable costs using a
formula described by Mburu et al. (2007), as shown in equation 1.
Gross Margin= [Milk price (ZMK/litre) x Milk volume (litres)–(Variable
costs)]……………..Equation 1
31. Variable costs consisted of the costs of feeds including roughage (hay and silage) and
concentrates (molasses, bran, cakes etc). The cost of labour included cost of hired labour
for feeding animals, milking and delivering milk to milk collection centers. The cost of
de-worming was calculated by computing the frequency of de-worming multiplied by
the number of cows and the cost of de-wormers that were used per year. The cost of
vaccinations included the cost of veterinary labour and vaccinations per animal
multiplied by the frequency in a year. The cost of dipping was calculated by computing
the number of dairy animals, frequency of dipping during rainy and dry seasons, method
of dipping (spraying or plunging) and the price of dip on the market in a year. The cost
of treatment was calculated by computing the estimated number of veterinary visits for
animal treatment and cost of medicines for mastitis and other diseases, cost of
tuberculosis and brucellosis testing in a year. The cost of artificial insemination was
calculated by computing the number of cows and costs per cow/visits by an artificial
insemination extension officer. Other costs included the cost of milking cream, teat dips,
19
detergents, etc.
Fixed costs [land, permanent labour and capital] were ignored since they were unrelated
to higher levels of milk production and do not affect the optimal combination of the
variable inputs. For example, land could not be valuated because the respondents were
on communal land so they were not paying any rentals or land rates. These farmers do
not have title to this land as communal land belongs to the chiefs. Capital could not be
valuated because the farmers did not need any capital to start their smallholder dairy
enterprise as they were given the dairy cows as a grant by Golden Valley Agricultural
32. Research Trust, Heifer International, Africa Development Bank, Land “O” Lakes under
a “Pass-on Project” and many other non-governmental organizations (NGOs). Land “O”
Lakes International was implementing a smallholder dairy project called “Pass-on-the-gift”
under which farmers were given a pregnant dairy heifer, and then they would
‘pass-on’ the calf if it is female to another farmer.
Permanent labour was not computed because the respondents did not employ workers on
a permanent basis. Other studies like that conducted by Mburu et al. (2007), included
opportunity cost on family labour as permanent labour, but in our scenario this was
difficult due to lack of accurate methods of valuating opportunity costs of family labour
20
which was used by many farmers..
Revenue (outputs) included sale of milk as a primary produce. Manure is a non-market
benefit of the smallholder dairy enterprise and it is very difficult to evaluate (Staal et al.,
2003; Ouma et al., 2004). However, due to lack of reliable data on the market value of
manure and calves as stated by Ouma et al. (2004), no attempts were made to quantify
these non-marketed benefits (manure) to the smallholder dairy enterprise. A similar
study in Kenya by Mburu et al. (2007) did not include manure due to the same reason.
The female calves were not sold because of the “Pass-on-the-gift” project basis by Land
“O” Lakes International- a USAID donor-funded project. Male calves were kept and
used for payments of dowry in most of the surveyed areas. The value of milk consumed
by households and calves was included under revenues since it is a product of the farm.
Revenues included the total value of milk produced on the farm i.e. sales of milk and the
33. value of milk consumed on the farm and by the calves. After computing the gross
margins for all the farmers in the six provinces, a one-way analysis of variance was used
to determine the provincial variations in the costs of production and profits at 0.05 level
of confidence. This was done at a farm level.
The milk price was a market price. Farm gate prices were not captured by the study as
no farmer was allowed to sell milk at the farm or informal market by the smallholder
dairy project implementers who had given the dairy animals to these farmers. As a result
the farmers could not reveal the farm gate prices for fear of reprisals by their
cooperative societies. Milk produced was delivered to the respective milk collection
centers (co-operatives) on a daily basis. It is the responsibility of the cooperative to
21
market the milk.
The gross margins estimated in this study were not net profits. This is because some
fixed costs such as capital and land were not included due to lack of reliable data as
earlier stated. Firth (2002) states that, an enterprise budgetary analysis (Full cost
accounting and net margins) provides a better reflection on the smallholder dairy
enterprise, but the difficulties of using net margins are that; firstly there are few (if any)
published ‘standards’ with which to compare, secondly costs of field operations are not
accurately recorded on all farms thereby relying on estimates that may vary from farm to
farm and which can cause problems when farm comparison is made and, finally net
margins and net profit per enterprise are less appropriate for farm planning since the
fixed cost elements are unlikely to vary directly in proportion to the size of the
enterprise.
34. 3.6.3 Econometric Specification and Estimation of the Empirical Model
The empirical literature on dairy economics reflects the investigation into the
relationship between socioeconomic variables and profitability by means of multiple
regression methods (Olubiyo et al., 2009). Studies conducted by Nchinda and Mendi
(2008); Otieno et al. (2009); Chagunda et al. (2006) have demonstrated the effects of
age, gender, marital status, education level, household size and distance on relative
profitability of smallholder dairy enterprise by use of multiple regression models. This
formed the basis of inclusion of the socio-economic explanatory variables in our study.
Annual gross margin was used as a dependent variable (Y) and seven socioeconomic
characteristics of the respondents as explanatory variables (X) namely age, sex, marital
status, education level, household size and distance to milk collection centers.
Categorical variables (gender, marital status and level of education) were converted to
dummy variables so that they could be included into the linear regression model. The
implicit model of the regression was as indicated in the equation 2 below:
Y = 0 + 1X1 + 2X2 + 3X3 + 4X4 + 5X5 + 6X6 + 7X7 + e……………..Equation 2
22
Where;
Y = Annual Gross Margin (ZMK)
0 = Intercept
1 to 7 = Constants
X1 = Age of the farmer (Years)
X2 = Gender of farmer (0=female, 1=male), converted to dummy variable with 1=
female and anything else=0.
35. X3 = Marital Status (1=single, 2= married, 3=widowed), converted to dummy
variable with 1= single and anything else=0.
23
X4 = Household Size (No of Persons)
X5 = Educational Level (0=no formal, 1=primary, 2=secondary, 3=tertiary)
converted to dummy variable 1=no formal education, anything else=0.
X6 = Herd Size (Number of Dairy Cows)
X7 = Distance travelled to deliver milk to MCCs (Km)
e = Error Term; where the error term is assumed to be independent and normally
distributed with mean zero and constant variance.
The null hypothesis was that each independent variable (age of the farmer, gender,
marital status, household size, level of education, dairy cow herd size and distance to
MCCs) was having absolutely no effect (has a coefficient of 0) and we were looking for
a reason to reject this theory. The F-ratio was used to test the joint hypothesis to show
whether the included variables collectively exerted any significant influence, on the
dependent variable, the value of annual gross margin. It tested the null hypothesis that
all the estimated coefficients are zero. The hypotheses are explicitly represented as
follows:
Ho: 1 to 7=0…………………………Equation 3
The alternative hypothesis states that profit is a function of age of the farmer, gender,
marital status, household size, level of education, dairy cow herd size and distance to
MCCs). Therefore, at least one of the coefficients is not zero.
HA: 1 to 7 ¹0………………………..Equation 4
36. 3.6.4 Model Estimation (Specification Analysis)
Choice of functional form: the factors affecting profitability of smallholder dairy
enterprise were subjected to regression analysis in three functional forms (linear,
quadratic and cubic forms). The dependent variable (annual gross margin) was plotted
against each independent variable using curve estimation in order to determine the
functional form of the relationship. Gujarati (2004) states that, in determining model
adequacy, some broad features of the results, such as the R2 value, the estimated t ratios
and the positive and negative signs of the estimated coefficients in relation to their prior
expectations are considered. Therefore, if these diagnostics are reasonably good, it can
be concluded that the chosen model is a fair representation of reality
Heteroskedasticity Test: According to Gujarati (2004), examination of the residuals is
a good visual diagnostic to detect autocorrelation or heteroskedasticity. A plot of the
residuals will exhibit distinct patterns. Technically normality is necessary only for the t-tests
to be valid; estimation of the coefficients only requires that the errors be identically
and independently distributed. Normality of residuals can be visually inspected from the
histogram with the superimposed normal curve which shows skewness for symmetry
24
and the kurtosis for peakedness.
Multicollinearity Test: Multicollinearity exists when a predictor is a perfect linear
combination of one or more of the remaining predictors (Maddala, 1992), i.e. when a
predictor is highly correlated with others. A high level of correlation between predictors
37. X1 and X2 limits the ability to determine the proper relationship between X1 and Y while
controlling for X2 and vice versa, because X1 does not vary independently of X2.
3.6.5 Summary Model Estimation (Specification Analysis
Multiple Linear Regression analysis was carried out using Statistical SPSS version 16
after carrying out the preliminary tests on the data. It was indicated that the empirical
model did not violate the rules of regression analysis as the following assumptions were
25
met:
Linearity: the relationships between the predictors and the outcome variables were
linear.
Normality: the errors were normally distributed.
Homogeneity of variance (heteroskedasticity): the error variance was found to be
constant.
Independence: the errors associated with one observation were not correlated with the
errors of any other observation.
Multicollinearity: there was no collinearity between and within the predictors. SPSS
recommends caution if the VIF 10, or equivalently if the Tolerance is 0.1.
38. CHAPTER FOUR
26
RESULTS
4.1 Introduction
This chapter presents the results in a following way: socio-economic characteristics of
the respondents, descriptive statistics for milk production, profitability of smallholder
dairying and its provincial variations, and contribution of smallholder dairy farming to
rural development. It ends with a model estimation and description of the socio-economic
factors affecting smallholder dairy farming in Zambia through the use of
multiple regression analysis.
4.2 Socioeconomic Characteristics of Respondents
The findings in Table 1 indicated that 14.6 percent of the respondents were aged
between 31-40 years, 45.9 percent between 41-50 years, 23.6 percent between 51-60
years and 15.9 percent between 61-70 years, respectively. The mean age of the
respondents was 48.8 years. The majority of the respondents were male (63.1 percent),
while 36.9 percent were female. Marital status of the respondents was distributed as
follows; 82.8 percent were married, 5.1 percent were single and 12.1 percent were
widowed. It was also observed that 9.6 percent of the respondents had household sizes
of 1-5 persons, 42.7 percent had 6-10 persons, 22.3 percent had 11-15 persons, 10.2
percent had 16-20 persons and 15.2 percent had 21-25 persons, respectively. The
average household size was 10 persons. The majority of the respondents (56.7 percent)
had primary education, 29.9 percent had secondary education, 8.3 percent had no formal
39. education and 5.1 percent had tertiary education. Distance to milk collection centers
seemed to be a very important factor on the viability of the smallholder dairy enterprise.
About 17.2 percent of the respondents lived at distances less than 1 km from the
respective milk collection centers, 43.9 percent at 1-5 km, 25.5 percent at 5-10 km, 12.1
percent at 10-20 km and 1.3 percent at over 20 km i.e. the longer the distance from the
MCC the lower the number of smallholder dairy farmers delivering the milk.
27
40. Table 1: Socioeconomic characteristics of respondents
Parameter Number Percentage
Age (years)
31-40 23 14.6
41-50 72 45.9
51-60 37 23.6
61-70 25 15.9
Gender
Female 58 36.9
Male 99 63.1
Marital status
Married 130 82.8
Single 8 5.1
Widowed 19 12.1
Household size (number of persons)
1-5 15 9.6
6-10 67 42.7
11-15 35 22.3
16-20 16 10.2
21-25 24 15.2
Level of education
No formal education 13 8.3
Primary 89 56.7
Secondary 47 29.9
Tertiary 8 5.1
Distance travelled to MCCs (km)
Less than 1 27 17.2
1-5 69 43.9
6-10 40 25.5
11-20 19 12.1
Over 20 km 2 1.3
Total for each section 157 100
Average age= 48.8 years, average household size=10 persons
28
41. 4.3 Descriptive Statistics for Milk Production
The dairy cow herd size ranged from 1 to 40 with an average of about 4 cows. The
animals were fed an average of 3.23 kg of concentrates as supplementary feed per cow
per day during and after milking as none of the farmers practiced complete zero grazing.
The farmers were delivering from 1 to 145 litres of milk per day to the milk collection
centers in the dry season with an average of 15.37 litres and up to 170 litres with an
average of 27.69 litres per day in the rainy season. Home milk consumption ranged from
1 to 5 litres per day with an average of 2.2 litres per household. This resulted in dairy
households having a per capita consumption of about 80 litres. An average of 3.96 litres
of milk was being fed to calves in the first three months of life. The farmers were
making profits ranging from ZMK 132,000 to ZMK 57,862,000 with an average of
ZMK 5,508,620 per year. Table 2 depicts milk production descriptive statistics.
29
Table 2: Descriptive Statistics
Parameter N Min Max Mean Std. Deviation
Dairy cow herd size 155 1 40 4.37 6.53
Litres per day in dry season 157 1.00 145.00 15.37 16.82
Litres per day in rain season 157 0.00 170.00 27.69 25.17
Litres consumed at home/day 157 1.00 5.00 2.20 1.16
Litres per calf/day for 3 months 157 0.00 5 3.96 1.39
Concentrates feed supplemented /cow/day 157 0.00 16.00 3.23 3.36
Annual profit (ZMK) 157 132,000 57,862,000 5,508,620 7,311,694
42. 4.4 Profitability (Gross Margins) of Smallholder Dairy Farming
The estimated average sale price of milk by the farmers was ZMK 2002.05 per litre. The
estimated average cost of production was ZMK 828.20 per litre, representing 42.1
percent of the sale price. The estimated returns per litre were at ZMK 1173.85,
representing 57.9 percent of the average sale price of milk. Table 3 and 4 depicts the
average sale price of milk, costs of production and returns with their respective
30
percentages.
Table 3: Average price received and cost of production milk in ZMK/L
Province District Price (ZMK/L) Cost (ZMK/L) Cost %
Southern
Mazabuka (N=25) 1976 980 49.6
Monze (N=22) 1754 816 46.5
Batoka (N=12) 1817 642 35.3
Choma (N=12) 1883 717 38.1
Kalomo (N=6) 1583 776 49
Central
Chibombo (N=18) 1828 734 40.2
Kabwe (N=4) 2000 994 49.7
Lusaka Kafue (N=15) 2000 1069 53.4
Eastern Chipata (N=15) 2073 860 41.5
Copperbelt Luanshya (N=10) 2110 1015 48.1
Western
Mongu (N=8) 2500 828 33.1
Senanga (N=10) 2500 506 20.2
Averages 2002.05 828.20 42.1
43. Table 4: Average price received and gross margin in ZMK/L
Province District Price (ZMK/L)
31
Gross margin
(ZMK/L)
Gross
margin%
Southern
Mazabuka (N=25) 1976 996 50.4
Monze (N=22) 1754 938 53.5
Batoka (N=12) 1817 1175 64.7
Choma (N=12) 1883 1166 61.9
Kalomo (N=6) 1583 807 51
Central
Chibombo (N=18) 1828 1094 59.8
Kabwe (N=4) 2000 1006 50.3
Lusaka Kafue (N=15) 2000 931 46.6
Eastern Chipata (N=15) 2073 1213 58.5
Copperbelt Luanshya (N=10) 2110 1095 51.9
Western
Mongu (N=8) 2500 1672 66.9
Senanga (N=10) 2500 1994 79.8
Averages 2002.05 1174.85 57.9
4.4.1 Cost of Production and Gross Margins from each Province Expressed as a
Percentage
Western Province recorded the highest gross margin per litre, followed by Eastern,
Southern, Central, Copperbelt and Lusaka in that order as shown on the graph below
(Figure 2).
44. Figure 2: Graph of cost of production versus profit expressed as a percentage
4.4.2 Provincial Variations in the Cost of Production and Profitability
A one-way Analysis of Variance was used to find out whether the costs of production
and the gross margins were significantly different at (P0.05) for the six provinces. Post
Hoc tests were carried out using the Benferonni statistic. There was a significant
difference in cost of production between Lusaka and Western Provinces (Table 5).
There was no significant difference in annual profits in all the provinces studied (Table
32
6).
45. Table 5: One way analysis of variance of arithmetic means of cost of production
33
Mean Difference
(I-J)
Std. Error Sig.
95% Confidence Interval
(I)
Province
(J)
Province
Lower
Bound
Upper Bound
Lusaka Southern 4711845.45 1792203.590 .142 -633618.14 10057309.05
Central 5341854.55 2126318.479 .196 -1000147.04 11683856.13
Eastern 6203666.67 2318749.267 .124 -712282.98 13119616.31
Western 7913188.89 2220033.404 .007* 1291671.22 14534706.56
Copperbelt 3692720.00 2592440.492 1.000 -4039546.77 11424986.77
*The mean difference is significant at the .05 level
Table 6: One way analysis of variance for arithmetic means of profits
Mean
Difference (I-J)
Std. Error Sig 95% Confidence Interval
(I) Province (J) Province Lower
Bound
Upper
Bound
Lusaka Southern 3945363.64 2067889.80 .874 -2222367.36 10113094.63
Central 3209854.55 2453400.00 1.000 -4107707.18 10527416.27
Eastern 3807800.00 2675431.51 1.000 -4171997.50 11787597.50
Copperbelt 3040180.00 2991223.36 1.00 -5881504.83 11961864.83
Western 4772444.44 2561530.65 .966 -2867630.00 12412518.89
The mean difference is significant at the .05 level
46. 4.5 Socio-economic Factors Affecting Profitability of Smallholder Dairying
4.5.1 Model Estimation: Choice of a Functional Form
The linear form was chosen as the lead function because it had the highest R2 value
(0.425) and the highest F-ratio (114.55) as show in Table 7.
Table 7: Curve estimation for annual gross margin against dairy cow herd size
Independent: HERD_SIZ
Dependent Mth Rsq d.f. F Sig. b0 b1
ANN_GM LINEAR .425 157 114.55 .000 2289307 734640
ANN_GM QUAD .267 157 56.32 .000 2517538 .0749
ANN_GM CUBIC .267 157 56.32 .000 . 4.0E-07 .9279
4.5.2 Model Estimation: Heteroskedasticity Test (Examination of Residuals)
The data were tested for heteroskedasticity (Y=ZRESID, X=ZPRED). The curve was
considerably fitted centrally indicating a perfect distribution of residuals as shown in the
histogram (Figure 3). This meant that the p-values for our t-tests were valid.
34
47. Figure 3: Histogram of Y=ZRESID, X=ZPRED
4.5.3 Model Estimation: Multicollinearity Test using Correlation Matrix and
35
Variance Inflation factor (VIF)
Data from the current study did not show any multicollineality because none of the
correlation values was significant (closer to 1.000) as shown in Table 8. Variance-inflation
factor (VIF) and tolerance values indicated that there was no collinearity
between and within the predictors in the regression model, as shown in Table 9.
48. Table 8: Multicollinearity test with the correlation matrix
36
Pearson
Correlation
Annual
gross
margin
Age Gender
Marital
status
Household
Size
Education
level
Herd
size
Distance
travelled
to MCC
Annual
gross
margin
1.000
Age
.040 1.000
Gender .021 .062 1.000
Marital
Status
.078 -.103 -.414 1.000
Household
Size
.145 -.100 -.155 .077 1.000
Education
Level
.249 .135 .047 -.031 .078 1.000
Herd size .652 -.056 -.045 .081 .097 .130 1.000
Distance
travelled
to MCC
.196 .007 .071 -.007 -.094 -.076 -.038 1.000
*Correlation is significant at 0.05 level (1-tailed)
Table 9: Collinearity test using tolerance and variance inflation factor (VIF)
Parameter Collinearity Statistics
Tolerance VIF
Age of the farmer .965 1.036
Gender of the farmer .771 1.297
Marital status .766 1.305
Household size .941 1.063
Level of education .954 1.048
Dairy cow herd size .953 1.049
Distance travelled to MCC .979 1.021
*Collinearity when VIF is 10. No collinearity if VIF = 1
49. 4.5.4 Multiple Regression Estimates of the Socio-economic Factors Affecting
Profitability of Smallholder Dairy Farming
Table 10 summarizes the multiple regression estimates of socio-economic factors
affecting profitability of smallholder dairy enterprise. Age of the farmer was not
statistically significant (p=0.076), gender of the farmer was not statistically significant
(p=0.342) and marital status was also not statistically (p=0.226). Thus, profitability is
not a function of age, gender and marital status of the farmer, other factors being held
constant. Household size was not statistically significant (p=0.945). Level of education
was equally not statistically significant (p=0.139). Dairy cow herd size was statistically
significant (p=0.00). A unit increase in the herd size of milking cow results in the
increase of profit of the smallholder dairy enterprise by ZMK 741, 405.57, other
variables being held constant. Distance to milk collection centers was statistically
significant (p=0.00). A unit decrease in distance to the MCC leads to an increase in
profit by ZMK 338, 445.16, other factors being held constant.
Table 10: Multiple regression estimates of factors affecting profitability of smallholder
dairy enterprise.
37
Model
Unstandardized
Coefficients
Standardized
Coefficients T Sig.
B Std. Error Beta
Constant -2.806E6 2.107E6 -1.332 .185
Age 61512.01 34415.885 .105 1.787 .076
Gender (dummy) -950878.76 995387.018 -.063 -.955 .341
Marital status (dummy) 1.547E6 1.273E6 .080 1.215 .226
Household size 5630.66 81238.355 .004 .069 .945
Education level (dummy) -2.329E6 1.567E6 -.088 -1.486 .139
Dairy herd size 741405.57 66452.989 .658 11.157 .000
Distance to MCC 354611.58 83995.607 .250 4.222 .000
Dependent Variable: Annual Gross margin R2 = 52.3 F = 23.3 P 0.05
50. 4.6 Contribution of Smallholder Dairying to Rural Socio-economic
38
Development
Table 11 indicates that the majority of the respondents (87.3 percent) stated that they
depended on smallholder dairying as their main source of income while 12.7 percent had
other main sources of income. The banking sector was benefiting from smallholder
dairy enterprise, with 35.7 percent of the respondents accessing their payments for the
milk delivered per month through bank transfers while 64.3 percent were receiving cash
directly from the milk collection centers. Most of the smallholder dairy farmers (68.2
percent) had acquired and used bicycles as the main mode of transport to deliver milk to
the milk collection centre, with 27.4 percent delivering milk on foot. Some farmers used
motorbikes (3.8 percent) and oxcarts (0.6 percent). Most (52.9 percent) of the
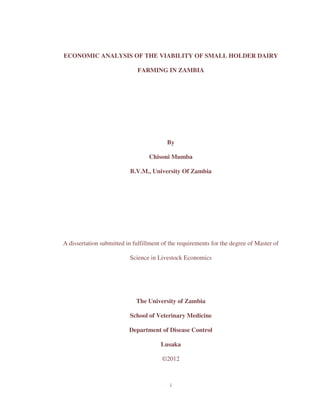
respondents used part of the money from milk sales for monthly church contributions as
tithe and offering in accordance with their religious teachings. Smallholder dairying
seems to also play an important role towards poverty reduction and rural development.
This can be seen from the number of respondents (10.2 percent) who had built iron
sheet-roofed houses from income generated from smallholder dairy enterprise as shown
in Figure 4. Many (43.9 percent) of the respondents indicated that they had bought some
luxuries such as cell phones, televisions, radios, satellite dishes etc. from income
generated from smallholder dairy farming. Of the 157 respondents, 49 percent had
employed other people to work on the farms as herdsmen, milkers and in other dairy
activities.
51. Table 11: Contribution of smallholder dairying to rural socio-economic development
Parameter Frequency Percentage
Main source of income
No 20 12.7
Yes 137 87.3
Total 157 100
Mode of payment
Cash 101 64.3
Bank transfer 56 35.7
Total 157 100
Mode of transport to MCCs
Foot 43 27.4
Bicycle 107 68.2
Ox cart 1 0.6
Motor bike 6 3.8
Total 157 100
Contribution to religion
No 74 47.1
Yes 83 52.9
Total 157 100
Contribution to provision of human housing
No 141 89.9
Yes 16 10.2
Total 157 100
Contribution to improving standard of living
No 88 56.1
Yes 69 43.9
Total 157 100
Contribution to Employment
No 80 51
Yes 77 49
Total 157 100
39
52. Figure 4: Decent house (right) built from income generated from smallholder dairy
farming by a widow in Monze district. Old house (left).
40
53. CHAPTER FIVE
41
DISCUSION
5.1 Socio-economic Characteristics and their Effects on Profitability of
Smallholder Dairy Farming (Multiple Regression Analysis)
The socioeconomic findings showed that the average age of the respondents was 48.8
years. This seems to suggest that smallholder dairy farming is mainly practiced by
people in the old age bracket as these are the ones targeted by donor funded projects on
the assumption that they have had experience of cattle rearing from their traditional
cattle breeds. There is need for these smallholder dairy donor funded projects to also
engage the youths so that there is continuity upon the demise of their parents in the old
age bracket. However, age, gender and marital status had no significant effect on the
profitability of smallholder dairy enterprise, other factors being held constant.
The average household size was ten persons per home. This is in agreement with the
Central Statistical Office census report that indicates that the average number of persons
per home in rural areas is ten (CSO, 2010). Household size has been described as the
most important determinant of labour investment for family farms because in addition to
being a source of labour, it also influences the need for increased milk production for
home consumption as well as for the market (Ngongoni et al., 2006). This was not the
case in this study as regression analysis showed that household size was not statistically
significant (p=0.945).
54. The majority of the respondents (77.7 percent) had formal education. However, level of
education was not statistically significant (p=0.139) in multiple regression analysis. It
had been expected that level of education would have a statistically significant effect on
profitability as this results in better understanding of smallholder dairy farming as a
business. It is also assumed that educated farmers have proper management of dairy
animals, feeding and good hygiene, thereby improving milk yield and profits.
According to FAO (2007), a smallholder dairy farmer is a farmer who has a dairy herd
size of one to four dairy cows. The average number of dairy cows in this study was four;
which conforms to the above definition of a smallholder dairy farmer by the Food and
Agriculture Organization (FAO). Dairy cow herd size (milking cows) was statistically
significant (p=0.000) and its coefficient was positive meaning that a unit increase in the
herd size of milking cows, results in an increase in profit of the smallholder dairy
enterprise by ZMK 741, 505.57, when other variables are held constant. This is in
agreement with Cain et al. (2007) who stated that profitability of a dairy enterprise is
highly correlated with herd size and measures should be taken to reduce calving
42
intervals in order to increase herd sizes.
Mutukumira et al. (1996) stated that long distance to milk collection centers is a
hindrance to a viable dairy enterprise. The longer the distance to the MCCs the less the
number of smallholder dairy farmers delivering milk, hence the less the profit. In this
study distance to MCCs was statistically significant (p=0.000). Thus, the shorter the
distance to the MCCs, the higher the profit. This is because the shorter distance, the
55. more the likelihood of the farmer delivering milk on a daily basis hence making more
profit than the one staying far who will only deliver when he has transport. Furthermore,
those staying far risked their milk becoming sour leading to rejection of this milk at the
43
MCC hence a reduction in profits.
The farmers were delivering 15.37 litres of milk per day to the milk collection centers in
the dry season and an average of 27.69 litres per day in the rainy season. This shows that
milk production in Zambia reduces by 44 percent during the dry season due to
inadequacies in quantity and quality of food and water for animals. Most of the farmers
did not conserve grass in form of hay as the fields are normally burnt or become dry and
overgrazed in the dry season.
Home milk consumption had an average of 2.2 litres per household. This resulted in
rural dairy households having a per capita consumption of about 80 litres against the
national per capita consumption of about 24 litres. An average of 3.96 litres of milk was
fed to calves in the first three months of life. The farmers were making an average gross
margin of ZMK 5,508,620 per year. This corresponds to a monthly income of about
ZMK 450, 000 which is almost equal to the current minimum wage for people in
employment in Zambia.
56. 5.2 Cost of Milk Production and Gross Margins
The estimated average sale price of milk by the farmers was ZMK 2002.05 per litre. The
estimated average cost of production was ZMK 828.20 per litre, representing 42.1
percent of the sale price. The estimated returns per litre were at ZMK 1173.85,
representing 57.9 percent of the average sale price of milk. The profit calculated was a
gross margin and not net profit. This is because some fixed costs could not be added due
to lack of reliable data on their market values. This is in agreement with the studies
carried out by Mburu et al., 2007 and Ouma et al., 2004 who had similar challenges.
However, gross margins are still useful in assessing enterprise profitability and are
widely used in farm management economics (Dijkhuizen and Huirne, 1997; Firth,
44
2002).
5.3 Provincial Variations in the Cost and Returns of Milk Production
According to Mburu et al. (2007), the costs of production are expected to be highest in
the most intensive systems and lowest in the most extensive systems reflecting the high
amounts of concentrate feeds used. This assumption was correct in our study as a one-way
analysis of variance showed that there were significant differences (P0.05)
between the costs of production for Lusaka and Western provinces. The cost of
production was lowest in Senanga (20.2 percent) and Mongu (33.1 percent) districts in
Western Province compared to 53.4 percent in Lusaka. This was because the costs of
labour, feeding, vaccination and dipping animals were very minimal in these districts.
The respondents indicated that the use of acaricides for dipping or spraying animals
against ticks is not practiced in Western Province because the ticks are eradicated by the
floods in the Zambezi flood plain every year hence very minimal or no costs towards
57. dipping. There were minimal costs on vaccination because most the vaccinations against
major diseases in Western Province i.e. contagious bovine pleural pneumonia (CBPP),
anthrax, blackleg etc, are carried out by the Government through the offices of district
veterinary officers. Rice polish and maize bran are the only supplementary feeds that a
few farmers give to their animals when in the uplands. The animals are kept in the
Zambezi flood plain which is evergreen almost throughout the year (6 to 8 months) and
are only moved to the uplands when the plain gets flooded in the rainy season. The
animals usually owned by several people and kept in herds of 30–100 are herded during
daytime and enclosed in kraals at night. The kraals are shifted frequently to spread the
manure over wide areas that are used to grow maize and millet (Moll et al., 2007). Some
interviewed farmers reported that they were using manure as payment for hired labour.
Manure from the dairy farming was used to fertilize the fields hence contributing to
conservation agriculture which the Government of the Republic of Zambia is currently
45
promoting.
Lusaka Province recorded the highest cost of milk production per litre. This is because
of the intensive systems being practiced where high amounts of concentrate feeds are
used. This is in agreement with Baltenweck et al. (1998) whose study findings showed
that the cost of production in a dairy enterprise is dependent on the level of
intensification, with less-intensified districts having relatively high levels of cash flows
while some highly intensified areas experience rather low levels of cash flows. Farmers
in urban areas like Lusaka have smaller families as compared to rural areas; hence the
cost of labour is also higher than in rural areas. Land in Lusaka Province is a limiting
58. factor due to the population pressure, hence the high level of intensification in dairy
46
farming.
There was no significant difference in unit profits in all the provinces regardless of some
provinces recording more profits than others. This is due to the differences in milk
volumes and prices which had a buffering effect in respective provinces. Western
Province had the lowest volume of milk but the price per litter was the highest at ZMK
2,500.00, while Lusaka Province had the highest volumes of milk at the price of ZMK
2,000.00, hence the price buffering effect.
5.4 Contribution of Smallholder Dairy to Rural Socio-economic Development
Smallholder dairying seems to contribute significantly to the socio-economic wellbeing
of the rural poor. Most of the respondents (87.3 percent) depended on dairying as their
main source of income, besides other agricultural activities such as cultivation of cash
crops. This is probably due to the fact that dairying is not seasonal as compared to cash
crops. Ngongoni et al. (2006) is of the view that smallholder dairy farming promotes
regular monetary earnings to people who normally access cash once a season after they
sell their harvested crops i.e. maize, groundnuts, sunflower, cotton, etc. The regular
monthly monetary earnings from the sale of milk and milk products have favorable
effects on the cash flow charts of rural households and assist in improving the lifestyles
of the rural people.
59. The human right to adequate housing is the right of every woman, man, youth and child
to acquire and sustain a secure home and community in which to live in peace and
dignity. The right to housing is codified as a human right in the Universal Declaration of
47
Human Rights of 1948:
Everyone has the right to a standard of living adequate for the health and well-being
of himself and of his family, including food, clothing, housing and medical
care and necessary social services, and the right to security in the event of
unemployment, sickness, disability, widowhood, old age or other lack of livelihood
in circumstances beyond his control. [Article 25(1)]
In this study, 10.2 percent of the smallholder dairy farmers had built decent houses with
clean latrines from income generated from dairying. This development is very
significant as stated in the universal declaration above.
Banking institutions are benefiting from smallholder dairying through provision of loans
and processing of payments for the dairy farmers. Many farmers (35.7 percent) were
receiving their payment for milk sales through bank transfers. Banking is indeed no
longer for the urban people only, as some rural smallholder dairy farmers now have
access to automated teller machines (ATMs).
Most of the smallholder dairy farmers (68.2 percent) used bicycles as the main mode of
transport to deliver milk to the milk collection centre. This is in agreement with the
study by Mutukumira et al. (1996) whose findings indicated that most of the farmers use
a bicycle as the main means of transport in Zimbabwe and indeed many other African
countries.
60. Almost half of the respondents (49 percent) had employed other people to work on the
farms as herdsmen, milkers and in other dairy activities. Estimates by FAO (2010) show
that production of 1 million litres of milk per year on smallholder dairy farms creates
approximately 200 on-farm jobs. Thus smallholder dairying in Zambia plays an
important role in rural poverty reduction, employment opportunities and wealth creation
as well as enhancing household nutrition and food security.
48
61. CHAPTER SIX
CONCLUSIONS AND RECOMMENDATIONS
49
6.1 Conclusions
The results of the study on the cost and returns demonstrate that smallholder dairy
farming is profitable in Zambia. The average price received by the farmer from milk
sales was ZMK 2,002.05 per litre while the average cost of production was at ZMK
828.20 (42.1 percent) per litre resulting in the average returns of ZMK 1,173.85 (57.9
percent) per litre. Findings based on multiple regression analysis indicated that
profitability of smallholder dairy farming is a function of dairy cow herd size and
distance travelled to deliver milk to the market. Findings on socio-economic
contribution of smallholder dairying to rural development demonstrated that smallholder
dairying in Zambia plays an important role in rural poverty reduction, employment
opportunities and wealth creation as well as in enhancing household nutrition and food
security.
6.2. Recommendations
Smallholder dairying in Zambia is profitable and plays an important role in rural poverty
reduction, creation of employment opportunities and wealth, and in enhancing
household nutrition and food security which is in line with the millennium development
goals. Thus the Government of the Republic of Zambia, donors and other service
providers need to allocate more resources towards smallholder dairy development
particularly in the areas of animal breeding, marketing, value addition, infrastructure
62. development and knowledge transfer. It is difficult to source dairy animals in Zambia
and thus there is need to introduce dairy animal breeding centers so that farmers can
easily buy and increase their dairy herd sizes when necessary.
Policy makers and stakeholders should also consider constructing more milk collection
centers near the smallholder dairy farmers in order to reduce the distance travelled to
deliver milk to the market (MCC). This will have a positive effect on milk production in
Zambia as more than half of the milk produced is from the smallholder dairy sector. The
farmers who live far from milk collection centers and walk when delivering milk were
recording less profit than those living in closer proximity. For some farmers, that have to
walk long distances, milk go sour by the time they arrive at milk collection centers, and
such milk is rejected leading to losses by the farmer.
Loans for bicycles need to be provided by stakeholders as it seems to be the major mode
of transport used to deliver milk to milk collection centers as indicated in the results. If
most the farmers delivering milk can be provided with bicycles and the loan be deducted
from the milk delivered over a period of time, the dairy industry can see a major growth
as more farmers can be delivering milk on a daily basis.
50
63. CHAPTER SEVEN
51
REFERENCES
AAEA, 1998. Costs and returns estimation handbook. A report of the American
Agricultural Economics Association (AAEA) Task Force on commodity costs
and returns, pp 566.
Baltenweck, I., Staal, S. J., Owango, M., Muriuki, H., Lukuyu, B., Gichungu, G.
Kenyanjui, M., Njubi, D., Tanner, J. and Thorpe, W., 1998. Intensification of dairying in
the greater Nairobi Milk-Shed: Spatial and household analysis. Paper presented
at the workshop on urban markets and dairy development in sub-Saharan Africa,
Montpellier, France, 9-10 Sept. 1998, pp 10.
Cain, P., Anwar, M. and Rowlinson, P., 2007. Assessing the critical factors affecting the
viability of small-scale dairy farms in the Punjab region of Pakistan to inform
agricultural extension programmes. Agricultural Systems, 94 (2007), 320–330.
Chagunda, M. G. G., Msiska, A. C. M., Wollny, C. B. A., Tchale, H. and Banda, J.W.,
2006. An analysis of smallholder farmers' willingness to adopt dairy performance
recording in Malawi. Livestock Research for Rural Development, 18 (66), 2006.
CSO, 2010. Central Statistical Office 2010 census of population and housing
preliminary report. http://www.zamstats.gov.zm
Dijkhuizen, A. A., Huirne, R. B. M., 1997. Basic method in economic analysis, in:
Animal Health Economics, Principles and Applications, Postgraduate
Foundation in Veterinary Science, Australia, pp 25-40.
EU, 2009. European Union dairy farms economics 2008 Report. Directorate-General
For agriculture and rural development, microeconomic analysis of European
Union Agricultural Holdings, Brussels, pp 77.
64. FAO, 2007. Improved market access and smallholder dairy farmer participation for
sustainable dairy development (CFC/FIGMDP/16FT). Lessons Learned Studies,
Case of Viet Nam, pp 19.
FAO, 2010. Status of and prospects for smallholder milk production: A global
perspective. In Hemme, T. and Otte, T. Rome (editors), pp 12.
Firth, C. and Lennartsson, M. L., 1999. Economics of organic fruit production in the UK
(DEFRA project OF0151), published by HDRA, United Kingdom, pp 1-5.
Firth, C., 2002. UK organic research. Proceedings of the crop organic research
conference at Coventry, UK, March 26-28th, 2002. Powell et al. (editors), pp
285-288.
Fox, P. F. and McSweeney, P. L. H., 1998. Dairy Chemistry and Biochemistry. Plenum
52
Publishers, Ney York, pp 478.
Freebody, P., 2003. Qualitative research in education interaction and practice. Sage
Publications Ltd., London, pp 252.
Gordijn, R.J. and Whitehead, E.N.C., 2005. Dairy business management. Directorate of
Agricultural Economics, Cedara Agricultural Development Institute.
http://agriculture.kzntl.gov.za/portal/AgricPublications/htm
Gujarati, D. N., 2004. Basic econometrics. Fourth edition. McGraw-Hill companies, pp
510-563.
Kaluba, E. M., 1992. Smallholder dairy production in Zambia. Future of livestock
industries in East and Southern Africa. Proceedings of the workshop held at
Kadoma Ranch Hotel, Zimbabwe, July 20-23rd, 1992. Kategile J. A. and Mubi, S
(Editors).
Kamayoyo, K., 2010. Expert bemoans failure to increase milk production. Sunday
Post, November 28th, 2010.
65. Kavoi, M. M., Hoag, D.L. and Pritchett, J., 2010. Measurement of economic Efficiency
for smallholder dairy cattle in the marginal zones of Kenya. Journal of
Development and Agricultural Economics, 2 (4), 122-137.
Maddala, G. S., 1992. Introduction to econometrics. Second edition. Macmillan
53
Publishing Company, pp 126-147.
Mburu, L. M., Gitu, K. W. and Wakhungu J. W., 2007. A cost-benefit analysis of
smallholder dairy cattle enterprises in different agro-ecological zones in Kenya
highlands. Livestock Research for Rural Development, 19 (2), 2007.
Moll Henk, A. J., Staal, S. J. and Ibrahim, M. N. M., 2007. Smallholder dairy
production and markets: A comparison of production systems in Zambia, Kenya
and Sri Lanka. Agricultural Systems, 94 (2007), 593–603.
Mullins, G. R., 1995. Market Policy and Market Development: A comparison of dairy
product consumption in Mombasa, Kenya and Dar-Es-Salaam, Tanzania.
Strategies for market orientation of small scale milk producers and their
organizations. Proceedings of a workshop held at Morogoro Hotel, Morogoro,
Tanzania, March 20-24th, 1995.
Muriuki, H. G., Mwangi, D. M.
and Thorpe, W., 2001. How smallholder dairy Systems
in Kenya contribute to food security and poverty alleviation: Results of recent
collaborative studies. Paper for oral presentation at the 28th Tanzania society of
animal production conference, Morogoro, August 7-9th, 2001, pp 9.
Mutukumira, A. N., Dube, D. M. J., Mupunga, E. G. and Feresu, S. B., 1996.
Smallholder milk production, milk handling and utilization: A case study from
the Nharira/Lancashire farming area, Zimbabwe. Livestock Research for Rural
Development, 8 (1), 1996.
Nchinda, V. P. and Mendi, S. D., 2008. Factors influencing the adoption of yoghurt
technology in the western highlands agro-ecological zone of Cameroon.
Livestock Research for Rural Development, 20 (7), 2008.
66. Neven, D., Katjiuongua, H., Adjosoediro, I., Reardon, T., Chuzu, P., Tembo, G. and
Ndiyoi, M., 2006. Food sector transformation and standards in Zambia: Smallholder
farmer participation and growth in the dairy sector. Staff paper No. 18, pp 30.
Ngongoni, N. T., Mapiye, C., Mwale, M. and Mupeta, B., 2006. Factors affecting milk
production in the smallholder dairy sector of Zimbabwe. Livestock Research for
Rural Development, 18 (5), 2006.
Nimol, F., Ayaburi, S. and Yeboah, R., 2012. Seasonal food shortages and coping
strategies adopted by rural households in Northen Ghana. Journal of
Development and Agricultural Economics, 4 (3), 62-70.
Olubiyo, S. O., Hill, G. P. and Webster, J. P. G., 2009. Econometric analysis of the
impact of agricultural insurance on farming systems in the middle belt, Nigeria.
African Journal of Food Agriculture Nutrition and Development, 2 (6), 13.
Ouma, E. A., Obare, G.A. and Staal, S. J., 2004. The Socio-economic dimensions of
smallholder livestock management in Kenya and its effects on competitiveness
of crop-livestock systems. Paper contributed to the conference on “Integrated
agricultural research for development-achievements, lessons learnt and best
practice” held in Kampala, Uganda on September 1-4th, 2004.
Osotimehin, K. O., Tijani, A. A. and Olukomogbon, E. O., 2006. An economic analysis
of small scale dairy milk processing in Kogi State, Nigeria. Livestock Research
for Rural Development, 18 (11), 2006.
Otieno, D. C. I., Odhiambo, D. M. and Mairura, M. O., 2009. Economics Evaluation of
Relative Profitability in Smallholder Dairy Farms in Western Kenya. Journal of
Development and Agricultural Economics, 1 (2), 49-54.
Pandey, G.S., 2010. Smallholder Dairy Farming Offers Wealth. Tuesday Zambia daily
54
mail. November 16th, pp 8.
67. Pandey, G. S. and Muliokela, S. W., 2006. Smallholder dairy farming: A Tool for
HIV/AIDS mitigation and food in-security: Africa Forum 2006. The dual
epidemics of HIV/AIDS and food insecurity. Held at Pamodzi Hotel, Lusaka,
Zambia on May 9th, 2006, pp 16.
Patton, M., 1990. Qualitative evaluation and research methods. Newbury Park: Sage
55
Publication, pp 244.
Phiri, G. B. M., 1995. Trends in milk marketing for small scale producers in Zambia.
Ministry of Agriculture, Lusaka, Zambia. Strategies for market orientation of
small scale milk producers and their organizations. Proceedings of a workshop
held at Morogoro Hotel, Tanzania, March 20-24th, 1995.
Sasaa, O. S., 1996. Policy reforms and structural adjustment in Zambia: The case of
Agriculture and Trade. Institute for African Studies, University of Zambia,
Technical paper No. 35, pp 56.
Saha, A., Garcia, O. and Hemme, T., 2004. The economics of milk production in
Odrissa, India with particular emphasis on small scale producers. Pro-Poor
Livestock Policy Initiative (PPLPI). International Farm Comparison Network, pp
62.
Schmidt, G. H., Van Vleck, L. D. And Hutjens, M. F., 1988. Principles of dairy science.
Second edition, Prentice Hall Inc., pp 1-18.
Silverman, D., 2000. Doing qualitative research: A practical handbook. First edition,
Sage Publications Ltd., London, pp 292-316.
Staal, S. J., Waithaka, M., Njoroge, L., Mwangi, D. M., Njubi, D., and Wokabi, A.,
2003. Costs of milk production in Kenya: Estimates from Kiambu, Nakuru and
Nyandarua Districts. Smallholder dairy project report No.1, pp 30.
68. Thorpe, W., Muriuki, H. G., Omore, A., Owango, M. O. and Staal, S., 2000.
Development of smallholder dairying in Eastern Africa with particular reference
to Kenya. Paper prepared for the DANIDA-ENRECA project review workshop
at Bronte Hotel, Harare, Zimbabwe, January 10-13th, 2000, pp 10.
Thrusfield, M., 1986. Veterinary Epidemiology. Second edition. Blackwell Science Ltd.,
56
London, pp 159-164.
UDHR, 1948. United Nations Universal Declaration of Human Rights report. The
human right to adequate housing is the right of every woman, man, youth and
child. www.un.org/events/humanrights/2007/hrphotos/declaration%20_engpdf
Weiss, C., 1998. Evaluation: Methods for studying programmes and policies. New
Jersey, Prentice Hall, pp 260.
Zweifel, P., Breyer, F. R. and Kifmann, M., 2009. Health Economics. Second edition.
Springer Dordrecht Heidelberg, New York, London, pp 17-71.
69. CHAPTER EIGHT
57
APPENDICES
8.1 Appendix I: Questionnaire used in Data Collection
Section 1: General Information of the Farm
Name of Farm/ Owner …………………………Herd Size………Dairy…………..
Beef……….No. Females……………No. Males………………..Farm size………..
No. Milking Cows……Sex……Age…….Marital status……Household size………….
Education:………...Province………………District:……………Area/Village…………
Section 2: Cost of Feeding
1. Besides grazing, do you supplement the animals?
(a) Yes. [ ]
(b) No (if no, go to section 3). [ ]
2. If the answer to question (1) is yes, what do you supplement them with?
(a) Hay. [ ]
(b) Silage. [ ]
(c) Molasses / Urea. [ ]
(d) Maize bran / wheat bran. [ ]
(e) Cakes (soya, sunflower, e.t.c.) [ ]
(f) Maize Stover. [ ]
(g) DCP and salt. [ ]
(h) We grow our own [ ]
70. (i) All above. [ ]
(j) Others. Specify…………………………………………………………
3. Approximately how many kilograms of the feed in question (2) do you give each
58
cow per day?
(a) Roughage………………………………………………….
(b) Concentrates………………………………………………
4. Approximately how much money do you spend on feed per month?
(Roughage and Concentrates)………………………………
Section 3: Cost of Labour
5. Other than family members, do you have workers to herd, milk and transport milk?
(a) Yes. [ ]
(b) No (if no go to section 4). [ ]
6. If the answer to question (5) is yes, how many workers do you have?
(a) 1 worker. [ ]
(b) 2 workers. [ ]
(c) 3 workers. [ ]
(d) Over 4 workers. [ ]
(e) Others. Specify……………………………………………………….
7. How much do you pay each worker per month?...............................................
8. Approximately how much money do you spend on workers salaries per month?
……………………………………………
71. 9. Do you also pay them something in kind like maize, vegetables, milk?
(a) Yes. [ ]
(b) No [ ]
10. If the answer to question 9 is yes, how much is the value of the items (in kwacha)
you give them per month?.................................................................
59
Section 4: Milk Production and Sales
11. Do you keep milk production records for your farm (kindly check the records if yes).
(a) Yes. [ ]
(b) No. [ ]
12. On average, how many litters does each cow produce per day?
(a) Dry season……………………………………
(b) Wet season…………………………………….
13. What is your total milk production per day?
(a) Dry season……………………………………..
(b) Wet season…………………………………….
14. Do you sell the milk?
(a) Yes. [ ]
(b) No (if no, go to question 16). [ ]
15. If the answer to question (14) is yes, how many litters of your milk do you sell?
(a) Dry season………………
(b) Wet season………………
16. How many litters of your milk do you give to calves per day?................................
72. 17. How many litters of your milk do you consume per day?........................................
60
18. Where do you sell your milk?
(a) To the local community. [ ]
(b) To milk collection centers (MCC) cooperative. [ ]
(c) All above. [ ]
(d) Others.Specify……………………………………………………………..
19. How much do you sell per litter?...............................................................................
20. Approximately how much money do you make from milk per month……………..
Section 5: Cost of Farm Management Practices (Veterinary Costs)
Deworming
21. How often do you deworm your milking cows?
(a) Once per year. [ ]
(b) Twice per year. [ ]
(c) Thrice per year. [ ]
(d) Others. Specify………………………………………………..
22. What dewormers do you use?
(a) Levamisole. [ ]
(b) Albendazole. [ ]
(c) Ivemectin. [ ]
(d) Others. Explain……………………………………………………….
23. Who deworms them?
(a) Myself. [ ]
73. (b) My workers. [ ]
(c) Veterinary assistants. [ ]
(d) GART technician [ ]
(e) Private vets. [ ]
(f) Others. Explain……………………………………………………….
24. Approximately how much money do you pay the veterinarians for deworming per
animal?...........................................................................................
25. Approximately how much money do you spend on deworming per year?
……………………………………………………………….
61
Vaccination
26. How often do you vaccinate your animals?................................................
27. How much money do you spend on vaccinations per animal /
year?..................................
Dipping
28. How often do you dip/spray your animals?
(a) Dry season…………………………(b) Rainy season……………………
29. What acaricides (dips) do you use?………………………………………..
30. How much money do you spend on dipping animals per year?..................................
Other expenses
31. How much money do you spend on the following per month,
74. (a) Detergent paste (soap),Soap for washing hands, Teat dip medicine, Teat
dip cups and milking cream per month…………………………….
(b) Medicines for mastitis and other diseases (treatment) per
62
year……………………
(c) Cost of Artificial insemination if
any………………………………………………
Transport
32. What mode of transport do you use to transport milk to MCC?
(a) Walking [ ]
(b) Bicycle [ ]
(c) Ox cart [ ]
(d) Motor [ ]
(e) Others. Specify……………………………………..
33. How far is your place to the MCC?
(a) Less than 1 km [ ]
(b) 1-5 km [ ]
(c) 5-10 km [ ]
(d) 10-20 km [ ]
(e) Over 20 km [ ]
34. What type of a container do you use to deliver milk to MCC?
(a) Plastic [ ]
(b) Stainless steel cane [ ]