1. Map Purpose
Ben Levin
Development within the Minneapolis Metro area is being spurred at high rates, especially along Portland
Avenue coinciding with the new U.S. bank stadium development. The stadium as well as other multi
story developments are slated to bring economic vitality into the city but pose a problem for bird
populations, especially those that are non-native migratory species using the Mississippi as a free way for
migration. In light of this issue which has found resistance with groups such as the local Audubon bird
safe advocate group, I will analyze land development in the downtown Minneapolis Metro area suitable
and intrusive to bird fly ways and local bird populations. To do this I will use data related to zoning, since
some of the most intrusive land use practices for birds can be gleaned through the allotted planning area
these zones will occupy. Looking at areas that are conducive to bird protection including the Eloise
Butterfly and Bird Sanctuary, Thomas Sadler Bird Sanctuary as well as ecological corridors and regional
park land. I will show the amount of bird refuge areas intersected by zoning and buffering other intrusive
land development areas as a product of acres. This analysis can give a fuller picture of land that should be
further protected a land that has become possibly jeopardized due to its proximity to human
based activities.
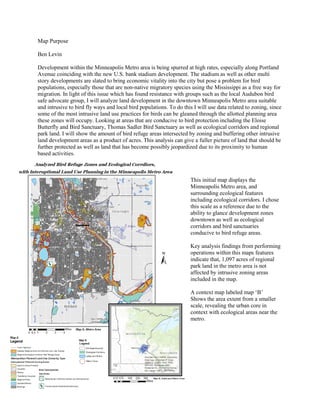
This nitial map displays the
Minneapolis Metro area, and
surrounding ecological features
including ecological corridors. I chose
this scale as a reference due to the
ability to glance development zones
downtown as well as ecological
corridors and bird sanctuaries
conducive to bird refuge areas.
Key nalysis findings from performing
operations within this maps features
indicate that, 1,097 acres of regional
park land in the metro area is not
affected by intrusive zoning areas
included in the map.
A context map labeled map ‘B’
Shows the area extent from a smaller
scale, revealing the urban core in
context with ecological areas near the
metro.
2. This secondary map shows the
fly way areas including the
Atlantic and Mississippi that
migrational birds use to traverse
the state from a smaller scale
perspective. Planned urban
development boundaries indicate
possible interaction between
current and prospective urban
development and fly way zones.
Migrational water fowl species
show correlative areas where
bird wildlife traverses in relation
to other layers.
Map Outputs/ Conclusion
Using a mix of buffering and intersects, most of the regional park land coinciding with the Mississippi
river, is in tight proximity to the intrusive zoning types analyzed, including Industrial and Rail Ways.
North and south of the Metro core is where this land use intrusion dissolves, with Columbia Heights to
the north and the Minnesota Valley National Wildlife refuge to the south west. Overall, 1,097 acres of
regional park land in the metro area is not affected by intrusive zoning areas. Looking at the downtown
core there is a tight pattern of development near the river’s edge especially along the Portland avenue area
that could serve to exacerbate further bird collision issues. There are currently no state wide standards for
bird safe glass utilization. In conclusion, special attention to creating Rail and specified industrial zones
along all Mississippi river developments should be a top priory for the city and state.
Better connection from
the existing corridor regions, sanctuaries and refuge areas should be utilized through careful
implementation of urban parks and building features that deter bird deaths and foster movement through
the corridor unimpeded.
3. Possible Improvements
To improve upon my maps there could be a few things done differently. Figuring out additional
meaningful data layers including building areas that used non bird safe glass and the annual amounts or
seasonal bird traffic in those areas could have been done. Also showing another context map of the
Portland venue areas could have been helpful since that is where most of the new concerned
development is happening. Doing a few more operations including intersects with the fly ways areas and
planned urban development might have been useful.
Over all I thought the maps were a good initial look at the issue beyond what I have seen in this format so
far.
All Maps Data Sources:
Name Source Extension Type
1) Metro Lakes and Rivers / MetroGISData finder/ Water Features / Met
Council//http://www.datafinder.org/catalog/ Polygon Shape file.
2) Metro Regional Parks / MetroGISData finder /Recreation / Met Council
/http://www.datafinder.org/catalog/ Polygon Shape file.
3) Metro Building Footprints / ArcGIS Online / City of Minneapolis Public Works
Dpt./http://www.arcgis.com/home/item.html?id=babd32ae17cc4ee1829496dbdceff4ee/ Polygon
Shape file.
4) Planned Land Use Zones / MetroGIS Data finder / Met
Council//http://www.datafinder.org/catalog/ Shape file.
5) Hennepin County Roads / MN Dot/http://www.dot.state.mn.us/maps/gdma/gis-data.html/ Line
shape file.
6) Trunk Highways / MN Dot/http://www.dot.state.mn.us/maps/gdma/gis-data.html/ Line shape
file.
7) Conservation Corridors / MN Geo Spatial Commons / Environment / DNR /
https://gisdata.mn.gov/dataset/env-conservation-corridors/Polygon Shape File.
8) Migratory Water Fowl, Feeding and Resting Areas / MN Geo Spatial Commons/ Bio
data/DNR/ https://gisdata.mn.gov/dataset/env-migratory-waterfowl-areas/ Polygon Shape file.
9) Land Use Planning Areas through 2030/ MN Geo Spatial Commons/ Planning/ Met
Council/https://gisdata.mn.gov/dataset/us-mn-state-metc-plan-frmwrk2030dev-plan-ar2011/
Polygon Shape file.
10) State Boundary/ MN Dot/ http://www.dot.state.mn.us/maps/gdma/gis-data.html/ Line
boundary Shape File