❤Personal Whatsapp Number 8617697112 Samba Call Girls 💦✅.
ENT 2 PROJECT 1
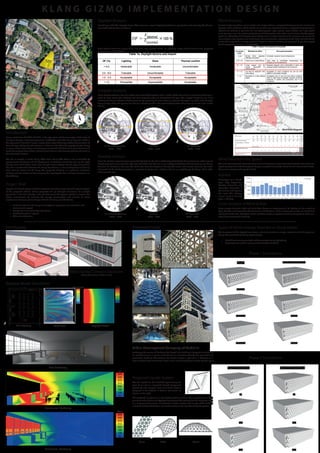
1. Phase 1 Simulations
Depth
50mm
100mm
200mm
Base Rendering
Plan Drawing Daylight FactorWind Flow
Illuminance Rendering
Luminance Rendering
70:30
50:50
30:70
5°
15°
25°
5°
15°
25°
Void to Solid Ratio
Top Tilt Overhang
Plane Tube Dome
South Tilt Overhang
Phase 2 Simulations
Precedent StudySite Massing
Baseline Model Simulation
West-Facing Culinary Classroom
Room Dimension: 12.8m x 11.3m
K L A N G G I Z M O I M P L E M E N T A T I O N D E S I G N
Proposed Facade System
The skin façade for the intended space facing the
west of our site is a trapezoid shaped component
formed by two triangles. Each unit of the block is
designed at the 600mm X 600mm dimension as
shown on the right.
Urban Development Company of Medellin
Embracing the mantra of“building that breath“, the building is designed to be free of
air conditioning as a serious commitment to innovation towards the generation of
sustainable buildings. The external skin façade creates a layer of air in between as a
heat insulation from the thermal heat, as well as shading direct sunlight into the space.
Types of Gizmo Design Selected as Study Model
The framework of the daylight simulation and wind simulation analysis intends to find the optimum
design that meets the following requirements:
Block direct evening sunlight without compromising daylighting
Decelerate the wind to recommended comfort standard
Sunpath Analysis
Using Ecotect software, the sun's paths were simulated together with a model of the site and its surrounding buildings in
order to learn where the shadows and solar exposed areas are throughout the year. The sunpath diagrams also allow
architects to design effective shading devices. By analyzing the two extreme angles for Malaysia's sunpath, with Malaysia
being slightly above the equator line, the sun is further south in the month of December while not as far north in the month
of June.
Shadow Analysis
From the shadow range diagrams generated by Ecotect, the site is sufficiently shaded from the morning sun with a row of
shophouses spanning across the right east side of the site. The site is also slightly shaded from the late evening sun due to
the small hill located on the west side of the site. From the diagrams, during both winter and summer solstices, the north
and south of the building elevation is exposed to direct solar radiation due to no neighboring buildings which offer
shading to the site.
The proposed component is also highly versatile to form more complex forms, from
planes to tubes, dome and hyperbolic paraboloid.The component has long been used
as a language of structure in architecture, further studies and analyze of the shading
and wind comfort of the form can further enhance the use of such façade system.
Introduction
Klang, coordinate of 3°02’N 101°27’E, is the royal town and former capital of the state of
Selangor, Malaysia. Estimated population of 240,000 in the total Klang city and 10,000 in
the city centre in the 2010. It was a capital of the state of Selangor before the formation of
Kuala Lumpur. Today, the town centre is in decline and suffers the tragedy of urban decay
as more modern townships and developments started. Divided into 2 parts of North and
South Klang by the Klang River, with the south known as the heritage district and north as
the commercial district.
The site is located in South Klang, 500m from Klang KTM station and surrounded by
governmental buildings and old shophouses. Landmarks around the site are the Royal
Gallery, Alam Shah Palace, Little India (Tengku Kelana Street) and the Royal Klang Club.
The site is sandwiched between the Klang Courthouse, a row of shophouse and facing
Dato Hamzah Street and SK Klang. The proposed building is a gastromic institution
building and the studies will be analyzing the west façade of a culinary classroom on
the 4th floor. Rainfall
Rainy days are in March,
April, May, September,
October, November and
December. November is
the rainiest and July has
the least. The average
annual amount of rainy
days is 195 days.
Cross Analysis of Wind & Rain
Cross analysis of rainfall table and wind data shows rain frequency will be highest on the month of
April, October and November. The dominant wind direction of the mentioned months are North East
and South South East. Therefore, North and West elevation façades should be designed to deter rain
water from entering the building.
Wind Direction and Speed
The wind rose observed shows the dominant wind direction comes from South South East with wind
speed consistent at 3m/s throughout the year, except for November which has the least wind at 2m/s.
The annual average wind speed is 2m/s.
Daylight Analysis
According to MS1525, Daylight Factor (DF) measures a room’s daylight distribution, penetration and intensity. The DF was
calculated with the formula below:
Wind Analysis
A wind analysis provides a visual model and analysis of how a proposed development will impact user
through wind conditions. Wind studies are particularly important where a proposed development is
adjacent to existing or planned low rise development, open spaces, water bodies and large public
amenity areas. It can be used to study how wind behaves from the urban scale to how a façade system
performs. Effectivity of the façade permeability as well as deterring fast wind is essential to ensure the
user comfort under passive cooling through natural ventilation. According to MS 1525, the table below
shows the ranges of air velocity and their impact on human activities. An optimum range of air speed
for the proposed classroom is highlighted:
Table below shows the ranges of DF and their user comfort levels. An optimum range of DF values for the proposed
classroom is as highlighted:
Project Brief
Proposal of a façade system with the assistance simulation to generate the optimal option
of the proposed scheme. Gizmo proposed will go through simulations for sunlight
penetration and wind velocity in the intended space. The system intends to improve the
indoor environment by lowering the energy consumption and reliance of active
mechanisms through passive design with the following considerations:
Building materials and components (physical properties, characteristics and
environment impact)
Analyze the series of configured options
Identify the optimal options
Other considerations
DF(%)Velocity (m/s)
3
1.5
0
Site
21st
March/September
09:00 - 17:00
21st
June
09:00 - 17:00
21st
December
09:00 - 17:00
Wind Rose Diagram
21st
March/September
09:00 - 17:00
21st
June
09:00 - 17:00
21st
December
09:00 - 17:00
Lux
Cd/m2
NTS
2. Gizmo Optimization
Framework, Analysis & Findings
Optimized Model Simulation
Phase 1 Simulations (Depth & Void:Solid Ratio)
50mm
50mm 100mm 200mm
70:30 50:50 30:70
5° 5°
15° 15°
25° 25°
100mm 200mm
70:30 50:50 30:70
Top
Overhang
5°
Top
Overhang
15°
Top
Overhang
25°
South
Overhang
5°
South
Overhang
15°
South
Overhang
25°
Daylight FactorWind Flow
Base Rendering
Illuminance Rendering
Luminance Rendering
Facade Material Options
The proposed façade scheme is easily manufactured in many material options due
to its simple geometrical form and modular component design. Different types of
material express it own unique aesthetic due to the elegant geometric design
language. The design offers flexibility of materiality and scale to suit any project
scale and building type.The specification can be easily maufactured with materials
such as pre-cast concrete, aluminium, wood and the list goes on.
Clients are able to select the material based on their budget, environmental
conscious or performance of the material.The scheme also allows the performance
of sun shading and natural ventilation to be optimised based on the site condition
and orientation.
DF Analysis: The space is exposed to excessive intolerable lighting,
glare and uncomfortable thermal comfort, with DF value of 8% at the
opening. The line chart analysis shows the optimal daylight factor is
between 4m to 8.5m from the opening.
Wind Analysis: The wind flow is relatively smooth. The 1.5m/s west
wind is reduced to 0.9m/s within the optimum velocity range of
0.5m/s – 1m/s.
Analysis: Intolerable glare, but satisfactory wind speed and flow.
Simulation 1:
Depth
Simulation 2:
Void to Solid Ratio
Optimization 3
Optimization 2
Optimization 1
Phase1Phase2
Simulation 4:
South Overhang
Simulation 3:
Top Overhang
Optimized Gizmo Design
Void to Solid Ratio at 50:50
Depth of 200mm
Top Overhang of 15°
South Overhang of 5°
DF Analysis: The space is exposed to tolerable lighting, glare and
uncomfortable thermal comfort, with DF value of 7.5% at the
opening. The line chart analysis shows the optimal daylight factor
between 3.5m to 8m from the opening.
Wind Analysis: The wind flow is relatively smooth. The 1.5m/s west
wind is reduced to 0.9m/s within the optimum velocity range of
0.5m/s – 1m/s.
Analysis: Tolerable glare, satisfactory wind speed and flow.
DF Analysis: The space is exposed to acceptable lighting, glare
and thermal comfort, with DF value of 7% at the opening. The
line chart analysis shows the optimal daylight factor between 3m
to 7.5m from the opening.
Wind analysis: The wind flow is relatively smooth. The 1.5m/s
west wind is reduced to 0.9m/s within the optimum velocity
range of 0.5m/s – 1m/s.
Analysis: Acceptable glare, satisfactory wind speed and flow.
DF Analysis: The space is exposed to excessive intolerable
lighting, glare and uncomfortable thermal comfort, with DF value
of 8% at the opening. The line chart analysis shows the optimal
daylight factor between 4m to 8.5m from the opening.
Wind Analysis: There is slight wind turbulence. The 1.5m/s west
wind is reduced to 1.2m/s over the optimum velocity range of
0.5m/s – 1m/s.
Analysis: Intolerable glare, unsatisfactory wind flow.
DF Analysis: The space is exposed to tolerable lighting, glare and
uncomfortable thermal comfort, with DF value of 7.5% at the
opening. The line chart analysis shows the optimal daylight factor
between 3.5m to 8m from the opening.
Wind Analysis: The wind flow is relatively smooth. The 1.5m/s
west wind is reduced to 0.9m/s within the optimum velocity range
of 0.5m/s – 1m/s.
Analysis: Tolerable glare, satisfactory wind speed and flow.
DF Analysis: The space is exposed to acceptable lighting, glare
and thermal comfort, with DF value of 7% at the opening. The line
chart analysis shows the optimal daylight factor between 2.5m to
6.5m from the opening.
Wind Analysis: There is excessive wind turbulence. The 1.5m/s
west wind is reduced to 0.3m/s below the optimum velocity range
of 0.5m/s – 1m/s.
Analysis: Acceptable glare, but unsatisfactory wind flow.
Phase 2 Simulations ( Top & South Tilt Degree Overhang)
DF Analysis: The space is exposed to acceptable lighting, glare and
thermal comfort, with DF value of 7% at the opening. The line chart
analysis shows the optimal daylight factor between 2.5m to 7m
from the opening.
Wind Analysis: The wind flow is relatively smooth. The 1.5m/s west
wind is reduced to 0.8m/s within the optimum velocity range of
0.5m/s – 1m/s.
Analysis: Improved tolerable glare, satisfactory wind speed
and flow.
DF Analysis: The space is exposed to acceptable lighting, glare
and thermal comfort, with DF value of 6.5% at the opening. The
line chart analysis shows the optimal daylight factor between
2m to 6.5m from the opening.
Wind Analysis: The wind flow is relatively smooth. The 1.5m/s
west wind is reduced to 0.8m/s within the optimum velocity
range of 0.5m/s – 1m/s.
Analysis: Further improved tolerable glare, satisfactory
wind speed and flow.
DF Analysis: The space is exposed to acceptable glare and thermal
comfort, but the rest of the room is too dimmed due to only perceptible
lighting, with DF value of 6% at the opening. The line chart analysis
shows the optimal daylight factor between 1.5m to 6m from the
opening.
Wind Analysis: The wind flow is relatively smooth. The 1.5m/s west wind
is reduced to 0.8m/s within the optimum velocity range of 0.5m/s – 1m/s.
Analysis: Perceptible daylighting, satisfactory wind speed and flow.
DF Analysis: The space is exposed to acceptable lighting, glare
and thermal comfort, with DF value of 7% at the opening. The
line chart analysis shows the optimal daylight factor between
2.5m to 7m from the opening.
Wind Analysis: The wind flow is relatively smooth. The 1.5m/s
west wind is reduced to 0.8m/s within the optimum velocity
range of 0.5m/s – 1m/s.
Analysis: Improved tolerable glare, satisfactory wind speed
and flow.
DF Analysis: The space is exposed to acceptable glare and thermal
comfort, but the rest of the room is too dimmed due to only
perceptible lighting, with DF value of 6.5% at the opening. The line
chart analysis shows the optimal daylight factor between 2m to 6m
from the opening.
Wind Analysis: There is slight wind turbulence. The 1.5m/s west
wind is reduced to 0.8m/s within the optimum velocity range of
0.5m/s – 1m/s.
Analysis: Perceptible daylighting, unsatisfactory wind flow.
DF Analysis: The space is exposed to acceptable glare and
thermal comfort, but the rest of the room is too dimmed due to
only perceptible lighting, with DF value of 6% at the opening.The
line chart analysis shows the optimal daylight factor between
1.5m to 5m from the opening.
Wind Analysis: There is excessive wind turbulence. The 1.5m/s
west wind is reduced to 0.3m/s below the optimum velocity
range of 0.5m/s – 1m/s.
Analysis: Perceptible daylighting, unsatisfactory wind flow.
Beh Nianzi 0319445
Hooi Wei Xing 0318523
Lee Xiang Loon 0322090
Phua Jing Sern 0314572
Depth of façade will
shade the hot evening
sun and guide wind
direction to minimize
turbulence.
The void to solid ratio
will shade direct
sunlight without
compromising the
daylighting as well as
regulate the air to
comfortable speed.
Top and south
overhangs further shade
the west evening sun as
well as the December’s
sun that is angled to the
South. The overhangs
also act as air scoop to
capture more air into
the interior space
without comprimising
daylighting.
Lux
Cd/m2
DF(%)Velocity (m/s)
3
1.5
0
DF(%)Velocity (m/s)
DF(%)Velocity (m/s)
0 1.5 3.0
0 1.5 3.0