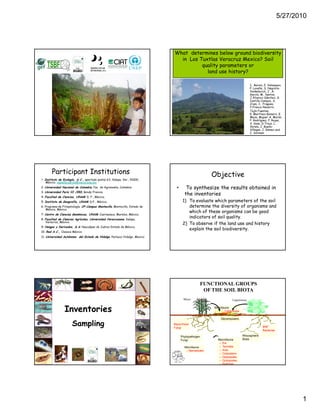
OP02:What determines below ground biodiversity in Los Tuxtlas Veracruz Mexico? Soil quality parameters or land use history?
•
0 likes•240 views

A presentation by Dr. I Barois

Recommended
Recommended
More Related Content
More from CSM _BGBD biodiversity
More from CSM _BGBD biodiversity (20)
Recently uploaded
Recently uploaded (20)
OP02:What determines below ground biodiversity in Los Tuxtlas Veracruz Mexico? Soil quality parameters or land use history?
- 1. 5/27/2010 What determines below ground biodiversity in Los Tuxtlas Veracruz Mexico? Soil quality parameters or land use history? I.. Barois, E. Velasquez, P. Lavelle, S. Negrete- Yankelevich, J. .A. García, M.. Santos, J.Álvarez-Sánchez, G. Castillo-Campos, S. Cram, C.. Fragoso, F.Franco-Navarro, Tajín Fuentes, E. Martínez-Romero, E. Meza, Miguel .A. Morón, P. Rodríguez, P. Rojas, V. Sosa, D.Trejo, L. Varela, J. Bueno- Villegas, J. Gómez and C. Sormani Participant Institutions Objective 1: Instituto de Ecología, A.C., apartado postal 63, Xalapa, Ver., 91000, México. isabelle.barois@inecol.edu.mx 2: Universidad Nacional de Colombia, Fac de Agronomía, Colombia • To synthesize the results obtained in 3: Universidad Paris VI /IRD, Bondy Francia. 4: Facultad de Ciencias, UNAM. D. F., México. the inventories 5: Instituto de Geografía, UNAM. D.F, México. 1) To evaluate which parameters of the soil 6: Programa de Fitopatología CP-Campus Montecillo. Montecillo Estado de Fitopatología. Montecillo, determine the diversity of organisms and México, México. which of these organisms can be good 7: Centro de Ciencias Genómicas, UNAM. Cuernavaca, Morelos, México. 8: Facultad de Ciencias Agrícolas, Universidad Veracruzana. Xalapa, indicators of soil quality. Veracruz, México. 2) To observe if the land use and history 9: Hongos y Derivados, S.A. Naucalpan de Juárez Estado de México. explain the soil biodiversity. 10: Red A.C., Oaxaca México 11: Universidad Autónoma del Estado de Hidalgo, Pachuca Hidalgo, Mexico FUNCTIONAL GROUPS OF THE SOIL BIOTA Maize Leguminous Inventories Mesofauna Acari & Collembola Sampling S li Decomposers Mycorrhizal Fungi BNF Bacterias Phytopathogen Rhizosphere Fungi Macrofauna Biota – Ew Microfauna – Termites Fertility – Nematodes – Ants – Coleoptera Soil – Diplopodes TSBF: 2001 – Quilopodes – Blattidae 1
- 2. 5/27/2010 FOREST Biosphere Reserve of ACAHUAL Fallow/2ndry forest Los Tuxtlas, Veracruz México PASTURE MAIZE N Northern most tropical humid forest of America Biodiversity Hot Spot Chemical (6): pH, Na, K, Mg ,Ca Sampling of BGBD in Los Tuxtlas and PBray. Nov- Dic. 2003 Organic Matter (7): C, N,NH4, NO3, litter and enzymes (Deshy, & Feb-2005 Gluco.) 102points Physical (8): Hum., EC, Clay, Sand, Silt, BD, RD and slope sampled Measured in each point Taxas encontrados en 250 Bacterias Fijadora de Nitrógeno Morfoespecie 200 Especie corrizicos Inventories Acaros Genero axas 150 SubFamilia as No. de Ta Hongos Mic Coleopteros Familia Hormigas Results Diplópodos 100 SuperFamilia Nematodos Lombrices Chilopodo Orden Colembola Termita 50 0 2
- 3. 5/27/2010 Biota Chemistry Physics OM 1) Principal component analysis (PCA) were Macrofauna,Colembolos used to group the sampling points and to HFM, BFN, AntsPCA PCA PCA PCA identify which variables best differentiate Earthworms,Termites Nematodes, Chilopodos the sites or the land uses according to soil Diplopodos,Blattidae GISQ13 quality and to construct the general n n indicator of soil quality (GISQ,Velasquez et SI = Σ(w.v)F1 + Σ(w.v)F2 (1,4) 1 1 al 2007) l 2007). Faunal Chemical Physical OM SI SI SI SI 2) General linear models (GLM) were used to determine whether (and in what percentage) GISQ4 current and historical land uses explain the GISQ = a1.SI Fauna+ b1SI P+ c1SI Ch+ d1SI OM … variability in soil physical, chemical and biological variables. Group 1 Goup2 Group3 Group 4 Group n IndVal Indicator species México México Physical Physical F2(20.3%) 3.8 F2(20.3%) 4 -3 3.8 -3.2 4 Sites -3.3 -3.4 Lopez LM Mateos Land use San Fernando SF Maize M Venustiano VC Acahual A Carranza Pasture P Forest F M LM F1(34.1%) P A 1 1 F1(34.1%) -1 1 -1 1 RD -1 SF RD -1 BD BD VC Limo Silt Sand Sand F Hum% Hum% Clay EC Clay EC Slope Slope P<0.01 P<0.01 México Land use 13 SubIndicators +Gradient of soil quality- Earthworms Land use F2(14.6%) 6.9 -8.5 2.6 México -3.9 F2(16.1%) 4.4 -4.8 3.6 -3.4 Land use Landuse n Indicator value average Maize M Forest 24 0,63 Acahual A Acahual 23 0,50 Pasture P Pasture 23 0,45 Mai z 19 0,36 Forest F 1 -1 1 -1 1 1 Native Sub-OM Sub_Colembolos -1 Phoenicodrilus taste -1 Earthworms Sub_Ants F A F1(20.1%) Sub-chemical Ramiellona sp. 1 F1(17.3%) P P F A M Sub-physical M Sub_Termites Lavellodrilus parvus Dichogaster saliens Sub_Diplopodos Sub_earthworms Kaxdrilus sylvicola Diplotrema sp. 1 Dichogaster bolaui Sub_Nematodes Periscolex brachycistis Dichogaster affinis Pontoscolex corethrurus Exotic Sub-<macrofauna Sub_BNF Earthworms Kaxdrilus parcus Sub_AMF Sub_Chilopodos - Gradient of land use + P<0.01 P<0.01 3
- 4. 5/27/2010 Co Inercia between soil Q indicators and species richness in groups 4 sub I + IGQS F1: 0.26 Fa Ne Ch AM BNF Di F EW N Bl Fi Diplopods Cl F1: 0.67 Coleoptera Lo EW native Ch Te Organic Matter EW E OM IG CO Ho Ants Coleoptera Lopez Mateos 0.73 RV = 0.24; p<0.01 EW exotic High Value of all the Indicators San Fernando 0.65 V. Carranza 0.47 Physical Sub-Indicator Chemical Sub-Indicator 0.73 0 73 0.57 0.23 0.47 0.65 0.34 Phy S-I Phy S-I Chem S-I Lopez Mateos 0.73 Lopez Mateos 0.73 0.57 San Fernando 0.65 San Fernando 0.65 0.34 V. Carranza 0.47 V. Carranza 0.47 0.23 Org. Mat. Sub-Indicator MacroFauna Sub-Indicators 0.67 0 67 0.68 0 68 0.47 0.63 0.45 0.75 Phy S-I Chem S-I OM S-I Phy S-I Chem S-I OM S-I MFau S-I Lopez Mateos 0.73 0.57 0.67 Lopez Mateos 0.73 0.57 0.67 0.68 San Fernando 0.65 0.34 0.45 San Fernando 0.65 0.34 0.45 0.75 V. Carranza 0.47 0.23 0.47 V. Carranza 0.47 0.23 0.47 0.63 4
- 5. 5/27/2010 General Indicator of Soil Quality- 4 General Indicator of Soil Quality-13 0.63 0.64 0.36 0.36 0.49 0.49 Phy S-I Chem S-I OM S-I MFau S-I GI SQ 4 Phy S-I Chem S-I OM S-I MFau S-I GI SQ 4 GI SQ 13 Lopez Mateos 0.73 0.57 0.67 0.68 0.63 Lopez Mateos 0.73 0.57 0.67 0.68 0.63 0.64 San Fernando 0.65 0.34 0.45 0.75 0.49 San Fernando 0.65 0.34 0.45 0.75 0.49 0.49 V. Carranza 0.47 0.23 0.47 0.63 0.36 V. Carranza 0.47 0.23 0.47 0.63 0.36 0.36 ACAHUAL FOREST ACAHUAL FOREST S-I Phy S-I Phy 0.66 0.56 PASTURE MAIZE PASTURE MAIZE S-I Phy S-I Phy 0.58 0.45 FOREST ACAHUAL FOREST ACAHUAL S-I Phy S-I Chem S-I Phy S-I Chem S-I Phy S-I Chem S-I OM S-I Phy S-I Chem S-I OM 0.66 0.64 0.56 0.63 0.66 0.64 0.45 0.56 0.63 0.33 PASTURE MAIZE PASTURE MAIZE S-I Phy S-I Chem S-I Phy S-I Chem S-I Phy S-I Chem S-I OM S-I Phy S-I Chem S-I OM 0.58 0.67 0.45 0.50 0.58 0.67 0.38 0.45 0.50 0.32 5
- 6. 5/27/2010 FOREST ACAHUAL FOREST ACAHUAL S-I Phy S-I Chem S-I OM S-I MF S-I Phy S-I Chem S-I OM S-I MF S-I Phy S-I Chem S-I OM S-I MF GISQ4 S-I Phy S-I Chem S-I OM S-I MF GISQ4 0.66 0.64 0.45 0.68 0.56 0.63 0.33 0.55 0.66 0.64 0.45 0.68 0.63 0.56 0.63 0.33 0.55 0.45 PASTIZAL MAIZ PASTURE MAIZE S-I Phy S-I Chem S-I OM S-I MF S-I Phy S-I Chem S-I OM S-I MF S-I Phy S-I Chem S-I OM S-I MF S-I Phy S-I Chem S-I OM S-I MF GISQ 0.58 0.67 0.38 0.49 0.45 0.50 0.32 0.36 0.58 0.67 0.38 0.49 0.50 0.45 0.50 0.32 0.36 GISQ4 0.36 Whole CONCLUSIONS of the INVENTORIES • Good estimation of the diversity of the • In the Coinertia analysis the BNF and studied groups the Mycorrhizal fungi where more • Loss of diversity with the land use change diverse in the low quality soil and their • High change of species as there are relationship with GISQ is negative significant d ff f differences among sites and d • The variables from the 4 subindicator land use which explain more the patterns are: • A highest diversity at the level of the – The texture and bulk density landscape – The deshydrogenase activity, C and N-total • GISQ-4 is easily applicable and it and NO3. discriminates well group of points, sites and land uses. General Linear Models Simoneta Negrete et al in process 6
- 7. 5/27/2010 GLM Variance partitioning between landscape, current use and land use history • Landscape: differences between ejidos • Current use: Land use categories (Coffee, Forest, MSB, MSB-muc, palm, (Coffee Forest MSB MSB-muc palm pasture, secondary, tree plantation). • Land use history: In the last 70yrs time spent under agriculture, agroforestry and rest. 7
- 8. 5/27/2010 Conclusion • In some tropical landscapes like Los Tuxtlas land use is better described as a combination of current and historical land use characteristics. • Agrarian reforms and post-revolutionary land granting atomised land use and generated a variety of land use histories that should be considered when evaluating land use intensity. Current land use categories are not enough. • There is a cumulative impact of land use on soil biota and fertility at least in a short historical scale (c. 70 years). • Landscape differences remain as de prime explaining factor, for physical and chemical characteristics of the soils, but for BGBD current land use and land use history are more powerful explanations. ¡Gracias! Obrigado! Merci! Thank you! Tera Makasi! Asante Sana! 8