SlideShare a Scribd company logo
1 of 63
All documents are reproduced with the permission of the
copyright owner. Further reproduction or distribution is
prohibited without permission.
Please do not reply directly to this email.
annette tyler sent you the following:
Email 1 of 1
Table of contents
Document 1 of 1
US hotel industry revenue: an ARDL bounds testing approach
Author: Chen, Han1; Chen, Rui2; Shaniel Bernard3; Rahman,
Imran31 Lester E. Kabacoff School of Hotel, Restaurant and
Tourism Administration, University of New Orleans, New
Orleans, Louisiana, USA2 Department of Agricultural
Economics and Rural Sociology, Auburn University, Auburn,
USA3 Department of Nutrition, Dietetics and Hospitality
Management, Auburn University, Auburn, USA
Publication info: International Journal of Contemporary
Hospitality Management ; Bradford Vol. 31, Iss. 4, (2019):
1720-1743.
Abstract:
Purpose
This study aims to develop a parsimonious model to estimate
US aggregate hotel industry revenue using domestic trips,
consumer confidence index, international inbound trips,
personal consumption expenditure and number of hotel rooms as
predictor variables. Additionally, the study applied the model in
six sub-segments of the hotel industry – luxury, upper upscale,
upscale, upper midscale, midscale and economy.
Design/methodology/approach
Using monthly aggregate data from the past 22 years, the study
adopted the auto-regressive distribute lags (ARDL) approach in
developing the estimation model. Unit root analysis and
cointegration test were further utilized. The model showed
significant utility in accurately estimating aggregate hotel
industry and sub-segment revenue.
Findings
All predictor variables except number of rooms showed
significant positive influences on aggregate hotel industry
revenue. Substantial variations were noted regarding estimating
sub-segment revenue. Consumer confidence index positively
affected all sub-segment revenues, except for upper upscale
hotels. Inbound trips by international tourists and personal
consumption expenditure positively influenced revenue for all
sub-segments but economy hotels. Domestic trips by US
residents added significant explanatory power to only upper
upscale, upscale and economy hotel revenue. Number of hotel
rooms only had significant negative effect on luxury and upper
upscale hotel sub-segment revenues.
Practical implications
Hotel operators can make marketing and operating decisions
regarding pricing, inventory allocation and strategic
management based on the revenue estimation models specific to
their segments.
Originality/value
It is the first study that adopted the ARDL bound approach and
analyzed the predictive capacity of macroeconomic variables on
aggregate hotel industry and sub-segment revenue.
Links:
Full text:
1. Introduction
The tourism industry has positioned itself as one of the nation’s
largest employers representing 8.0 per cent of US GDP (World
Travel and Tourism Council (WTTC), 2015). The lodging
industry, being one of its major segments, contributed almost
$600bn to the US GDP and created more than eight million jobs
in different hotel segments (American Hotel and Lodging
Association (AH&LA) American Hotel and Lodging
Association, 2017). In terms of total output, lodging represents
the largest segment in the broader tourism industry, with
travelers spending more than $393bn per year on
accommodations (Select USA, 2016). The lodging industry has
outperformed the US economy over the past five years with
industry revenue growing at an annual rate of 3.7 per cent
reaching $189.5bn in 2015 (AH&LA, 2015). This rapid growth
is driven by an escalating tourism demand, stemming from an
influx of domestic and international leisure and business
travelers. In addition, the growing demand of hotel service is
influenced by the broad economy, where changes in consumer
confidence and consumption expenditures can affect decisions
on entertainment, travel and lodging (Alvarez, 2015). Moreover,
the growth of hotel industry depends on the interplay between
supply and demand (HOSPA, 2013).
There is no doubt that the lodging industry plays an important
role in the US economy. However, it is not easy to plan
strategically based on the macroeconomic environment. In
essence, a three-step process needs to be followed. The first
step is to identify the macroeconomic predictors or the forces of
change that can significantly influence industry revenue. The
second step is to see whether these macroeconomic predictors
can accurately estimate industry revenue using a parsimonious
estimation model. The last step is to test the utility of this
model in various industry sub-segments and explain any ensuing
variations.
Hoteliers need to accurately estimate hotel sales using key
external drivers at both micro and macro levels to carry out
strategic planning and management. At the micro level, sales
estimation is a key tool for managers’ decision-making
involving functional areas such as marketing, sales, finance, and
accounting (Mentzer and Bienstock, 1998). In the hotel
industry, revenue estimation is considered as an indispensable
part of hotels’ marketing and operations especially as it relates
to pricing and inventory management (Talluri and Van Ryzin,
2004). At the macro level, estimating expected growth in
aggregate hotel revenue based on specific economic drivers
helps hotel corporations to make large-scale investment related
decisions on segment-based expansion, mergers and
acquisitions. However, there is very little research that delves
into hotel revenue estimation models at the macro level
(Anderson et al., 2000; Bojanic, 1996). Furthermore, none of
the relevant research studies employed the autoregressive
distributive lag (ARDL) bounds testing procedure, which in the
past had been popularly applied to examine the impact of
macroeconomic factors on economic growth and tourism
demand (Narayan, 2004; Srinivasan et al., 2012). Additionally,
to the best of our knowledge, there is no single study that
undertakes estimation of sub-segment hotel sales using relevant
macroeconomic indicators. It is essential to understand the
different ways in which macroeconomic predictors affect sales
for each sub-segment so that practitioners can carry out more
segment-specific strategic planning.
The purpose of this study, then, is to develop a predictive model
to estimate monthly hotel industry revenue using five
macroeconomic variables – domestic trips by US residents,
consumer confidence index (CCI), inbound trips by non-US
residents, personal consumption expenditure (PCE), and number
of hotel rooms (NOHR). In addition, the model will be tested
across industry sub-segments, which include luxury, upper
upscale, upscale, upper midscale, midscale, and economy hotels.
The study employs the five most relevant and accessible
macroeconomic predictors to develop a working estimation
model that is simple, user-friendly, and efficient. The goal,
therefore, is to develop a parsimonious model with maximum
explanatory power. Theoretically, the study is expected to fill
the gap in current literature by proposing a hotel industry and
sub-segment revenue estimation model using macroeconomic
predictors and the ARDL approach. The estimation model and
comparisons across sub-segments will help various stakeholders
of the hotel industry such as operators, suppliers, investors,
policy-makers, researchers, and various independent
organizations better understand the influential factors in each
sub-segment.
2. Literature review
2.1 Estimation of hotel industry revenue
Estimating hotel industry revenue can address external factors
that influence industry revenue at the micro and macro level. At
the micro level, it is typical to include arrival or booking date,
segment price and duration of use, whereas at the macro level
total demand may influence revenue to a great extent (Lee,
1990). The lodging industry is sensitive to fluctuations in
demand; however, forecasting demand is pertinent due to the
nature of the industry and its operational characteristics
(Yüksel, 2007). Moreover, since estimation differs for transient
and group customers (Yüksel, 2007), it is natural for it to di ffer
across hotel sub-segments. Examining hotel segment
performances in relation to economic factors is relevant since
the results often differ when compared to overall industry
performance (Canter and Maher, 1998). Making a distinction
promotes a better understanding of how the varying demands
across sub-segments relate to economic measures.
Extant literature regarding hotel revenue estimation is still in its
infancy. Little prior research has estimated hotel revenue at the
macro level, with most estimation models directed at the micro
level that utilized techniques such as choice models (Talluri and
Van Ryzin, 2004). Other studies applied several revenue
management techniques to increase operational efficiency in the
hotel sector (Solnet et al., 2016). There are also a handful of
studies that estimated hotel demand in terms of guest arrivals
and occupancy. For instance, Damonte et al. (1998) estimated
hotel demand using a cross sectional sample of 310 properties.
The factors in their analysis were average daily rate (ADR),
number of rooms available, number of employees, food and
beverage revenue and number of tourists attending conferences.
The results indicated that price elasticity of demand varied
across hotel segments. Consequently, Canina and Carvell (2005)
expanded on this study to include consumer confidence index
(CCI), income, expectations of income (corporate income and
disposable personal income), ADR and local market’s ADR to
estimate demand for urban hotels in a metropolitan market. The
results, utilizing data spanning from 1989 to 2000, found all
predictors as significant influencers of lodging demand.
2.2 Hotel segmentation
Hotels are categorized based on several factors including but
not limited to hotel size, location, target markets, levels of
service, number of rooms etc. Prior hotel segmentation studies
in an econometric context have predominantly used micro-
economic variables in their estimation of pricing, growth, and
consumer demand. For example, Falk and Hagsten (2015) used
two stage least absolute deviation estimators to predict growth
and revenue for Swedish hotel establishments. They found that
growth rate of overnight stays was significantly and positively
related to the price segment of the hotel at the beginning of the
same period; however, the relationship became negative as the
price increased indicating that high-end hotels do not have
better growth prospects than hotels in medium price segments.
Similarly, Damonte et al. (1998) indicated that price elasticity
of demand varied across different hotel segments when
estimating hotel demand using ADR, number of rooms
available, and number of tourists.
Luxury hotels were perceived by travelers as experiences, rather
than products (Chu, 2014). Access to more disposable income
may increase the frequency of consumer’s stay in such hotels.
For example, Graf’s (2011) study on 2,824 hotel properties
found that consumers who usually stay in lower class hotel
segments, may switch to higher ones once their income
increases. Tran (2015) estimated the effects of economic factors
on the demand for luxury hotel sub-segment in the USA
between 1998 and 2013. Results of their study indicated that US
residents would extend their length of stay in luxury hotels
when their income rises. German, Chinese, Japanese and Korean
visitors would stay in luxury hotels when their income increases
even if the hotel price goes up.
To the best of our knowledge, there is a lack of research
regarding macroeconomic variables’ influence on the aggregate
US hotel industry and sub-segments revenue, wherein the model
that works for the aggregate hotel industry revenue may not
work for different sub-segments. The study analyzes six sub-
segments of the hotel industry to test the accuracy of the
estimation model. In order to divide the hotels in different
segments, the nomenclature used by Smith Travel Research
(2014) (STR) was followed. STR positions hotels in classes
based on their historical ADR, not on subjective criteria such as
features or amenities. Both chain and independent hotels use the
same ADR categorization.
2.3 Identifying predictors
Previous research shows the impact of economic predictors on
the lodging industry (Choi, 2003; Zarnowitz, 1992). Given the
paucity of research in hotel industry revenue estimation in the
extant hospitality literature, the current study selected variables
suggested by Canina and Carvell (2005), Chen et al. (2007) and
Alvarez (2015), which include domestic trips by US residents,
consumer confidence index (CCI), inbound trips by non-US
residents, personal consumption expenditure (PCE), and number
of hotel rooms (NOHR) in the industry.
2.3.1 Domestic trips by US residents.
Domestic tourists are defined as individuals taking overnight
trips or longer away from the place of their residence
(International Union of Official Travel Organizations, 1974).
Consistent with Alvarez (2015), the current study measures
domestic trips of US residents by the number of domestic
flights within the USA for both leisure and business travel.
Domestic trips by US residents increased from 660.9 million in
2006 to 682.1 million in 2015 (Alvarez, 2015), exhibiting an
increasing trend that might explain the variation of the US hotel
industry revenue in the same period. Close to 80 per cent of
domestic trips were taken by leisure travelers in 2016 (USA
Travel Association, 2016), who are known to be price sensitive
and less willing to pay for a higher room rate (Masiero et al.,
2015).
Witt and Witt (1995) chose domestic and international trips to
forecast tourism demand and both variables added significant
explanatory power in their study. These findings underscore the
importance of the number of domestic trips in predicting hotel
industry revenue. Economic growth leads to the increase in
number of air passengers and business activities – hence more
domestic business and leisure travel (Chi and Baek, 2013). As
the number of domestic trips increases, more people will be
staying in hotels increasing hotel revenue. Thus, domestic trips
by US residents can be a significant predictor of US hotel
revenue. H1.
The number of domestic trips made by US residents has a
significant positive influence on aggregate hotel industry
revenue; and revenues for all six sub-segments.
2.3.2 Consumer confidence index.
Consumer confidence refers to the degree of optimism
consumers feel about the state of the economy and their
personal finances, which guides their decisions on spending and
saving. Consumer confidence is measured by two indices – The
Conference Board’s Consumer Confidence Index (CCI) and
University of Michigan’s Index of Consumer Sentiment (ICS).
Vuchelen (2004) contended that consumer sentiment is an
efficient variable to use for forecasters to avoid some errors,
since many economic and financial variables can significantly
influence the consumer sentiment. Since both CCI and ICS
essentially measures consumer confidence but with a different
methodology, it is safe to use either one in estimation models.
In this study, CCI is used to predict US hotel revenue. The
US CCI is calculated by The Conference Board using a monthly
survey. The monthly survey includes questions related to
consumers’ household finances, employment, income, business
conditions and economic outlook (The Conference Board,
2011). CCI has a good forecasting power for consumer spending
as it influences individual expectations and consumption
preferences. High consumer confidence can decrease
uncertainty in the future, thereby reducing precautionary
savings and increasing present consumption (Ludvigson, 2004).
In addition, an increase in consumer confidence can boost
future income and wealth expectations (Ludvigson, 2004).
Thus, CCI can influence the real economy by increasing
consumer expenditure on entertainment, travel, lodging, etc.
Hence, higher CCI results in direct future consumption growth.
Prior research provides empirical evidence that CCI increases
labor income (Carroll et al., 1994), which eventually translates
into more expenditure. Singal (2012) also demonstrated
that CCI can explain a significant part of variation in consumer
expenditure on hotel industry. In hindsight, CCI can influence
the real economy by increasing or decreasing consumer
expenditure. Increased expenditure on lodging related services
would increase hotel revenue. Thus, the following hypothesis i s
proposed: H2.
CCI has a significant positive influence on aggregate hotel
industry revenue; and revenues for all six sub-segments.
2.3.3 Inbound trips by non-US residents.
International tourists are defined as “tourists who stay at least
one night in a country where they are not residents”, where a
resident is “a person who has lived for most of the past year in a
country” (Eilat and Einav, 2004, p. 1319). The study measures
inbound trips of non-US residents by the number of
international arrivals to the USA for both leisure and business
purposes. The number of international visitors to the USA is
found in three US and international government sources: the
USA Department of Homeland Security/USA Customs and
Border Protection I-94 arrivals program data, Statistics
Canada’s International Travel Survey and Banco de Mexico
travel data (National Travel and Tourism Office, 2016).
International visitors have significant influence on the US hotel
industry (Tran, 2015). USA received the largest share of world
tourism (14.2 per cent) in year 2014 (AH&LA, 2015). The
international visitor arrivals and their lengths of stay can
influence the demand for hotel rooms. Each international visitor
stayed an average of 18 nights in the USA (USA Travel
Association, 2015). Proceeds from international visitor arrivals
in the USA accounts for as much as 20 per cent of US hotel
revenue (AH&LA, 2015). The top five countries with the most
international visitor arrivals are Canada, Mexico, UK, Japan and
China (National Travel and Tourism Office, 2015). The variable
international visitor arrivals has received overwhelming
attention in the tourism literature especially in estimating
tourism demand, with the vast majority of these studies testing
the utility of various estimation models specific to a
country/region (Kraipornsak, 2011; Peng et al., 2015; Yang et
al., 2010).
Travelers’ demographic characteristics matter in international
trips. Income, exchange rates, and transportation costs are the
three critical factors affecting international tourism demand
(Lim, 1997). Access to financial resources positively influence
tourist demand and travel frequency (Davies and Mangan,
1992). The general assumption is that as peoples’ disposable
income increases, so will their tendency to engage in lei sure
travel, extend their length of stay in a destination and spend
more in travel related services (Alegre et al., 2011). In essence,
wealthy families are known to engage in international travel,
whereas families in lower income brackets tend to travel
domestically (Fang Bao and McKercher, 2008). Previous studies
show that most international tourists are considered as affluent
travelers, indicating that income in their country of origin is the
most important explanatory variable in generating those trips
(Crouch, 1995; Lim, 1997). Overseas travelers spend almost
$4,400 during their visit to the USA (USA Travel Association,
2015). As more international tourists arrive in the USA, demand
for hotel rooms and other lodging-related services goes up,
contributing directly to hotel sales. Therefore, a significant
positive relationship between inbound trips by non-US residents
and lodging industry and its sub-segment revenue is
expected. H3.
Inbound trips by non-US residents have a significant positive
influence on aggregate hotel industry revenue; and revenues for
all six sub-segments.
2.2.4 Personal consumption expenditure.
Personal consumption expenditures (PCE), “measures the goods
and services purchased by persons – that is, by households and
by nonprofit institutions serving households which are residents
in the USA” (Bureau of Economic Analysis, 2014, p. 5-2).
Consumer spending on goods and services in the US economy is
measured primarily by the PCE, which accounts for
approximately two-thirds of domestic spending (Bureau of
Economic Analysis, 2014). PCE is known as the primary driver
of future economic growth. It implies how much of the
household income is spent on current consumption as opposed
to being saved for future consumption.
Households engaging in more consumption outside (e.g. dining
out and shopping) will “directly lead to more activities and
travel consistent with the behavioral paradigm that travel
demand is a derived demand” (Ferdous et al., 2010, p.1).
Therefore, PCE is a good indicator of US consumer spending,
which can be used to estimate tourism demand (Chen et al.,
2007). As discussed above, the more the tourism demand, the
higher is the expenditure on lodging and related service. In a
hotel context, as perceived value of the product or service
increases, consumers’ intention to purchase grows (Ashton et
al., 2010), which contributes to hotel revenue growth. Similarly,
Corgel et al. (2012) suggested that the increase of income
generates higher demand for higher priced hotel segments such
as luxury and upper upscale hotels than for lower priced ones
such as midscale and economy hotels. Hence, a significant
positive relationship between PCE and US hotel industry and
sub-segment revenue is expected. H4.
PCE has a significant positive influence on aggregate hotel
industry revenue; and revenues for all six sub-segments.
2.2.5 Number of hotel rooms.
Number of hotel rooms (NOHR) variable measures the number
of available hotel rooms in the aggregate hotel industry.
Similarly, NOHR in each sub-segment is used in the estimation
of its corresponding hotel sub-segment revenue. The increases
of available hotel rooms in the industry will lead to more supply
in the industry, increasing competition, and resulting in lower
ADR for some sub-segments. Hotel revenue is the result of both
ADR and number of rooms sold, which is the demand from the
consumers’ side. The growth of hotel revenue depends on the
price elasticity of demand (Canina and Carvell, 2005). Price
elasticity is defined as the per cent change in demand divided
by the per cent change in price, which measures the degree to
which demand is sensitive to changes in price (Corgel et al.,
2012; Trans, 2011). If the demand is price elastic, hotel revenue
may increase if room rates reduce. On the other hand, if the
demand is price inelastic, hotel revenue will reduce as room
rates fall (Canina and Carvell, 2005). Prior studies
demonstrated that all US hotel sub-segments had inelastic
demand, which showed that the growth in room rate is much
greater than the growth in demand (Hiemstra and Ismail, 1993).
Tran (2011, 2015) supported this view by demonstrating that the
price is inelastic in US luxury hotel sub-segment and suggesting
that consumers are not sensitive to price changes. Similarly,
research at the property level also showed that price elasticity
of demand varied across hotel sub-segments with higher priced
hotels having lower price elasticity than lower priced hotels
(Canina and Carvell, 2005). Hence, the increase of hotel supply
will result in reduced ADR, which further results in increased
demand, leading to a reduced level of hotel industry revenue
(price inelasticity).
Therefore, the study proposes the following hypotheses: H5.
NOHR has a significant negative influence on aggregate hotel
industry revenue; NOHR for each sub-segment has a significant
negative influence on sub-segment revenues.
3. Methodology
Monthly data from January 1996 to September 2017 were
collected from a variety of sources. Monthly aggregate hotel
industry and sub-segment revenue data were collected from
STR. Revenue data for chain hotels and independent hotels as
well as number of hotel rooms in each sub-segment were
included in this dataset. These data were not publicly available
and required subscription to STR. Domestic trips by US
residents’ data were gathered from the Bureau of Transportation
Statistics (2018) website. Consumer confidence index (CCI)
data were compiled from The Conference Board (2018) website.
Inbound trips by non-US residents’ data were collected from the
National Travel and Tourism Office (2018). Seasonally adjusted
personal consumption expenditure (PCE) data were collected
from the Federal Reserve Economic Data (2018) (FRED). All
data sets apart from hotel industry revenue and number of hotel
rooms were publicly available. In addition, all data sets were
not seasonally adjusted except PCE.
Seasonality is a known characteristic of tourist demand, which
also influences accuracy of hotel revenue estimation (Chen et
al., 2015). Therefore, it cannot be overlooked in the modeling
process. Seasonal adjustments of all variables except PCE were
conducted using the X-12-ARIMA program, which is developed
by the US Census Bureau. The X-12-ARIMA procedure makes
adjustment for monthly or quarterly series. It is the primary
method for seasonal adjustment of government and economic
time series in USA, Canada and the EU (Miller and Williams,
2004).
3.1 Model specification and estimation procedure
The current study examines the five macroeconomic predictors’
utility in estimating aggregate US hotel industry revenue. It also
assesses how the causal model works for potentially dissimilar
industry sub-segments. As seen in Table I, the sub-segment
classification followed the nomenclature used by STR. The
auto-regressive distribute lags (ARDL) approach is used via
EViews 10. Unit root analysis is first conducted to confirm that
the data are stationary, i.e. I (0), or non-stationary, i.e. I (1).
Then the cointegration test with the ARDL approach is utilized.
The US hotel revenue is determined by variables that measure
the hotel supply – NOHR and hotel demand – namely, domestic
trips by US residents, CCI, inbound trips by non-US residents
and PCE. US nominal hotel renvenue and PCE have been
deflated by consumer price index to remove the effects of
inflation. Therefore, the determinats of US hotel revenue take
the specification
form: (1) ln⁡Revenuet=α+β ln⁡(⁡DTt)+γ ln⁡(⁡ CCIt)+δln⁡(⁡
IAt)+θ ln⁡(PCEt)+ψ ln⁡(NOHRt)+εtwhere Revenuet denotes
the aggregate US hotel industry revenue and sub-segment
revenues for luxury, upper upscale, upscale, upper midscale,
midscale and economy in year t. DTt and IAt are defined as
domestic trips by US residents and inbound trips by non-US
residents in year t.
Many empirical studies have proved that most aggregate data
have a unit root (Kwiatkowski et al., 1992). Variables that
contain a unit root were generated by a non-stationary data
process of taking the first difference of the variables, resulting
in spurious regression. When working with time series datasets,
it is important to look for a unit root. If a unit root is found in a
series, it means that more than one trend is present in the series.
Since the data are at the macroeconomic level and time series,
whether all variables are stationary or not are detected to avoid
spurious regression using stationary test. There are different
ways to test whether data is stationary or not, such as Lagrange
multiplier (LM test) (Kwiatkowski et al., 1992), Augmented
Dickey-Fuller (ADF) test (Becketti, 2013; Dickey and Fuller,
1979; Hamilton, 1994) and PP test (Phillips and Perron, 1988).
This paper employed ADF and PP tests to determine a time
series is stationatary or not.
However, the regression specification of differencing could
only provide the short-run estimates not the long-run estimates.
ARDLs are standard least squares regressions which include
lags of both the dependent variable and independent variables as
regressors (Greene, 2008). Although ARDL models (the bound
test approach) have been used in econometrics for decades, they
have gained popularity in recent years as a method of examining
long-run and cointegrating relationships between variables
(Pesaran and Shin, 1998). Therefore, this problem could be
solved by considering the cointegration and the error correction
model (ECM) and obtaining both short- and long-run
information (Nkoro and Uko, 2016). Additionally, ARDL
models could yield consistent estimates of long run relationship,
irrespective of whether the regressors are purely I(0) or I(1) or
a mixture of both.
To examine the long-run relationship between US hotel revenue
and its determinats, the ARDL cointegration procedure is
applied (Pesaran et al., 1996; Pesaran and Shin, 1998). The
model with lower Akaike information criterion (AIC), Schwarz
Bayesian criterion (SBC), Hannan-Quinn Criterion (HQ) and
higher adjusted R2 performs better than the other models.
Lagrange multiplier …
Sheet1Column AColumn BColumn CYearRevenue
$ in MillionsGrowth
%2015138,58202017144,7291.7Average141883.61.46Sum425,6
514.41. exp
In SLP 3, you will use an actual IBISWorld report to prepare an
Excel spreadsheet
and graphs.
For the industry that you selected, you will use the “Industry
Performance” tab.
On the “Industry Performance” tab, scroll down to the bottom of
the page to the
section entitled, Historical Performance Data. Click the small
arrow pointing
downward (located at the top right of the Historical
Performance Data section) and
export the data to Excel. Once you have the Excel spreadsheet
with the data for
“Historical Performance Data”:
1.Highlight the data in column B, then create a Column Chart
illustrating the Revenue
($m) data. For example,
https://my-ibisworld-
com.ezproxy.trident.edu/us/en/industry/48111a/industry-
performance
1. Use the Excel formula to calculate the Average for each
column of
data within the sheet.
2. Add this information to the bottom of each column.
3. Use Excel to calculate the Sum for each column of data
within the
sheet.
4. Add this information below the row of Averages for each
column.
5. Change the name of this Tab to Revenue Growth.
https://my-ibisworld-
com.ezproxy.trident.edu/us/en/industry/48111a/industry-
performance
Column A Column B Column C
Year Revenue
$ in Millions
Growth %
2015 138,582 0.0
2017 144,729 1.7
Average 141883.6 1.46
Sum 425,651 4.4
Industry DataYearIndustry Turnover ($ million)Industry Gross
Product ($ million)Number of Establishments (Units)Number of
Enterprises (Units)Employment (People)Exports ($
million)Imports ($ million)Total Wages ($ million)Domestic
Demand ($ million)International trips by US residents
(Million)200542113.09344.31793.0309.089927.05820.3148.620
0646140.19707.61714.0301.078230.05092.1153.6200750106.21
1558.41721.0322.081137.05311.3159.8200855389.56248.91694.
0300.088352.05342.1160.5200944443.88364.71616.0276.09148
3.05682.5151.2201053925.412112.71506.0265.087840.05712.91
59.7201158890.110895.91519.0261.091616.06215.4166.120125
8785.010477.71465.0253.089913.05934.5173.4201358630.8130
01.11393.0255.090842.06459.7182.1201458374.912742.91405.0
258.085930.06246.7191.2201555421.817925.41404.0256.09925
4.07678.0203.2201650170.016509.81244.0229.099247.08037.22
14.1201749752.215667.51232.0226.0110691.09076.1224.62018
54291.017157.51256.0230.0108599.09720.3236.3201941169.81
5505.51116.0206.091265.08009.2244.4202038577.512443.8106
3.0197.087301.07630.1252.2202139390.412783.81049.0194.088
367.07736.8260.3202240376.413160.61034.0190.089818.07877.
2268.6202341458.713534.61019.0187.091026.08004.1277.2202
442623.213897.61014.0186.092520.08154.2286.5202543856.71
4230.41010.0185.093838.08294.3296.0202645827.514676.6101
0.0184.096017.08523.0305.8
Annual ChangeYearIndustry Turnover (%)Industry Gross
Product (%)Number of Establishments (%)Number of
Enterprises (%)Employment (%)Exports (%)Imports (%)Total
Wages (%)Domestic Demand (%)International trips by US
residents (%)20069.63.9-4.4-2.6-13.0-
12.53.420078.619.10.47.03.74.34.0200810.5-45.9-1.6-
6.88.90.60.42009-19.833.9-4.6-8.03.56.4-5.8201021.344.8-6.8-
4.0-4.00.55.620119.2-10.10.9-1.54.38.84.02012-0.2-3.8-3.6-3.1-
1.9-4.54.42013-0.324.1-4.90.81.08.85.02014-0.4-2.00.91.2-5.4-
3.35.02015-5.140.7-0.1-0.815.522.96.32016-9.5-7.9-11.4-10.6-
0.04.75.42017-0.8-5.1-1.0-1.311.512.94.920189.19.51.91.8-
1.97.15.22019-24.2-9.6-11.2-10.4-16.0-17.63.42020-6.3-19.8-
4.8-4.4-4.4-4.73.220212.12.7-1.3-1.51.21.43.220222.52.9-1.4-
2.11.61.83.220232.72.8-1.5-1.61.31.63.220242.82.7-0.5-
0.51.61.93.420252.92.4-0.4-0.51.41.73.320264.53.10.0-
0.62.32.83.3
Key RatiosYearIVA/Revenue (%)Imports/Demand
(%)Exports/Revenue (%)Revenue per Employee
($'000)Wages/Revenue (%)Employees per estab.Average Wage
($)200522.2468.313.850.264722.5200621.0589.811.045.665091.
4200723.1617.610.647.165460.9200811.3626.99.652.260463.82
00918.8485.812.856.662115.4201022.5613.910.658.365037.620
1118.5642.810.660.367841.9201217.8653.810.161.466002.7201
322.2645.411.065.271109.2201421.8679.310.761.272695.22015
32.3558.413.970.777357.1201632.9505.516.079.880981.820173
1.5449.518.289.881994.9201831.6499.917.986.589506.3201937
.7451.119.581.887757.6202032.3441.919.882.187399.9202132.
5445.819.684.287553.0202232.6449.519.586.987701.8202332.6
455.519.389.387932.0202432.6460.719.191.288134.5202532.44
67.418.992.988389.6202632.0477.318.695.188765.5
Key External DriversYearInbound trips by non-US
residentsInternational trips by US residentsWorld price of crude
oilCorporate profitPer capita disposable
income20125.54.40.98.32.620137.05.0-0.9-1.1-2.020145.25.0-
7.53.53.320153.26.3-47.2-3.83.42016-1.85.4-15.7-
3.41.120171.04.923.3-2.12.320183.35.429.41.03.42019-0.61.6-
10.2-2.62.42020-22.1-20.7-32.70.21.9202127.622.726.9-
0.31.720222.32.41.9-
0.21.720232.32.32.00.21.720242.22.31.80.61.820252.22.31.90.7
1.9
Industry Financial RatiosRatioApr 09-Mar 10Apr 10-Mar 11Apr
11-Mar 12Apr 12-Mar 13Apr 13-Mar 14Apr 14-Mar 15Apr 15-
Mar 16Apr 16-Mar 17Apr 17-Mar 18Apr 18-Mar 19Small
(<$10m)Medium ($10-$50m)Large (>$50m)Current
Ratio1.31.21.31.41.51.41.01.61.91.52.10.9Quick
Ratio0.90.80.91.11.11.00.81.01.40.82.00.6Sales / Receivables
(Trade Receivables
Turnover)12.111.316.114.612.012.911.112.99.818.217.221.1Da
ys' Receivables30.232.322.725.030.428.332.928.337.2Cost of
Sales / Inventory (Inventory
Turnover)41.3150.840.940.429.4167.771.837.560.843.1999.914.
7Days' Inventory8.82.48.99.012.42.25.19.76.0Cost of Sales /
Payables (Payables
Turnover)13.612.816.418.216.714.511.914.312.517.821.711.5D
ays' Payables26.828.522.320.121.925.230.725.529.2Sales /
Working Capital21.540.927.627.315.521.7-
303.216.511.722.16.5-62.9Earnings Before Interest & Taxes
(EBIT) / Interest3.43.35.26.16.44.83.26.54.63.42.9Net Profit +
Dep., Depletion, Amort. / Current Maturities LT
Debt2.62.94.03.5Fixed Assets / Net
Worth1.31.51.41.31.21.51.61.01.31.61.25.0Debt / Net
Worth2.32.51.72.11.32.13.82.22.41.81.55.2Tangible Net
Worth26.329.422.522.128.424.911.732.931.427.935.615.1Profit
before Taxes / Net Worth,
%18.823.523.432.824.228.620.628.124.527.526.925.2Profit
before Taxes / Total Assets,
%4.74.86.09.010.35.74.58.97.97.910.87.1Sales / Net Fixed
Assets7.04.86.07.16.12.83.93.05.54.46.43.7Sales / Total Assets
(Asset Turnover)2.02.12.72.61.91.81.71.82.02.02.02.0Cash
from Trading34.430.728.734.940.147.536.135.434.446.3Cash
after Operations7.75.25.85.39.09.32.46.711.811.412.9Net Cash
after Operations7.24.95.76.311.210.03.08.011.17.513.0Cash
after Debt Amortization1.92.11.72.72.73.71.23.23.50.73.6Debt
Service P&I Coverage2.42.32.71.92.13.91.73.61.31.7Interest
Coverage (Operating Cash)6.56.55.79.06.710.52.79.35.84.6Cash
&
Equivalents11.69.79.715.613.513.414.611.316.017.029.67.8Tra
de Receivables
(net)22.726.022.822.925.720.619.617.918.113.812.814.3Invento
ry6.86.98.16.911.76.56.67.46.05.63.88.1All Other Current
Assets3.62.53.83.93.44.83.62.54.43.12.73.8Total Current
Assets44.745.244.449.254.345.344.439.144.539.648.834.0Fixed
Assets
(net)37.440.842.738.036.444.538.141.837.042.635.747.2Intangi
bles (net)4.91.94.03.84.83.77.15.99.29.67.013.6All Other Non-
Current Assets12.912.28.98.94.56.510.413.29.28.38.55.3Total
Assets100.0100.0100.0100.0100.0100.0100.0100.0100.0100.010
0.0100.0Total Assets
($m)1325.51148.81365.6603.8596.0781.21527.21244.51638.114
21.543.5164.31213.7Notes Payable-Short
Term6.06.28.25.16.85.28.94.41.83.13.23.6Current Maturities
L/T/D4.03.84.12.62.72.95.13.03.74.12.95.6Trade
Payables15.316.613.918.313.720.618.39.912.49.36.612.9Income
Taxes Payable0.10.10.22.00.10.00.10.30.51.00.30.6All Other
Current
Liabilities11.816.116.115.217.012.213.29.09.811.79.815.0Total
Current
Liabilities37.242.942.443.240.340.845.626.728.129.122.837.8L
ong Term
Debt22.519.924.822.220.523.525.330.328.026.122.231.2Deferre
d Taxes1.01.31.72.61.32.21.60.20.30.40.30.4All Other Non-
Current Liabilities8.14.64.66.14.64.98.74.13.06.812.12.0Net
Worth31.231.326.525.933.228.618.838.840.637.542.628.7Total
Liabilities & Net Worth
($m)1325.51148.81365.6603.8596.0781.21527.21244.51638.114
21.543.5164.31213.7Maximum No. of Statements
Used53.049.046.034.033.038.043.034.035.035.014.07.014.0
Industry StructureLevelTrendLife CycleMatureRevenue
VolatilityHighCapital IntensityIndustry
AssistanceHighSteadyConcentration LevelHighRegulation
LevelHeavySteadyTechnology ChangeHighBarriers to
EntryHighSteadyIndustry
GlobalizationHighIncreasingCompetition LevelHighIncreasing
Major PlayersNameMarket ShareAmerican Airlines Group
Inc.36.90Delta Air33.30UAH32.10
Products & ServicesNameRevenue%Revenue $mPassenger
transportation72.027,775.80Cargo
transportation13.65,246.54Fees5.52,121.76Other8.93,433.40
Major MarketsNameRevenue%Revenue
$mAtlantic39.715315.27Latin
America31.312074.76Pacific22.18525.63Other6.92661.85
Industry Life CycleIndustryChange in Share of Economy
(%)DVD, Game & Video Rental in US-14.91-13.50Solar Panel
Manufacturing in US-12.70-13.29Tobacco Growing in US-9.83-
12.19Record Stores in US-8.02-9.82Computer Stores in US-
7.47-6.75Database & Directory Publishing in US-7.39-
7.70Book, Magazine & Newspaper Wholesaling in US-5.72-
7.97Office Supply Stores in US-5.51-9.20Movie & Video
Distribution in US-5.32-4.92Coal Mining in US-5.32-
5.12Camera Stores in US-5.13-6.02Apparel Knitting Mills in
US-4.95-5.09For-Profit Universities in US-4.71-2.46Postal
Service in US-4.65-6.19Chicken Egg Production in US-4.25-
8.27Vending Machine Operators in US-4.05-2.62Magazine &
Periodical Publishing in US-3.82-6.96Wood Pulp Mills in US-
3.78-1.29Paper Wholesaling in US-3.77-7.09Wired
Telecommunications Carriers in US-3.75-4.81Industrial Banks
in US-3.71-2.04Ink Manufacturing in US-3.50-6.85International
Airlines in US-3.24-3.98Department Stores in US-3.21-8.56Art
& Office Supply Manufacturing in US-3.18-5.04Office
Stationery Manufacturing in US-3.16-4.39Printing Services in
US-3.09-6.60Quick Printing in US-3.03-4.69Commodity
Dealing and Brokerage in US-3.02-4.36Shoe Stores in US-3.02-
1.89News Syndicates in US-2.99-2.65Nonferrous Metal
Refining in US-2.82-2.49Recordable Media Manufacturing in
US-2.80-6.72Savings Banks & Thrifts in US-2.76-2.52Office
Stationery Wholesaling in US-2.72-3.41Paper Product
Manufacturing in US-2.57-2.65Cattle & Hog Wholesaling in
US-2.47-3.72Jewelry Stores in US-2.44-5.06Formal Wear &
Costume Rental in US-2.40-2.56Wind Turbine Manufacturing in
US-2.40-9.00Florists in US-2.37-4.22Consumer Electronics
Stores in US-2.35-3.35Book Stores in US-2.35-3.78Greeting
Cards & Other Publishing in US-2.33-7.17Computer Peripheral
Manufacturing in US-2.33-3.14Wholesale Trade Agents and
Brokers in US-2.29-1.92Direct Mail Advertising in US-2.25-
2.71Camera & Film Wholesaling in US-2.24-2.90Women’s,
Girls’ and Infants’ Apparel Manufacturing in US-2.12-
4.95Concrete Pipe & Block Manufacturing in US-2.08-1.54Gift
Shops & Card Stores in US-2.04-2.19Dry Cleaners in US-1.86-
3.12Shoe Repair in US-1.83-2.65Toy, Doll & Game
Manufacturing in US-1.75-1.73Leather Tanning & Finishing in
US-1.70-0.86Debt Collection Agencies in US-1.65-
0.55Newspaper Publishing in US-1.64-6.37Electronic &
Computer Repair Services in US-1.56-2.20Fuel Dealers in US-
1.50-3.20Plant & Flower Growing in US-1.46-0.58Radio
Broadcasting in US-1.41-0.64Piece Goods, Notions & Other
Apparel Wholesaling in US-1.41-3.81Automobile Electronics
Manufacturing in US-1.38-3.27Automobile Brakes
Manufacturing in US-1.36-2.18Car & Automobile
Manufacturing in US-1.36-4.77Coated & Laminated Paper
Manufacturing in US-1.35-3.37Business Certification & IT
Schools in US-1.34-1.71Mail Order in US-1.32-2.28Computer &
Printer Leasing in US-1.32-6.34Farm Product Storage &
Warehousing in US-1.30-3.05Blind & Shade Manufacturing in
US-1.29-1.48Jewelry Manufacturing in US-1.23-
3.16Communication Equipment Manufacturing in US-1.19-
2.84Printing in US-1.16-3.52Cement Manufacturing in US-1.15-
0.79Loan Administration, Check Cashing & Other Services in
US-1.12-1.33Frozen Food Wholesaling in US-1.11-0.89Dye &
Pigment Manufacturing in US-1.11-1.84Paper Bag & Disposable
Plastic Product Wholesaling in US-1.11-0.52Ferrous Metal
Foundry Products in US-1.08-1.46Men's Clothing Stores in US-
1.05-4.27Hog & Pig Farming in US-1.04-2.48Electrical
Equipment Manufacturing in US-1.03-1.37Metal Can &
Container Manufacturing in US-1.03-2.32Domestic Airlines in
US-1.03-1.50Bowling Centers in US-1.00-1.30VoIP in US-0.97-
2.78Day Care in US-0.97-0.55Telecommunication Networking
Equipment Manufacturing in US-0.94-1.89Egg & Poultry
Wholesaling in US-0.94-4.92Orange & Citrus Groves in US-
0.91-0.66Hand Tool & Cutlery Manufacturing in US-0.89-
2.47Meat Markets in US-0.84-2.20Beef Cattle Production in
US-0.83-5.04Bottled Water Production in US-0.82-1.53Cable
Providers in US-0.80-3.43Millwork in US-0.78-0.84Satellite TV
Providers in US-0.75-4.13Plastic Products Miscellaneous
Manufacturing in US-0.74-1.44Circuit Board & Electronic
Component Manufacturing in US-0.74-0.94Automobile Engine
& Parts Manufacturing in US-0.73-3.10Small Specialty Retail
Stores in US-0.71-2.58TV & Appliance Wholesaling in US-
0.70-1.85Inland Water Transportation in US-0.69-1.72Flower &
Nursery Stock Wholesaling in US-0.69-1.70Jewelry & Watch
Wholesaling in US-0.68-0.47Hay & Crop Farming in US-0.67-
2.16Gold & Silver Ore Mining in US-0.67-0.61Paper Mills in
US-0.65-5.23Lumber & Building Material Stores in US-0.65-
0.67Carpet Mills in US-0.65-0.53Metalworking Machinery
Manufacturing in US-0.62-0.91Metal Stamping & Forging in
US-0.62-1.08Toy & Craft Supplies Wholesaling in US-0.60-
2.03Woodworking Machinery Manufacturing in US-0.60-
1.02Beef & Pork Wholesaling in US-0.60-3.45Sugarcane
Harvesting in US-0.59-3.74Oilseed Farming in US-0.59-
0.37Home Furnishings Stores in US-0.58-0.95Musical
Instrument & Supplies Stores in US-0.57-2.50SUV & Light
Truck Manufacturing in US-0.57-0.69Textile Mills in US-0.55-
2.73Janitorial Equipment Supply Wholesaling in US-0.53-
1.85Marinas in US-0.51-0.69Metal Plating & Treating in US-
0.50-0.50Auto Parts Manufacturing in US-0.49-1.63Community
Colleges in US-0.49-1.82Cut and Sew Manufacturers in US-
0.47-3.90Children's & Infants' Clothing Stores in US-0.47-
4.26Horse & Other Equine Production in US-0.46-1.69Engine &
Turbine Manufacturing in US-0.46-1.64Business Service
Centers in US-0.44-1.01Tire Manufacturing in US-0.44-
1.70Geophysical Services in US-0.44-3.20Wire & Spring
Manufacturing in US-0.43-0.64Hardware Manufacturing in US-
0.43-2.35Weight Loss Services in US-0.42-3.38Motorcycle,
Bike & Parts Manufacturing in US-0.41-3.03Wheat, Barley &
Sorghum Farming in US-0.40-2.44Motorcycle Dealership and
Repair in US-0.39-1.08Document Preparation Services in US-
0.36-2.78Fabric, Craft & Sewing Supplies Stores in US-0.36-
6.72Book Publishing in US-0.35-2.38Photofinishing in US-
0.34-4.19Sporting Goods Stores in US-0.32-1.52Copper, Nickel,
Lead & Zinc Mining in US-0.31-0.69Lighting Fixtures
Manufacturing in US-0.27-0.74Job Training & Career
Counseling in US-0.25-2.24Golf Courses & Country Clubs in
US-0.25-1.06Logging in US-0.25-1.45Specialty Food Stores in
US-0.24-0.95Dairy Wholesaling in US-0.23-1.65Ocean &
Coastal Transportation in US-0.23-0.52Nonferrous Metal
Foundry Products Manufacturing in US-0.23-2.02Industrial
Laundry & Linen Supply in US-0.22-1.00Nuclear Power in US-
0.20-1.54Homeowners' Associations in US-0.19-1.84Medical
Instrument & Supply Manufacturing in US-0.18-1.28Ceramics
Manufacturing in US-0.15-2.63Lighting & Bulb Manufacturing
in US-0.13-3.67Civic, Social & Youth Organizations in US-
0.12-1.20Canned Fruit & Vegetable Processing in US-0.12-
2.61Bars & Nightclubs in US-0.10-0.59Electric Power
Transmission in US-0.10-0.47Appliance Repair in US-0.09-
1.43Machinery Maintenance & Heavy Equipment Repair
Services in US-0.08-1.33Employment & Recruiting Agencies in
US-0.08-0.61Agribusiness in US-0.05-1.40Rubber Product
Manufacturing in US-0.05-1.55Heating & Air Conditioning
Equipment Manufacturing in US-0.05-1.24Chemical Product
Manufacturing in US-0.04-2.14Navigational Instrument
Manufacturing in US-0.04-1.04Machine Shop Services in US-
0.03-0.72New Car Dealers in US-0.02-2.17Juice Production in
US0.07-2.50Auto Parts Wholesaling in US0.08-1.06Soybean
Farming in US0.09-4.33Gasoline & Petroleum Bulk Stations in
US0.11-1.80Furniture Repair & Reupholstery in US0.11-
1.77Automobile Metal Stamping in US0.12-2.25Pump &
Compressor Manufacturing in US0.12-2.38Laundromats in
US0.13-1.09Fish & Seafood Wholesaling in US0.13-0.56Glasses
& Contact Lens Manufacturing in US0.16-1.33Hobby & Toy
Stores in US0.17-1.00Chemical Wholesaling in US0.17-
0.64Refrigeration Equipment Wholesaling in US0.18-
0.65Mineral & Phosphate Mining in US0.21-2.97Media Buying
Agencies in US0.22-1.29Computer Manufacturing in US0.23-
1.07Inorganic Chemical Manufacturing in US0.23-3.93Paint
Wholesaling in US0.24-1.77Dairy Product Production in
US0.27-1.95Community Housing & Homeless Shelters in
US0.28-1.74Furniture Stores in US0.28-0.77Public Schools in
US0.28-0.68Bridge & Elevated Highway Construction in
US0.29-0.65Fruit & Vegetable Markets in US0.30-
0.76Commercial Leasing in US0.32-0.79HR Consulting in
US0.32-1.41Cabinet & Vanity Manufacturing in US0.34-
0.53Chicken & Turkey Meat Production in US0.35-2.24Glass
Product Manufacturing in US0.38-0.57Fruit & Vegetable
Wholesaling in US0.38-1.08Confectionery Wholesaling in
US0.38-1.89Plastic Film, Sheet & Bag Manufacturing in
US0.39-0.70Women's Clothing Stores in US0.39-6.16Cookie,
Cracker & Pasta Production in US0.41-2.94Orphanages &
Group Homes in US0.41-2.00Mining, Oil & Gas Machinery
Manufacturing in US0.42-2.26Corn, Wheat & Soybean
Wholesaling in US0.42-2.80Public Transportation in US0.45-
0.52Supermarkets & Grocery Stores in US0.46-0.38Beer
Wholesaling in US0.47-0.40Auto Parts Stores in US0.48-
1.38Footwear Wholesaling in US0.48-5.11Law Firms in
US0.48-0.95Dry Docks & Cargo Inspection Services in US0.49-
2.34Vegetable Farming in US0.50-1.47Steel Rolling & Drawing
in US0.51-0.88Religious Organizations in US0.51-
0.92Automobile Wholesaling in US0.53-1.69National & State
Parks in US0.53-1.07Gym & Exercise Equipment Manufacturing
in US0.56-0.41Automobile Interior Manufacturing in US0.57-
1.16Home Builders in US0.59-1.09Chiropractors in US0.60-
0.36Automobile Transmission Manufacturing in US0.60-
1.44Forest Support Services in US0.61-0.78ATV, Golf Cart &
Snowmobile Manufacturing in US0.62-2.07Sanitary Paper
Product Manufacturing in US0.62-1.92Computer & Packaged
Software Wholesaling in US0.63-3.03Frozen Food Production in
US0.63-0.79Hosiery Mills in US0.68-3.01Media Representative
Firms in US0.71-0.86Aluminum Manufacturing in US0.71-
1.21Valve Manufacturing in US0.72-0.65Paperboard Mills in
US0.72-1.52Truck Rental in US0.73-0.48Billboard & Sign
Manufacturing in US0.73-1.02Electronic Part & Equipment
Wholesaling in US0.74-1.47Shoe & Footwear Manufacturing in
US0.81-1.13Celebrity & Sports Agents in US0.82-0.79Tractors
& Agricultural Machinery Manufacturing in US0.82-2.02Soft
Drink, Baked Goods & Other Grocery Wholesaling in US0.83-
1.51Leather Good & Luggage Manufacturing in US0.84-
0.61Athletic & Sporting Goods Manufacturing in US0.87-
0.80Pesticide Manufacturing in US0.89-2.79Women's &
Children's Apparel Wholesaling in US0.89-1.50Ice Cream
Production in US0.92-0.56Household Furniture Manufacturing
in US0.94-1.31Rail Transportation in US0.95-0.46Construction
Machinery Manufacturing in US0.98-1.42Plastic Bottle
Manufacturing in US0.99-1.94Automobile Steering &
Suspension Manufacturing in US1.04-1.18Sugar Processing in
US1.11-0.64Chocolate Production in US1.13-0.90Crop Services
in US1.15-1.62Apartment Rental in US1.17-1.78Paint
Manufacturing in US1.19-2.18Lotteries & Native American
Casinos in US1.19-1.05Scientific & Economic Consulting in
US1.22-0.50Environmental Consulting in US1.23-
0.76Community Food Services in US1.27-0.53Blood & Organ
Banks in US1.27-1.38Single Location Full-Service Restaurants
in US1.28-0.38Hunting & Trapping in US1.29-0.76Soap &
Cleaning Compound Manufacturing in US1.31-1.20Drug,
Cosmetic & Toiletry Wholesaling in US1.31-0.63Maids,
Nannies & Gardeners in US1.35-0.42Asphalt Manufacturing in
US1.35-0.85Abrasive & Sandpaper Manufacturing in US1.40-
0.83Farm, Lawn & Garden Equipment Wholesaling in US1.44-
0.67Office Furniture Manufacturing in US1.46-0.73Coal &
Natural Gas Power in US1.47-1.72Soda Production in US1.48-
2.85Securities Brokering in US1.48-1.21Medical Device
Manufacturing in US1.53-1.64Boiler & Heat Exchanger
Manufacturing in US1.53-1.48Oil & Gas Field Services in
US1.55-1.70Promotional Products in US1.55-0.98Direct Selling
Companies in US1.56-1.48Fertilizer Manufacturing in US1.56-
1.91Copper Rolling, Drawing & Extruding in US1.58-
2.59Primary Care Doctors in US1.58-0.48Petroleum Refining in
US1.60-1.89Gypsum Product Manufacturing in US1.61-
1.28Men's & Boys' Apparel Manufacturing in US1.67-
0.75Train, Subway & Transit Car Manufacturing in US1.82-
0.89Storage & Warehouse Leasing in US1.82-0.91Photography
in US1.83-0.82Wireless Telecommunications Carriers in
US1.85-1.49Animal Food Production in US1.86-2.28Cigarette &
Tobacco Products Wholesaling in US1.87-4.39Syrup &
Flavoring Production in US1.88-5.34Water Supply & Irrigation
Systems in US1.89-1.40Psychiatric Hospitals in US1.92-
0.93Furniture Wholesaling in US1.93-0.47Moving Services in
US1.94-0.92Tank & Refrigeration Trucking in US1.98-
0.44Casino Hotels in US2.01-0.90Copier & Office Equipment
Wholesaling in US2.03-2.68Bread Production in US2.05-
0.87Open-End Investment Funds in US2.09-0.57Metal Tank
Manufacturing in US2.10-0.95Specialized Storage &
Warehousing in US2.11-0.42Swimming Pool Construction in
US2.11-0.55Family Clothing Stores in US2.12-1.49Audio
Production Studios in US2.15-0.81Tourism in US2.16-
0.65Screw, Nut & Bolt Manufacturing in US2.20-0.49Timber
Services in US2.20-1.14Hotels & Motels in US2.21-
0.48Seafood Preparation in US2.27-1.08Health Stores in
US2.28-1.47Synthetic Fiber Manufacturing in US2.29-
0.41Racing & Individual Sports in US2.32-3.09Industrial
Equipment Rental & Leasing in US2.40-1.02Vitamin &
Supplement Manufacturing in US2.56-1.12Pharmacies & Drug
Stores in US2.58-0.40Language Instruction in US2.62-
2.39Wedding Services in US2.64-1.94Petrochemical
Manufacturing in US2.84-2.04Intellectual Property Licensing in
US2.84-1.75Human Resources & Benefits Administration in
US3.05-0.57Snack Food Production in US3.14-2.96Advertising
Agencies in US3.23-0.80Flour Milling in US3.27-1.95Cosmetic
& Beauty Products Manufacturing in US3.36-2.38Steam & Air-
Conditioning Supply in US3.61-1.45Rail Maintenance Services
in US3.73-0.79Tugboat & Shipping Navigational Services in
US3.80-0.55Cereal Production in US3.95-1.83Reinsurance
Carriers in US4.11-6.23Sheep Farming in US4.30-0.91Coffee
Production in US5.12-2.58Dairy Farms in US-4.481.36Coal &
Ore Wholesaling in US-3.692.96Corn Farming in US-2.13-
0.30Land Development in US-1.65-0.00Satellite
Telecommunications Providers in US-1.583.57Credit Card
Issuing in US-1.421.30Gas Stations in US-1.361.03Fish &
Seafood Aquaculture in US-1.310.58Life Insurance & Annuities
in US-1.230.31Grocery Wholesaling in US-1.090.12Commercial
Banking in US-0.931.57Carpet Cleaning in US-0.920.24Tool &
Hardware Wholesaling in US-0.900.74Heavy Engineering
Construction in US-0.83-0.14Recyclable Material Wholesaling
in US-0.764.56Alarm, Horn & Traffic Control Equipment
Manufacturing in US-0.640.17Telecommunications Resellers in
US-0.571.32Clay Brick & Product Manufacturing in US-
0.540.91Iron Ore Mining in US-0.413.02Art Dealers in US-
0.370.73Plastics & Rubber Machinery Manufacturing in US-
0.350.88Plastic Pipe & Parts Manufacturing in US-
0.310.57Gasoline & Petroleum Wholesaling in US-
0.231.79Movie Theaters in US-0.231.06Historic Sites in US-
0.230.77Plastics Wholesaling in US-0.220.16Stone Mining in
US-0.200.30Cable Networks in US-0.044.40Mattress
Manufacturing in US-0.02-0.33Wiring Device Manufacturing in
US-0.020.01Packaging & Labeling Services in US-0.011.34Wire
& Cable Manufacturing in US0.03-0.15Oil Change Services in
US0.04-0.02Nursery & Garden Stores in US0.060.08Gas
Stations with Convenience Stores in US0.060.24Stone, Concrete
& Clay Wholesaling in US0.090.07Used Car Parts Wholesaling
in US0.093.44Meat, Beef & Poultry Processing in US0.10-
0.35Recreational Vehicle Dealers in US0.161.25Metal
Wholesaling in US0.162.79Sawmills & Wood Production in
US0.180.60Tire Dealers in US0.20-0.13Printing, Paper, Food,
Textile & Other Machinery Manufacturing in US0.22-0.16Real
Estate Appraisal in US0.230.64Wood Paneling Manufacturing in
US0.240.67Fish & Seafood Markets in US0.24-0.16Precast
Concrete Manufacturing in US0.24-0.22Costume & Team
Uniform Manufacturing in US0.25-0.20Restaurant & Hotel
Equipment Wholesaling in US0.270.26Eye Glasses & Contact
Lens Stores in US0.320.30Conveyancing Services in
US0.320.19Semiconductor & Circuit Manufacturing in
US0.330.35Copier & Optical Machinery Manufacturing in
US0.341.15Stock & Commodity Exchanges in
US0.353.28Laminated Plastics Manufacturing in
US0.370.57Water & Sewer Line Construction in
US0.380.22Boat Building in US0.42-0.14Wood Pallets & Skids
Production in US0.42-0.30Podiatrists in US0.430.39Accounting
Services in US0.440.05Semiconductor Machinery
Manufacturing in US0.440.73Urethane Foam Manufacturing in
US0.460.26Margarine & Cooking Oil Processing in US0.47-
0.13Loan Brokers in US0.490.58Hardware Stores in
US0.500.91Excavation Contractors in US0.510.63Cemetery
Services in US0.51-0.23Cardboard Box & Container
Manufacturing in US0.522.65Fishing in US0.541.29Lumber
Wholesaling in US0.550.38Public School Bus Services in
US0.550.52Funeral Homes in US0.560.38Commercial Building
Construction in US0.581.40Parking Lots & Garages in
US0.590.63Forklift & Conveyor Manufacturing in
US0.650.20Trade & Technical Schools in US0.65-0.16Audio &
Video Equipment Manufacturing in US0.660.96Ski &
Snowboard Resorts in US0.680.75Surveying & Mapping
Services in US0.680.59Nonferrous Metal Rolling & Alloying in
US0.690.15Laboratory Supply Wholesaling in
US0.690.14Campgrounds & RV Parks in US0.690.69Heating &
Air Conditioning Wholesaling in US0.701.25Adhesive
Manufacturing in US0.74-0.19Major Household Appliance
Manufacturing in US0.741.28Billboard & Outdoor Advertising
in US0.74-0.29Insurance Brokers & Agencies in US0.75-
0.29Prefabricated Home Manufacturing in
US0.753.05Warehouse Clubs & Supercenters in US0.75-
0.09Market Research in US0.760.62Road & Highway
Construction in US0.78-0.26Aircraft Maintenance, Repair &
Overhaul in US0.780.55Home Improvement Stores in
US0.780.91Auto Leasing, Loans & Sales Financing in
US0.790.29Masonry in US0.800.18Security Services in
US0.841.02Retirement & Pension Plans in
US0.8437.20Electrical Equipment Wholesaling in
US0.860.31Print Advertising Distribution in US0.861.92Floor
…
WWW.IBISWORLD.COM International Airlines in the US
September 2019 1
IBISWorld Industry Report 48111a
International Airlines in the US
September 2019 Qing Zheng
Prepare for takeoff: Rising disposable income will
fuel increased passenger travel, boosting revenue
2 About this Industry
2 Industry Definition
2 Main Activities
2 Similar Industries
3 Additional Resources
4 Industry at a Glance
5 Industry Performance
5 Executive Summary
5 Key External Drivers
7 Current Performance
9 Industry Outlook
11 Industry Life Cycle
13 Products and Markets
13 Supply Chain
13 Products and Services
14 Demand Determinants
15 Major Markets
16 International Trade
17 Business Locations
19 Competitive Landscape
19 Market Share Concentration
19 Key Success Factors
19 Cost Structure Benchmarks
21 Basis of Competition
22 Barriers to Entry
23 Industry Globalization
24 Major Companies
24 United Continental Holdings Inc.
25 American Airlines Group Inc.
26 Delta Air Lines Inc.
27 JetBlue Airways Corporation
28 Operating Conditions
28 Capital Intensity
29 Technology and Systems
29 Revenue Volatility
30 Regulation and Policy
31 Industry Assistance
33 Key Statistics
33 Industry Data
33 Annual Change
33 Key Ratios
34 Industry Financial Ratios
35 Jargon & Glossary
www.ibisworld.com | 1-800-330-3772 | [email protected]
WWW.IBISWORLD.COM International Airlines in the US
September 2019 2
The International Airlines industry
provides air transportation to passengers
and cargo over regular routes and
schedules. These services include any
flights that either end or originate
internationally. Scheduled air passenger
carriers, including commuter and
helicopter carriers (except scenic and
sightseeing), are included in this industry.
Airlines that provide international mail
transportation on a contract basis are also
included in this industry.
The primary activities of this industry are
Scheduled international passenger air transport
Scheduled international cargo and freight air transport (except
air couriers)
Scheduled commuter international passenger air transport
Scheduled charter international passenger air transport
33641a Aircraft, Engine & Parts Manufacturing in the US
This industry provides factory conversion, overhaul and
rebuilding of aircraft.
48111b Domestic Airlines in the US
This industry provides air transportation of passengers and
cargo over regular routes and on regular
schedules.
48121 Charter Flights in the US
This industry provides international air transportation of
passengers, cargo or specialty flying services with
no regular routes and regular schedules are classified.
48211 Rail Transportation in the US
The industry comprises companies that operate railroads across
the United States. This includes large
railroads and regional and local line-haul railroads that carry
freight and passengers.
48311 Ocean & Coastal Transportation in the US
This industry provides deep-sea, coastal, Great Lakes and St.
Lawrence Seaway water transportation. The
deep-sea shipping activity includes US-flagged vessels and non-
US-flagged vessels.
48811 Airport Operations in the US
This industry includes businesses that operate international,
national or civil airports or public flying fields.
49222 Couriers & Local Delivery Services in the US
This industry provides international air courier services for the
market.
Industry Definition
Main Activities
Similar Industries
About this Industry
The major products and services in this industry are
Cargo transportation
Fees
Passenger transportation
Other
WWW.IBISWORLD.COM International Airlines in the US
September 2019 3
About this Industry
For additional information on this industry
www.airlines.org
Airlines for America
www.bts.gov
Bureau of Transportation Statistics
www.faa.gov
Federal Aviation Administration
www.census.gov
US Census Bureau
Additional Resources
IBISWorld writes over 1000 US
industry reports, which are updated
up to four times a year. To see all
reports, go to www.ibisworld.com
WWW.IBISWORLD.COM International Airlines in the US
September 2019 4
%
c
ha
ng
e
8
-2
0
2
4
6
2614 16 18 20 22 24Year
Inbound trips by non-US residents
SOURCE: WWW.IBISWORLD.COM
%
c
ha
ng
e
20
-20
-10
0
10
2511 13 15 17 19 21 23Year
Revenue Employment
Revenue vs. employment growth
Products and services segmentation (2019)
72.0%
Passenger transportation
13.6%
Cargo transportation
8.9%
Other
5.5%
Fees
Key Statistics
Snapshot
Industry at a Glance
International Airlines in 2019
Industry Structure Life Cycle Stage Mature
Revenue Volatility Medium
Capital Intensity Medium
Industry Assistance High
Concentration Level High
Regulation Level Heavy
Technology Change High
Barriers to Entry High
Industry Globalization High
Competition Level High
Revenue
$52.9bn
Profit
$4.8bn
Wages
$8.6bn
Businesses
226
Annual Growth 19–24
1.9%
Annual Growth 14–19
-1.7%
Key External Drivers
Inbound trips by
non-US residents
International trips
by US residents
World price of crude oil
Corporate profit
Per capita disposable
income
Market Share
United Continental
Holdings Inc.
31.1%
American Airlines
Group Inc.
25.9%
Delta Air Lines
Inc.
24.1%
p. 24
p. 5
FOR ADDITIONAL STATISTICS AND TIME SERIES SEE
THE APPENDIX ON PAGE 33
SOURCE: WWW.IBISWORLD.COM
WWW.IBISWORLD.COM International Airlines in the US
September 2019 5
Key External Drivers Inbound trips by non-US residents
International tourists account for a
significant portion of passengers on
international flights. Moreover, the
majority of foreign visitors arrive by
plane, and many take US-based
airlines. Consequently, an increase in
the number of foreign travelers visiting
the United States generally leads to
greater demand for industry services.
Inbound trips by non-US residents are
expected to increase in 2019,
representing a potential opportunity for
the industry.
International trips by US residents
US residents seeking to travel
internationally represent an important
source of revenue for the International
Airlines industry. Therefore, an increase
in the number of international trips made
by US residents is expected to generate
significant revenue for industry operators.
The number of international trips by US
residents is expected to increase in 2019.
World price of crude oil
Given that jet fuel is refined from crude oil,
when global crude oil prices decline, jet fuel
Executive Summary The International Airlines industry has
declined over the five years to 2019 despite
rising levels of per capita disposable
income and increased travel activity both
into and out of the United States. In recent
years, mounting competition from foreign
competitors and chronic overcapacity
within the industry’s cargo transportation
segment have forced industry operators to
slash ticket prices and reduce freight
shipping rates, causing industry revenue to
decline. Moreover, substantial declines in
the world price of crude oil led the price of
jet fuel to plummet during the five-year
period, preventing operators from
generating revenue through fuel surcharge
fees. As a result, industry revenue is
anticipated to decrease at an annualized
rate of 1.7% to $52.9 billion over the five
years to 2019, including an expected 1.3%
decrease in 2019 alone.
This industry is dominated by a few
large-scale players; the industry’s four
largest companies are expected to generate
over 80.0% of total industry revenue in
2019. Prior to the five-year period, poor
profitability and increasing competition
forced several airlines out of business,
leading to industry consolidation.
Additionally, American Airlines and US
Airways merged in December 2013,
consolidating as American Airlines Group
Inc. In turn, these major companies have
been able to access significant economies of
scale, investing in new technologies and
ordering larger, more fuel-efficient aircraft
to reduce operating costs. With fuel prices
still below historical levels, industry profit
is also expected to increase during the
current five-year period.
Industry revenue is expected to recover
over the next five years as continued
growth in disposable income, corporate
profit and US travel activities are
anticipated to be bolstered by a substantial
decrease in the price of jet fuel. However,
industry revenue will continue to be
constrained by growing competition from
foreign operators and alternative modes of
transportation. To maintain profitability
despite intense competition, operators’
ability to increase their aircraft’s load
factor, a measure of capacity utilization, is
critical for industry operators. Overall,
industry revenue is forecast to increase at
an annualized rate of 1.9% to $58.1 billion
over the five years to 2024.
Industry Performance
Executive Summary | Key External Drivers | Current
Performance
Industry Outlook | Life Cycle Stage
Industry revenue is expected to recover amid
continued growth in disposable income,
corporate profit and US travel activity
WWW.IBISWORLD.COM International Airlines in the US
September 2019 6
Industry Performance
Key External Drivers
continued
prices tend to decline as well, causing
major airlines to remove fuel surcharges
and reduce ticket prices to remain
competitive. In turn, lower prices limit
industry revenue growth. The world price
of crude oil is forecast to decrease slightly
in 2019; however, the volatile nature of
world oil prices will likely continue to pose
a potential threat to the industry.
Corporate profit
International business travel represents
a significant source of revenue for
industry operators. When corporate
profit is high, companies are more likely
to pay for business travel and travelers
are more likely to purchase first-class
tickets and other high-margin industry
products. Corporate profit is expected to
increase in 2019.
Per capita disposable income
The majority of industry revenue comes
from discretionary consumer spending
on leisure travel. When per capita
disposable income rises, consumers are
able to spend more on vacations and
other nonessential international trips.
Per capita disposable income is expected
to increase in 2019.
%
c
ha
ng
e
7
3
4
5
6
2614 16 18 20 22 24Year
International trips by US residents
SOURCE: WWW.IBISWORLD.COM
%
c
ha
ng
e
8
-2
0
2
4
6
2614 16 18 20 22 24Year
Inbound trips by non-US residents
WWW.IBISWORLD.COM International Airlines in the US
September 2019 7
Industry Performance
Current
Performance
Despite rising levels of airline passenger
traffic and improving US trade activity,
the International Airlines industry has
declined over the past five years. This
industry, which includes US-based
airlines that transport passengers and
cargo internationally, has suffered from
volatile fuel prices, mounting competition
from foreign airlines and global economic
and political uncertainties. Consequently,
industry revenue is estimated to decrease
at an annualized rate of 1.7% to $52.9
billion over the five years to 2019.
%
c
ha
ng
e
10
-10
-5
0
5
2511 13 15 17 19 21 23Year
Industry revenue
SOURCE: WWW.IBISWORLD.COM
Passenger and cargo
traffic
The industry is cyclical and highly
sensitive to economic factors that affect
the number of inbound and outbound
international travelers. Economic
growth, rising consumer spending and
improving corporate profit have driven
demand from both business and leisure
travelers to increase over the past five
years; as a result, the total number of
international trips taken by US
residents grew during the current
five-year period. Moreover, due to
global economic growth and the
expansion of the global middle class,
the number of trips to the United States
by non-US residents is also estimated
to increase. This increase in flights into
and out of the United States has
provided the industry with an
expanding customer base.
However, despite overall expansion,
passenger traffic growth slowed down over
the past five years, and inbound trips
actually declined in 2016. This decline in
inbound traffic was due to slowed
economic growth in emerging markets
and political instability associated with
global trade tensions and conflicts, as well
as the appreciation of the US dollar. In
particular, a strengthening dollar has
made it more expensive for foreign visitors
to travel to the United States. Additionally,
overall freight volume transported by both
cargo-exclusive and passenger airlines has
only recently begun to grow in a
meaningful way.
Fuel prices, capacity
and competition
Diminishing passenger traffic only partially
explains the industry’s revenue declines
over the past five years, especially given the
overall increase in air traffic. Factors such
as fuel prices, capacity and competition are
the other reasons why revenue dropped.
Fuel prices, in particular, had the largest
effect. The purchase of jet fuel represents a
substantial cost for industry operators, and
fuel expenses can range from between
20.0% and 40.0% of an international
airline’s total purchase costs. As a result,
large-scale movements in jet fuel prices can
have a significant effect on airline operating
costs and profit margins. However, when
the price of jet fuel increases, industry
carriers are also able to generate significant
revenue by implementing fuel surcharges
and increasing ticket prices and freight
rates, shifting the burden of rising fuel
WWW.IBISWORLD.COM International Airlines in the US
September 2019 8
Industry Performance
Fuel prices, capacity
and competition
continued
costs to consumers. Nonetheless, when oil
prices plunged during the five-year period,
jet fuel prices followed. Consequently,
airlines were forced to remove fuel
surcharges and reduce prices to remain
competitive, causing substantial revenue
declines in 2015 and 2016.
As fuel prices fluctuated, industry
players also had to deal with increased
competition and capacity. To meet
growing demand and mitigate fuel costs,
airlines have increasingly invested in
new aircraft that burn less fuel, fly
longer distances and transport more
people and cargo. As result, capacity
slightly outgrew demand, reducing
industry load factor (a measure of
capacity utilization of airline services)
from 82.4% to 80.6% in 2016.
Consequently, airline pricing ability was
limited. Moreover, industry players have
had to contend with increased
competition from foreign airlines.
Competitors such as Emirates maintain
substantial fleets of wide-body aircraft,
and many foreign carriers are subsidized
or owned by government bodies,
enabling them to grow relatively quickly
and expand their share of the global
airline market. Meanwhile, the increased
efficiency of aircraft has enabled long-
range budget airlines such as Norwegian
Air to enter the international market. As
a result of greater competition, industry
players have had to lower prices and lose
market share. The introduction of
aircraft with more cargo capacity and
the overall expansion of the global
aircraft fleet has also forced down
freight rates, further pressuring industry
revenue. Nevertheless, a recent increase
in jet fuel prices and the pickup in
passenger and cargo traffic to and from
the United States helped industry
revenue to increase 9.3% in 2018.
Overall, continued intense competition
and volatile fuel prices are expected to
hinder industry growth. In 2019, jet fuel
prices are expected to fall again, leading
to a 1.3% decline in industry revenue.
Industry structure Following a period of significant merger and
acquisition activity on the part of the
industry’s largest players, the industry is
now overwhelmingly dominated by large-
scale operators, such as United Continental
Holdings Inc. and American Airlines Group
Inc. In fact, the industry’s four largest
players are expected to account for over
80.0% of total industry revenue in 2019,
which acts as a significant barrier to entry
for small-scale players attempting to gain
market share in this industry. Moreover,
external pressure on industry airfare and
freight rates has kept the number of
companies entering the industry low and
mostly limited to foreign carriers, which are
not considered part of the US industry.
Consequently, the number of industry
enterprises has decreased at an annualized
rate of 2.6% to 226 companies over the five
years to 2019. Conversely, the pickup in
capacity and slowly rising demand
encouraged operators to hire more staff,
especially after years of stagnant
employment. Therefore, over the five years
to 2019, the number of industry employees
is expected to climb at an annualized rate of
4.7% to 107,862. At the same time, the
average industry profit margin (measured as
earnings before interest and taxes) has
recently improved due to decreasing fuel
costs and increasing industry consolidation.
However, at 9.1% of industry revenue,
average profit is still expected to have grown
over the past five years, rising from 7.5% in
2014, when fuel prices were far higher.
The industry is now
overwhelmingly dominated
by large-scale operators
WWW.IBISWORLD.COM International Airlines in the US
September 2019 9
Industry Performance
Industry
Outlook
Over the five years to 2024, the
International Airlines industry is
expected to gradually expand from recent
setbacks, although it will be contingent
upon sustained growth in US and global
economic conditions and travel activity.
The combination of growing air travel
demand and higher fuel surcharges are
expected to bolster revenue. At the same
time, competition from an array of global
airlines will continue to place downward
pressure on industry ticket prices,
benefiting airline customers while
reducing revenue opportunities for
airline companies. Nevertheless, industry
revenue is forecast to grow at an
annualized rate of 1.9% to $58.1 billion
over the five years to 2024.
Traffic Rising per capita disposable income and
an expanding service portfolio offered by
industry airlines are expected to support
revenue growth moving forward. As the
size of the global middle class increases,
demand for industry services from
foreign consumers is forecast to rise, and
the number of inbound trips by non-US
residents is projected to increase at an
annualized rate of 3.8% over the next five
years. Similarly, as domestic consumer
spending continues to rise, the number of
international trips taken by US residents
is expected to grow as well, increasing at
an annualized rate of 3.2% during the
same period. This growing consumer
demand for air travel into and out of the
United States will likely generate
increased demand for the industry’s
passenger transportation services, while
growing levels of domestic per capita
disposable income will enable greater
numbers of passengers to purchase
first-class seats, extra baggage allowances
and other amenities that most
international airlines offer. Growing
levels of trade are also projected to
increase freight volumes, increasing
demand for industry cargo services.
Furthermore, over the five years to
2019, the world price of crude oil is
anticipated to decrease at a slower rate,
an annualized rate of 0.2%. The recovery
in jet fuel prices will enable airlines to
raise fuel surcharges and thus revenue. In
addition, according to the Federal
Aviation Administration, industry load
factor, which measures industry capacity
utilization, is forecast to reach 81.1% by
2024, an improvement over levels posted
over the past five years. This indicates
that operators will improve their capacity
management, leading to greater demand
per seat and granting operators more
leeway in pricing.
However, operators will continue to
deal with competition from foreign
airlines, many of which continue to
expand their operations, putting pricing
pressure on various routes. Moreover,
industry performance will be exposed to
various global macroeconomic
headwinds. With global trade tensions
anticipated to persist, the rate of
globalization may decrease, with various
trade and travel barriers potentially going
up. Consequently, global air travel may
decline or grow slower, tempering
demand. Moreover, a decrease in
emerging market growth or increased
political uncertainty may further erode
demand for air travel.
Operators will continue to
deal with competition from
foreign airlines
WWW.IBISWORLD.COM International Airlines in the US
September 2019 10
Industry Performance
Improving profit
margins
The combination of increasing demand,
improved load factor and the
introduction of more-efficient aircraft are
forecast to increase average industry
profit, measured as earnings before
interest and taxes, from 9.1% of revenue
in 2019 to 9.7% in 2024. A higher load
factor means that aircraft are fuller,
enabling carriers to spread costs across
more customers and run their operations
more efficiently. At the same time, new
aircraft models are more efficient because
they use less fuel, fly over longer ranges
and can carry more passengers and
cargo. However, compared with the prior
period, rising fuel costs will likely keep
margins under pressure. In addition,
moving forward, the industry’s profit
margins are also expected to be
constrained by the rising costs of capping
and trading greenhouse gas emissions
and competition from foreign airlines.
Limited industry
participation
The combination of high barriers to entry,
domination by incumbents and
competition from foreign airlines will
likely lead to further industry
consolidation. Therefore, over the five
years to 2024, the number of industry
players is projected to fall at an annualized
rate of 0.7% to reach 218. Conversely, the
expansion in demand and capacity will
encourage carriers to hire more staff.
Consequently, the number of industry
employees is anticipated to climb at an
annualized rate of 1.6% to 116,578 people
during the coming five-year period.
The expansion in demand
and capacity will encourage
carriers to hire more staff
WWW.IBISWORLD.COM International Airlines in the US
September 2019 11
Industry Performance
The total number of industry operators is decreasing
The industry has experienced major consolidation,
boosting market share concentration
Technological developments in the
industry are moderate
There is wholehearted market
acceptance of industry services
Life Cycle Stage
WWW.IBISWORLD.COM International Airlines in the US
September 2019 12
Industry Performance
Industry Life Cycle The International Airlines industry is in
the mature phase of its economic life
cycle. The industry’s contribution to the
US economy, as measured by industry
value added, is projected to increase at an
annualized rate of 3.5% over the 10 years
to 2024. Comparatively, US GDP is
expected to grow at an annualized rate of
2.0% during the same period. Typically,
IVA growth that much greater than GDP
indicates a growing industry. However,
much of the industry’s IVA growth is due
to the industry’s growing wage expense
caused by increasing capacity and
average wages.
Mergers and acquisitions are
prominent in the industry as major
players attempt to expand their market
share. For example, in 2013, American
Airlines and US Airways merged to form
the largest airline in the world. In 2016,
Alaska Air Group Inc. acquired Virgin
American Inc. to expand west coast
presence and customer base. Industry
operators also frequently form alliances
to expand their geographical reach and
share the costs associated with
transportation. Many of the industry’s
largest shipping alliances, such as Star
Alliance, SkyTeam and One World, were
formed in recent decades as companies
attempted to improve operations in a
highly competitive environment. As a
result, the industry’s major players have
experienced a period of prolonged
consolidation, and the industry’s four
largest companies are expected to
account for over 80.0% of total industry
revenue in 2019. This trend is indicative
of a mature industry.
Additionally, technological upgrades in
the industry are moderate. While
companies are spending generously on
new aircraft and machinery, the level of
change from previous models is
declining. Over the past five years, there
has been an increase in the focus on
fuel-efficient technology and cost-
reduction machinery. While technological
upgrades are a consistent source of
investment for airlines, benefits from
each upgrade are slowing.
This industry
is Mature
WWW.IBISWORLD.COM International Airlines in the US
September 2019 13
Products and Services
Passenger transportation
Passenger transportation is the main
service offered by the International
Airlines industry, accounting for an
estimated 72.0% of industry revenue in
2019. Most revenue is earned through
coach travel, while a relatively large
portion of profit is earned through
business and first-class travel. Mainline
carriers are flag carriers that have large
and well-developed home markets. These
carriers also have the ability to exploit
open skies agreements through global
alliances, and major passenger airlines
generally focus on long-haul flights
between and beyond their alliance’s main
Products & Markets
Supply Chain | Products and Services | Demand Determinants
Major Markets | International Trade | Business Locations
KEY BUYING INDUSTRIES
48851 Freight Forwarding Brokerages & Agencies in the US
This industry uses international airlines to arrange the
transportation of freight between
shippers and carriers.
49222 Couriers & Local Delivery Services in the US
This industry uses international airlines to transport packages
and parcels to international
destinations.
NN002 Tourism in the US
This industry relies on international airlines to transport visitors
to the United States.
KEY SELLING INDUSTRIES
33641a Aircraft, Engine & Parts Manufacturing in the US
This industry provides aircraft and associated machinery to
international airlines.
42472 Gasoline & Petroleum Wholesaling in the US
This industry supplies fuel and lubricants to international
airlines.
48811 Airport Operations in the US
This industry provides space for international airlines to unload
and load passengers and
cargo.
48819 Aircraft Maintenance, Repair & Overhaul in the US
The industry provides maintenance and support to airlines.
Supply Chain
Products and services segmentation (2019)
Total $52.9bn
72.0%
Passenger transportation
13.6%
Cargo transportation
8.9%
Other
5.5%
Fees
SOURCE: WWW.IBISWORLD.COM
WWW.IBISWORLD.COM International Airlines in the US
September 2019 14
Products & Markets
Demand
Determinants
Factors affecting demand for the
International Airlines industry include
general economic activity, airfares,
exchange rates, levels of personal
disposable income and the appeal of
major travel destinations.
Leisure and business
Movements in airfares can have a
substantial effect on leisure travel, and
holidays and overseas visits are often
postponed during periods of high airfares.
In contrast, airfares are not such an
important factor for business travelers,
since they are generally considered part of
the usual costs of running a business.
Major demand determinants for business
travel include the level of international
trade activity, corporate profitability and
available substitutes, such as video
conferencing. During periods of weak
corporate profitability, business travel may
be restricted or class of travel may be
downgraded for shorter international trips.
The extent to which companies expand
overseas and become more globalized also
influences demand for international air
transportation services, and demand for
industry services typically increases as
industries and companies expand.
Additionally, the emergence of no-frills
scheduled carriers has caused price
differentials among airlines to contract in
recent years, enabling a greater number of
Products and Services
continued
hubs. Many mainline carriers also have
subsidiaries or affiliates that provide
regional transportation services that
connect passengers to major airline hubs.
The number of international trips taken
by US residents has increased at an
annualized rate of 5.0% over the past five
years, and strong economic growth in
several developing countries has led to
more tourists visiting the United States.
Moreover, rising levels of per capita
disposable income and corporate profit
have enabled more airline customers to
purchase relatively high-end airline
services, such as first-class seating. As a
result of these trends, passenger
transportation has grown as a share of total
industry revenue over the past five years.
Cargo transportation
The international transportation of cargo,
including freight mail, is estimated to
generate 13.6% of industry revenue in
2019. The main cargo airlines operating in
this segment are divisions or subsidiaries
of national passenger airlines, and these
carriers generally use recently built or
converted aircraft to carry cargo. In
addition, cargo is also transported in the
belly of passenger flights. Industry
operators transport a wide variety of
cargo, such as fresh produce, perishable
goods, livestock and dangerous or
hazardous goods. Carriers that operate on
scheduled routes do not provide door-to-
door …

More Related Content

Similar to All documents are reproduced with the permission of the copyrigh

HotelAnalysis.pdf
HotelAnalysis.pdfHotelAnalysis.pdf
HotelAnalysis.pdfGraceOkeke3
 
Using the mixed methods research to model the hotel performance measurement i...
Using the mixed methods research to model the hotel performance measurement i...Using the mixed methods research to model the hotel performance measurement i...
Using the mixed methods research to model the hotel performance measurement i...Karam Zaki
 
Hospitality Report about acquisition between Marriott International and Starw...
Hospitality Report about acquisition between Marriott International and Starw...Hospitality Report about acquisition between Marriott International and Starw...
Hospitality Report about acquisition between Marriott International and Starw...Jonathan Le
 
YHS-Rankings-Report-2016
YHS-Rankings-Report-2016YHS-Rankings-Report-2016
YHS-Rankings-Report-2016Rui Diogo
 
AN ANALYSIS OF HOTEL RATING AND ITS IMPLICATION ON FINANCIAL TURNOVER OF RATE...
AN ANALYSIS OF HOTEL RATING AND ITS IMPLICATION ON FINANCIAL TURNOVER OF RATE...AN ANALYSIS OF HOTEL RATING AND ITS IMPLICATION ON FINANCIAL TURNOVER OF RATE...
AN ANALYSIS OF HOTEL RATING AND ITS IMPLICATION ON FINANCIAL TURNOVER OF RATE...Laurie Smith
 
SWOT Analysis and Competition Approaches of Hotels in Guangzhou
SWOT Analysis and Competition Approaches of Hotels in GuangzhouSWOT Analysis and Competition Approaches of Hotels in Guangzhou
SWOT Analysis and Competition Approaches of Hotels in GuangzhouIOSRJBM
 
Hospitality business development
Hospitality business development Hospitality business development
Hospitality business development Sandeep Gupta
 
USA Travel Industry outlook and Trends 2018. Deloitte Report.
USA Travel Industry outlook and Trends 2018. Deloitte Report. USA Travel Industry outlook and Trends 2018. Deloitte Report.
USA Travel Industry outlook and Trends 2018. Deloitte Report. David Vicent
 
Supply and demand information
Supply and demand information Supply and demand information
Supply and demand information tellstptrisakti
 
LUBS3966 Managing Global Value Chains.docx
LUBS3966 Managing Global Value Chains.docxLUBS3966 Managing Global Value Chains.docx
LUBS3966 Managing Global Value Chains.docxstirlingvwriters
 
Determinants of occupancy rate
Determinants of occupancy rateDeterminants of occupancy rate
Determinants of occupancy ratemuhamedaliparambil
 
DATA OUTPUT.docxGRAPHS FOR QUESTION ONE.docx
DATA OUTPUT.docxGRAPHS FOR QUESTION ONE.docxDATA OUTPUT.docxGRAPHS FOR QUESTION ONE.docx
DATA OUTPUT.docxGRAPHS FOR QUESTION ONE.docxsimonithomas47935
 
QUALITY ASSURANCE FOR ECONOMY CLASSIFICATION BASED ON DATA MINING TECHNIQUES
QUALITY ASSURANCE FOR ECONOMY CLASSIFICATION BASED ON DATA MINING TECHNIQUESQUALITY ASSURANCE FOR ECONOMY CLASSIFICATION BASED ON DATA MINING TECHNIQUES
QUALITY ASSURANCE FOR ECONOMY CLASSIFICATION BASED ON DATA MINING TECHNIQUESIJDKP
 
Computer usage in hotel and foodservice management education
Computer usage in hotel and foodservice management educationComputer usage in hotel and foodservice management education
Computer usage in hotel and foodservice management educationRobbinson Willis
 
U.S. Travel and Hospitality: Embracing a SMAC-Driven Future
U.S. Travel and Hospitality: Embracing a SMAC-Driven FutureU.S. Travel and Hospitality: Embracing a SMAC-Driven Future
U.S. Travel and Hospitality: Embracing a SMAC-Driven FutureCognizant
 
Sample report: Global Online Accommodation Booking Market 2018
Sample report: Global Online Accommodation Booking Market 2018Sample report: Global Online Accommodation Booking Market 2018
Sample report: Global Online Accommodation Booking Market 2018yStats.com
 

Similar to All documents are reproduced with the permission of the copyrigh (20)

Dca full part1
Dca full part1Dca full part1
Dca full part1
 
HotelAnalysis.pdf
HotelAnalysis.pdfHotelAnalysis.pdf
HotelAnalysis.pdf
 
Using the mixed methods research to model the hotel performance measurement i...
Using the mixed methods research to model the hotel performance measurement i...Using the mixed methods research to model the hotel performance measurement i...
Using the mixed methods research to model the hotel performance measurement i...
 
The contribution of revenue marketing to improving the competitiveness of tou...
The contribution of revenue marketing to improving the competitiveness of tou...The contribution of revenue marketing to improving the competitiveness of tou...
The contribution of revenue marketing to improving the competitiveness of tou...
 
Hospitality Report about acquisition between Marriott International and Starw...
Hospitality Report about acquisition between Marriott International and Starw...Hospitality Report about acquisition between Marriott International and Starw...
Hospitality Report about acquisition between Marriott International and Starw...
 
YHS-Rankings-Report-2016
YHS-Rankings-Report-2016YHS-Rankings-Report-2016
YHS-Rankings-Report-2016
 
MAR Final
MAR FinalMAR Final
MAR Final
 
AN ANALYSIS OF HOTEL RATING AND ITS IMPLICATION ON FINANCIAL TURNOVER OF RATE...
AN ANALYSIS OF HOTEL RATING AND ITS IMPLICATION ON FINANCIAL TURNOVER OF RATE...AN ANALYSIS OF HOTEL RATING AND ITS IMPLICATION ON FINANCIAL TURNOVER OF RATE...
AN ANALYSIS OF HOTEL RATING AND ITS IMPLICATION ON FINANCIAL TURNOVER OF RATE...
 
D492530.pdf
D492530.pdfD492530.pdf
D492530.pdf
 
SWOT Analysis and Competition Approaches of Hotels in Guangzhou
SWOT Analysis and Competition Approaches of Hotels in GuangzhouSWOT Analysis and Competition Approaches of Hotels in Guangzhou
SWOT Analysis and Competition Approaches of Hotels in Guangzhou
 
Hospitality business development
Hospitality business development Hospitality business development
Hospitality business development
 
USA Travel Industry outlook and Trends 2018. Deloitte Report.
USA Travel Industry outlook and Trends 2018. Deloitte Report. USA Travel Industry outlook and Trends 2018. Deloitte Report.
USA Travel Industry outlook and Trends 2018. Deloitte Report.
 
Supply and demand information
Supply and demand information Supply and demand information
Supply and demand information
 
LUBS3966 Managing Global Value Chains.docx
LUBS3966 Managing Global Value Chains.docxLUBS3966 Managing Global Value Chains.docx
LUBS3966 Managing Global Value Chains.docx
 
Determinants of occupancy rate
Determinants of occupancy rateDeterminants of occupancy rate
Determinants of occupancy rate
 
DATA OUTPUT.docxGRAPHS FOR QUESTION ONE.docx
DATA OUTPUT.docxGRAPHS FOR QUESTION ONE.docxDATA OUTPUT.docxGRAPHS FOR QUESTION ONE.docx
DATA OUTPUT.docxGRAPHS FOR QUESTION ONE.docx
 
QUALITY ASSURANCE FOR ECONOMY CLASSIFICATION BASED ON DATA MINING TECHNIQUES
QUALITY ASSURANCE FOR ECONOMY CLASSIFICATION BASED ON DATA MINING TECHNIQUESQUALITY ASSURANCE FOR ECONOMY CLASSIFICATION BASED ON DATA MINING TECHNIQUES
QUALITY ASSURANCE FOR ECONOMY CLASSIFICATION BASED ON DATA MINING TECHNIQUES
 
Computer usage in hotel and foodservice management education
Computer usage in hotel and foodservice management educationComputer usage in hotel and foodservice management education
Computer usage in hotel and foodservice management education
 
U.S. Travel and Hospitality: Embracing a SMAC-Driven Future
U.S. Travel and Hospitality: Embracing a SMAC-Driven FutureU.S. Travel and Hospitality: Embracing a SMAC-Driven Future
U.S. Travel and Hospitality: Embracing a SMAC-Driven Future
 
Sample report: Global Online Accommodation Booking Market 2018
Sample report: Global Online Accommodation Booking Market 2018Sample report: Global Online Accommodation Booking Market 2018
Sample report: Global Online Accommodation Booking Market 2018
 

More from AzaleeRutledge285

Also, required are for each forum are three (3) 200-word minimum len
Also, required are for each forum are three (3) 200-word minimum lenAlso, required are for each forum are three (3) 200-word minimum len
Also, required are for each forum are three (3) 200-word minimum lenAzaleeRutledge285
 
Allwritten assignmentssubmittedviaTurnitInshould
Allwritten assignmentssubmittedviaTurnitInshouldAllwritten assignmentssubmittedviaTurnitInshould
Allwritten assignmentssubmittedviaTurnitInshouldAzaleeRutledge285
 
Already had this assignment before, but, need to have it rewritten s
Already had this assignment before, but, need to have it rewritten sAlready had this assignment before, but, need to have it rewritten s
Already had this assignment before, but, need to have it rewritten sAzaleeRutledge285
 
Although 90 of all desktop computers use Windows as their opera
Although 90 of all desktop computers use Windows as their operaAlthough 90 of all desktop computers use Windows as their opera
Although 90 of all desktop computers use Windows as their operaAzaleeRutledge285
 
Also by Glenn C. Altschuler Rude Republic America
Also by Glenn C. Altschuler Rude Republic AmericaAlso by Glenn C. Altschuler Rude Republic America
Also by Glenn C. Altschuler Rude Republic AmericaAzaleeRutledge285
 
All,In this discussion thread, you are tasked with the selection
All,In this discussion thread, you are tasked with the selectionAll,In this discussion thread, you are tasked with the selection
All,In this discussion thread, you are tasked with the selectionAzaleeRutledge285
 
All too often, we forget what rights and liberties that have been gr
All too often, we forget what rights and liberties that have been grAll too often, we forget what rights and liberties that have been gr
All too often, we forget what rights and liberties that have been grAzaleeRutledge285
 
All three essay responses must be a minimum of 500 words in length.
All three essay responses must be a minimum of 500 words in length.All three essay responses must be a minimum of 500 words in length.
All three essay responses must be a minimum of 500 words in length.AzaleeRutledge285
 
All these three are the main question of the unit!Accord
All these three are the main question of the unit!AccordAll these three are the main question of the unit!Accord
All these three are the main question of the unit!AccordAzaleeRutledge285
 
All the requirements are in the first docx.The format requiremen
All the requirements are in the first docx.The format requiremenAll the requirements are in the first docx.The format requiremen
All the requirements are in the first docx.The format requiremenAzaleeRutledge285
 
All the information must be from the power-points no other source
All the information must be from the power-points no other sourceAll the information must be from the power-points no other source
All the information must be from the power-points no other sourceAzaleeRutledge285
 
All students are required to have completed 5 Deaf Culture Hours
All students are required to have completed 5 Deaf Culture HoursAll students are required to have completed 5 Deaf Culture Hours
All students are required to have completed 5 Deaf Culture HoursAzaleeRutledge285
 
All social workers have a responsibility to be familiar with the
All social workers have a responsibility to be familiar with theAll social workers have a responsibility to be familiar with the
All social workers have a responsibility to be familiar with theAzaleeRutledge285
 
All the info you will need are uploaded.Before you contact me ma
All the info you will need are uploaded.Before you contact me maAll the info you will need are uploaded.Before you contact me ma
All the info you will need are uploaded.Before you contact me maAzaleeRutledge285
 
All women around the world in some stage of their life career
All women around the world in some stage of their life career All women around the world in some stage of their life career
All women around the world in some stage of their life career AzaleeRutledge285
 
All responses are to be written in essay format and should include s
All responses are to be written in essay format and should include sAll responses are to be written in essay format and should include s
All responses are to be written in essay format and should include sAzaleeRutledge285
 
All posts must be a minimum of 250 words. APA reference. 100 origin
All posts must be a minimum of 250 words. APA reference. 100 originAll posts must be a minimum of 250 words. APA reference. 100 origin
All posts must be a minimum of 250 words. APA reference. 100 originAzaleeRutledge285
 
All papers may be subject to submission for textual similarity revie
All papers may be subject to submission for textual similarity revieAll papers may be subject to submission for textual similarity revie
All papers may be subject to submission for textual similarity revieAzaleeRutledge285
 
All I want 5 pages research on the following questions.1- What
All I want 5 pages research on the following questions.1- WhatAll I want 5 pages research on the following questions.1- What
All I want 5 pages research on the following questions.1- WhatAzaleeRutledge285
 
All living organisms have basic needs. Access to food and water are
All living organisms have basic needs. Access to food and water are All living organisms have basic needs. Access to food and water are
All living organisms have basic needs. Access to food and water are AzaleeRutledge285
 

More from AzaleeRutledge285 (20)

Also, required are for each forum are three (3) 200-word minimum len
Also, required are for each forum are three (3) 200-word minimum lenAlso, required are for each forum are three (3) 200-word minimum len
Also, required are for each forum are three (3) 200-word minimum len
 
Allwritten assignmentssubmittedviaTurnitInshould
Allwritten assignmentssubmittedviaTurnitInshouldAllwritten assignmentssubmittedviaTurnitInshould
Allwritten assignmentssubmittedviaTurnitInshould
 
Already had this assignment before, but, need to have it rewritten s
Already had this assignment before, but, need to have it rewritten sAlready had this assignment before, but, need to have it rewritten s
Already had this assignment before, but, need to have it rewritten s
 
Although 90 of all desktop computers use Windows as their opera
Although 90 of all desktop computers use Windows as their operaAlthough 90 of all desktop computers use Windows as their opera
Although 90 of all desktop computers use Windows as their opera
 
Also by Glenn C. Altschuler Rude Republic America
Also by Glenn C. Altschuler Rude Republic AmericaAlso by Glenn C. Altschuler Rude Republic America
Also by Glenn C. Altschuler Rude Republic America
 
All,In this discussion thread, you are tasked with the selection
All,In this discussion thread, you are tasked with the selectionAll,In this discussion thread, you are tasked with the selection
All,In this discussion thread, you are tasked with the selection
 
All too often, we forget what rights and liberties that have been gr
All too often, we forget what rights and liberties that have been grAll too often, we forget what rights and liberties that have been gr
All too often, we forget what rights and liberties that have been gr
 
All three essay responses must be a minimum of 500 words in length.
All three essay responses must be a minimum of 500 words in length.All three essay responses must be a minimum of 500 words in length.
All three essay responses must be a minimum of 500 words in length.
 
All these three are the main question of the unit!Accord
All these three are the main question of the unit!AccordAll these three are the main question of the unit!Accord
All these three are the main question of the unit!Accord
 
All the requirements are in the first docx.The format requiremen
All the requirements are in the first docx.The format requiremenAll the requirements are in the first docx.The format requiremen
All the requirements are in the first docx.The format requiremen
 
All the information must be from the power-points no other source
All the information must be from the power-points no other sourceAll the information must be from the power-points no other source
All the information must be from the power-points no other source
 
All students are required to have completed 5 Deaf Culture Hours
All students are required to have completed 5 Deaf Culture HoursAll students are required to have completed 5 Deaf Culture Hours
All students are required to have completed 5 Deaf Culture Hours
 
All social workers have a responsibility to be familiar with the
All social workers have a responsibility to be familiar with theAll social workers have a responsibility to be familiar with the
All social workers have a responsibility to be familiar with the
 
All the info you will need are uploaded.Before you contact me ma
All the info you will need are uploaded.Before you contact me maAll the info you will need are uploaded.Before you contact me ma
All the info you will need are uploaded.Before you contact me ma
 
All women around the world in some stage of their life career
All women around the world in some stage of their life career All women around the world in some stage of their life career
All women around the world in some stage of their life career
 
All responses are to be written in essay format and should include s
All responses are to be written in essay format and should include sAll responses are to be written in essay format and should include s
All responses are to be written in essay format and should include s
 
All posts must be a minimum of 250 words. APA reference. 100 origin
All posts must be a minimum of 250 words. APA reference. 100 originAll posts must be a minimum of 250 words. APA reference. 100 origin
All posts must be a minimum of 250 words. APA reference. 100 origin
 
All papers may be subject to submission for textual similarity revie
All papers may be subject to submission for textual similarity revieAll papers may be subject to submission for textual similarity revie
All papers may be subject to submission for textual similarity revie
 
All I want 5 pages research on the following questions.1- What
All I want 5 pages research on the following questions.1- WhatAll I want 5 pages research on the following questions.1- What
All I want 5 pages research on the following questions.1- What
 
All living organisms have basic needs. Access to food and water are
All living organisms have basic needs. Access to food and water are All living organisms have basic needs. Access to food and water are
All living organisms have basic needs. Access to food and water are
 

Recently uploaded

internship ppt on smartinternz platform as salesforce developer
internship ppt on smartinternz platform as salesforce developerinternship ppt on smartinternz platform as salesforce developer
internship ppt on smartinternz platform as salesforce developerunnathinaik
 
Introduction to AI in Higher Education_draft.pptx
Introduction to AI in Higher Education_draft.pptxIntroduction to AI in Higher Education_draft.pptx
Introduction to AI in Higher Education_draft.pptxpboyjonauth
 
call girls in Kamla Market (DELHI) 🔝 >༒9953330565🔝 genuine Escort Service 🔝✔️✔️
call girls in Kamla Market (DELHI) 🔝 >༒9953330565🔝 genuine Escort Service 🔝✔️✔️call girls in Kamla Market (DELHI) 🔝 >༒9953330565🔝 genuine Escort Service 🔝✔️✔️
call girls in Kamla Market (DELHI) 🔝 >༒9953330565🔝 genuine Escort Service 🔝✔️✔️9953056974 Low Rate Call Girls In Saket, Delhi NCR
 
Interactive Powerpoint_How to Master effective communication
Interactive Powerpoint_How to Master effective communicationInteractive Powerpoint_How to Master effective communication
Interactive Powerpoint_How to Master effective communicationnomboosow
 
Full Stack Web Development Course for Beginners
Full Stack Web Development Course  for BeginnersFull Stack Web Development Course  for Beginners
Full Stack Web Development Course for BeginnersSabitha Banu
 
MARGINALIZATION (Different learners in Marginalized Group
MARGINALIZATION (Different learners in Marginalized GroupMARGINALIZATION (Different learners in Marginalized Group
MARGINALIZATION (Different learners in Marginalized GroupJonathanParaisoCruz
 
KSHARA STURA .pptx---KSHARA KARMA THERAPY (CAUSTIC THERAPY)————IMP.OF KSHARA ...
KSHARA STURA .pptx---KSHARA KARMA THERAPY (CAUSTIC THERAPY)————IMP.OF KSHARA ...KSHARA STURA .pptx---KSHARA KARMA THERAPY (CAUSTIC THERAPY)————IMP.OF KSHARA ...
KSHARA STURA .pptx---KSHARA KARMA THERAPY (CAUSTIC THERAPY)————IMP.OF KSHARA ...M56BOOKSTORE PRODUCT/SERVICE
 
Enzyme, Pharmaceutical Aids, Miscellaneous Last Part of Chapter no 5th.pdf
Enzyme, Pharmaceutical Aids, Miscellaneous Last Part of Chapter no 5th.pdfEnzyme, Pharmaceutical Aids, Miscellaneous Last Part of Chapter no 5th.pdf
Enzyme, Pharmaceutical Aids, Miscellaneous Last Part of Chapter no 5th.pdfSumit Tiwari
 
ECONOMIC CONTEXT - PAPER 1 Q3: NEWSPAPERS.pptx
ECONOMIC CONTEXT - PAPER 1 Q3: NEWSPAPERS.pptxECONOMIC CONTEXT - PAPER 1 Q3: NEWSPAPERS.pptx
ECONOMIC CONTEXT - PAPER 1 Q3: NEWSPAPERS.pptxiammrhaywood
 
Presiding Officer Training module 2024 lok sabha elections
Presiding Officer Training module 2024 lok sabha electionsPresiding Officer Training module 2024 lok sabha elections
Presiding Officer Training module 2024 lok sabha electionsanshu789521
 
Biting mechanism of poisonous snakes.pdf
Biting mechanism of poisonous snakes.pdfBiting mechanism of poisonous snakes.pdf
Biting mechanism of poisonous snakes.pdfadityarao40181
 
Painted Grey Ware.pptx, PGW Culture of India
Painted Grey Ware.pptx, PGW Culture of IndiaPainted Grey Ware.pptx, PGW Culture of India
Painted Grey Ware.pptx, PGW Culture of IndiaVirag Sontakke
 
How to Configure Email Server in Odoo 17
How to Configure Email Server in Odoo 17How to Configure Email Server in Odoo 17
How to Configure Email Server in Odoo 17Celine George
 
Historical philosophical, theoretical, and legal foundations of special and i...
Historical philosophical, theoretical, and legal foundations of special and i...Historical philosophical, theoretical, and legal foundations of special and i...
Historical philosophical, theoretical, and legal foundations of special and i...jaredbarbolino94
 
18-04-UA_REPORT_MEDIALITERAСY_INDEX-DM_23-1-final-eng.pdf
18-04-UA_REPORT_MEDIALITERAСY_INDEX-DM_23-1-final-eng.pdf18-04-UA_REPORT_MEDIALITERAСY_INDEX-DM_23-1-final-eng.pdf
18-04-UA_REPORT_MEDIALITERAСY_INDEX-DM_23-1-final-eng.pdfssuser54595a
 
How to Make a Pirate ship Primary Education.pptx
How to Make a Pirate ship Primary Education.pptxHow to Make a Pirate ship Primary Education.pptx
How to Make a Pirate ship Primary Education.pptxmanuelaromero2013
 
Introduction to ArtificiaI Intelligence in Higher Education
Introduction to ArtificiaI Intelligence in Higher EducationIntroduction to ArtificiaI Intelligence in Higher Education
Introduction to ArtificiaI Intelligence in Higher Educationpboyjonauth
 

Recently uploaded (20)

internship ppt on smartinternz platform as salesforce developer
internship ppt on smartinternz platform as salesforce developerinternship ppt on smartinternz platform as salesforce developer
internship ppt on smartinternz platform as salesforce developer
 
Introduction to AI in Higher Education_draft.pptx
Introduction to AI in Higher Education_draft.pptxIntroduction to AI in Higher Education_draft.pptx
Introduction to AI in Higher Education_draft.pptx
 
call girls in Kamla Market (DELHI) 🔝 >༒9953330565🔝 genuine Escort Service 🔝✔️✔️
call girls in Kamla Market (DELHI) 🔝 >༒9953330565🔝 genuine Escort Service 🔝✔️✔️call girls in Kamla Market (DELHI) 🔝 >༒9953330565🔝 genuine Escort Service 🔝✔️✔️
call girls in Kamla Market (DELHI) 🔝 >༒9953330565🔝 genuine Escort Service 🔝✔️✔️
 
Interactive Powerpoint_How to Master effective communication
Interactive Powerpoint_How to Master effective communicationInteractive Powerpoint_How to Master effective communication
Interactive Powerpoint_How to Master effective communication
 
ESSENTIAL of (CS/IT/IS) class 06 (database)
ESSENTIAL of (CS/IT/IS) class 06 (database)ESSENTIAL of (CS/IT/IS) class 06 (database)
ESSENTIAL of (CS/IT/IS) class 06 (database)
 
Full Stack Web Development Course for Beginners
Full Stack Web Development Course  for BeginnersFull Stack Web Development Course  for Beginners
Full Stack Web Development Course for Beginners
 
MARGINALIZATION (Different learners in Marginalized Group
MARGINALIZATION (Different learners in Marginalized GroupMARGINALIZATION (Different learners in Marginalized Group
MARGINALIZATION (Different learners in Marginalized Group
 
KSHARA STURA .pptx---KSHARA KARMA THERAPY (CAUSTIC THERAPY)————IMP.OF KSHARA ...
KSHARA STURA .pptx---KSHARA KARMA THERAPY (CAUSTIC THERAPY)————IMP.OF KSHARA ...KSHARA STURA .pptx---KSHARA KARMA THERAPY (CAUSTIC THERAPY)————IMP.OF KSHARA ...
KSHARA STURA .pptx---KSHARA KARMA THERAPY (CAUSTIC THERAPY)————IMP.OF KSHARA ...
 
Enzyme, Pharmaceutical Aids, Miscellaneous Last Part of Chapter no 5th.pdf
Enzyme, Pharmaceutical Aids, Miscellaneous Last Part of Chapter no 5th.pdfEnzyme, Pharmaceutical Aids, Miscellaneous Last Part of Chapter no 5th.pdf
Enzyme, Pharmaceutical Aids, Miscellaneous Last Part of Chapter no 5th.pdf
 
ECONOMIC CONTEXT - PAPER 1 Q3: NEWSPAPERS.pptx
ECONOMIC CONTEXT - PAPER 1 Q3: NEWSPAPERS.pptxECONOMIC CONTEXT - PAPER 1 Q3: NEWSPAPERS.pptx
ECONOMIC CONTEXT - PAPER 1 Q3: NEWSPAPERS.pptx
 
Model Call Girl in Tilak Nagar Delhi reach out to us at 🔝9953056974🔝
Model Call Girl in Tilak Nagar Delhi reach out to us at 🔝9953056974🔝Model Call Girl in Tilak Nagar Delhi reach out to us at 🔝9953056974🔝
Model Call Girl in Tilak Nagar Delhi reach out to us at 🔝9953056974🔝
 
Presiding Officer Training module 2024 lok sabha elections
Presiding Officer Training module 2024 lok sabha electionsPresiding Officer Training module 2024 lok sabha elections
Presiding Officer Training module 2024 lok sabha elections
 
Biting mechanism of poisonous snakes.pdf
Biting mechanism of poisonous snakes.pdfBiting mechanism of poisonous snakes.pdf
Biting mechanism of poisonous snakes.pdf
 
Painted Grey Ware.pptx, PGW Culture of India
Painted Grey Ware.pptx, PGW Culture of IndiaPainted Grey Ware.pptx, PGW Culture of India
Painted Grey Ware.pptx, PGW Culture of India
 
How to Configure Email Server in Odoo 17
How to Configure Email Server in Odoo 17How to Configure Email Server in Odoo 17
How to Configure Email Server in Odoo 17
 
Historical philosophical, theoretical, and legal foundations of special and i...
Historical philosophical, theoretical, and legal foundations of special and i...Historical philosophical, theoretical, and legal foundations of special and i...
Historical philosophical, theoretical, and legal foundations of special and i...
 
Model Call Girl in Bikash Puri Delhi reach out to us at 🔝9953056974🔝
Model Call Girl in Bikash Puri  Delhi reach out to us at 🔝9953056974🔝Model Call Girl in Bikash Puri  Delhi reach out to us at 🔝9953056974🔝
Model Call Girl in Bikash Puri Delhi reach out to us at 🔝9953056974🔝
 
18-04-UA_REPORT_MEDIALITERAСY_INDEX-DM_23-1-final-eng.pdf
18-04-UA_REPORT_MEDIALITERAСY_INDEX-DM_23-1-final-eng.pdf18-04-UA_REPORT_MEDIALITERAСY_INDEX-DM_23-1-final-eng.pdf
18-04-UA_REPORT_MEDIALITERAСY_INDEX-DM_23-1-final-eng.pdf
 
How to Make a Pirate ship Primary Education.pptx
How to Make a Pirate ship Primary Education.pptxHow to Make a Pirate ship Primary Education.pptx
How to Make a Pirate ship Primary Education.pptx
 
Introduction to ArtificiaI Intelligence in Higher Education
Introduction to ArtificiaI Intelligence in Higher EducationIntroduction to ArtificiaI Intelligence in Higher Education
Introduction to ArtificiaI Intelligence in Higher Education
 

All documents are reproduced with the permission of the copyrigh

  • 1. All documents are reproduced with the permission of the copyright owner. Further reproduction or distribution is prohibited without permission. Please do not reply directly to this email. annette tyler sent you the following: Email 1 of 1 Table of contents Document 1 of 1 US hotel industry revenue: an ARDL bounds testing approach Author: Chen, Han1; Chen, Rui2; Shaniel Bernard3; Rahman, Imran31 Lester E. Kabacoff School of Hotel, Restaurant and Tourism Administration, University of New Orleans, New Orleans, Louisiana, USA2 Department of Agricultural Economics and Rural Sociology, Auburn University, Auburn, USA3 Department of Nutrition, Dietetics and Hospitality Management, Auburn University, Auburn, USA Publication info: International Journal of Contemporary Hospitality Management ; Bradford Vol. 31, Iss. 4, (2019): 1720-1743. Abstract: Purpose This study aims to develop a parsimonious model to estimate US aggregate hotel industry revenue using domestic trips, consumer confidence index, international inbound trips, personal consumption expenditure and number of hotel rooms as predictor variables. Additionally, the study applied the model in six sub-segments of the hotel industry – luxury, upper upscale, upscale, upper midscale, midscale and economy.
  • 2. Design/methodology/approach Using monthly aggregate data from the past 22 years, the study adopted the auto-regressive distribute lags (ARDL) approach in developing the estimation model. Unit root analysis and cointegration test were further utilized. The model showed significant utility in accurately estimating aggregate hotel industry and sub-segment revenue. Findings All predictor variables except number of rooms showed significant positive influences on aggregate hotel industry revenue. Substantial variations were noted regarding estimating sub-segment revenue. Consumer confidence index positively affected all sub-segment revenues, except for upper upscale hotels. Inbound trips by international tourists and personal consumption expenditure positively influenced revenue for all sub-segments but economy hotels. Domestic trips by US residents added significant explanatory power to only upper upscale, upscale and economy hotel revenue. Number of hotel rooms only had significant negative effect on luxury and upper upscale hotel sub-segment revenues. Practical implications Hotel operators can make marketing and operating decisions regarding pricing, inventory allocation and strategic management based on the revenue estimation models specific to their segments. Originality/value It is the first study that adopted the ARDL bound approach and analyzed the predictive capacity of macroeconomic variables on aggregate hotel industry and sub-segment revenue. Links: Full text: 1. Introduction The tourism industry has positioned itself as one of the nation’s largest employers representing 8.0 per cent of US GDP (World Travel and Tourism Council (WTTC), 2015). The lodging industry, being one of its major segments, contributed almost
  • 3. $600bn to the US GDP and created more than eight million jobs in different hotel segments (American Hotel and Lodging Association (AH&LA) American Hotel and Lodging Association, 2017). In terms of total output, lodging represents the largest segment in the broader tourism industry, with travelers spending more than $393bn per year on accommodations (Select USA, 2016). The lodging industry has outperformed the US economy over the past five years with industry revenue growing at an annual rate of 3.7 per cent reaching $189.5bn in 2015 (AH&LA, 2015). This rapid growth is driven by an escalating tourism demand, stemming from an influx of domestic and international leisure and business travelers. In addition, the growing demand of hotel service is influenced by the broad economy, where changes in consumer confidence and consumption expenditures can affect decisions on entertainment, travel and lodging (Alvarez, 2015). Moreover, the growth of hotel industry depends on the interplay between supply and demand (HOSPA, 2013). There is no doubt that the lodging industry plays an important role in the US economy. However, it is not easy to plan strategically based on the macroeconomic environment. In essence, a three-step process needs to be followed. The first step is to identify the macroeconomic predictors or the forces of change that can significantly influence industry revenue. The second step is to see whether these macroeconomic predictors can accurately estimate industry revenue using a parsimonious estimation model. The last step is to test the utility of this model in various industry sub-segments and explain any ensuing variations. Hoteliers need to accurately estimate hotel sales using key external drivers at both micro and macro levels to carry out strategic planning and management. At the micro level, sales estimation is a key tool for managers’ decision-making involving functional areas such as marketing, sales, finance, and accounting (Mentzer and Bienstock, 1998). In the hotel industry, revenue estimation is considered as an indispensable
  • 4. part of hotels’ marketing and operations especially as it relates to pricing and inventory management (Talluri and Van Ryzin, 2004). At the macro level, estimating expected growth in aggregate hotel revenue based on specific economic drivers helps hotel corporations to make large-scale investment related decisions on segment-based expansion, mergers and acquisitions. However, there is very little research that delves into hotel revenue estimation models at the macro level (Anderson et al., 2000; Bojanic, 1996). Furthermore, none of the relevant research studies employed the autoregressive distributive lag (ARDL) bounds testing procedure, which in the past had been popularly applied to examine the impact of macroeconomic factors on economic growth and tourism demand (Narayan, 2004; Srinivasan et al., 2012). Additionally, to the best of our knowledge, there is no single study that undertakes estimation of sub-segment hotel sales using relevant macroeconomic indicators. It is essential to understand the different ways in which macroeconomic predictors affect sales for each sub-segment so that practitioners can carry out more segment-specific strategic planning. The purpose of this study, then, is to develop a predictive model to estimate monthly hotel industry revenue using five macroeconomic variables – domestic trips by US residents, consumer confidence index (CCI), inbound trips by non-US residents, personal consumption expenditure (PCE), and number of hotel rooms (NOHR). In addition, the model will be tested across industry sub-segments, which include luxury, upper upscale, upscale, upper midscale, midscale, and economy hotels. The study employs the five most relevant and accessible macroeconomic predictors to develop a working estimation model that is simple, user-friendly, and efficient. The goal, therefore, is to develop a parsimonious model with maximum explanatory power. Theoretically, the study is expected to fill the gap in current literature by proposing a hotel industry and sub-segment revenue estimation model using macroeconomic predictors and the ARDL approach. The estimation model and
  • 5. comparisons across sub-segments will help various stakeholders of the hotel industry such as operators, suppliers, investors, policy-makers, researchers, and various independent organizations better understand the influential factors in each sub-segment. 2. Literature review 2.1 Estimation of hotel industry revenue Estimating hotel industry revenue can address external factors that influence industry revenue at the micro and macro level. At the micro level, it is typical to include arrival or booking date, segment price and duration of use, whereas at the macro level total demand may influence revenue to a great extent (Lee, 1990). The lodging industry is sensitive to fluctuations in demand; however, forecasting demand is pertinent due to the nature of the industry and its operational characteristics (Yüksel, 2007). Moreover, since estimation differs for transient and group customers (Yüksel, 2007), it is natural for it to di ffer across hotel sub-segments. Examining hotel segment performances in relation to economic factors is relevant since the results often differ when compared to overall industry performance (Canter and Maher, 1998). Making a distinction promotes a better understanding of how the varying demands across sub-segments relate to economic measures. Extant literature regarding hotel revenue estimation is still in its infancy. Little prior research has estimated hotel revenue at the macro level, with most estimation models directed at the micro level that utilized techniques such as choice models (Talluri and Van Ryzin, 2004). Other studies applied several revenue management techniques to increase operational efficiency in the hotel sector (Solnet et al., 2016). There are also a handful of studies that estimated hotel demand in terms of guest arrivals and occupancy. For instance, Damonte et al. (1998) estimated hotel demand using a cross sectional sample of 310 properties. The factors in their analysis were average daily rate (ADR), number of rooms available, number of employees, food and beverage revenue and number of tourists attending conferences.
  • 6. The results indicated that price elasticity of demand varied across hotel segments. Consequently, Canina and Carvell (2005) expanded on this study to include consumer confidence index (CCI), income, expectations of income (corporate income and disposable personal income), ADR and local market’s ADR to estimate demand for urban hotels in a metropolitan market. The results, utilizing data spanning from 1989 to 2000, found all predictors as significant influencers of lodging demand. 2.2 Hotel segmentation Hotels are categorized based on several factors including but not limited to hotel size, location, target markets, levels of service, number of rooms etc. Prior hotel segmentation studies in an econometric context have predominantly used micro- economic variables in their estimation of pricing, growth, and consumer demand. For example, Falk and Hagsten (2015) used two stage least absolute deviation estimators to predict growth and revenue for Swedish hotel establishments. They found that growth rate of overnight stays was significantly and positively related to the price segment of the hotel at the beginning of the same period; however, the relationship became negative as the price increased indicating that high-end hotels do not have better growth prospects than hotels in medium price segments. Similarly, Damonte et al. (1998) indicated that price elasticity of demand varied across different hotel segments when estimating hotel demand using ADR, number of rooms available, and number of tourists. Luxury hotels were perceived by travelers as experiences, rather than products (Chu, 2014). Access to more disposable income may increase the frequency of consumer’s stay in such hotels. For example, Graf’s (2011) study on 2,824 hotel properties found that consumers who usually stay in lower class hotel segments, may switch to higher ones once their income increases. Tran (2015) estimated the effects of economic factors on the demand for luxury hotel sub-segment in the USA between 1998 and 2013. Results of their study indicated that US residents would extend their length of stay in luxury hotels
  • 7. when their income rises. German, Chinese, Japanese and Korean visitors would stay in luxury hotels when their income increases even if the hotel price goes up. To the best of our knowledge, there is a lack of research regarding macroeconomic variables’ influence on the aggregate US hotel industry and sub-segments revenue, wherein the model that works for the aggregate hotel industry revenue may not work for different sub-segments. The study analyzes six sub- segments of the hotel industry to test the accuracy of the estimation model. In order to divide the hotels in different segments, the nomenclature used by Smith Travel Research (2014) (STR) was followed. STR positions hotels in classes based on their historical ADR, not on subjective criteria such as features or amenities. Both chain and independent hotels use the same ADR categorization. 2.3 Identifying predictors Previous research shows the impact of economic predictors on the lodging industry (Choi, 2003; Zarnowitz, 1992). Given the paucity of research in hotel industry revenue estimation in the extant hospitality literature, the current study selected variables suggested by Canina and Carvell (2005), Chen et al. (2007) and Alvarez (2015), which include domestic trips by US residents, consumer confidence index (CCI), inbound trips by non-US residents, personal consumption expenditure (PCE), and number of hotel rooms (NOHR) in the industry. 2.3.1 Domestic trips by US residents. Domestic tourists are defined as individuals taking overnight trips or longer away from the place of their residence (International Union of Official Travel Organizations, 1974). Consistent with Alvarez (2015), the current study measures domestic trips of US residents by the number of domestic flights within the USA for both leisure and business travel. Domestic trips by US residents increased from 660.9 million in 2006 to 682.1 million in 2015 (Alvarez, 2015), exhibiting an increasing trend that might explain the variation of the US hotel industry revenue in the same period. Close to 80 per cent of
  • 8. domestic trips were taken by leisure travelers in 2016 (USA Travel Association, 2016), who are known to be price sensitive and less willing to pay for a higher room rate (Masiero et al., 2015). Witt and Witt (1995) chose domestic and international trips to forecast tourism demand and both variables added significant explanatory power in their study. These findings underscore the importance of the number of domestic trips in predicting hotel industry revenue. Economic growth leads to the increase in number of air passengers and business activities – hence more domestic business and leisure travel (Chi and Baek, 2013). As the number of domestic trips increases, more people will be staying in hotels increasing hotel revenue. Thus, domestic trips by US residents can be a significant predictor of US hotel revenue. H1. The number of domestic trips made by US residents has a significant positive influence on aggregate hotel industry revenue; and revenues for all six sub-segments. 2.3.2 Consumer confidence index. Consumer confidence refers to the degree of optimism consumers feel about the state of the economy and their personal finances, which guides their decisions on spending and saving. Consumer confidence is measured by two indices – The Conference Board’s Consumer Confidence Index (CCI) and University of Michigan’s Index of Consumer Sentiment (ICS). Vuchelen (2004) contended that consumer sentiment is an efficient variable to use for forecasters to avoid some errors, since many economic and financial variables can significantly influence the consumer sentiment. Since both CCI and ICS essentially measures consumer confidence but with a different methodology, it is safe to use either one in estimation models. In this study, CCI is used to predict US hotel revenue. The US CCI is calculated by The Conference Board using a monthly survey. The monthly survey includes questions related to consumers’ household finances, employment, income, business conditions and economic outlook (The Conference Board,
  • 9. 2011). CCI has a good forecasting power for consumer spending as it influences individual expectations and consumption preferences. High consumer confidence can decrease uncertainty in the future, thereby reducing precautionary savings and increasing present consumption (Ludvigson, 2004). In addition, an increase in consumer confidence can boost future income and wealth expectations (Ludvigson, 2004). Thus, CCI can influence the real economy by increasing consumer expenditure on entertainment, travel, lodging, etc. Hence, higher CCI results in direct future consumption growth. Prior research provides empirical evidence that CCI increases labor income (Carroll et al., 1994), which eventually translates into more expenditure. Singal (2012) also demonstrated that CCI can explain a significant part of variation in consumer expenditure on hotel industry. In hindsight, CCI can influence the real economy by increasing or decreasing consumer expenditure. Increased expenditure on lodging related services would increase hotel revenue. Thus, the following hypothesis i s proposed: H2. CCI has a significant positive influence on aggregate hotel industry revenue; and revenues for all six sub-segments. 2.3.3 Inbound trips by non-US residents. International tourists are defined as “tourists who stay at least one night in a country where they are not residents”, where a resident is “a person who has lived for most of the past year in a country” (Eilat and Einav, 2004, p. 1319). The study measures inbound trips of non-US residents by the number of international arrivals to the USA for both leisure and business purposes. The number of international visitors to the USA is found in three US and international government sources: the USA Department of Homeland Security/USA Customs and Border Protection I-94 arrivals program data, Statistics Canada’s International Travel Survey and Banco de Mexico travel data (National Travel and Tourism Office, 2016). International visitors have significant influence on the US hotel industry (Tran, 2015). USA received the largest share of world
  • 10. tourism (14.2 per cent) in year 2014 (AH&LA, 2015). The international visitor arrivals and their lengths of stay can influence the demand for hotel rooms. Each international visitor stayed an average of 18 nights in the USA (USA Travel Association, 2015). Proceeds from international visitor arrivals in the USA accounts for as much as 20 per cent of US hotel revenue (AH&LA, 2015). The top five countries with the most international visitor arrivals are Canada, Mexico, UK, Japan and China (National Travel and Tourism Office, 2015). The variable international visitor arrivals has received overwhelming attention in the tourism literature especially in estimating tourism demand, with the vast majority of these studies testing the utility of various estimation models specific to a country/region (Kraipornsak, 2011; Peng et al., 2015; Yang et al., 2010). Travelers’ demographic characteristics matter in international trips. Income, exchange rates, and transportation costs are the three critical factors affecting international tourism demand (Lim, 1997). Access to financial resources positively influence tourist demand and travel frequency (Davies and Mangan, 1992). The general assumption is that as peoples’ disposable income increases, so will their tendency to engage in lei sure travel, extend their length of stay in a destination and spend more in travel related services (Alegre et al., 2011). In essence, wealthy families are known to engage in international travel, whereas families in lower income brackets tend to travel domestically (Fang Bao and McKercher, 2008). Previous studies show that most international tourists are considered as affluent travelers, indicating that income in their country of origin is the most important explanatory variable in generating those trips (Crouch, 1995; Lim, 1997). Overseas travelers spend almost $4,400 during their visit to the USA (USA Travel Association, 2015). As more international tourists arrive in the USA, demand for hotel rooms and other lodging-related services goes up, contributing directly to hotel sales. Therefore, a significant positive relationship between inbound trips by non-US residents
  • 11. and lodging industry and its sub-segment revenue is expected. H3. Inbound trips by non-US residents have a significant positive influence on aggregate hotel industry revenue; and revenues for all six sub-segments. 2.2.4 Personal consumption expenditure. Personal consumption expenditures (PCE), “measures the goods and services purchased by persons – that is, by households and by nonprofit institutions serving households which are residents in the USA” (Bureau of Economic Analysis, 2014, p. 5-2). Consumer spending on goods and services in the US economy is measured primarily by the PCE, which accounts for approximately two-thirds of domestic spending (Bureau of Economic Analysis, 2014). PCE is known as the primary driver of future economic growth. It implies how much of the household income is spent on current consumption as opposed to being saved for future consumption. Households engaging in more consumption outside (e.g. dining out and shopping) will “directly lead to more activities and travel consistent with the behavioral paradigm that travel demand is a derived demand” (Ferdous et al., 2010, p.1). Therefore, PCE is a good indicator of US consumer spending, which can be used to estimate tourism demand (Chen et al., 2007). As discussed above, the more the tourism demand, the higher is the expenditure on lodging and related service. In a hotel context, as perceived value of the product or service increases, consumers’ intention to purchase grows (Ashton et al., 2010), which contributes to hotel revenue growth. Similarly, Corgel et al. (2012) suggested that the increase of income generates higher demand for higher priced hotel segments such as luxury and upper upscale hotels than for lower priced ones such as midscale and economy hotels. Hence, a significant positive relationship between PCE and US hotel industry and sub-segment revenue is expected. H4. PCE has a significant positive influence on aggregate hotel industry revenue; and revenues for all six sub-segments.
  • 12. 2.2.5 Number of hotel rooms. Number of hotel rooms (NOHR) variable measures the number of available hotel rooms in the aggregate hotel industry. Similarly, NOHR in each sub-segment is used in the estimation of its corresponding hotel sub-segment revenue. The increases of available hotel rooms in the industry will lead to more supply in the industry, increasing competition, and resulting in lower ADR for some sub-segments. Hotel revenue is the result of both ADR and number of rooms sold, which is the demand from the consumers’ side. The growth of hotel revenue depends on the price elasticity of demand (Canina and Carvell, 2005). Price elasticity is defined as the per cent change in demand divided by the per cent change in price, which measures the degree to which demand is sensitive to changes in price (Corgel et al., 2012; Trans, 2011). If the demand is price elastic, hotel revenue may increase if room rates reduce. On the other hand, if the demand is price inelastic, hotel revenue will reduce as room rates fall (Canina and Carvell, 2005). Prior studies demonstrated that all US hotel sub-segments had inelastic demand, which showed that the growth in room rate is much greater than the growth in demand (Hiemstra and Ismail, 1993). Tran (2011, 2015) supported this view by demonstrating that the price is inelastic in US luxury hotel sub-segment and suggesting that consumers are not sensitive to price changes. Similarly, research at the property level also showed that price elasticity of demand varied across hotel sub-segments with higher priced hotels having lower price elasticity than lower priced hotels (Canina and Carvell, 2005). Hence, the increase of hotel supply will result in reduced ADR, which further results in increased demand, leading to a reduced level of hotel industry revenue (price inelasticity). Therefore, the study proposes the following hypotheses: H5. NOHR has a significant negative influence on aggregate hotel industry revenue; NOHR for each sub-segment has a significant negative influence on sub-segment revenues. 3. Methodology
  • 13. Monthly data from January 1996 to September 2017 were collected from a variety of sources. Monthly aggregate hotel industry and sub-segment revenue data were collected from STR. Revenue data for chain hotels and independent hotels as well as number of hotel rooms in each sub-segment were included in this dataset. These data were not publicly available and required subscription to STR. Domestic trips by US residents’ data were gathered from the Bureau of Transportation Statistics (2018) website. Consumer confidence index (CCI) data were compiled from The Conference Board (2018) website. Inbound trips by non-US residents’ data were collected from the National Travel and Tourism Office (2018). Seasonally adjusted personal consumption expenditure (PCE) data were collected from the Federal Reserve Economic Data (2018) (FRED). All data sets apart from hotel industry revenue and number of hotel rooms were publicly available. In addition, all data sets were not seasonally adjusted except PCE. Seasonality is a known characteristic of tourist demand, which also influences accuracy of hotel revenue estimation (Chen et al., 2015). Therefore, it cannot be overlooked in the modeling process. Seasonal adjustments of all variables except PCE were conducted using the X-12-ARIMA program, which is developed by the US Census Bureau. The X-12-ARIMA procedure makes adjustment for monthly or quarterly series. It is the primary method for seasonal adjustment of government and economic time series in USA, Canada and the EU (Miller and Williams, 2004). 3.1 Model specification and estimation procedure The current study examines the five macroeconomic predictors’ utility in estimating aggregate US hotel industry revenue. It also assesses how the causal model works for potentially dissimilar industry sub-segments. As seen in Table I, the sub-segment classification followed the nomenclature used by STR. The auto-regressive distribute lags (ARDL) approach is used via EViews 10. Unit root analysis is first conducted to confirm that the data are stationary, i.e. I (0), or non-stationary, i.e. I (1).
  • 14. Then the cointegration test with the ARDL approach is utilized. The US hotel revenue is determined by variables that measure the hotel supply – NOHR and hotel demand – namely, domestic trips by US residents, CCI, inbound trips by non-US residents and PCE. US nominal hotel renvenue and PCE have been deflated by consumer price index to remove the effects of inflation. Therefore, the determinats of US hotel revenue take the specification form: (1) ln⁡Revenuet=α+β ln⁡(⁡DTt)+γ ln⁡(⁡ CCIt)+δln⁡(⁡ IAt)+θ ln⁡(PCEt)+ψ ln⁡(NOHRt)+εtwhere Revenuet denotes the aggregate US hotel industry revenue and sub-segment revenues for luxury, upper upscale, upscale, upper midscale, midscale and economy in year t. DTt and IAt are defined as domestic trips by US residents and inbound trips by non-US residents in year t. Many empirical studies have proved that most aggregate data have a unit root (Kwiatkowski et al., 1992). Variables that contain a unit root were generated by a non-stationary data process of taking the first difference of the variables, resulting in spurious regression. When working with time series datasets, it is important to look for a unit root. If a unit root is found in a series, it means that more than one trend is present in the series. Since the data are at the macroeconomic level and time series, whether all variables are stationary or not are detected to avoid spurious regression using stationary test. There are different ways to test whether data is stationary or not, such as Lagrange multiplier (LM test) (Kwiatkowski et al., 1992), Augmented Dickey-Fuller (ADF) test (Becketti, 2013; Dickey and Fuller, 1979; Hamilton, 1994) and PP test (Phillips and Perron, 1988). This paper employed ADF and PP tests to determine a time series is stationatary or not. However, the regression specification of differencing could only provide the short-run estimates not the long-run estimates. ARDLs are standard least squares regressions which include lags of both the dependent variable and independent variables as regressors (Greene, 2008). Although ARDL models (the bound
  • 15. test approach) have been used in econometrics for decades, they have gained popularity in recent years as a method of examining long-run and cointegrating relationships between variables (Pesaran and Shin, 1998). Therefore, this problem could be solved by considering the cointegration and the error correction model (ECM) and obtaining both short- and long-run information (Nkoro and Uko, 2016). Additionally, ARDL models could yield consistent estimates of long run relationship, irrespective of whether the regressors are purely I(0) or I(1) or a mixture of both. To examine the long-run relationship between US hotel revenue and its determinats, the ARDL cointegration procedure is applied (Pesaran et al., 1996; Pesaran and Shin, 1998). The model with lower Akaike information criterion (AIC), Schwarz Bayesian criterion (SBC), Hannan-Quinn Criterion (HQ) and higher adjusted R2 performs better than the other models. Lagrange multiplier … Sheet1Column AColumn BColumn CYearRevenue $ in MillionsGrowth %2015138,58202017144,7291.7Average141883.61.46Sum425,6 514.41. exp In SLP 3, you will use an actual IBISWorld report to prepare an Excel spreadsheet and graphs. For the industry that you selected, you will use the “Industry Performance” tab. On the “Industry Performance” tab, scroll down to the bottom of the page to the section entitled, Historical Performance Data. Click the small arrow pointing
  • 16. downward (located at the top right of the Historical Performance Data section) and export the data to Excel. Once you have the Excel spreadsheet with the data for “Historical Performance Data”: 1.Highlight the data in column B, then create a Column Chart illustrating the Revenue ($m) data. For example, https://my-ibisworld- com.ezproxy.trident.edu/us/en/industry/48111a/industry- performance 1. Use the Excel formula to calculate the Average for each column of data within the sheet. 2. Add this information to the bottom of each column. 3. Use Excel to calculate the Sum for each column of data within the sheet. 4. Add this information below the row of Averages for each column. 5. Change the name of this Tab to Revenue Growth. https://my-ibisworld- com.ezproxy.trident.edu/us/en/industry/48111a/industry- performance Column A Column B Column C
  • 17. Year Revenue $ in Millions Growth % 2015 138,582 0.0 2017 144,729 1.7 Average 141883.6 1.46 Sum 425,651 4.4 Industry DataYearIndustry Turnover ($ million)Industry Gross Product ($ million)Number of Establishments (Units)Number of Enterprises (Units)Employment (People)Exports ($ million)Imports ($ million)Total Wages ($ million)Domestic Demand ($ million)International trips by US residents (Million)200542113.09344.31793.0309.089927.05820.3148.620 0646140.19707.61714.0301.078230.05092.1153.6200750106.21 1558.41721.0322.081137.05311.3159.8200855389.56248.91694. 0300.088352.05342.1160.5200944443.88364.71616.0276.09148 3.05682.5151.2201053925.412112.71506.0265.087840.05712.91 59.7201158890.110895.91519.0261.091616.06215.4166.120125 8785.010477.71465.0253.089913.05934.5173.4201358630.8130 01.11393.0255.090842.06459.7182.1201458374.912742.91405.0 258.085930.06246.7191.2201555421.817925.41404.0256.09925 4.07678.0203.2201650170.016509.81244.0229.099247.08037.22 14.1201749752.215667.51232.0226.0110691.09076.1224.62018 54291.017157.51256.0230.0108599.09720.3236.3201941169.81 5505.51116.0206.091265.08009.2244.4202038577.512443.8106
  • 18. 3.0197.087301.07630.1252.2202139390.412783.81049.0194.088 367.07736.8260.3202240376.413160.61034.0190.089818.07877. 2268.6202341458.713534.61019.0187.091026.08004.1277.2202 442623.213897.61014.0186.092520.08154.2286.5202543856.71 4230.41010.0185.093838.08294.3296.0202645827.514676.6101 0.0184.096017.08523.0305.8 Annual ChangeYearIndustry Turnover (%)Industry Gross Product (%)Number of Establishments (%)Number of Enterprises (%)Employment (%)Exports (%)Imports (%)Total Wages (%)Domestic Demand (%)International trips by US residents (%)20069.63.9-4.4-2.6-13.0- 12.53.420078.619.10.47.03.74.34.0200810.5-45.9-1.6- 6.88.90.60.42009-19.833.9-4.6-8.03.56.4-5.8201021.344.8-6.8- 4.0-4.00.55.620119.2-10.10.9-1.54.38.84.02012-0.2-3.8-3.6-3.1- 1.9-4.54.42013-0.324.1-4.90.81.08.85.02014-0.4-2.00.91.2-5.4- 3.35.02015-5.140.7-0.1-0.815.522.96.32016-9.5-7.9-11.4-10.6- 0.04.75.42017-0.8-5.1-1.0-1.311.512.94.920189.19.51.91.8- 1.97.15.22019-24.2-9.6-11.2-10.4-16.0-17.63.42020-6.3-19.8- 4.8-4.4-4.4-4.73.220212.12.7-1.3-1.51.21.43.220222.52.9-1.4- 2.11.61.83.220232.72.8-1.5-1.61.31.63.220242.82.7-0.5- 0.51.61.93.420252.92.4-0.4-0.51.41.73.320264.53.10.0- 0.62.32.83.3 Key RatiosYearIVA/Revenue (%)Imports/Demand (%)Exports/Revenue (%)Revenue per Employee ($'000)Wages/Revenue (%)Employees per estab.Average Wage ($)200522.2468.313.850.264722.5200621.0589.811.045.665091. 4200723.1617.610.647.165460.9200811.3626.99.652.260463.82 00918.8485.812.856.662115.4201022.5613.910.658.365037.620 1118.5642.810.660.367841.9201217.8653.810.161.466002.7201 322.2645.411.065.271109.2201421.8679.310.761.272695.22015 32.3558.413.970.777357.1201632.9505.516.079.880981.820173 1.5449.518.289.881994.9201831.6499.917.986.589506.3201937 .7451.119.581.887757.6202032.3441.919.882.187399.9202132. 5445.819.684.287553.0202232.6449.519.586.987701.8202332.6 455.519.389.387932.0202432.6460.719.191.288134.5202532.44 67.418.992.988389.6202632.0477.318.695.188765.5
  • 19. Key External DriversYearInbound trips by non-US residentsInternational trips by US residentsWorld price of crude oilCorporate profitPer capita disposable income20125.54.40.98.32.620137.05.0-0.9-1.1-2.020145.25.0- 7.53.53.320153.26.3-47.2-3.83.42016-1.85.4-15.7- 3.41.120171.04.923.3-2.12.320183.35.429.41.03.42019-0.61.6- 10.2-2.62.42020-22.1-20.7-32.70.21.9202127.622.726.9- 0.31.720222.32.41.9- 0.21.720232.32.32.00.21.720242.22.31.80.61.820252.22.31.90.7 1.9 Industry Financial RatiosRatioApr 09-Mar 10Apr 10-Mar 11Apr 11-Mar 12Apr 12-Mar 13Apr 13-Mar 14Apr 14-Mar 15Apr 15- Mar 16Apr 16-Mar 17Apr 17-Mar 18Apr 18-Mar 19Small (<$10m)Medium ($10-$50m)Large (>$50m)Current Ratio1.31.21.31.41.51.41.01.61.91.52.10.9Quick Ratio0.90.80.91.11.11.00.81.01.40.82.00.6Sales / Receivables (Trade Receivables Turnover)12.111.316.114.612.012.911.112.99.818.217.221.1Da ys' Receivables30.232.322.725.030.428.332.928.337.2Cost of Sales / Inventory (Inventory Turnover)41.3150.840.940.429.4167.771.837.560.843.1999.914. 7Days' Inventory8.82.48.99.012.42.25.19.76.0Cost of Sales / Payables (Payables Turnover)13.612.816.418.216.714.511.914.312.517.821.711.5D ays' Payables26.828.522.320.121.925.230.725.529.2Sales / Working Capital21.540.927.627.315.521.7- 303.216.511.722.16.5-62.9Earnings Before Interest & Taxes (EBIT) / Interest3.43.35.26.16.44.83.26.54.63.42.9Net Profit + Dep., Depletion, Amort. / Current Maturities LT Debt2.62.94.03.5Fixed Assets / Net Worth1.31.51.41.31.21.51.61.01.31.61.25.0Debt / Net Worth2.32.51.72.11.32.13.82.22.41.81.55.2Tangible Net Worth26.329.422.522.128.424.911.732.931.427.935.615.1Profit before Taxes / Net Worth, %18.823.523.432.824.228.620.628.124.527.526.925.2Profit before Taxes / Total Assets,
  • 20. %4.74.86.09.010.35.74.58.97.97.910.87.1Sales / Net Fixed Assets7.04.86.07.16.12.83.93.05.54.46.43.7Sales / Total Assets (Asset Turnover)2.02.12.72.61.91.81.71.82.02.02.02.0Cash from Trading34.430.728.734.940.147.536.135.434.446.3Cash after Operations7.75.25.85.39.09.32.46.711.811.412.9Net Cash after Operations7.24.95.76.311.210.03.08.011.17.513.0Cash after Debt Amortization1.92.11.72.72.73.71.23.23.50.73.6Debt Service P&I Coverage2.42.32.71.92.13.91.73.61.31.7Interest Coverage (Operating Cash)6.56.55.79.06.710.52.79.35.84.6Cash & Equivalents11.69.79.715.613.513.414.611.316.017.029.67.8Tra de Receivables (net)22.726.022.822.925.720.619.617.918.113.812.814.3Invento ry6.86.98.16.911.76.56.67.46.05.63.88.1All Other Current Assets3.62.53.83.93.44.83.62.54.43.12.73.8Total Current Assets44.745.244.449.254.345.344.439.144.539.648.834.0Fixed Assets (net)37.440.842.738.036.444.538.141.837.042.635.747.2Intangi bles (net)4.91.94.03.84.83.77.15.99.29.67.013.6All Other Non- Current Assets12.912.28.98.94.56.510.413.29.28.38.55.3Total Assets100.0100.0100.0100.0100.0100.0100.0100.0100.0100.010 0.0100.0Total Assets ($m)1325.51148.81365.6603.8596.0781.21527.21244.51638.114 21.543.5164.31213.7Notes Payable-Short Term6.06.28.25.16.85.28.94.41.83.13.23.6Current Maturities L/T/D4.03.84.12.62.72.95.13.03.74.12.95.6Trade Payables15.316.613.918.313.720.618.39.912.49.36.612.9Income Taxes Payable0.10.10.22.00.10.00.10.30.51.00.30.6All Other Current Liabilities11.816.116.115.217.012.213.29.09.811.79.815.0Total Current Liabilities37.242.942.443.240.340.845.626.728.129.122.837.8L ong Term Debt22.519.924.822.220.523.525.330.328.026.122.231.2Deferre d Taxes1.01.31.72.61.32.21.60.20.30.40.30.4All Other Non- Current Liabilities8.14.64.66.14.64.98.74.13.06.812.12.0Net
  • 21. Worth31.231.326.525.933.228.618.838.840.637.542.628.7Total Liabilities & Net Worth ($m)1325.51148.81365.6603.8596.0781.21527.21244.51638.114 21.543.5164.31213.7Maximum No. of Statements Used53.049.046.034.033.038.043.034.035.035.014.07.014.0 Industry StructureLevelTrendLife CycleMatureRevenue VolatilityHighCapital IntensityIndustry AssistanceHighSteadyConcentration LevelHighRegulation LevelHeavySteadyTechnology ChangeHighBarriers to EntryHighSteadyIndustry GlobalizationHighIncreasingCompetition LevelHighIncreasing Major PlayersNameMarket ShareAmerican Airlines Group Inc.36.90Delta Air33.30UAH32.10 Products & ServicesNameRevenue%Revenue $mPassenger transportation72.027,775.80Cargo transportation13.65,246.54Fees5.52,121.76Other8.93,433.40 Major MarketsNameRevenue%Revenue $mAtlantic39.715315.27Latin America31.312074.76Pacific22.18525.63Other6.92661.85 Industry Life CycleIndustryChange in Share of Economy (%)DVD, Game & Video Rental in US-14.91-13.50Solar Panel Manufacturing in US-12.70-13.29Tobacco Growing in US-9.83- 12.19Record Stores in US-8.02-9.82Computer Stores in US- 7.47-6.75Database & Directory Publishing in US-7.39- 7.70Book, Magazine & Newspaper Wholesaling in US-5.72- 7.97Office Supply Stores in US-5.51-9.20Movie & Video Distribution in US-5.32-4.92Coal Mining in US-5.32- 5.12Camera Stores in US-5.13-6.02Apparel Knitting Mills in US-4.95-5.09For-Profit Universities in US-4.71-2.46Postal Service in US-4.65-6.19Chicken Egg Production in US-4.25- 8.27Vending Machine Operators in US-4.05-2.62Magazine & Periodical Publishing in US-3.82-6.96Wood Pulp Mills in US- 3.78-1.29Paper Wholesaling in US-3.77-7.09Wired Telecommunications Carriers in US-3.75-4.81Industrial Banks in US-3.71-2.04Ink Manufacturing in US-3.50-6.85International Airlines in US-3.24-3.98Department Stores in US-3.21-8.56Art
  • 22. & Office Supply Manufacturing in US-3.18-5.04Office Stationery Manufacturing in US-3.16-4.39Printing Services in US-3.09-6.60Quick Printing in US-3.03-4.69Commodity Dealing and Brokerage in US-3.02-4.36Shoe Stores in US-3.02- 1.89News Syndicates in US-2.99-2.65Nonferrous Metal Refining in US-2.82-2.49Recordable Media Manufacturing in US-2.80-6.72Savings Banks & Thrifts in US-2.76-2.52Office Stationery Wholesaling in US-2.72-3.41Paper Product Manufacturing in US-2.57-2.65Cattle & Hog Wholesaling in US-2.47-3.72Jewelry Stores in US-2.44-5.06Formal Wear & Costume Rental in US-2.40-2.56Wind Turbine Manufacturing in US-2.40-9.00Florists in US-2.37-4.22Consumer Electronics Stores in US-2.35-3.35Book Stores in US-2.35-3.78Greeting Cards & Other Publishing in US-2.33-7.17Computer Peripheral Manufacturing in US-2.33-3.14Wholesale Trade Agents and Brokers in US-2.29-1.92Direct Mail Advertising in US-2.25- 2.71Camera & Film Wholesaling in US-2.24-2.90Women’s, Girls’ and Infants’ Apparel Manufacturing in US-2.12- 4.95Concrete Pipe & Block Manufacturing in US-2.08-1.54Gift Shops & Card Stores in US-2.04-2.19Dry Cleaners in US-1.86- 3.12Shoe Repair in US-1.83-2.65Toy, Doll & Game Manufacturing in US-1.75-1.73Leather Tanning & Finishing in US-1.70-0.86Debt Collection Agencies in US-1.65- 0.55Newspaper Publishing in US-1.64-6.37Electronic & Computer Repair Services in US-1.56-2.20Fuel Dealers in US- 1.50-3.20Plant & Flower Growing in US-1.46-0.58Radio Broadcasting in US-1.41-0.64Piece Goods, Notions & Other Apparel Wholesaling in US-1.41-3.81Automobile Electronics Manufacturing in US-1.38-3.27Automobile Brakes Manufacturing in US-1.36-2.18Car & Automobile Manufacturing in US-1.36-4.77Coated & Laminated Paper Manufacturing in US-1.35-3.37Business Certification & IT Schools in US-1.34-1.71Mail Order in US-1.32-2.28Computer & Printer Leasing in US-1.32-6.34Farm Product Storage & Warehousing in US-1.30-3.05Blind & Shade Manufacturing in US-1.29-1.48Jewelry Manufacturing in US-1.23-
  • 23. 3.16Communication Equipment Manufacturing in US-1.19- 2.84Printing in US-1.16-3.52Cement Manufacturing in US-1.15- 0.79Loan Administration, Check Cashing & Other Services in US-1.12-1.33Frozen Food Wholesaling in US-1.11-0.89Dye & Pigment Manufacturing in US-1.11-1.84Paper Bag & Disposable Plastic Product Wholesaling in US-1.11-0.52Ferrous Metal Foundry Products in US-1.08-1.46Men's Clothing Stores in US- 1.05-4.27Hog & Pig Farming in US-1.04-2.48Electrical Equipment Manufacturing in US-1.03-1.37Metal Can & Container Manufacturing in US-1.03-2.32Domestic Airlines in US-1.03-1.50Bowling Centers in US-1.00-1.30VoIP in US-0.97- 2.78Day Care in US-0.97-0.55Telecommunication Networking Equipment Manufacturing in US-0.94-1.89Egg & Poultry Wholesaling in US-0.94-4.92Orange & Citrus Groves in US- 0.91-0.66Hand Tool & Cutlery Manufacturing in US-0.89- 2.47Meat Markets in US-0.84-2.20Beef Cattle Production in US-0.83-5.04Bottled Water Production in US-0.82-1.53Cable Providers in US-0.80-3.43Millwork in US-0.78-0.84Satellite TV Providers in US-0.75-4.13Plastic Products Miscellaneous Manufacturing in US-0.74-1.44Circuit Board & Electronic Component Manufacturing in US-0.74-0.94Automobile Engine & Parts Manufacturing in US-0.73-3.10Small Specialty Retail Stores in US-0.71-2.58TV & Appliance Wholesaling in US- 0.70-1.85Inland Water Transportation in US-0.69-1.72Flower & Nursery Stock Wholesaling in US-0.69-1.70Jewelry & Watch Wholesaling in US-0.68-0.47Hay & Crop Farming in US-0.67- 2.16Gold & Silver Ore Mining in US-0.67-0.61Paper Mills in US-0.65-5.23Lumber & Building Material Stores in US-0.65- 0.67Carpet Mills in US-0.65-0.53Metalworking Machinery Manufacturing in US-0.62-0.91Metal Stamping & Forging in US-0.62-1.08Toy & Craft Supplies Wholesaling in US-0.60- 2.03Woodworking Machinery Manufacturing in US-0.60- 1.02Beef & Pork Wholesaling in US-0.60-3.45Sugarcane Harvesting in US-0.59-3.74Oilseed Farming in US-0.59- 0.37Home Furnishings Stores in US-0.58-0.95Musical Instrument & Supplies Stores in US-0.57-2.50SUV & Light
  • 24. Truck Manufacturing in US-0.57-0.69Textile Mills in US-0.55- 2.73Janitorial Equipment Supply Wholesaling in US-0.53- 1.85Marinas in US-0.51-0.69Metal Plating & Treating in US- 0.50-0.50Auto Parts Manufacturing in US-0.49-1.63Community Colleges in US-0.49-1.82Cut and Sew Manufacturers in US- 0.47-3.90Children's & Infants' Clothing Stores in US-0.47- 4.26Horse & Other Equine Production in US-0.46-1.69Engine & Turbine Manufacturing in US-0.46-1.64Business Service Centers in US-0.44-1.01Tire Manufacturing in US-0.44- 1.70Geophysical Services in US-0.44-3.20Wire & Spring Manufacturing in US-0.43-0.64Hardware Manufacturing in US- 0.43-2.35Weight Loss Services in US-0.42-3.38Motorcycle, Bike & Parts Manufacturing in US-0.41-3.03Wheat, Barley & Sorghum Farming in US-0.40-2.44Motorcycle Dealership and Repair in US-0.39-1.08Document Preparation Services in US- 0.36-2.78Fabric, Craft & Sewing Supplies Stores in US-0.36- 6.72Book Publishing in US-0.35-2.38Photofinishing in US- 0.34-4.19Sporting Goods Stores in US-0.32-1.52Copper, Nickel, Lead & Zinc Mining in US-0.31-0.69Lighting Fixtures Manufacturing in US-0.27-0.74Job Training & Career Counseling in US-0.25-2.24Golf Courses & Country Clubs in US-0.25-1.06Logging in US-0.25-1.45Specialty Food Stores in US-0.24-0.95Dairy Wholesaling in US-0.23-1.65Ocean & Coastal Transportation in US-0.23-0.52Nonferrous Metal Foundry Products Manufacturing in US-0.23-2.02Industrial Laundry & Linen Supply in US-0.22-1.00Nuclear Power in US- 0.20-1.54Homeowners' Associations in US-0.19-1.84Medical Instrument & Supply Manufacturing in US-0.18-1.28Ceramics Manufacturing in US-0.15-2.63Lighting & Bulb Manufacturing in US-0.13-3.67Civic, Social & Youth Organizations in US- 0.12-1.20Canned Fruit & Vegetable Processing in US-0.12- 2.61Bars & Nightclubs in US-0.10-0.59Electric Power Transmission in US-0.10-0.47Appliance Repair in US-0.09- 1.43Machinery Maintenance & Heavy Equipment Repair Services in US-0.08-1.33Employment & Recruiting Agencies in US-0.08-0.61Agribusiness in US-0.05-1.40Rubber Product
  • 25. Manufacturing in US-0.05-1.55Heating & Air Conditioning Equipment Manufacturing in US-0.05-1.24Chemical Product Manufacturing in US-0.04-2.14Navigational Instrument Manufacturing in US-0.04-1.04Machine Shop Services in US- 0.03-0.72New Car Dealers in US-0.02-2.17Juice Production in US0.07-2.50Auto Parts Wholesaling in US0.08-1.06Soybean Farming in US0.09-4.33Gasoline & Petroleum Bulk Stations in US0.11-1.80Furniture Repair & Reupholstery in US0.11- 1.77Automobile Metal Stamping in US0.12-2.25Pump & Compressor Manufacturing in US0.12-2.38Laundromats in US0.13-1.09Fish & Seafood Wholesaling in US0.13-0.56Glasses & Contact Lens Manufacturing in US0.16-1.33Hobby & Toy Stores in US0.17-1.00Chemical Wholesaling in US0.17- 0.64Refrigeration Equipment Wholesaling in US0.18- 0.65Mineral & Phosphate Mining in US0.21-2.97Media Buying Agencies in US0.22-1.29Computer Manufacturing in US0.23- 1.07Inorganic Chemical Manufacturing in US0.23-3.93Paint Wholesaling in US0.24-1.77Dairy Product Production in US0.27-1.95Community Housing & Homeless Shelters in US0.28-1.74Furniture Stores in US0.28-0.77Public Schools in US0.28-0.68Bridge & Elevated Highway Construction in US0.29-0.65Fruit & Vegetable Markets in US0.30- 0.76Commercial Leasing in US0.32-0.79HR Consulting in US0.32-1.41Cabinet & Vanity Manufacturing in US0.34- 0.53Chicken & Turkey Meat Production in US0.35-2.24Glass Product Manufacturing in US0.38-0.57Fruit & Vegetable Wholesaling in US0.38-1.08Confectionery Wholesaling in US0.38-1.89Plastic Film, Sheet & Bag Manufacturing in US0.39-0.70Women's Clothing Stores in US0.39-6.16Cookie, Cracker & Pasta Production in US0.41-2.94Orphanages & Group Homes in US0.41-2.00Mining, Oil & Gas Machinery Manufacturing in US0.42-2.26Corn, Wheat & Soybean Wholesaling in US0.42-2.80Public Transportation in US0.45- 0.52Supermarkets & Grocery Stores in US0.46-0.38Beer Wholesaling in US0.47-0.40Auto Parts Stores in US0.48- 1.38Footwear Wholesaling in US0.48-5.11Law Firms in
  • 26. US0.48-0.95Dry Docks & Cargo Inspection Services in US0.49- 2.34Vegetable Farming in US0.50-1.47Steel Rolling & Drawing in US0.51-0.88Religious Organizations in US0.51- 0.92Automobile Wholesaling in US0.53-1.69National & State Parks in US0.53-1.07Gym & Exercise Equipment Manufacturing in US0.56-0.41Automobile Interior Manufacturing in US0.57- 1.16Home Builders in US0.59-1.09Chiropractors in US0.60- 0.36Automobile Transmission Manufacturing in US0.60- 1.44Forest Support Services in US0.61-0.78ATV, Golf Cart & Snowmobile Manufacturing in US0.62-2.07Sanitary Paper Product Manufacturing in US0.62-1.92Computer & Packaged Software Wholesaling in US0.63-3.03Frozen Food Production in US0.63-0.79Hosiery Mills in US0.68-3.01Media Representative Firms in US0.71-0.86Aluminum Manufacturing in US0.71- 1.21Valve Manufacturing in US0.72-0.65Paperboard Mills in US0.72-1.52Truck Rental in US0.73-0.48Billboard & Sign Manufacturing in US0.73-1.02Electronic Part & Equipment Wholesaling in US0.74-1.47Shoe & Footwear Manufacturing in US0.81-1.13Celebrity & Sports Agents in US0.82-0.79Tractors & Agricultural Machinery Manufacturing in US0.82-2.02Soft Drink, Baked Goods & Other Grocery Wholesaling in US0.83- 1.51Leather Good & Luggage Manufacturing in US0.84- 0.61Athletic & Sporting Goods Manufacturing in US0.87- 0.80Pesticide Manufacturing in US0.89-2.79Women's & Children's Apparel Wholesaling in US0.89-1.50Ice Cream Production in US0.92-0.56Household Furniture Manufacturing in US0.94-1.31Rail Transportation in US0.95-0.46Construction Machinery Manufacturing in US0.98-1.42Plastic Bottle Manufacturing in US0.99-1.94Automobile Steering & Suspension Manufacturing in US1.04-1.18Sugar Processing in US1.11-0.64Chocolate Production in US1.13-0.90Crop Services in US1.15-1.62Apartment Rental in US1.17-1.78Paint Manufacturing in US1.19-2.18Lotteries & Native American Casinos in US1.19-1.05Scientific & Economic Consulting in US1.22-0.50Environmental Consulting in US1.23- 0.76Community Food Services in US1.27-0.53Blood & Organ
  • 27. Banks in US1.27-1.38Single Location Full-Service Restaurants in US1.28-0.38Hunting & Trapping in US1.29-0.76Soap & Cleaning Compound Manufacturing in US1.31-1.20Drug, Cosmetic & Toiletry Wholesaling in US1.31-0.63Maids, Nannies & Gardeners in US1.35-0.42Asphalt Manufacturing in US1.35-0.85Abrasive & Sandpaper Manufacturing in US1.40- 0.83Farm, Lawn & Garden Equipment Wholesaling in US1.44- 0.67Office Furniture Manufacturing in US1.46-0.73Coal & Natural Gas Power in US1.47-1.72Soda Production in US1.48- 2.85Securities Brokering in US1.48-1.21Medical Device Manufacturing in US1.53-1.64Boiler & Heat Exchanger Manufacturing in US1.53-1.48Oil & Gas Field Services in US1.55-1.70Promotional Products in US1.55-0.98Direct Selling Companies in US1.56-1.48Fertilizer Manufacturing in US1.56- 1.91Copper Rolling, Drawing & Extruding in US1.58- 2.59Primary Care Doctors in US1.58-0.48Petroleum Refining in US1.60-1.89Gypsum Product Manufacturing in US1.61- 1.28Men's & Boys' Apparel Manufacturing in US1.67- 0.75Train, Subway & Transit Car Manufacturing in US1.82- 0.89Storage & Warehouse Leasing in US1.82-0.91Photography in US1.83-0.82Wireless Telecommunications Carriers in US1.85-1.49Animal Food Production in US1.86-2.28Cigarette & Tobacco Products Wholesaling in US1.87-4.39Syrup & Flavoring Production in US1.88-5.34Water Supply & Irrigation Systems in US1.89-1.40Psychiatric Hospitals in US1.92- 0.93Furniture Wholesaling in US1.93-0.47Moving Services in US1.94-0.92Tank & Refrigeration Trucking in US1.98- 0.44Casino Hotels in US2.01-0.90Copier & Office Equipment Wholesaling in US2.03-2.68Bread Production in US2.05- 0.87Open-End Investment Funds in US2.09-0.57Metal Tank Manufacturing in US2.10-0.95Specialized Storage & Warehousing in US2.11-0.42Swimming Pool Construction in US2.11-0.55Family Clothing Stores in US2.12-1.49Audio Production Studios in US2.15-0.81Tourism in US2.16- 0.65Screw, Nut & Bolt Manufacturing in US2.20-0.49Timber Services in US2.20-1.14Hotels & Motels in US2.21-
  • 28. 0.48Seafood Preparation in US2.27-1.08Health Stores in US2.28-1.47Synthetic Fiber Manufacturing in US2.29- 0.41Racing & Individual Sports in US2.32-3.09Industrial Equipment Rental & Leasing in US2.40-1.02Vitamin & Supplement Manufacturing in US2.56-1.12Pharmacies & Drug Stores in US2.58-0.40Language Instruction in US2.62- 2.39Wedding Services in US2.64-1.94Petrochemical Manufacturing in US2.84-2.04Intellectual Property Licensing in US2.84-1.75Human Resources & Benefits Administration in US3.05-0.57Snack Food Production in US3.14-2.96Advertising Agencies in US3.23-0.80Flour Milling in US3.27-1.95Cosmetic & Beauty Products Manufacturing in US3.36-2.38Steam & Air- Conditioning Supply in US3.61-1.45Rail Maintenance Services in US3.73-0.79Tugboat & Shipping Navigational Services in US3.80-0.55Cereal Production in US3.95-1.83Reinsurance Carriers in US4.11-6.23Sheep Farming in US4.30-0.91Coffee Production in US5.12-2.58Dairy Farms in US-4.481.36Coal & Ore Wholesaling in US-3.692.96Corn Farming in US-2.13- 0.30Land Development in US-1.65-0.00Satellite Telecommunications Providers in US-1.583.57Credit Card Issuing in US-1.421.30Gas Stations in US-1.361.03Fish & Seafood Aquaculture in US-1.310.58Life Insurance & Annuities in US-1.230.31Grocery Wholesaling in US-1.090.12Commercial Banking in US-0.931.57Carpet Cleaning in US-0.920.24Tool & Hardware Wholesaling in US-0.900.74Heavy Engineering Construction in US-0.83-0.14Recyclable Material Wholesaling in US-0.764.56Alarm, Horn & Traffic Control Equipment Manufacturing in US-0.640.17Telecommunications Resellers in US-0.571.32Clay Brick & Product Manufacturing in US- 0.540.91Iron Ore Mining in US-0.413.02Art Dealers in US- 0.370.73Plastics & Rubber Machinery Manufacturing in US- 0.350.88Plastic Pipe & Parts Manufacturing in US- 0.310.57Gasoline & Petroleum Wholesaling in US- 0.231.79Movie Theaters in US-0.231.06Historic Sites in US- 0.230.77Plastics Wholesaling in US-0.220.16Stone Mining in US-0.200.30Cable Networks in US-0.044.40Mattress
  • 29. Manufacturing in US-0.02-0.33Wiring Device Manufacturing in US-0.020.01Packaging & Labeling Services in US-0.011.34Wire & Cable Manufacturing in US0.03-0.15Oil Change Services in US0.04-0.02Nursery & Garden Stores in US0.060.08Gas Stations with Convenience Stores in US0.060.24Stone, Concrete & Clay Wholesaling in US0.090.07Used Car Parts Wholesaling in US0.093.44Meat, Beef & Poultry Processing in US0.10- 0.35Recreational Vehicle Dealers in US0.161.25Metal Wholesaling in US0.162.79Sawmills & Wood Production in US0.180.60Tire Dealers in US0.20-0.13Printing, Paper, Food, Textile & Other Machinery Manufacturing in US0.22-0.16Real Estate Appraisal in US0.230.64Wood Paneling Manufacturing in US0.240.67Fish & Seafood Markets in US0.24-0.16Precast Concrete Manufacturing in US0.24-0.22Costume & Team Uniform Manufacturing in US0.25-0.20Restaurant & Hotel Equipment Wholesaling in US0.270.26Eye Glasses & Contact Lens Stores in US0.320.30Conveyancing Services in US0.320.19Semiconductor & Circuit Manufacturing in US0.330.35Copier & Optical Machinery Manufacturing in US0.341.15Stock & Commodity Exchanges in US0.353.28Laminated Plastics Manufacturing in US0.370.57Water & Sewer Line Construction in US0.380.22Boat Building in US0.42-0.14Wood Pallets & Skids Production in US0.42-0.30Podiatrists in US0.430.39Accounting Services in US0.440.05Semiconductor Machinery Manufacturing in US0.440.73Urethane Foam Manufacturing in US0.460.26Margarine & Cooking Oil Processing in US0.47- 0.13Loan Brokers in US0.490.58Hardware Stores in US0.500.91Excavation Contractors in US0.510.63Cemetery Services in US0.51-0.23Cardboard Box & Container Manufacturing in US0.522.65Fishing in US0.541.29Lumber Wholesaling in US0.550.38Public School Bus Services in US0.550.52Funeral Homes in US0.560.38Commercial Building Construction in US0.581.40Parking Lots & Garages in US0.590.63Forklift & Conveyor Manufacturing in US0.650.20Trade & Technical Schools in US0.65-0.16Audio &
  • 30. Video Equipment Manufacturing in US0.660.96Ski & Snowboard Resorts in US0.680.75Surveying & Mapping Services in US0.680.59Nonferrous Metal Rolling & Alloying in US0.690.15Laboratory Supply Wholesaling in US0.690.14Campgrounds & RV Parks in US0.690.69Heating & Air Conditioning Wholesaling in US0.701.25Adhesive Manufacturing in US0.74-0.19Major Household Appliance Manufacturing in US0.741.28Billboard & Outdoor Advertising in US0.74-0.29Insurance Brokers & Agencies in US0.75- 0.29Prefabricated Home Manufacturing in US0.753.05Warehouse Clubs & Supercenters in US0.75- 0.09Market Research in US0.760.62Road & Highway Construction in US0.78-0.26Aircraft Maintenance, Repair & Overhaul in US0.780.55Home Improvement Stores in US0.780.91Auto Leasing, Loans & Sales Financing in US0.790.29Masonry in US0.800.18Security Services in US0.841.02Retirement & Pension Plans in US0.8437.20Electrical Equipment Wholesaling in US0.860.31Print Advertising Distribution in US0.861.92Floor … WWW.IBISWORLD.COM International Airlines in the US September 2019 1 IBISWorld Industry Report 48111a International Airlines in the US September 2019 Qing Zheng Prepare for takeoff: Rising disposable income will fuel increased passenger travel, boosting revenue 2 About this Industry 2 Industry Definition
  • 31. 2 Main Activities 2 Similar Industries 3 Additional Resources 4 Industry at a Glance 5 Industry Performance 5 Executive Summary 5 Key External Drivers 7 Current Performance 9 Industry Outlook 11 Industry Life Cycle 13 Products and Markets 13 Supply Chain 13 Products and Services 14 Demand Determinants 15 Major Markets 16 International Trade 17 Business Locations 19 Competitive Landscape 19 Market Share Concentration 19 Key Success Factors
  • 32. 19 Cost Structure Benchmarks 21 Basis of Competition 22 Barriers to Entry 23 Industry Globalization 24 Major Companies 24 United Continental Holdings Inc. 25 American Airlines Group Inc. 26 Delta Air Lines Inc. 27 JetBlue Airways Corporation 28 Operating Conditions 28 Capital Intensity 29 Technology and Systems 29 Revenue Volatility 30 Regulation and Policy 31 Industry Assistance 33 Key Statistics 33 Industry Data 33 Annual Change 33 Key Ratios
  • 33. 34 Industry Financial Ratios 35 Jargon & Glossary www.ibisworld.com | 1-800-330-3772 | [email protected] WWW.IBISWORLD.COM International Airlines in the US September 2019 2 The International Airlines industry provides air transportation to passengers and cargo over regular routes and schedules. These services include any flights that either end or originate internationally. Scheduled air passenger carriers, including commuter and helicopter carriers (except scenic and sightseeing), are included in this industry. Airlines that provide international mail transportation on a contract basis are also included in this industry. The primary activities of this industry are Scheduled international passenger air transport Scheduled international cargo and freight air transport (except air couriers) Scheduled commuter international passenger air transport Scheduled charter international passenger air transport
  • 34. 33641a Aircraft, Engine & Parts Manufacturing in the US This industry provides factory conversion, overhaul and rebuilding of aircraft. 48111b Domestic Airlines in the US This industry provides air transportation of passengers and cargo over regular routes and on regular schedules. 48121 Charter Flights in the US This industry provides international air transportation of passengers, cargo or specialty flying services with no regular routes and regular schedules are classified. 48211 Rail Transportation in the US The industry comprises companies that operate railroads across the United States. This includes large railroads and regional and local line-haul railroads that carry freight and passengers. 48311 Ocean & Coastal Transportation in the US This industry provides deep-sea, coastal, Great Lakes and St. Lawrence Seaway water transportation. The deep-sea shipping activity includes US-flagged vessels and non- US-flagged vessels. 48811 Airport Operations in the US This industry includes businesses that operate international, national or civil airports or public flying fields. 49222 Couriers & Local Delivery Services in the US This industry provides international air courier services for the market. Industry Definition
  • 35. Main Activities Similar Industries About this Industry The major products and services in this industry are Cargo transportation Fees Passenger transportation Other WWW.IBISWORLD.COM International Airlines in the US September 2019 3 About this Industry For additional information on this industry www.airlines.org Airlines for America www.bts.gov Bureau of Transportation Statistics www.faa.gov Federal Aviation Administration www.census.gov US Census Bureau
  • 36. Additional Resources IBISWorld writes over 1000 US industry reports, which are updated up to four times a year. To see all reports, go to www.ibisworld.com WWW.IBISWORLD.COM International Airlines in the US September 2019 4 % c ha ng e 8 -2 0 2 4 6 2614 16 18 20 22 24Year Inbound trips by non-US residents
  • 37. SOURCE: WWW.IBISWORLD.COM % c ha ng e 20 -20 -10 0 10 2511 13 15 17 19 21 23Year Revenue Employment Revenue vs. employment growth Products and services segmentation (2019) 72.0% Passenger transportation 13.6% Cargo transportation 8.9%
  • 38. Other 5.5% Fees Key Statistics Snapshot Industry at a Glance International Airlines in 2019 Industry Structure Life Cycle Stage Mature Revenue Volatility Medium Capital Intensity Medium Industry Assistance High Concentration Level High Regulation Level Heavy Technology Change High Barriers to Entry High Industry Globalization High Competition Level High Revenue $52.9bn Profit $4.8bn
  • 39. Wages $8.6bn Businesses 226 Annual Growth 19–24 1.9% Annual Growth 14–19 -1.7% Key External Drivers Inbound trips by non-US residents International trips by US residents World price of crude oil Corporate profit Per capita disposable income Market Share United Continental Holdings Inc. 31.1% American Airlines Group Inc. 25.9% Delta Air Lines Inc. 24.1%
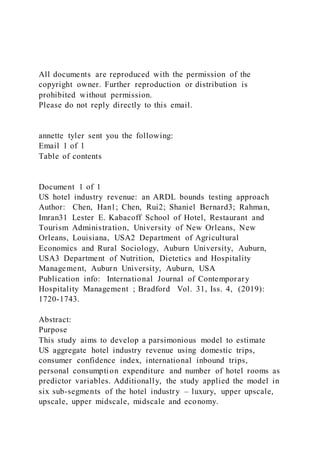
  • 40. p. 24 p. 5 FOR ADDITIONAL STATISTICS AND TIME SERIES SEE THE APPENDIX ON PAGE 33 SOURCE: WWW.IBISWORLD.COM WWW.IBISWORLD.COM International Airlines in the US September 2019 5 Key External Drivers Inbound trips by non-US residents International tourists account for a significant portion of passengers on international flights. Moreover, the majority of foreign visitors arrive by plane, and many take US-based airlines. Consequently, an increase in the number of foreign travelers visiting the United States generally leads to greater demand for industry services. Inbound trips by non-US residents are expected to increase in 2019, representing a potential opportunity for the industry. International trips by US residents US residents seeking to travel internationally represent an important source of revenue for the International Airlines industry. Therefore, an increase in the number of international trips made
  • 41. by US residents is expected to generate significant revenue for industry operators. The number of international trips by US residents is expected to increase in 2019. World price of crude oil Given that jet fuel is refined from crude oil, when global crude oil prices decline, jet fuel Executive Summary The International Airlines industry has declined over the five years to 2019 despite rising levels of per capita disposable income and increased travel activity both into and out of the United States. In recent years, mounting competition from foreign competitors and chronic overcapacity within the industry’s cargo transportation segment have forced industry operators to slash ticket prices and reduce freight shipping rates, causing industry revenue to decline. Moreover, substantial declines in the world price of crude oil led the price of jet fuel to plummet during the five-year period, preventing operators from generating revenue through fuel surcharge fees. As a result, industry revenue is anticipated to decrease at an annualized rate of 1.7% to $52.9 billion over the five years to 2019, including an expected 1.3% decrease in 2019 alone. This industry is dominated by a few large-scale players; the industry’s four largest companies are expected to generate over 80.0% of total industry revenue in
  • 42. 2019. Prior to the five-year period, poor profitability and increasing competition forced several airlines out of business, leading to industry consolidation. Additionally, American Airlines and US Airways merged in December 2013, consolidating as American Airlines Group Inc. In turn, these major companies have been able to access significant economies of scale, investing in new technologies and ordering larger, more fuel-efficient aircraft to reduce operating costs. With fuel prices still below historical levels, industry profit is also expected to increase during the current five-year period. Industry revenue is expected to recover over the next five years as continued growth in disposable income, corporate profit and US travel activities are anticipated to be bolstered by a substantial decrease in the price of jet fuel. However, industry revenue will continue to be constrained by growing competition from foreign operators and alternative modes of transportation. To maintain profitability despite intense competition, operators’ ability to increase their aircraft’s load factor, a measure of capacity utilization, is critical for industry operators. Overall, industry revenue is forecast to increase at an annualized rate of 1.9% to $58.1 billion over the five years to 2024. Industry Performance
  • 43. Executive Summary | Key External Drivers | Current Performance Industry Outlook | Life Cycle Stage Industry revenue is expected to recover amid continued growth in disposable income, corporate profit and US travel activity WWW.IBISWORLD.COM International Airlines in the US September 2019 6 Industry Performance Key External Drivers continued prices tend to decline as well, causing major airlines to remove fuel surcharges and reduce ticket prices to remain competitive. In turn, lower prices limit industry revenue growth. The world price of crude oil is forecast to decrease slightly in 2019; however, the volatile nature of world oil prices will likely continue to pose a potential threat to the industry. Corporate profit International business travel represents a significant source of revenue for industry operators. When corporate profit is high, companies are more likely to pay for business travel and travelers are more likely to purchase first-class
  • 44. tickets and other high-margin industry products. Corporate profit is expected to increase in 2019. Per capita disposable income The majority of industry revenue comes from discretionary consumer spending on leisure travel. When per capita disposable income rises, consumers are able to spend more on vacations and other nonessential international trips. Per capita disposable income is expected to increase in 2019. % c ha ng e 7 3 4 5 6 2614 16 18 20 22 24Year International trips by US residents SOURCE: WWW.IBISWORLD.COM
  • 45. % c ha ng e 8 -2 0 2 4 6 2614 16 18 20 22 24Year Inbound trips by non-US residents WWW.IBISWORLD.COM International Airlines in the US September 2019 7 Industry Performance Current Performance Despite rising levels of airline passenger
  • 46. traffic and improving US trade activity, the International Airlines industry has declined over the past five years. This industry, which includes US-based airlines that transport passengers and cargo internationally, has suffered from volatile fuel prices, mounting competition from foreign airlines and global economic and political uncertainties. Consequently, industry revenue is estimated to decrease at an annualized rate of 1.7% to $52.9 billion over the five years to 2019. % c ha ng e 10 -10 -5 0 5 2511 13 15 17 19 21 23Year Industry revenue SOURCE: WWW.IBISWORLD.COM
  • 47. Passenger and cargo traffic The industry is cyclical and highly sensitive to economic factors that affect the number of inbound and outbound international travelers. Economic growth, rising consumer spending and improving corporate profit have driven demand from both business and leisure travelers to increase over the past five years; as a result, the total number of international trips taken by US residents grew during the current five-year period. Moreover, due to global economic growth and the expansion of the global middle class, the number of trips to the United States by non-US residents is also estimated to increase. This increase in flights into and out of the United States has provided the industry with an expanding customer base. However, despite overall expansion, passenger traffic growth slowed down over the past five years, and inbound trips actually declined in 2016. This decline in inbound traffic was due to slowed economic growth in emerging markets and political instability associated with global trade tensions and conflicts, as well as the appreciation of the US dollar. In particular, a strengthening dollar has
  • 48. made it more expensive for foreign visitors to travel to the United States. Additionally, overall freight volume transported by both cargo-exclusive and passenger airlines has only recently begun to grow in a meaningful way. Fuel prices, capacity and competition Diminishing passenger traffic only partially explains the industry’s revenue declines over the past five years, especially given the overall increase in air traffic. Factors such as fuel prices, capacity and competition are the other reasons why revenue dropped. Fuel prices, in particular, had the largest effect. The purchase of jet fuel represents a substantial cost for industry operators, and fuel expenses can range from between 20.0% and 40.0% of an international airline’s total purchase costs. As a result, large-scale movements in jet fuel prices can have a significant effect on airline operating costs and profit margins. However, when the price of jet fuel increases, industry carriers are also able to generate significant revenue by implementing fuel surcharges and increasing ticket prices and freight rates, shifting the burden of rising fuel WWW.IBISWORLD.COM International Airlines in the US September 2019 8
  • 49. Industry Performance Fuel prices, capacity and competition continued costs to consumers. Nonetheless, when oil prices plunged during the five-year period, jet fuel prices followed. Consequently, airlines were forced to remove fuel surcharges and reduce prices to remain competitive, causing substantial revenue declines in 2015 and 2016. As fuel prices fluctuated, industry players also had to deal with increased competition and capacity. To meet growing demand and mitigate fuel costs, airlines have increasingly invested in new aircraft that burn less fuel, fly longer distances and transport more people and cargo. As result, capacity slightly outgrew demand, reducing industry load factor (a measure of capacity utilization of airline services) from 82.4% to 80.6% in 2016. Consequently, airline pricing ability was limited. Moreover, industry players have had to contend with increased competition from foreign airlines. Competitors such as Emirates maintain substantial fleets of wide-body aircraft, and many foreign carriers are subsidized or owned by government bodies,
  • 50. enabling them to grow relatively quickly and expand their share of the global airline market. Meanwhile, the increased efficiency of aircraft has enabled long- range budget airlines such as Norwegian Air to enter the international market. As a result of greater competition, industry players have had to lower prices and lose market share. The introduction of aircraft with more cargo capacity and the overall expansion of the global aircraft fleet has also forced down freight rates, further pressuring industry revenue. Nevertheless, a recent increase in jet fuel prices and the pickup in passenger and cargo traffic to and from the United States helped industry revenue to increase 9.3% in 2018. Overall, continued intense competition and volatile fuel prices are expected to hinder industry growth. In 2019, jet fuel prices are expected to fall again, leading to a 1.3% decline in industry revenue. Industry structure Following a period of significant merger and acquisition activity on the part of the industry’s largest players, the industry is now overwhelmingly dominated by large- scale operators, such as United Continental Holdings Inc. and American Airlines Group Inc. In fact, the industry’s four largest players are expected to account for over 80.0% of total industry revenue in 2019, which acts as a significant barrier to entry for small-scale players attempting to gain market share in this industry. Moreover,
  • 51. external pressure on industry airfare and freight rates has kept the number of companies entering the industry low and mostly limited to foreign carriers, which are not considered part of the US industry. Consequently, the number of industry enterprises has decreased at an annualized rate of 2.6% to 226 companies over the five years to 2019. Conversely, the pickup in capacity and slowly rising demand encouraged operators to hire more staff, especially after years of stagnant employment. Therefore, over the five years to 2019, the number of industry employees is expected to climb at an annualized rate of 4.7% to 107,862. At the same time, the average industry profit margin (measured as earnings before interest and taxes) has recently improved due to decreasing fuel costs and increasing industry consolidation. However, at 9.1% of industry revenue, average profit is still expected to have grown over the past five years, rising from 7.5% in 2014, when fuel prices were far higher. The industry is now overwhelmingly dominated by large-scale operators WWW.IBISWORLD.COM International Airlines in the US September 2019 9 Industry Performance
  • 52. Industry Outlook Over the five years to 2024, the International Airlines industry is expected to gradually expand from recent setbacks, although it will be contingent upon sustained growth in US and global economic conditions and travel activity. The combination of growing air travel demand and higher fuel surcharges are expected to bolster revenue. At the same time, competition from an array of global airlines will continue to place downward pressure on industry ticket prices, benefiting airline customers while reducing revenue opportunities for airline companies. Nevertheless, industry revenue is forecast to grow at an annualized rate of 1.9% to $58.1 billion over the five years to 2024. Traffic Rising per capita disposable income and an expanding service portfolio offered by industry airlines are expected to support revenue growth moving forward. As the size of the global middle class increases, demand for industry services from foreign consumers is forecast to rise, and the number of inbound trips by non-US residents is projected to increase at an annualized rate of 3.8% over the next five years. Similarly, as domestic consumer spending continues to rise, the number of
  • 53. international trips taken by US residents is expected to grow as well, increasing at an annualized rate of 3.2% during the same period. This growing consumer demand for air travel into and out of the United States will likely generate increased demand for the industry’s passenger transportation services, while growing levels of domestic per capita disposable income will enable greater numbers of passengers to purchase first-class seats, extra baggage allowances and other amenities that most international airlines offer. Growing levels of trade are also projected to increase freight volumes, increasing demand for industry cargo services. Furthermore, over the five years to 2019, the world price of crude oil is anticipated to decrease at a slower rate, an annualized rate of 0.2%. The recovery in jet fuel prices will enable airlines to raise fuel surcharges and thus revenue. In addition, according to the Federal Aviation Administration, industry load factor, which measures industry capacity utilization, is forecast to reach 81.1% by 2024, an improvement over levels posted over the past five years. This indicates that operators will improve their capacity management, leading to greater demand per seat and granting operators more leeway in pricing.
  • 54. However, operators will continue to deal with competition from foreign airlines, many of which continue to expand their operations, putting pricing pressure on various routes. Moreover, industry performance will be exposed to various global macroeconomic headwinds. With global trade tensions anticipated to persist, the rate of globalization may decrease, with various trade and travel barriers potentially going up. Consequently, global air travel may decline or grow slower, tempering demand. Moreover, a decrease in emerging market growth or increased political uncertainty may further erode demand for air travel. Operators will continue to deal with competition from foreign airlines WWW.IBISWORLD.COM International Airlines in the US September 2019 10 Industry Performance Improving profit margins The combination of increasing demand, improved load factor and the introduction of more-efficient aircraft are forecast to increase average industry
  • 55. profit, measured as earnings before interest and taxes, from 9.1% of revenue in 2019 to 9.7% in 2024. A higher load factor means that aircraft are fuller, enabling carriers to spread costs across more customers and run their operations more efficiently. At the same time, new aircraft models are more efficient because they use less fuel, fly over longer ranges and can carry more passengers and cargo. However, compared with the prior period, rising fuel costs will likely keep margins under pressure. In addition, moving forward, the industry’s profit margins are also expected to be constrained by the rising costs of capping and trading greenhouse gas emissions and competition from foreign airlines. Limited industry participation The combination of high barriers to entry, domination by incumbents and competition from foreign airlines will likely lead to further industry consolidation. Therefore, over the five years to 2024, the number of industry players is projected to fall at an annualized rate of 0.7% to reach 218. Conversely, the expansion in demand and capacity will encourage carriers to hire more staff. Consequently, the number of industry employees is anticipated to climb at an
  • 56. annualized rate of 1.6% to 116,578 people during the coming five-year period. The expansion in demand and capacity will encourage carriers to hire more staff WWW.IBISWORLD.COM International Airlines in the US September 2019 11 Industry Performance The total number of industry operators is decreasing The industry has experienced major consolidation, boosting market share concentration Technological developments in the industry are moderate There is wholehearted market acceptance of industry services Life Cycle Stage WWW.IBISWORLD.COM International Airlines in the US September 2019 12 Industry Performance Industry Life Cycle The International Airlines industry is in the mature phase of its economic life cycle. The industry’s contribution to the
  • 57. US economy, as measured by industry value added, is projected to increase at an annualized rate of 3.5% over the 10 years to 2024. Comparatively, US GDP is expected to grow at an annualized rate of 2.0% during the same period. Typically, IVA growth that much greater than GDP indicates a growing industry. However, much of the industry’s IVA growth is due to the industry’s growing wage expense caused by increasing capacity and average wages. Mergers and acquisitions are prominent in the industry as major players attempt to expand their market share. For example, in 2013, American Airlines and US Airways merged to form the largest airline in the world. In 2016, Alaska Air Group Inc. acquired Virgin American Inc. to expand west coast presence and customer base. Industry operators also frequently form alliances to expand their geographical reach and share the costs associated with transportation. Many of the industry’s largest shipping alliances, such as Star Alliance, SkyTeam and One World, were formed in recent decades as companies attempted to improve operations in a highly competitive environment. As a result, the industry’s major players have experienced a period of prolonged consolidation, and the industry’s four largest companies are expected to
  • 58. account for over 80.0% of total industry revenue in 2019. This trend is indicative of a mature industry. Additionally, technological upgrades in the industry are moderate. While companies are spending generously on new aircraft and machinery, the level of change from previous models is declining. Over the past five years, there has been an increase in the focus on fuel-efficient technology and cost- reduction machinery. While technological upgrades are a consistent source of investment for airlines, benefits from each upgrade are slowing. This industry is Mature WWW.IBISWORLD.COM International Airlines in the US September 2019 13 Products and Services Passenger transportation Passenger transportation is the main service offered by the International Airlines industry, accounting for an estimated 72.0% of industry revenue in 2019. Most revenue is earned through coach travel, while a relatively large portion of profit is earned through
  • 59. business and first-class travel. Mainline carriers are flag carriers that have large and well-developed home markets. These carriers also have the ability to exploit open skies agreements through global alliances, and major passenger airlines generally focus on long-haul flights between and beyond their alliance’s main Products & Markets Supply Chain | Products and Services | Demand Determinants Major Markets | International Trade | Business Locations KEY BUYING INDUSTRIES 48851 Freight Forwarding Brokerages & Agencies in the US This industry uses international airlines to arrange the transportation of freight between shippers and carriers. 49222 Couriers & Local Delivery Services in the US This industry uses international airlines to transport packages and parcels to international destinations. NN002 Tourism in the US This industry relies on international airlines to transport visitors to the United States. KEY SELLING INDUSTRIES 33641a Aircraft, Engine & Parts Manufacturing in the US This industry provides aircraft and associated machinery to international airlines. 42472 Gasoline & Petroleum Wholesaling in the US
  • 60. This industry supplies fuel and lubricants to international airlines. 48811 Airport Operations in the US This industry provides space for international airlines to unload and load passengers and cargo. 48819 Aircraft Maintenance, Repair & Overhaul in the US The industry provides maintenance and support to airlines. Supply Chain Products and services segmentation (2019) Total $52.9bn 72.0% Passenger transportation 13.6% Cargo transportation 8.9% Other 5.5% Fees SOURCE: WWW.IBISWORLD.COM WWW.IBISWORLD.COM International Airlines in the US September 2019 14
  • 61. Products & Markets Demand Determinants Factors affecting demand for the International Airlines industry include general economic activity, airfares, exchange rates, levels of personal disposable income and the appeal of major travel destinations. Leisure and business Movements in airfares can have a substantial effect on leisure travel, and holidays and overseas visits are often postponed during periods of high airfares. In contrast, airfares are not such an important factor for business travelers, since they are generally considered part of the usual costs of running a business. Major demand determinants for business travel include the level of international trade activity, corporate profitability and available substitutes, such as video conferencing. During periods of weak corporate profitability, business travel may be restricted or class of travel may be downgraded for shorter international trips. The extent to which companies expand overseas and become more globalized also influences demand for international air transportation services, and demand for industry services typically increases as industries and companies expand.
  • 62. Additionally, the emergence of no-frills scheduled carriers has caused price differentials among airlines to contract in recent years, enabling a greater number of Products and Services continued hubs. Many mainline carriers also have subsidiaries or affiliates that provide regional transportation services that connect passengers to major airline hubs. The number of international trips taken by US residents has increased at an annualized rate of 5.0% over the past five years, and strong economic growth in several developing countries has led to more tourists visiting the United States. Moreover, rising levels of per capita disposable income and corporate profit have enabled more airline customers to purchase relatively high-end airline services, such as first-class seating. As a result of these trends, passenger transportation has grown as a share of total industry revenue over the past five years. Cargo transportation The international transportation of cargo, including freight mail, is estimated to generate 13.6% of industry revenue in 2019. The main cargo airlines operating in this segment are divisions or subsidiaries of national passenger airlines, and these
  • 63. carriers generally use recently built or converted aircraft to carry cargo. In addition, cargo is also transported in the belly of passenger flights. Industry operators transport a wide variety of cargo, such as fresh produce, perishable goods, livestock and dangerous or hazardous goods. Carriers that operate on scheduled routes do not provide door-to- door …