SlideShare a Scribd company logo
1 of 18
Download to read offline
60 Years of Climate to Florida
 
Data source: NOAA 
Author: Avaneesh Kumar 
 
 
Smart Underwriters always try to minimize the property risk by evaluating a number of                           
parameters. Climate and Weather are the essential elements of Insurance Underwriting                     
decisions, For Instance - An area which has received a large number of hailstorms in the past                                 
is likely to receive them in future as well, indicates that the risk of claims due to hail storms is                                       
higher. Similarly, If insurance companies are aware of the parameters of properties which are                           
affected by a tornado, they can selectively choose the properties for insurance/reinsurance                       
which can withstand the effects of a tornado.  
 
In this report, we discuss the stories unearthed from the analysis of past 60 years of climate                                 
storms - Hail, Winds, and Tornados data. This report provides the information such as - the                               
areas - city, state, zip codes which got hit by storms in maximum number, The perils which are                                   
linked with maximum loss and fatalities, The time period which receives the maximum number                           
of storms and filed maximum property claims.  
 
The entire data is obtained from NOAA official sources. The data was cleaned and further                             
enriched with new information such as exact latitudes, longitudes along with the parsed and                           
precise addresses. The summary stats of data are presented in the following table: 
 
Peril   Records - Entire US  Records - Only Florida 
Wind  393,486  10,296 
Hail  335,840  4,859 
Tornado  62,208  3,288 


The Storms Timeline 


Though there seems to exist a data leak during the initial years from 1950-1985, the relative                               
stats shows that the frequency of WindStorms is highest followed by Hails and then Tornados.                             
Though the frequency of Tornadoes is low but the total cost related to its property damage is                                 
very high making the claims filed by Tornados as the most severe and costly perils. 


Action Items: ​Insurance companies should ​use external data sources to shift from a reactive                           
model to a proactive model by investing in real-time risk and yield management. Use of                             
telematics and real-time sensor data within the operations and work flows should be                         
encouraged to help manage the business more effectively, underwrite risk, compress time                       
lags, and reduce claims activity/processing 
 
The Storms Time Periods 
 
As suggested by the data, these perils occur throughout the year but the months of June - July                                   
receives the maximum number of storms in Florida specifically from Winds and Hails.  
 
 
Insurance Companies can exploit this information and may avoid writing new policies before                         
the months of severe storms. They can combine the time-related information with other                         
attributes to make their decisions wiser.   
 
An increasingly useful data source is “macro” environmental information such as geocoding,                       
satellite imagery, census, building code, natural catastrophe, environmental and climate data.                     
When integrated with a carrier’s own data (such as risk penetration and geographic footprint),                           
the resulting insights can proactively identify significant existing or potential risk concentration                       
threats, and support a portfolio management approach to managing risk and profitability.                       
These insights may be less obvious at the individual transaction level but can help to uncover                               
deep and potentially destabilizing ripple effects well ahead of an actual loss event. 


Area Wise Distributions 
 
The data suggest that Duval County (799) which lies in the East side of Florida and                               
Hillsborough (787) and Polk (692) Counties which lies in the West side of Florida have                             
witnessed the maximum number of storms. Due to a large number of these storms, the total                               
loss incurred by them is also highest.  


Snapshot of WindStorms  
 
Florida has witnessed Windstorms throughout history, but the number of storms has increased                         
significantly (​4,187, 41%​) in the last 10 years. According to the Saffir-Simpson scale,                         
Windstorms become Hurricanes when the Magnitude (in knots) becomes 100+. The overall                       
average magnitude of windstorms in the past 60 years is about 60 knots which is just less than                                   
the Category 1 hurricanes, while it has often reached the magnitude of about 90 knots which is                                 
the average magnitude of Category 3.  


Areas affected by Wind Storms 


County  Wind Storms  Average Magnitude 
Duval   497  39.08 
Leon   456  41.60 
Hillsborough   380  22.02 
Marion   331  33.78 
Alachua   325  32.15 
 
 
In Duval County​, ​the cities Jacksonville ​(112, 23 %) and ​Urban Core ​(88, 18 %) were hit in                                   
maximum numbers. The Street named ​Frazier St has shown to be the maximum hit in these                               
cities. Similarly, ​Tallahassee ​(315, 69 %) in Leon county and ​Dog Lake Tower Rd was affected                               
the most however but the impact is mostly distributed in the whole city. ​Tampa (88, 23 %) and                                   
Northwest Tampa ​(52, 13 %) are the cities with the most count, specifically Marie Antoinette Ct                               
in Tampa and W Virginia Ave in Northwest Tampa in Hillsborough County. ​Ocala ​(97, 29 %)                               
and ​Historic District ​(54, 16 %) in Marion County are the areas with the most count and also SE                                     
47th Ave in Ocala is the street with the most number of counts. SE 2nd Ave in ​Gainesville ​(165,                                     
51 %), ​Alachua counties​ are the streets and cities with the most count in this county.  
 
While comparing the total loss caused by Wind Storms, the following areas have garnered                           
maximum.  
 
1. Leon County (935, 7%) 
2. Hillsborough County (661, 5%) 
3. Polk County (496, 3.4 %) 
4. Escambia County (481, 3.3 %) 
5. Santa Rosa County (460, 3.2 %) 
 
Miccosukee Rd in ​Tallahassee City ​(585, 62 %) is the street and city with most loss in history in                                     
Leon ​County, whereas ​Governor's Walk ​(121, 13%) is the city with second-most wind loss.                           
Northwest Tampa (​114, 17%​) and ​Tampa​(​101, 15%​) has the highest sum of loss_rating,                         
specifically in ​W Virginia Ave in Northwest Tampa and Theresa Arbor Dr in Tampa with the                               
highest sum of loss in streets in ​Hillsborough County. ​Lakeland (116, 23%) and ​Winter                           
Haven​(73, 15%) where E Park St and Ave B SE are the respective streets in the cities of Polk                                     
County. N Spring St in Downtown (118, 25% ) and ​Pensacola city ( 83, 17 %) is the most                                     
impacted street and city in Escambia County. ​Milton city ​(​227, 49%​) and specifically ​Russell                           
Harber Rd​ is the street most impacted in Minton City in ​Santa Rosa County​.  
 
Years 2015, 2011, 2016, 2014 had the highest wind_count value which suggests that                         
windstorms are increasing with increasing years. But, the maximum loss was in years 2000,                           
1998, 1999, 2011, 2014, 2012 so loss has reduced due to better construction practices and                             
lesser variance​ in speed (data suggests).  
 
Action Items -  
 
- Approximately 85% of all windstorm-related insurance claims are due to roof damage                       
so a thorough inspection of roof builds quality, material type, age of a roof (if                             
reconstructed), age of the house, the shape of roof etc.  
- May ask homeowners to purchase separate windstorm insurance to provide coverage                     
for damages in the riskiest areas(maximum loss areas specific).  
- Houses should be categorised on some prerequisites or rated ​on the basis of this list                             
during risk profiling and underwriting or build a model that can do this for the business.  
- Offer a discount if certain risk mitigation techniques or investment has already been                         
made by the property owner against wind damage.   
- Grouping together areas of similar risk by peril, to allow underwriters and managers to                           
overlay their portfolio of business and streamline decision making for future risk                       
allocation. 
 
Key Tips to minimize the Wind Damage 
 
- Trim back tree branches to prevent fallen limbs. 
- Secure window shutters to defend against debris. 
- Tie-down anything that could fly away and hit the siding or the roof. 
- If the siding is looking worse for wear, have a siding professional come out to repair it.  


Snapshot of HailStorms 


Florida suffers from more thunderstorms than any other state in the US due to its geographical                               
location and also suffers from a lot of hurricanes which in turn gives rise to tornadoes and                                 
which favours the formation and movement of hail clouds. The movement of clouds takes                           
place towards the low-pressure areas, areas which are relatively hotter ​(central part of Florida)​.                           
- ​refer link for better understanding 
 
The freezing level in a Florida thunderstorm is so high; hail often melts before it reaches the                                 
ground. Even though hail is not common to the state, there have been about a dozen events of                                   
the hail of over 3 inches being reported in Florida. Although hail events have decreased in the                                 
last 10-15 years, research (data) shows the hail size has increased causing more damage than                             
before to crops, cars, roofs and in severe cases, fatality.  
 
Action Items  
 
- In the high risk, areas focus more on homes with better roof material, clear outdoors,                             
Window material, shingles and other, charge according to the risk profiling.  
- Similarly, charge a higher premium from high-risk areas. 
- Increase the deductibles so less number of people file for claims.  
- Live update to the insurance holders is a safety precaution that can also help the                             
company reduce claims and damage to the property 
Areas affected by Hailstorms 


County  Hailstorms  Maximum Size (inches) 
Hillsborough County  273 
2.75 
Duval County  237 
2.75 
Polk County  236 
4.50 
Orange County  225 
3.00 
Miami-Dade County  217 
4.00 
 
Hillsborough County, ​in central west Florida, faced maximum Hail-Storms, specifically, streets                     
named ​W Virginia Ave in ​Tampa city (​109, 40%​) and ​N Larry Cir street in ​Brandon city (​35, 13                                      
%) had the highest count of hails in Hillsborough County. Likewise, ​Jacksonville city (​221,                           
93.248 %​) ​has the highest hail events where Frazier St is the street with the highest hails in                                   
Jacksonville, Duval County. Lakeland (​74, 31 %​) ​is the city with the highest hails where the                               
street with maximum hails is E Park St in Polk County. E Amelia St in ​Orlando​(143, 63%) is                                   
the street in city and city respectively with highest hail events in ​Orange County​.  
SW 4th Ave street in ​Miami city(​79, 36%​)​, ​Miami-Dade County has the highest number of hail                               
events. 
 
Loss due to Hail Storms represented a slightly different story, top countries with most of the                               
loss are -  
 
Polk County (​74, 13 %​), Orange County (​48, 8 %​), Hillsborough County (​27, 5%​), Marion                             
County (​21, 4%​), Lake County (​20, 3 %​) 
 
Lakeland (​26, 35 %​) and Lake Wales (​18, 24 %​) has the highest sum_loss_rating in Florida                                
according to data where ​Lake Wales has higher mean_loss_rating in ​Polk County​.                       
Furthermore, ​E Park St in Lakeland and S Lakeshore Blvd in Lake Wales has the highest                               
sum_loss_rating. Similarly, ​E Amelia St is the street with the highest loss_rating in ​Orlando                           
city (​37, 77%​) which has the highest sum_loss_rating in ​Orange County​. ​Tampa(​12, 40.0 %​)                           
and Brandon(​6, 20.0 %​) are the cities with the highest loss due to hail, specifically, ​W Virginia                                 
Ave and N Larry Cir are the streets with highest sum_loss_rating in ​Hillsborough County​.                           
Ocala(​5, 23 %​) and Silver Spring(​5, 24 %​) are the cities and Wenona Ave and ​NE 14th Street                                   
Rd in the respective cities have the highest loss due to hail. ​Tavares(​11, 55.0 %​) ​in the city and                                     
Lake Dora Dr​ is the street name where maximum loss due to hail occurred.  
 
According to years and occurrence pattern in Hailstorms (year) -  
 
1992, 1991, 1996, 1999 and 2005 are the years with maximum hail loss-rating i.e. loss due to                                 
hail. Thus, ​hailstorm events have decreased​ with an increasing year in last few years i.e. 
1999, 2003, 2001, 1998 and 2007 had the highest number of hail_stroms. 
- There is a different pattern between 1985 to 2000 (from the data) 
- Average wind speed has been constant for the last 6-7 years but higher than before. 
- Lesser number of hail events than wind events in mostly each month. 
- Max_wind_loss occurs in the month’s May, June, July & August. 
 
Hail_size showed an upward inclination with increasing ​average mean temperature in various                       
parts in the US, whereas the events of hail have reduced with the passing year for the last 10                                     
years. Hail events are dependent on windstorms and thunderstorms. Further References - ​Hail                         
Size​, ​Hail-case-study​ & ​Average Temperature 
 
Action Items (Minimise the Hail Damage) 
 
● Install wind shutters designed to defend against high winds and hail. 
● Purchase & install pressure or high impact windows. 
● Secure doors with heavy-duty bolts at the top and bottom of the door frame. 
 
Hail can cause damage to many parts of the home, but it most commonly hits the roof the                                   
hardest. A damaged shingle, in particular, can allow water to get through to the roof deck and                                 
cause harm to the ceiling and support beams. This will eventually lead to more leaks in the                                 
roof, stains on the ceiling and walls, and potential flooding. The cost to repair a roof following                                 
such damages will be expensive, but holding off could lead to even more costly repairs down                               
the road. It’s best to perform repairs as quickly as possible. The two types of repairs one might                                   
be faced will include: Asphalt and Other Singles (Wood, Metal, Tile) 
Snapshot of Tornadoes 


Truly destructive tornadoes are most frequently reported in Florida during the spring and                         
summer; the most powerful usually strike in spring. Tornadoes develop from severe                       
thunderstorms. They are usually preceded by very heavy rain and/or large hail. A thunderstorm                           
accompanied by hail indicates that the storm has large amounts of energy and may be severe.                               
In general, the larger the hailstones, the more potential there is for damaging winds and/or                             
tornadoes. The most violent tornadoes are capable of tremendous destruction with wind                       
speeds of 250 mph or more.   
 
Damage paths have exceeded the width of one mile and 50 miles long. Tornadoes generally                             
move from southwest to northeast but have also been recorded travelling in any direction. The                             
forward speed of a tornado varies from 30 mph to 70 mph. ​What triggers a tornado is still not                                     
altogether clear. Tornadoes spawn inside clouds when there is great turbulence and winds of                           
various speeds and velocities come in contact with one another. Although there is uncertainty                           
about the triggers, meteorologists are able to identify atmospheric conditions conducive to                       
tornadic activity. ​tornado florida​ - ​better overview 
 
Action Items 
 
- Implement a geographic information system(GIS) to more efficiently respond to natural 
events through risk analysis, real-time events monitoring, and aligned optimized 
response, better understand and plan for catastrophes and assign claim adjusters and 
response teams where they will likely be needed most based on historic trends.   
 
- As there is no specific reason for tornado’s activation(only hurricane and thunderstorm), 
prior knowledge provided to customer can help him and the company reduce claims.  


Areas affected by Tornados 


County  Tornados 
Average Magnitude 
(Fujita Scale) 
Average Loss 
Palm Beach   167  0.38  2.04 
Polk   160  0.45  3.03 
Pinellas   134  0.58  3.41 
Hillsborough   134  0.529  3.24 
Miami-Dade   134  0.298  1.88 
 
 
In Palm Beach County, ​West Palm Beach (​26, 16 %​) and ​Belle Glade (​23, 14 %​) in ​Palm Beach                                     
County are the cities with highest tornado events and more specifically, ​Monroe D​r in West                             
Palm Beach and ​SW 1st St in Belle Glade are the streets with highest tornado events.                               
Correspondingly, ​Lakeland city (​42, 26 %​) in which E Park St stree​t has the highest tornado                               
events in ​Polk County​. ​St. Petersburg(​39, 29 %​) and Largo city (19, 14 %) in ​Pinellas County                                 
have suffered the highest tornado hits in which ​27th St S and 4th Ave NW in respective cities                                   
have the highest count of tornados. ​Tampa(​62, 46 %​) in ​Hillsborough County has the highest                             
tornado count, in which ​W Virginia Ave in Tampa has the highest Tornado strikes. ​SW 4th Ave                                 
in Miami city​ (57, 43 %) has faced maximum tornados in ​Miami-Dade County​. 
All the top 5 counties are in southern Florida and near the higher heat zone, plus the                                 
hurricanes mostly hit the southern part of Florida and tornadoes are an aftereffect of                           
Hurricanes in these areas. 
 
When considering total loss as a parameter for comparison, top counties suffering most                         
damage are -   
Palm Beach County​ (167, 5%) 
Polk County​ (160, 4.8%) 
Hillsborough County ​(134, 4%) 
Miami-Dade County​ (134, 4%) 
Pinellas County​ (134, 4%) 
 
West Palm Beach (​26, 16 %​) and ​Belle Glade (​23, 13%​) in ​Palm Beach County are the cities                                   
with highest tornado loss and more specifically, Monroe Dr in West Palm Beach and SW 1st St                                 
in Belle Glade are the streets with highest tornado loss. ​Lakeland city (​42, 26%​) in which E                                 
Park St stree​t has the highest tornado events in ​Polk County​. ​St. Petersburg(​39, 29 %​) and                               
Largo city (19, 14 %) in ​Pinellas County have suffered the highest tornado hits in which ​27th St                                   
S​ and​ 4th Ave NW​ in respective cities have highest losses due to tornadoes. 
Tampa(​62, 46%​) in ​Hillsborough County has the highest tornado count, in which ​W Virginia                           
Ave in Tampa has the highest count. ​SW 4th Ave in Miami city (57, 42 %)has faced maximum                                   
tornados in ​Miami-Dade County​. 
 
1997, 1998, 2004, 1975 and 1995 are the years with maximum Tornado counts. Similarly, 1997,                             
1998, 1983, 1979 and 1975 are the years in which maximum tornado loss occurred and also                               
1998 has maximum injuries and fatalities with mean_loss_rating above 4.5 were assigned an                         
F4 rating but later reduced to F3. 
But with time the count and loss due to Tornados and decreased as is evident from the Data.  
 
 
Action Items (To reduce the Tornado damage)  
Tornado damage occurs following high winds from blowing debris. While we can’t do a lot to                               
prepare for a tornado, it helps to trim tree branches back on the roof and windows. We can                                   
also reinforce the roof to better handle high winds: 
● Shake roof​: Add more nails.
● Slate roof​: Seal down with cement.
● Tile roof​: Place a steel strap over the tiles.
● Asphalt roof​: Nothing can be done, but inspect after.
 
Invest in a storm cellar, which is built underground and allows great defence against high                             
winds during a tornado. A storm shelter is built close to the home so it is easy to access during                                       
a tornado and doesn't have to run far for safety. A storm cellar door is built at an angle so that                                         
debris blows over the door. This allows for debris to roll over the door rather than trap it, so                                     
one can get in and out easily. The confines of a storm cellar for a family is around 8 by 12 feet                                           
with an arched roof. It’s made of cement blocks and rebar to ensure maximum defences. 
 
The combined maximum loss in Top 5 years. 
 
Year   Hail   Tornado  Wind  Total  
1998  17  379  1161  1557 
2000  14  192  1203  1409 
1999  37  181  1159  1377 
1993  33  247  662  942 
1995  24  289  625  938 
 
 
Significant tornado events (evident from the data also) 
 
1966, 04 : ​https://en.wikipedia.org/wiki/1966_Tampa_tornado_family 
1958, 04 ​https://en.wikipedia.org/wiki/1958_Colfax,_Wisconsin,_tornado_outbreak 
2004, 09 ​https://en.wikipedia.org/wiki/Hurricane_Ivan_tornado_outbreak 
 
1997-1998: ​https://en.wikipedia.org/wiki/1998_Kissimmee_tornado_outbreak 
“The tornadoes were strong due to an abnormally strong ​jet stream with warm, humid air out                               
ahead of the ​cold front​. This is common in the ​El Niño phase of the ​El Niño-Southern                                 
Oscillation (ENSO) during the Florida dry season (November 1 - April 30).​[5]
During El Niño the                               
jet stream is typically stronger and further south near or over Florida in the winter and spring.                                 
This greatly increases the odds that conditions will be favourable for strong tornado                         
development.” ~Wikipedia  
 
The Phases of ​March to September are the months with most events occurring, Tornadoes                           
with higher damage capacity happen when there was an event of hurricane or thunderstorms                           
in the area. 


Last 20 years in Florida  
 
Wind Snapshot 


Storm
Saffir-Simpson
Category
Date of
landfall
Year
Landfall
Intensity
(in ​knots​)
Landfall Location
Charley  4  August 13  2004  130 
Cayo Costa​ (1st landfall)/ 
Near ​Punta Gorda​ (2nd 
landfall) 
Ivan  3  September 16  2004  105  Near ​Gulf Shores, AL​* 
Jeanne  3  September 26  2004  105  Hutchinson Island 
Dennis  3  July 10  2005  120  Santa Rosa Island 
Wilma  3  October 24  2005  120  Cape Romano 
Irma  4  September 10  2017  130 
Cudjoe Key​ (1st landfall)/ 
Marco Island​ (2nd landfall) 
~​ source - Wikipedia


Hail Snapshot 


https://www.weather.gov/media/mlb/surveys/record_hailstorms.pdf 
 
 
Date  Area  Size   Total Estimated Loss 
1996,   Lake Wales, Polk County  3  $24 mn.  
1992, March 6th  Orlando, Orange County  3.4 to 4  $60 mn. 
This is still the costliest Florida 
hailstorm on record. 
1992, 25t March  Orlando, Orange County  3.5  Causing around $40 mn.  


Tornado Snapshot 


Date Fujita Killed Injuries Information
2/22/1998 3 25 150
The deadliest tornado of the outbreak was a category F3, that
touched down initially 1 mile south of Intercession City
2/22/1998 3 13 36
The tornado initially set down near Longwood and moved northeast
at 45 mph. The tornado passed through several neighbourhoods in
the southeast portion of Sanford, killing 12 people in mobile homes
and injuring 70
2/2/2007 3 13 51
The storm that produced the Lady Lake tornado re-intensified and
produced a second F3 tornado in a rural area to the west-southwest
of Paisley
2/2/2007 3 8 25
The ¼-mile-wide F3 tornado moved across the Lady Lake area,
killing 8 people and injuring 10. The tornado damaged 180
residences and destroyed 101. All of the fatalities occurred in mobile
homes
4/19/1988 3 4 18
A tornado moved from just southwest of Madison to 11 miles
east-northeast of Madison. Seventeen homes were destroyed and
more than 30 homes were damaged


More Related Content

Similar to Final report on Frorida climate

Dki storms-full-guide
Dki storms-full-guideDki storms-full-guide
Dki storms-full-guideDKIVentures
 
Hurricanes
HurricanesHurricanes
HurricanesERS1029
 
Flooding - A Business RIsk Mitigated by Planning and Insurance
Flooding - A Business RIsk Mitigated by Planning and InsuranceFlooding - A Business RIsk Mitigated by Planning and Insurance
Flooding - A Business RIsk Mitigated by Planning and InsuranceCBIZ, Inc.
 
Exact Catastrophe Exposure Management - Whitepaper
Exact Catastrophe Exposure Management - WhitepaperExact Catastrophe Exposure Management - Whitepaper
Exact Catastrophe Exposure Management - WhitepaperNIIT Technologies
 
Super Tornado Outbreak April 2011
Super Tornado Outbreak April 2011 Super Tornado Outbreak April 2011
Super Tornado Outbreak April 2011 Don Coash
 
As Risks Go, Flood Beats Fire 5 to 1
As Risks Go, Flood Beats Fire 5 to 1As Risks Go, Flood Beats Fire 5 to 1
As Risks Go, Flood Beats Fire 5 to 1CBIZ, Inc.
 
Hurricane Threat and Risk Analysis in Rhode Island
Hurricane Threat and Risk Analysis in Rhode IslandHurricane Threat and Risk Analysis in Rhode Island
Hurricane Threat and Risk Analysis in Rhode Islandriseagrant
 
Top 10 Actions a CIO Can Take to Prepare for a Hurricane
Top 10 Actions a CIO Can Take to Prepare for a HurricaneTop 10 Actions a CIO Can Take to Prepare for a Hurricane
Top 10 Actions a CIO Can Take to Prepare for a HurricaneBillatDell
 
6 Steps to Unlocking the Power of Location
6 Steps to Unlocking the Power of Location6 Steps to Unlocking the Power of Location
6 Steps to Unlocking the Power of LocationJonathan Lazzarotto
 
Joe Egan AMS Poster
Joe Egan AMS PosterJoe Egan AMS Poster
Joe Egan AMS PosterJoseph Egan
 
Report: Hurricanes and Transportation Impacts, Preparation
Report: Hurricanes and Transportation Impacts, PreparationReport: Hurricanes and Transportation Impacts, Preparation
Report: Hurricanes and Transportation Impacts, PreparationBethany Cramer
 
Kpacket 2014 Top_Ten_Guide
Kpacket 2014 Top_Ten_GuideKpacket 2014 Top_Ten_Guide
Kpacket 2014 Top_Ten_GuideAPEX Global
 
GEOGRAPHY UNIT 1 Module 3 natural events and hazards. section 5 response to ...
GEOGRAPHY UNIT 1 Module 3  natural events and hazards. section 5 response to ...GEOGRAPHY UNIT 1 Module 3  natural events and hazards. section 5 response to ...
GEOGRAPHY UNIT 1 Module 3 natural events and hazards. section 5 response to ...Liam Nabbal
 
Weather and Decision Support for Emergency Managers
Weather and Decision Support for Emergency ManagersWeather and Decision Support for Emergency Managers
Weather and Decision Support for Emergency ManagersTodd Morris
 
How location can mitigate risk exposure to your inaurance portfolio
How location can mitigate risk exposure to your inaurance portfolioHow location can mitigate risk exposure to your inaurance portfolio
How location can mitigate risk exposure to your inaurance portfolioDMTI Spatial
 

Similar to Final report on Frorida climate (20)

Dki storms-full-guide
Dki storms-full-guideDki storms-full-guide
Dki storms-full-guide
 
Hurricanes
HurricanesHurricanes
Hurricanes
 
Flooding - A Business RIsk Mitigated by Planning and Insurance
Flooding - A Business RIsk Mitigated by Planning and InsuranceFlooding - A Business RIsk Mitigated by Planning and Insurance
Flooding - A Business RIsk Mitigated by Planning and Insurance
 
Exact Catastrophe Exposure Management - Whitepaper
Exact Catastrophe Exposure Management - WhitepaperExact Catastrophe Exposure Management - Whitepaper
Exact Catastrophe Exposure Management - Whitepaper
 
Disaster management essay
Disaster management essayDisaster management essay
Disaster management essay
 
Super Tornado Outbreak April 2011
Super Tornado Outbreak April 2011 Super Tornado Outbreak April 2011
Super Tornado Outbreak April 2011
 
Hurricanes
HurricanesHurricanes
Hurricanes
 
DAV Term Project (Team 2)
DAV Term Project (Team 2)DAV Term Project (Team 2)
DAV Term Project (Team 2)
 
As Risks Go, Flood Beats Fire 5 to 1
As Risks Go, Flood Beats Fire 5 to 1As Risks Go, Flood Beats Fire 5 to 1
As Risks Go, Flood Beats Fire 5 to 1
 
Hurricane Threat and Risk Analysis in Rhode Island
Hurricane Threat and Risk Analysis in Rhode IslandHurricane Threat and Risk Analysis in Rhode Island
Hurricane Threat and Risk Analysis in Rhode Island
 
Top 10 Actions a CIO Can Take to Prepare for a Hurricane
Top 10 Actions a CIO Can Take to Prepare for a HurricaneTop 10 Actions a CIO Can Take to Prepare for a Hurricane
Top 10 Actions a CIO Can Take to Prepare for a Hurricane
 
The Role of Property/Casualty Insurance in Catastrophic Events
The Role of Property/Casualty Insurance in Catastrophic EventsThe Role of Property/Casualty Insurance in Catastrophic Events
The Role of Property/Casualty Insurance in Catastrophic Events
 
Hurricanes
HurricanesHurricanes
Hurricanes
 
6 Steps to Unlocking the Power of Location
6 Steps to Unlocking the Power of Location6 Steps to Unlocking the Power of Location
6 Steps to Unlocking the Power of Location
 
Joe Egan AMS Poster
Joe Egan AMS PosterJoe Egan AMS Poster
Joe Egan AMS Poster
 
Report: Hurricanes and Transportation Impacts, Preparation
Report: Hurricanes and Transportation Impacts, PreparationReport: Hurricanes and Transportation Impacts, Preparation
Report: Hurricanes and Transportation Impacts, Preparation
 
Kpacket 2014 Top_Ten_Guide
Kpacket 2014 Top_Ten_GuideKpacket 2014 Top_Ten_Guide
Kpacket 2014 Top_Ten_Guide
 
GEOGRAPHY UNIT 1 Module 3 natural events and hazards. section 5 response to ...
GEOGRAPHY UNIT 1 Module 3  natural events and hazards. section 5 response to ...GEOGRAPHY UNIT 1 Module 3  natural events and hazards. section 5 response to ...
GEOGRAPHY UNIT 1 Module 3 natural events and hazards. section 5 response to ...
 
Weather and Decision Support for Emergency Managers
Weather and Decision Support for Emergency ManagersWeather and Decision Support for Emergency Managers
Weather and Decision Support for Emergency Managers
 
How location can mitigate risk exposure to your inaurance portfolio
How location can mitigate risk exposure to your inaurance portfolioHow location can mitigate risk exposure to your inaurance portfolio
How location can mitigate risk exposure to your inaurance portfolio
 

Recently uploaded

(ISHITA) Call Girls Service Hyderabad Call Now 8617697112 Hyderabad Escorts
(ISHITA) Call Girls Service Hyderabad Call Now 8617697112 Hyderabad Escorts(ISHITA) Call Girls Service Hyderabad Call Now 8617697112 Hyderabad Escorts
(ISHITA) Call Girls Service Hyderabad Call Now 8617697112 Hyderabad EscortsCall girls in Ahmedabad High profile
 
Brighton SEO | April 2024 | Data Storytelling
Brighton SEO | April 2024 | Data StorytellingBrighton SEO | April 2024 | Data Storytelling
Brighton SEO | April 2024 | Data StorytellingNeil Barnes
 
100-Concepts-of-AI by Anupama Kate .pptx
100-Concepts-of-AI by Anupama Kate .pptx100-Concepts-of-AI by Anupama Kate .pptx
100-Concepts-of-AI by Anupama Kate .pptxAnupama Kate
 
Generative AI on Enterprise Cloud with NiFi and Milvus
Generative AI on Enterprise Cloud with NiFi and MilvusGenerative AI on Enterprise Cloud with NiFi and Milvus
Generative AI on Enterprise Cloud with NiFi and MilvusTimothy Spann
 
BigBuy dropshipping via API with DroFx.pptx
BigBuy dropshipping via API with DroFx.pptxBigBuy dropshipping via API with DroFx.pptx
BigBuy dropshipping via API with DroFx.pptxolyaivanovalion
 
Low Rate Call Girls Bhilai Anika 8250192130 Independent Escort Service Bhilai
Low Rate Call Girls Bhilai Anika 8250192130 Independent Escort Service BhilaiLow Rate Call Girls Bhilai Anika 8250192130 Independent Escort Service Bhilai
Low Rate Call Girls Bhilai Anika 8250192130 Independent Escort Service BhilaiSuhani Kapoor
 
Invezz.com - Grow your wealth with trading signals
Invezz.com - Grow your wealth with trading signalsInvezz.com - Grow your wealth with trading signals
Invezz.com - Grow your wealth with trading signalsInvezz1
 
BabyOno dropshipping via API with DroFx.pptx
BabyOno dropshipping via API with DroFx.pptxBabyOno dropshipping via API with DroFx.pptx
BabyOno dropshipping via API with DroFx.pptxolyaivanovalion
 
RA-11058_IRR-COMPRESS Do 198 series of 1998
RA-11058_IRR-COMPRESS Do 198 series of 1998RA-11058_IRR-COMPRESS Do 198 series of 1998
RA-11058_IRR-COMPRESS Do 198 series of 1998YohFuh
 
Mature dropshipping via API with DroFx.pptx
Mature dropshipping via API with DroFx.pptxMature dropshipping via API with DroFx.pptx
Mature dropshipping via API with DroFx.pptxolyaivanovalion
 
Ukraine War presentation: KNOW THE BASICS
Ukraine War presentation: KNOW THE BASICSUkraine War presentation: KNOW THE BASICS
Ukraine War presentation: KNOW THE BASICSAishani27
 
B2 Creative Industry Response Evaluation.docx
B2 Creative Industry Response Evaluation.docxB2 Creative Industry Response Evaluation.docx
B2 Creative Industry Response Evaluation.docxStephen266013
 
04242024_CCC TUG_Joins and Relationships
04242024_CCC TUG_Joins and Relationships04242024_CCC TUG_Joins and Relationships
04242024_CCC TUG_Joins and Relationshipsccctableauusergroup
 
VIP Call Girls Service Miyapur Hyderabad Call +91-8250192130
VIP Call Girls Service Miyapur Hyderabad Call +91-8250192130VIP Call Girls Service Miyapur Hyderabad Call +91-8250192130
VIP Call Girls Service Miyapur Hyderabad Call +91-8250192130Suhani Kapoor
 
Beautiful Sapna Vip Call Girls Hauz Khas 9711199012 Call /Whatsapps
Beautiful Sapna Vip  Call Girls Hauz Khas 9711199012 Call /WhatsappsBeautiful Sapna Vip  Call Girls Hauz Khas 9711199012 Call /Whatsapps
Beautiful Sapna Vip Call Girls Hauz Khas 9711199012 Call /Whatsappssapnasaifi408
 
Customer Service Analytics - Make Sense of All Your Data.pptx
Customer Service Analytics - Make Sense of All Your Data.pptxCustomer Service Analytics - Make Sense of All Your Data.pptx
Customer Service Analytics - Make Sense of All Your Data.pptxEmmanuel Dauda
 
Smarteg dropshipping via API with DroFx.pptx
Smarteg dropshipping via API with DroFx.pptxSmarteg dropshipping via API with DroFx.pptx
Smarteg dropshipping via API with DroFx.pptxolyaivanovalion
 
EMERCE - 2024 - AMSTERDAM - CROSS-PLATFORM TRACKING WITH GOOGLE ANALYTICS.pptx
EMERCE - 2024 - AMSTERDAM - CROSS-PLATFORM  TRACKING WITH GOOGLE ANALYTICS.pptxEMERCE - 2024 - AMSTERDAM - CROSS-PLATFORM  TRACKING WITH GOOGLE ANALYTICS.pptx
EMERCE - 2024 - AMSTERDAM - CROSS-PLATFORM TRACKING WITH GOOGLE ANALYTICS.pptxthyngster
 
April 2024 - Crypto Market Report's Analysis
April 2024 - Crypto Market Report's AnalysisApril 2024 - Crypto Market Report's Analysis
April 2024 - Crypto Market Report's Analysismanisha194592
 

Recently uploaded (20)

(ISHITA) Call Girls Service Hyderabad Call Now 8617697112 Hyderabad Escorts
(ISHITA) Call Girls Service Hyderabad Call Now 8617697112 Hyderabad Escorts(ISHITA) Call Girls Service Hyderabad Call Now 8617697112 Hyderabad Escorts
(ISHITA) Call Girls Service Hyderabad Call Now 8617697112 Hyderabad Escorts
 
Brighton SEO | April 2024 | Data Storytelling
Brighton SEO | April 2024 | Data StorytellingBrighton SEO | April 2024 | Data Storytelling
Brighton SEO | April 2024 | Data Storytelling
 
100-Concepts-of-AI by Anupama Kate .pptx
100-Concepts-of-AI by Anupama Kate .pptx100-Concepts-of-AI by Anupama Kate .pptx
100-Concepts-of-AI by Anupama Kate .pptx
 
Delhi 99530 vip 56974 Genuine Escort Service Call Girls in Kishangarh
Delhi 99530 vip 56974 Genuine Escort Service Call Girls in  KishangarhDelhi 99530 vip 56974 Genuine Escort Service Call Girls in  Kishangarh
Delhi 99530 vip 56974 Genuine Escort Service Call Girls in Kishangarh
 
Generative AI on Enterprise Cloud with NiFi and Milvus
Generative AI on Enterprise Cloud with NiFi and MilvusGenerative AI on Enterprise Cloud with NiFi and Milvus
Generative AI on Enterprise Cloud with NiFi and Milvus
 
BigBuy dropshipping via API with DroFx.pptx
BigBuy dropshipping via API with DroFx.pptxBigBuy dropshipping via API with DroFx.pptx
BigBuy dropshipping via API with DroFx.pptx
 
Low Rate Call Girls Bhilai Anika 8250192130 Independent Escort Service Bhilai
Low Rate Call Girls Bhilai Anika 8250192130 Independent Escort Service BhilaiLow Rate Call Girls Bhilai Anika 8250192130 Independent Escort Service Bhilai
Low Rate Call Girls Bhilai Anika 8250192130 Independent Escort Service Bhilai
 
Invezz.com - Grow your wealth with trading signals
Invezz.com - Grow your wealth with trading signalsInvezz.com - Grow your wealth with trading signals
Invezz.com - Grow your wealth with trading signals
 
BabyOno dropshipping via API with DroFx.pptx
BabyOno dropshipping via API with DroFx.pptxBabyOno dropshipping via API with DroFx.pptx
BabyOno dropshipping via API with DroFx.pptx
 
RA-11058_IRR-COMPRESS Do 198 series of 1998
RA-11058_IRR-COMPRESS Do 198 series of 1998RA-11058_IRR-COMPRESS Do 198 series of 1998
RA-11058_IRR-COMPRESS Do 198 series of 1998
 
Mature dropshipping via API with DroFx.pptx
Mature dropshipping via API with DroFx.pptxMature dropshipping via API with DroFx.pptx
Mature dropshipping via API with DroFx.pptx
 
Ukraine War presentation: KNOW THE BASICS
Ukraine War presentation: KNOW THE BASICSUkraine War presentation: KNOW THE BASICS
Ukraine War presentation: KNOW THE BASICS
 
B2 Creative Industry Response Evaluation.docx
B2 Creative Industry Response Evaluation.docxB2 Creative Industry Response Evaluation.docx
B2 Creative Industry Response Evaluation.docx
 
04242024_CCC TUG_Joins and Relationships
04242024_CCC TUG_Joins and Relationships04242024_CCC TUG_Joins and Relationships
04242024_CCC TUG_Joins and Relationships
 
VIP Call Girls Service Miyapur Hyderabad Call +91-8250192130
VIP Call Girls Service Miyapur Hyderabad Call +91-8250192130VIP Call Girls Service Miyapur Hyderabad Call +91-8250192130
VIP Call Girls Service Miyapur Hyderabad Call +91-8250192130
 
Beautiful Sapna Vip Call Girls Hauz Khas 9711199012 Call /Whatsapps
Beautiful Sapna Vip  Call Girls Hauz Khas 9711199012 Call /WhatsappsBeautiful Sapna Vip  Call Girls Hauz Khas 9711199012 Call /Whatsapps
Beautiful Sapna Vip Call Girls Hauz Khas 9711199012 Call /Whatsapps
 
Customer Service Analytics - Make Sense of All Your Data.pptx
Customer Service Analytics - Make Sense of All Your Data.pptxCustomer Service Analytics - Make Sense of All Your Data.pptx
Customer Service Analytics - Make Sense of All Your Data.pptx
 
Smarteg dropshipping via API with DroFx.pptx
Smarteg dropshipping via API with DroFx.pptxSmarteg dropshipping via API with DroFx.pptx
Smarteg dropshipping via API with DroFx.pptx
 
EMERCE - 2024 - AMSTERDAM - CROSS-PLATFORM TRACKING WITH GOOGLE ANALYTICS.pptx
EMERCE - 2024 - AMSTERDAM - CROSS-PLATFORM  TRACKING WITH GOOGLE ANALYTICS.pptxEMERCE - 2024 - AMSTERDAM - CROSS-PLATFORM  TRACKING WITH GOOGLE ANALYTICS.pptx
EMERCE - 2024 - AMSTERDAM - CROSS-PLATFORM TRACKING WITH GOOGLE ANALYTICS.pptx
 
April 2024 - Crypto Market Report's Analysis
April 2024 - Crypto Market Report's AnalysisApril 2024 - Crypto Market Report's Analysis
April 2024 - Crypto Market Report's Analysis
 

Final report on Frorida climate

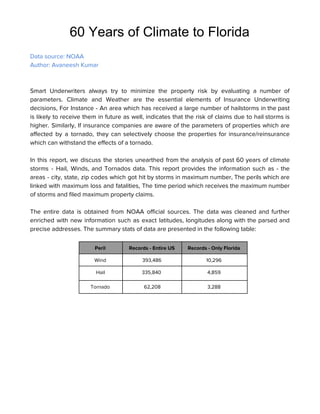
  • 1. 60 Years of Climate to Florida   Data source: NOAA  Author: Avaneesh Kumar      Smart Underwriters always try to minimize the property risk by evaluating a number of                            parameters. Climate and Weather are the essential elements of Insurance Underwriting                      decisions, For Instance - An area which has received a large number of hailstorms in the past                                  is likely to receive them in future as well, indicates that the risk of claims due to hail storms is                                        higher. Similarly, If insurance companies are aware of the parameters of properties which are                            affected by a tornado, they can selectively choose the properties for insurance/reinsurance                        which can withstand the effects of a tornado.     In this report, we discuss the stories unearthed from the analysis of past 60 years of climate                                  storms - Hail, Winds, and Tornados data. This report provides the information such as - the                                areas - city, state, zip codes which got hit by storms in maximum number, The perils which are                                    linked with maximum loss and fatalities, The time period which receives the maximum number                            of storms and filed maximum property claims.     The entire data is obtained from NOAA official sources. The data was cleaned and further                              enriched with new information such as exact latitudes, longitudes along with the parsed and                            precise addresses. The summary stats of data are presented in the following table:    Peril   Records - Entire US  Records - Only Florida  Wind  393,486  10,296  Hail  335,840  4,859  Tornado  62,208  3,288                       
  • 2.   The Storms Timeline        Though there seems to exist a data leak during the initial years from 1950-1985, the relative                                stats shows that the frequency of WindStorms is highest followed by Hails and then Tornados.                              Though the frequency of Tornadoes is low but the total cost related to its property damage is                                  very high making the claims filed by Tornados as the most severe and costly perils.        Action Items: ​Insurance companies should ​use external data sources to shift from a reactive                            model to a proactive model by investing in real-time risk and yield management. Use of                              telematics and real-time sensor data within the operations and work flows should be                          encouraged to help manage the business more effectively, underwrite risk, compress time                        lags, and reduce claims activity/processing 
  • 3.   The Storms Time Periods    As suggested by the data, these perils occur throughout the year but the months of June - July                                    receives the maximum number of storms in Florida specifically from Winds and Hails.       Insurance Companies can exploit this information and may avoid writing new policies before                          the months of severe storms. They can combine the time-related information with other                          attributes to make their decisions wiser.      An increasingly useful data source is “macro” environmental information such as geocoding,                        satellite imagery, census, building code, natural catastrophe, environmental and climate data.                      When integrated with a carrier’s own data (such as risk penetration and geographic footprint),                            the resulting insights can proactively identify significant existing or potential risk concentration                        threats, and support a portfolio management approach to managing risk and profitability.                        These insights may be less obvious at the individual transaction level but can help to uncover                                deep and potentially destabilizing ripple effects well ahead of an actual loss event.                         
  • 4.   Area Wise Distributions    The data suggest that Duval County (799) which lies in the East side of Florida and                                Hillsborough (787) and Polk (692) Counties which lies in the West side of Florida have                              witnessed the maximum number of storms. Due to a large number of these storms, the total                                loss incurred by them is also highest.                
  • 5.   Snapshot of WindStorms     Florida has witnessed Windstorms throughout history, but the number of storms has increased                          significantly (​4,187, 41%​) in the last 10 years. According to the Saffir-Simpson scale,                          Windstorms become Hurricanes when the Magnitude (in knots) becomes 100+. The overall                        average magnitude of windstorms in the past 60 years is about 60 knots which is just less than                                    the Category 1 hurricanes, while it has often reached the magnitude of about 90 knots which is                                  the average magnitude of Category 3.         Areas affected by Wind Storms           
  • 6. County  Wind Storms  Average Magnitude  Duval   497  39.08  Leon   456  41.60  Hillsborough   380  22.02  Marion   331  33.78  Alachua   325  32.15      In Duval County​, ​the cities Jacksonville ​(112, 23 %) and ​Urban Core ​(88, 18 %) were hit in                                    maximum numbers. The Street named ​Frazier St has shown to be the maximum hit in these                                cities. Similarly, ​Tallahassee ​(315, 69 %) in Leon county and ​Dog Lake Tower Rd was affected                                the most however but the impact is mostly distributed in the whole city. ​Tampa (88, 23 %) and                                    Northwest Tampa ​(52, 13 %) are the cities with the most count, specifically Marie Antoinette Ct                                in Tampa and W Virginia Ave in Northwest Tampa in Hillsborough County. ​Ocala ​(97, 29 %)                                and ​Historic District ​(54, 16 %) in Marion County are the areas with the most count and also SE                                      47th Ave in Ocala is the street with the most number of counts. SE 2nd Ave in ​Gainesville ​(165,                                      51 %), ​Alachua counties​ are the streets and cities with the most count in this county.     While comparing the total loss caused by Wind Storms, the following areas have garnered                            maximum.     1. Leon County (935, 7%)  2. Hillsborough County (661, 5%)  3. Polk County (496, 3.4 %)  4. Escambia County (481, 3.3 %)  5. Santa Rosa County (460, 3.2 %)    Miccosukee Rd in ​Tallahassee City ​(585, 62 %) is the street and city with most loss in history in                                      Leon ​County, whereas ​Governor's Walk ​(121, 13%) is the city with second-most wind loss.                            Northwest Tampa (​114, 17%​) and ​Tampa​(​101, 15%​) has the highest sum of loss_rating,                          specifically in ​W Virginia Ave in Northwest Tampa and Theresa Arbor Dr in Tampa with the                                highest sum of loss in streets in ​Hillsborough County. ​Lakeland (116, 23%) and ​Winter                            Haven​(73, 15%) where E Park St and Ave B SE are the respective streets in the cities of Polk                                      County. N Spring St in Downtown (118, 25% ) and ​Pensacola city ( 83, 17 %) is the most                                      impacted street and city in Escambia County. ​Milton city ​(​227, 49%​) and specifically ​Russell                            Harber Rd​ is the street most impacted in Minton City in ​Santa Rosa County​.    
  • 7. Years 2015, 2011, 2016, 2014 had the highest wind_count value which suggests that                          windstorms are increasing with increasing years. But, the maximum loss was in years 2000,                            1998, 1999, 2011, 2014, 2012 so loss has reduced due to better construction practices and                              lesser variance​ in speed (data suggests).     Action Items -     - Approximately 85% of all windstorm-related insurance claims are due to roof damage                        so a thorough inspection of roof builds quality, material type, age of a roof (if                              reconstructed), age of the house, the shape of roof etc.   - May ask homeowners to purchase separate windstorm insurance to provide coverage                      for damages in the riskiest areas(maximum loss areas specific).   - Houses should be categorised on some prerequisites or rated ​on the basis of this list                              during risk profiling and underwriting or build a model that can do this for the business.   - Offer a discount if certain risk mitigation techniques or investment has already been                          made by the property owner against wind damage.    - Grouping together areas of similar risk by peril, to allow underwriters and managers to                            overlay their portfolio of business and streamline decision making for future risk                        allocation.    Key Tips to minimize the Wind Damage    - Trim back tree branches to prevent fallen limbs.  - Secure window shutters to defend against debris.  - Tie-down anything that could fly away and hit the siding or the roof.  - If the siding is looking worse for wear, have a siding professional come out to repair it.                              
  • 8.     Snapshot of HailStorms        Florida suffers from more thunderstorms than any other state in the US due to its geographical                                location and also suffers from a lot of hurricanes which in turn gives rise to tornadoes and                                  which favours the formation and movement of hail clouds. The movement of clouds takes                            place towards the low-pressure areas, areas which are relatively hotter ​(central part of Florida)​.                            - ​refer link for better understanding    The freezing level in a Florida thunderstorm is so high; hail often melts before it reaches the                                  ground. Even though hail is not common to the state, there have been about a dozen events of                                    the hail of over 3 inches being reported in Florida. Although hail events have decreased in the                                  last 10-15 years, research (data) shows the hail size has increased causing more damage than                              before to crops, cars, roofs and in severe cases, fatality.     Action Items     - In the high risk, areas focus more on homes with better roof material, clear outdoors,                              Window material, shingles and other, charge according to the risk profiling.   - Similarly, charge a higher premium from high-risk areas.  - Increase the deductibles so less number of people file for claims.   - Live update to the insurance holders is a safety precaution that can also help the                              company reduce claims and damage to the property 
  • 9. Areas affected by Hailstorms          County  Hailstorms  Maximum Size (inches)  Hillsborough County  273  2.75  Duval County  237  2.75  Polk County  236  4.50  Orange County  225  3.00  Miami-Dade County  217  4.00    Hillsborough County, ​in central west Florida, faced maximum Hail-Storms, specifically, streets                      named ​W Virginia Ave in ​Tampa city (​109, 40%​) and ​N Larry Cir street in ​Brandon city (​35, 13                                       %) had the highest count of hails in Hillsborough County. Likewise, ​Jacksonville city (​221,                            93.248 %​) ​has the highest hail events where Frazier St is the street with the highest hails in                                    Jacksonville, Duval County. Lakeland (​74, 31 %​) ​is the city with the highest hails where the                                street with maximum hails is E Park St in Polk County. E Amelia St in ​Orlando​(143, 63%) is                                    the street in city and city respectively with highest hail events in ​Orange County​.   SW 4th Ave street in ​Miami city(​79, 36%​)​, ​Miami-Dade County has the highest number of hail                                events.    Loss due to Hail Storms represented a slightly different story, top countries with most of the                                loss are -    
  • 10. Polk County (​74, 13 %​), Orange County (​48, 8 %​), Hillsborough County (​27, 5%​), Marion                              County (​21, 4%​), Lake County (​20, 3 %​)    Lakeland (​26, 35 %​) and Lake Wales (​18, 24 %​) has the highest sum_loss_rating in Florida                                 according to data where ​Lake Wales has higher mean_loss_rating in ​Polk County​.                        Furthermore, ​E Park St in Lakeland and S Lakeshore Blvd in Lake Wales has the highest                                sum_loss_rating. Similarly, ​E Amelia St is the street with the highest loss_rating in ​Orlando                            city (​37, 77%​) which has the highest sum_loss_rating in ​Orange County​. ​Tampa(​12, 40.0 %​)                            and Brandon(​6, 20.0 %​) are the cities with the highest loss due to hail, specifically, ​W Virginia                                  Ave and N Larry Cir are the streets with highest sum_loss_rating in ​Hillsborough County​.                            Ocala(​5, 23 %​) and Silver Spring(​5, 24 %​) are the cities and Wenona Ave and ​NE 14th Street                                    Rd in the respective cities have the highest loss due to hail. ​Tavares(​11, 55.0 %​) ​in the city and                                      Lake Dora Dr​ is the street name where maximum loss due to hail occurred.     According to years and occurrence pattern in Hailstorms (year) -     1992, 1991, 1996, 1999 and 2005 are the years with maximum hail loss-rating i.e. loss due to                                  hail. Thus, ​hailstorm events have decreased​ with an increasing year in last few years i.e.  1999, 2003, 2001, 1998 and 2007 had the highest number of hail_stroms.  - There is a different pattern between 1985 to 2000 (from the data)  - Average wind speed has been constant for the last 6-7 years but higher than before.  - Lesser number of hail events than wind events in mostly each month.  - Max_wind_loss occurs in the month’s May, June, July & August.    Hail_size showed an upward inclination with increasing ​average mean temperature in various                        parts in the US, whereas the events of hail have reduced with the passing year for the last 10                                      years. Hail events are dependent on windstorms and thunderstorms. Further References - ​Hail                          Size​, ​Hail-case-study​ & ​Average Temperature    Action Items (Minimise the Hail Damage)    ● Install wind shutters designed to defend against high winds and hail.  ● Purchase & install pressure or high impact windows.  ● Secure doors with heavy-duty bolts at the top and bottom of the door frame.    Hail can cause damage to many parts of the home, but it most commonly hits the roof the                                    hardest. A damaged shingle, in particular, can allow water to get through to the roof deck and                                  cause harm to the ceiling and support beams. This will eventually lead to more leaks in the                                  roof, stains on the ceiling and walls, and potential flooding. The cost to repair a roof following                                  such damages will be expensive, but holding off could lead to even more costly repairs down                                the road. It’s best to perform repairs as quickly as possible. The two types of repairs one might                                    be faced will include: Asphalt and Other Singles (Wood, Metal, Tile) 
  • 11. Snapshot of Tornadoes        Truly destructive tornadoes are most frequently reported in Florida during the spring and                          summer; the most powerful usually strike in spring. Tornadoes develop from severe                        thunderstorms. They are usually preceded by very heavy rain and/or large hail. A thunderstorm                            accompanied by hail indicates that the storm has large amounts of energy and may be severe.                                In general, the larger the hailstones, the more potential there is for damaging winds and/or                              tornadoes. The most violent tornadoes are capable of tremendous destruction with wind                        speeds of 250 mph or more.      Damage paths have exceeded the width of one mile and 50 miles long. Tornadoes generally                              move from southwest to northeast but have also been recorded travelling in any direction. The                              forward speed of a tornado varies from 30 mph to 70 mph. ​What triggers a tornado is still not                                      altogether clear. Tornadoes spawn inside clouds when there is great turbulence and winds of                            various speeds and velocities come in contact with one another. Although there is uncertainty                            about the triggers, meteorologists are able to identify atmospheric conditions conducive to                        tornadic activity. ​tornado florida​ - ​better overview    Action Items    - Implement a geographic information system(GIS) to more efficiently respond to natural  events through risk analysis, real-time events monitoring, and aligned optimized  response, better understand and plan for catastrophes and assign claim adjusters and  response teams where they will likely be needed most based on historic trends.      - As there is no specific reason for tornado’s activation(only hurricane and thunderstorm),  prior knowledge provided to customer can help him and the company reduce claims.      
  • 13. Areas affected by Tornados        County  Tornados  Average Magnitude  (Fujita Scale)  Average Loss  Palm Beach   167  0.38  2.04  Polk   160  0.45  3.03  Pinellas   134  0.58  3.41  Hillsborough   134  0.529  3.24  Miami-Dade   134  0.298  1.88      In Palm Beach County, ​West Palm Beach (​26, 16 %​) and ​Belle Glade (​23, 14 %​) in ​Palm Beach                                      County are the cities with highest tornado events and more specifically, ​Monroe D​r in West                              Palm Beach and ​SW 1st St in Belle Glade are the streets with highest tornado events.                                Correspondingly, ​Lakeland city (​42, 26 %​) in which E Park St stree​t has the highest tornado                                events in ​Polk County​. ​St. Petersburg(​39, 29 %​) and Largo city (19, 14 %) in ​Pinellas County                                  have suffered the highest tornado hits in which ​27th St S and 4th Ave NW in respective cities                                    have the highest count of tornados. ​Tampa(​62, 46 %​) in ​Hillsborough County has the highest                              tornado count, in which ​W Virginia Ave in Tampa has the highest Tornado strikes. ​SW 4th Ave                                  in Miami city​ (57, 43 %) has faced maximum tornados in ​Miami-Dade County​.  All the top 5 counties are in southern Florida and near the higher heat zone, plus the                                  hurricanes mostly hit the southern part of Florida and tornadoes are an aftereffect of                            Hurricanes in these areas.   
  • 14. When considering total loss as a parameter for comparison, top counties suffering most                          damage are -    Palm Beach County​ (167, 5%)  Polk County​ (160, 4.8%)  Hillsborough County ​(134, 4%)  Miami-Dade County​ (134, 4%)  Pinellas County​ (134, 4%)    West Palm Beach (​26, 16 %​) and ​Belle Glade (​23, 13%​) in ​Palm Beach County are the cities                                    with highest tornado loss and more specifically, Monroe Dr in West Palm Beach and SW 1st St                                  in Belle Glade are the streets with highest tornado loss. ​Lakeland city (​42, 26%​) in which E                                  Park St stree​t has the highest tornado events in ​Polk County​. ​St. Petersburg(​39, 29 %​) and                                Largo city (19, 14 %) in ​Pinellas County have suffered the highest tornado hits in which ​27th St                                    S​ and​ 4th Ave NW​ in respective cities have highest losses due to tornadoes.  Tampa(​62, 46%​) in ​Hillsborough County has the highest tornado count, in which ​W Virginia                            Ave in Tampa has the highest count. ​SW 4th Ave in Miami city (57, 42 %)has faced maximum                                    tornados in ​Miami-Dade County​.    1997, 1998, 2004, 1975 and 1995 are the years with maximum Tornado counts. Similarly, 1997,                              1998, 1983, 1979 and 1975 are the years in which maximum tornado loss occurred and also                                1998 has maximum injuries and fatalities with mean_loss_rating above 4.5 were assigned an                          F4 rating but later reduced to F3.  But with time the count and loss due to Tornados and decreased as is evident from the Data.       Action Items (To reduce the Tornado damage)   Tornado damage occurs following high winds from blowing debris. While we can’t do a lot to                                prepare for a tornado, it helps to trim tree branches back on the roof and windows. We can                                    also reinforce the roof to better handle high winds:  ● Shake roof​: Add more nails. ● Slate roof​: Seal down with cement. ● Tile roof​: Place a steel strap over the tiles. ● Asphalt roof​: Nothing can be done, but inspect after.   Invest in a storm cellar, which is built underground and allows great defence against high                              winds during a tornado. A storm shelter is built close to the home so it is easy to access during                                        a tornado and doesn't have to run far for safety. A storm cellar door is built at an angle so that                                          debris blows over the door. This allows for debris to roll over the door rather than trap it, so                                      one can get in and out easily. The confines of a storm cellar for a family is around 8 by 12 feet                                            with an arched roof. It’s made of cement blocks and rebar to ensure maximum defences. 
  • 15.   The combined maximum loss in Top 5 years.    Year   Hail   Tornado  Wind  Total   1998  17  379  1161  1557  2000  14  192  1203  1409  1999  37  181  1159  1377  1993  33  247  662  942  1995  24  289  625  938      Significant tornado events (evident from the data also)    1966, 04 : ​https://en.wikipedia.org/wiki/1966_Tampa_tornado_family  1958, 04 ​https://en.wikipedia.org/wiki/1958_Colfax,_Wisconsin,_tornado_outbreak  2004, 09 ​https://en.wikipedia.org/wiki/Hurricane_Ivan_tornado_outbreak    1997-1998: ​https://en.wikipedia.org/wiki/1998_Kissimmee_tornado_outbreak  “The tornadoes were strong due to an abnormally strong ​jet stream with warm, humid air out                                ahead of the ​cold front​. This is common in the ​El Niño phase of the ​El Niño-Southern                                  Oscillation (ENSO) during the Florida dry season (November 1 - April 30).​[5] During El Niño the                                jet stream is typically stronger and further south near or over Florida in the winter and spring.                                  This greatly increases the odds that conditions will be favourable for strong tornado                          development.” ~Wikipedia     The Phases of ​March to September are the months with most events occurring, Tornadoes                            with higher damage capacity happen when there was an event of hurricane or thunderstorms                            in the area.                             
  • 16. Last 20 years in Florida     Wind Snapshot            Storm Saffir-Simpson Category Date of landfall Year Landfall Intensity (in ​knots​) Landfall Location Charley  4  August 13  2004  130  Cayo Costa​ (1st landfall)/  Near ​Punta Gorda​ (2nd  landfall)  Ivan  3  September 16  2004  105  Near ​Gulf Shores, AL​*  Jeanne  3  September 26  2004  105  Hutchinson Island  Dennis  3  July 10  2005  120  Santa Rosa Island  Wilma  3  October 24  2005  120  Cape Romano  Irma  4  September 10  2017  130  Cudjoe Key​ (1st landfall)/  Marco Island​ (2nd landfall)  ~​ source - Wikipedia          
  • 17. Hail Snapshot                                          https://www.weather.gov/media/mlb/surveys/record_hailstorms.pdf      Date  Area  Size   Total Estimated Loss  1996,   Lake Wales, Polk County  3  $24 mn.   1992, March 6th  Orlando, Orange County  3.4 to 4  $60 mn.  This is still the costliest Florida  hailstorm on record.  1992, 25t March  Orlando, Orange County  3.5  Causing around $40 mn.              
  • 18. Tornado Snapshot            Date Fujita Killed Injuries Information 2/22/1998 3 25 150 The deadliest tornado of the outbreak was a category F3, that touched down initially 1 mile south of Intercession City 2/22/1998 3 13 36 The tornado initially set down near Longwood and moved northeast at 45 mph. The tornado passed through several neighbourhoods in the southeast portion of Sanford, killing 12 people in mobile homes and injuring 70 2/2/2007 3 13 51 The storm that produced the Lady Lake tornado re-intensified and produced a second F3 tornado in a rural area to the west-southwest of Paisley 2/2/2007 3 8 25 The ¼-mile-wide F3 tornado moved across the Lady Lake area, killing 8 people and injuring 10. The tornado damaged 180 residences and destroyed 101. All of the fatalities occurred in mobile homes 4/19/1988 3 4 18 A tornado moved from just southwest of Madison to 11 miles east-northeast of Madison. Seventeen homes were destroyed and more than 30 homes were damaged