1. Vertical Sorting onGIS
Outline of the presentation:
➔Aims of the work (general to particular)
➔The theoretical model (why this one?)
Picture courtesy by Hamish Bowman
➔The instrument capabilities (why GIS?)
➔How the module works right now
➔Strenght and weaknesses
➔Future developes
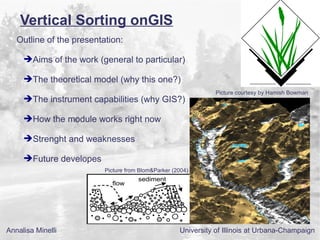
Picture from Blom&Parker (2004)
Annalisa Minelli University of Illinois at Urbana-Champaign
2. Aims
The main aim of this work is to produce something really useful
for researcher and worker in the field of river morphology.
3. Aims
The main aim of this work is to produce something really useful
for researcher and worker in the field of river morphology.
In particular it is aimed to avoid a lot of hard field-
work in granulometric analyses of the river bed
composition and vertical sorting profiles.
4. Aims
The main aim of this work is to produce something really useful
for researcher and worker in the field of river morphology.
In particular it is aimed to avoid a lot of hard field-
work in granulometric analyses of the river bed
composition and vertical sorting profiles.
With the GIS implementation of the
Equilibrium Sorting Model by Blom &
Parker (2006).
5. Theoretical Model
Why this model?
Bedload in sand-gravel bed rivers:
A Framework for the Vertical Sorting Model
Considering the terrain as continuous in depth (without the specification of an Active Layer but
working on the probability of each sediment to be entrained and held by the current) the model of
Blom & Parker (2004) is powerful because allows you to consider:
6. Theoretical Model
Why this model?
Bedload in sand-gravel bed rivers:
A Framework for the Vertical Sorting Model
Considering the terrain as continuous in depth (without the specification of an Active Layer but
working on the probability of each sediment to be entrained and held by the current) the model of
Blom & Parker (2004) is powerful because allows you to consider:
✔ Sediment mixtures;
✔ Vertical fluxes of mixing sediment;
✔ Bedforms.
and their interaction.
7. Theoretical Model
Why this model?
Bedload in sand-gravel bed rivers:
A Framework for the Vertical Sorting Model
Considering the terrain as continuous in depth (without the specification of an Active Layer but
working on the probability of each sediment to be entrained and held by the current) the model of
Blom & Parker (2004) is powerful because allows you to consider:
✔ Sediment mixtures;
✔ Vertical fluxes of mixing sediment;
✔ Bedforms.
and their interaction.
Parker, Paola & Leclair (2000)
8. Theoretical Model
Why this model?
Bedload in sand-gravel bed rivers:
A Framework for the Vertical Sorting Model
Considering the terrain as continuous in depth (without the specification of an Active Layer but
working on the probability of each sediment to be entrained and held by the current) the model of
Blom & Parker (2004) is powerful because allows you to consider:
✔ Sediment mixtures;
✔ Vertical fluxes of mixing sediment;
✔ Bedforms.
and their interaction.
Parker, Paola & Leclair (2000)
Blom & Parker (2004)
9. Theoretical Model
Why this model?
Bedload in sand-gravel bed rivers:
A Framework for the Vertical Sorting Model
Considering the terrain as continuous in depth (without the specification of an Active Layer but
working on the probability of each sediment to be entrained and held by the current) the model of
Blom & Parker (2004) is powerful because allows to consider:
✔ Sediment mixtures;
✔ Vertical fluxes of mixing sediment;
✔ Bedforms.
and their interaction.
Blom & Parker (2006)
Powerful but quite complex in relation to often (un)available field data
10. Theoretical Model
Why this model?
Bedload in sand-gravel bed rivers:
A Framework for the Vertical Sorting Model
Considering the terrain as continuous in depth (without the specification of an Active Layer but
working on the probability of each sediment to be entrained and held by the current) the model of
Blom & Parker (2004) is powerful because allows to consider:
✔ Sediment mixtures;
✔ Vertical fluxes of mixing sediment;
✔ Bedforms.
and their interaction.
Blom & Parker (2006)
Powerful but quite complex in relation to often (un)available field data
Simplified models:
Equilibrium Sorting Sorting Evolution
11. Theoretical Model
Why this model?
Bedload in sand-gravel bed rivers:
A Framework for the Vertical Sorting Model
Considering the terrain as continuous in depth (without the specification of an Active Layer but
working on the probability of each sediment to be entrained and held by the current) the model of
Blom & Parker (2004) is powerful because allows to consider:
✔ Sediment mixtures;
✔ Vertical fluxes of mixing sediment;
✔ Bedforms.
and their interaction.
Blom & Parker (2006)
Powerful but quite complex in relation to often (un)available field data
Simplified models:
Equilibrium Sorting Sorting Evolution
14. The Instrument
Why GIS?
The GRASS GIS Project
All GISs are able to manage georeferred data.
Some GISs are powerful in analyzing geographical data.
15. The Instrument
Why GIS?
The GRASS GIS Project
All GISs are able to manage georeferred data.
Some GISs are powerful in analyzing geographical data.
Only Open Source GISs give each one the opportunity to “create” something if ever
you have some capabilities in geoscicences and programming.
16. The Instrument
Why GIS?
The GRASS GIS Project
All GISs are able to manage georeferred data.
Some GISs are powerful in analyzing geographical data.
Only Open Source GISs give each one the opportunity to “create” something if ever
you have some capabilities in geoscicences and programming.
GRASS GIS is a 27th year old project. It is born here in Champaign (at USA Military base of
CERL) and the core of the project is due to Van Warren, Dvorak et alii, some of them students
at UI. This GIS, since 1987 (release of the code), advances in many directions developed by
volountary and researcher and it is continuously updated and debugged by all the users.
17. The Instrument
Why GIS?
The GRASS GIS Project
All GISs are able to manage georeferred data.
Some GISs are powerful in computational analyses of geographical data.
Only Open Source GISs give each one the opportunity to “create” something if ever
you have some capabilities in geoscicences and programming.
GRASS GIS is a 27th year old project. It is born here in Champaign (at USA Military base of
CERL) and the core of the project is due to Van Warren, Dvorak et alii, some of them students
at UI. This GIS, since 1987 (release of the code), advances in many directions developed by
volountary and researcher and it is continuously updated and debugged by all the users.
So it can count on an active and propositive community (as it is the one of the Open Source
software) that uses and developes GRASS for two main causes: work&passion, and a head of
research that is actually composed by some international institution and two head-researcher:
H. Mitasova and M. Neteler.
18. The Instrument
Why GIS?
The GRASS GIS Project
All GISs are able to manage georeferred data.
Some GISs are powerful in computational analyses of geographical data.
Only Open Source GISs give each one the opportunity to “create” something if ever
you have some capabilities in geoscicences and programming.
GRASS GIS is a 27th year old project. It is born here in Champaign (at USA Military base of
CERL) and the core of the project is due to Van Warren, Dvorak et alii, some of them students
at UI. This GIS, since 1987 (release of the code), advances in many directions developed by
volountary and researcher and it is continuously updated and debugged by all the users.
So it can count on an active and propositive community (as it is the one of the Open Source
software) that uses and developes GRASS for two main causes: work&passion, and a head of
research that is actually composed by some international institution and two head-researcher:
H. Mitasova and M. Neteler.
19. The Instrument
Why GIS?
The GRASS GIS Project
All GISs are able to manage georeferred data.
Some GISs are powerful in computational analyses of geographical data.
Only Open Source GISs give each one the opportunity to “create” something if ever
you have some capabilities in geoscicences and programming.
I developed code for GRASS GIS since 2005, and in this time I had the opportunity to handle
(and solve) many different problems:
● Automatically evaluating the quantitative visual impact of aerogenerators
● Creating a landslide susceptibility map with the application of index-analysis
● Implementation of Clarke model to evaluate the hydrograph at a date river cross section
● Automatically extract and ordering a river network by Horton-Strahler
● Implementation of A.J. Broscoe theory to find the equilibrium configuration of a river network
● Automatically find the main channel on a river network
● Modeling landslide dams obstructing rivers
● Individuating and modeling bed-form dimension of rivers
20. The Instrument
Why GIS?
The GRASS GIS Project
All GISs are able to manage georeferred data.
Some GISs are powerful in computational analyses of geographical data.
Only Open Source GISs give each one the opportunity to “create” something if ever
you have some capabilities in geoscicences and programming.
I developed code for GRASS GIS since 2005, and in this time I had the opportunity to handle
(and solve) many different problems:
● Automatically evaluating the quantitative visual impact of aerogenerators
● Creating a landslide susceptibility map with the application of index-analysis
● Implementation of Clarke model to evaluate the hydrograph at a date river cross section
● Automatically extract and ordering a river network by Horton-Strahler
● Implementation of A.J. Broscoe theory to find the equilibrium configuration of a river network
● Automatically find the main channel on a river network
● Modeling landslide dams obstructing rivers
● Individuating and modeling bed-form dimension of rivers
Great capabilities, even increasing
21. The Instrument
Why GIS?
The GRASS GIS Project
All GISs are able to manage georeferred data.
Some GISs are powerful in computational analyses of geographical data.
Only Open Source GISs give each one the opportunity to “create” something if ever
you have some capabilities in geoscicences and programming.
I developed code for GRASS GIS since 2005, and in this time I had the opportunity to handle
(and solve) many different problems:
● Automatically evaluating the quantitative visual impact of aerogenerators
● Creating a landslide susceptibility map with the application of index-analysis
● Implementation of Clarke model to evaluate the hydrograph at a date river cross section
● Automatically extract and ordering a river network by Horton-Strahler
● Implementation of A.J. Broscoe theory to find the equilibrium configuration of a river network
● Automatically find the main channel on a river network
● Modeling landslide dams obstructing rivers
● Individuating and modeling bed-form dimension of rivers
Great capabilities, even increasing
The software models itself on your specific needs
22. The Module
How does it work?
eqsm.sh
Implementation started in January 2010, the module implements the Equilibrium Sorting Model
by Blom&Parker (2006) for analyses of vertical sorting profiles.
The module is in alpha developing stage.
23. The Module
How does it work?
eqsm.sh
Implementation started in January 2010, the module implements the Equilibrium Sorting Model
by Blom&Parker (2006) for analyses of vertical sorting profiles.
The module is in alpha developing stage.
24. The Module
How does it work?
eqsm.sh
Implementation started in January 2010, the module implements the Equilibrium Sorting Model
by Blom&Parker (2006) for analyses of vertical sorting profiles.
The module is in alpha developing stage.
2 parts:
a)Geographical: terrain analysis and
bedform investigation; individuation of
stoss and lee faces; extraction of
geometrical parameters for the bed
description.
b)Computational: implementation in R of a
procedure to iteratively solve the
equilibrium equation in order to evaluate
Fi values.
25. The Module
How does it work?
eqsm.sh
Implementation started in January 2010, the module implements the Equilibrium Sorting Model
by Blom&Parker (2006) for analyses of vertical sorting profiles.
The module is in alpha developing stage.
2 parts:
a)Geographical: terrain analysis and
bedform investigation; individuation of
stoss and lee faces; extraction of
geometrical parameters for the bed
description.
b)Computational: implementation in R of a
procedure to iteratively solve the
equilibrium equation in order to evaluate
Fi values.
NOTE:
● implements an interactive procedure to
select the cross section to evaluate Fi on;
● examinates a bimodal mixture;
● at the moment works only for the bed
surface.
26. The Module
How does it work?
eqsm.sh
Implementation started in January 2010, the module implements the Equilibrium Sorting Model
by Blom&Parker (2006) for analyses of vertical sorting profiles.
The module is in alpha developing stage.
→ Steady form of the Blom&Parker framework:
27. The Module
How does it work?
eqsm.sh
Implementation started in January 2010, the module implements the Equilibrium Sorting Model
by Blom&Parker (2006) for analyses of vertical sorting profiles.
The module is in alpha developing stage.
→ Steady form of the Blom&Parker framework:
→ Hypotesis on the equilibrium of entrainment and deposition rate:
28. The Module
How does it work?
eqsm.sh
Implementation started in January 2010, the module implements the Equilibrium Sorting Model
by Blom&Parker (2006) for analyses of vertical sorting profiles.
The module is in alpha developing stage.
→ Steady form of the Blom&Parker framework:
→ Hypotesis on the equilibrium of entrainment and deposition rate:
→ Input of:
● 2 values of grainsize to investigate (bimodal mixture);
● 2 first hypotetical values of Fi, for the section, for the surface;
● 2 values for Fa, which describes the volume fraction composition of bedload;
● Bedload material density;
● Shear stress.
29. The Module
How does it work?
eqsm.sh
Implementation started in January 2010, the module implements the Equilibrium Sorting Model
by Blom&Parker (2006) for analyses of vertical sorting profiles.
The module is in alpha developing stage.
→ Solving iteratively the three equations below:
a) which gives one value for: mleeE =∑ i∗F leeiE
s−∗g −
∗2
mleeE
−0.3∗ mleeE − i 1000
b) which gives two values for: iE = ∗
bE
∑ F leeiE
2
∗i − mleeE
c) which gives two values for:
iE iE∗a −1
F aiE [1− − ]
6 6∗a∗tg
bmax
iE iE∗a −1 z
∑ F aiE [1− −
6 6∗a∗tg
] ∫ J ∗ ∗[ J z ∗1 iE∗z star ]∗ pbE∗d b
F leeiE z = ∗ bmin
J z ∗1iE∗z star bmax
J z
∫ ∗∗ pbE∗d b
bmin
30. The Module
How does it work?
eqsm.sh
Implementation started in January 2010, the module implements the Equilibrium Sorting Model
by Blom&Parker (2006) for analyses of vertical sorting profiles.
The module is in alpha developing stage.
→ Solving iteratively the three equations below:
a) which gives one value for: mleeE =∑ i∗F leeiE
s−∗g −
∗2
mleeE
−0.3∗ mleeE − i 1000
b) which gives two values for: iE = ∗
bE
∑ F leeiE
2
∗i − mleeE
c) which gives two values for:
iE iE∗a −1
F aiE [1− − ]
6 6∗a∗tg
bmax
iE iE∗a −1 z
∑ F aiE [1− −
6 6∗a∗tg
] ∫ J ∗ ∗[ J z ∗1 iE∗z star ]∗ pbE∗d b
F leeiE z = ∗ bmin
J z ∗1iE∗z star bmax
J z
∫ ∗∗ pbE∗d b
bmin
31. The Module
How does it work?
eqsm.sh
Implementation started in January 2010, the module implements the Equilibrium Sorting Model
by Blom&Parker (2006) for analyses of vertical sorting profiles.
The module is in alpha developing stage.
→ Solving iteratively the three equations below:
a) which gives one value for: mleeE =∑ i∗F leeiE
s−∗g −
∗2
mleeE
−0.3∗ mleeE − i 1000
b) which gives two values for: iE = ∗
bE
∑ F leeiE
2
∗i − mleeE
c) which gives two values for:
iE iE∗a −1
F aiE [1− − ]
6 6∗a∗tg
bmax
iE iE∗a −1 z
∑ F aiE [1− −
6 6∗a∗tg
] ∫ J ∗ ∗[ J z ∗1 iE∗z star ]∗ pbE∗d b
F leeiE z = ∗ bmin
J z ∗1iE∗z star bmax
J z
∫ ∗∗ pbE∗d b
bmin
32. The Module
How does it work?
eqsm.sh
Implementation started in January 2010, the module implements the Equilibrium Sorting Model
by Blom&Parker (2006) for analyses of vertical sorting profiles.
The module is in alpha developing stage.
→ Output:
● The values of Fi at each iteraction (maximum fixed at 10 turns) for the bed surface;
● The vector file of the lee faces whit a database of geometrical parameters useful for the
analyses;
● The graphs of bedload geometry parameters: delta, delta_log, eta_t and eta_b with
interpolating curves
33. The Module
How does it work?
eqsm.sh
Implementation started in January 2010, the module implements the Equilibrium Sorting Model
by Blom&Parker (2006) for analyses of vertical sorting profiles.
The module is in alpha developing stage.
→ Output:
● The values of Fi at each iteraction (maximum fixed at 10 turns) for the bed surface;
● The vector file of the lee faces whit a database of geometrical parameters useful for the
analyses;
● The graphs of bedload geometry parameters: delta, delta_log, eta_t and eta_b with
interpolating curves
34. The Module
How does it work?
eqsm.sh
Implementation started in January 2010, the module implements the Equilibrium Sorting Model
by Blom&Parker (2006) for analyses of vertical sorting profiles.
The module is in alpha developing stage.
→ Output:
● The values of Fi at each iteraction (maximum fixed at 10 turns) for the bed surface;
● The vector file of the lee faces whit a database of geometrical parameters useful for the
analyses;
● The graphs of bedforms geometry parameters: delta, delta_log, eta_t and eta_b
with interpolating curves
35. The Module
Strenght and weaknesses
s eqsm.sh
The module gives the possibility to the researcher to apply the method easily and and
automatically, wherever he wants, weherever bedforms are well defined;
The definition of bedforms, their frequency and the individuation of dunes instead of ripples or
flat bed or antidunes, can be done automatically extrapolating them by an high resolution DEM,
fixing “a priori” some theoretical criteria to choose one or another condition(*) – and so knowing
in advance WHERE the method application sould be reliable;
The usage of Open Source GIS let you free to apply the analyses method you prefer, for
example: in this first implementation the individuation of stoss e lee faces of the river reach has
been done using slope values (extrapolated by the DEM), but it is possible to use ANY other
more-valid method, because you can create your own solution.
36. The Module
Strenght and weaknesses
s eqsm.sh
The module gives the possibility to the researcher to apply the method easily and and
automatically, wherever he wants, weherever bedforms are well defined;
The definition of bedforms, their frequency and the individuation of dunes instead of ripples or
flat bed or antidunes, can be done automatically extrapolating them by an high resolution DEM,
fixing “a priori” some theoretical criteria to choose one or another condition(*) – and so knowing
in advance WHERE the method application sould be reliable;
The usage of Open Source GIS let you free to apply the analyses method you prefer, for
example: in this first implementation the individuation of stoss e lee faces of the river reach has
been done using slope values (extrapolated by the DEM), but it is possible to use ANY other
more-valid method, because you can create your own solution.
37. The Module
Strenght and weaknesses
s eqsm.sh
The module gives the possibility to the researcher to apply the method easily and and
automatically, wherever he wants, weherever bedforms are well defined;
The definition of bedforms, their frequency and the individuation of dunes instead of ripples or
flat bed or antidunes, can be done automatically extrapolating them by an high resolution DEM,
fixing “a priori” some theoretical criteria to choose one or another condition(*) – and so knowing
in advance WHERE the method application sould be reliable;
The usage of Open Source GIS let you free to apply the analyses method you prefer, for
example: in this first implementation the individuation of stoss e lee faces of the river reach has
been done using slope values (extrapolated by the DEM), but it is possible to use ANY other
more-valid method, because you can create your own solution.
(*) for example correlating the bedform dimension with the width of the river point-to-point
38. The Module
Strenght and weaknesses
s eqsm.sh
The module gives the possibility to the researcher to apply the method easily and and
automatically, wherever he wants, weherever bedforms are well defined;
The definition of bedforms, their frequency and the individuation of dunes instead of ripples or
flat bed or antidunes, can be done automatically extrapolating them by an high resolution DEM,
fixing “a priori” some theoretical criteria to choose one or another condition(*) – and so knowing
in advance WHERE the method application sould be reliable;
The usage of Open Source GIS let you free to apply the analyses method you prefer, for
example: in this first implementation the individuation of stoss e lee faces of the river reach has
been done using slope values (extrapolated by the DEM), but it is possible to use ANY other
more-valid method, because you can create your own solution.
(*) for example correlating the bedform dimension with the width of the river point-to-point
39. The Module
Strenght and weaknesses
s eqsm.sh
The module gives the possibility to the researcher to apply the method easily and and
automatically, wherever he wants, weherever bedforms are well defined;
The definition of bedforms, their frequency and the individuation of dunes instead of ripples or
flat bed or antidunes, can be done automatically extrapolating them by an high resolution DEM,
fixing “a priori” some theoretical criteria to choose one or another condition(*) – and so knowing
in advance WHERE the method application sould be reliable;
The usage of Open Source GIS let you free to apply the analyses method you prefer, for
example: in this first implementation the individuation of stoss e lee faces of the river reach has
been done using slope values (extrapolated by the DEM), but it is possible to use ANY other
more-valid method, because you can create your own solution.
wThe major weakness of this method is the avalaibility of high resolution data, as requested for a
reasonable analysis in these terms;
The module has to be well tested and validated before being applied extensively, and so it is
necessary to have a lot of field data to verify the predictions;
Possible difficulty to well represent in GIS physical processes (translation in “GIS language” of
real phenomena requires sometimes ALL our imagination!).
(*) for example correlating the bedform dimension with the width of the river point-to-point
40. The Module
Strenght and weaknesses
s eqsm.sh
The module gives the possibility to the researcher to apply the method easily and and
automatically, wherever he wants, weherever bedforms are well defined;
The definition of bedforms, their frequency and the individuation of dunes instead of ripples or
flat bed or antidunes, can be done automatically extrapolating them by an high resolution DEM,
fixing “a priori” some theoretical criteria to choose one or another condition(*) – and so knowing
in advance WHERE the method application sould be reliable;
The usage of Open Source GIS let you free to apply the analyses method you prefer, for
example: in this first implementation the individuation of stoss e lee faces of the river reach has
been done using slope values (extrapolated by the DEM), but it is possible to use ANY other
more-valid method, because you can create your own solution.
wThe major weakness of this method is the avalaibility of high resolution data, as requested for a
reasonable analysis in these terms;
The module has to be well tested and validated before being applied extensively, and so it is
necessary to have a lot of field data to verify the predictions;
Possible difficulty to well represent in GIS physical processes (translation in “GIS language” of
real phenomena requires sometimes ALL our imagination!).
(*) for example correlating the bedform dimension with the width of the river point-to-point
41. The Module
Strenght and weaknesses
s eqsm.sh
The module gives the possibility to the researcher to apply the method easily and and
automatically, wherever he wants, weherever bedforms are well defined;
The definition of bedforms, their frequency and the individuation of dunes instead of ripples or
flat bed or antidunes, can be done automatically extrapolating them by an high resolution DEM,
fixing “a priori” some theoretical criteria to choose one or another condition(*) – and so knowing
in advance WHERE the method application sould be reliable;
The usage of Open Source GIS let you free to apply the analyses method you prefer, for
example: in this first implementation the individuation of stoss e lee faces of the river reach has
been done using slope values (extrapolated by the DEM), but it is possible to use ANY other
more-valid method, because you can create your own solution.
wThe major weakness of this method is the avalaibility of high resolution data, as requested for a
reasonable analysis in these terms;
The module has to be well tested and validated before being applied extensively, and so it is
necessary to have a lot of field data to verify the predictions;
Possible difficulty to well represent in GIS physical processes (translation in “GIS language” of
real phenomena requires sometimes ALL our imagination!).
(*) for example correlating the bedform dimension with the width of the river point-to-point
42. The Module
Strenght and weaknesses
s eqsm.sh
The module gives the possibility to the researcher to apply the method easily and and
automatically, wherever he wants, weherever bedforms are well defined;
The definition of bedforms, their frequency and the individuation of dunes instead of ripples or
flat bed or antidunes, can be done automatically extrapolating them by an high resolution DEM,
fixing “a priori” some theoretical criteria to choose one or another condition(*) – and so knowing
in advance WHERE the method application sould be reliable;
The usage of Open Source GIS let you free to apply the analyses method you prefer, for
example: in this first implementation the individuation of stoss e lee faces of the river reach has
been done using slope values (extrapolated by the DEM), but it is possible to use ANY other
more-valid method, because you can create your own solution.
wThe major weakness of this method is the avalaibility of high resolution data, as requested for a
reasonable analysis in these terms;
The module has to be well tested and validated before being applied extensively, and so it is
necessary to have a lot of field data to verify the predictions;
Possible difficulty to well represent in GIS physical processes (translation in “GIS language” of
real phenomena requires sometimes ALL our imagination!).
(*) for example correlating the bedform dimension with the width of the river point-to-point
43. The Module
Strenght and weaknesses
s eqsm.sh
The module gives the possibility to the researcher to apply the method easily and and
automatically, wherever he wants, weherever bedforms are well defined;
The definition of bedforms, their frequency and the individuation of dunes instead of ripples or
flat bed or antidunes, can be done automatically extrapolating them by an high resolution DEM,
fixing “a priori” some theoretical criteria to choose one or another condition(*) – and so knowing
in advance WHERE the method application sould be reliable;
The usage of Open Source GIS let you free to apply the analyses method you prefer, for
example: in this first implementation the individuation of stoss e lee faces of the river reach has
been done using slope values (extrapolated by the DEM), but it is possible to use ANY other
more-valid method, because you can create your own solution.
wThe major weakness of this method is the avalaibility of high resolution data, as requested for a
reasonable analysis in these terms;
The module has to be well tested and validated before being applied extensively, and so it is
necessary to have a lot of field data to verify the predictions;
Possible difficulty to well represent in GIS physical processes (translation in “GIS language” of
real phenomena requires sometimes ALL our imagination!).
But the main advantage is that when you manage a DEM, you manage a physical model.
Which model describes better the reality than the reality itself?
(*) for example correlating the bedform dimension with the width of the river point-to-point
46. The Module
Future Developes
eqsm.sh
Translate the module in Python
Test adequately the model;
Expand in depth the analyses;
47. The Module
Future Developes
eqsm.sh
Translate the module in Python
Test adequately the model;
Expand in depth the analyses;
ONLY WHEN everything works well,
implementing unsteady conditions too
(Sorting Evolution Model).