2. 1. Introduction
In a society that is highly dependent on energy derived from petro-
leum, constant crude oil extraction and transportation lead to virtually
unavoidable releases into the environment (Wang et al., 2013). On
April 20, 2010, a turbulent mixture of gas and a light, sweet (Macondo
type) crude oil was released into the Gulf of Mexico as a result of the
Deepwater Horizon (DWH) drilling rig incident in the Mississippi Canyon
Block 252 (MC252) (Camilli et al., 2012; McNutt et al., 2012; Aeppli
et al., 2012). In the days following the accident, some of the escaped
Macondo oil rose 1500 m to the surface of the ocean, creating oil slicks
some of which ultimately reached the coast (Liu et al., 2012). In the
event of crude oil discharges into marine environments, weathering
processes such as dissolution, dispersion, emulsification, evaporation,
biodegradation, and photo-oxidation (Wang et al., 2013; Aeppli et al.,
2012) constantly modify the oil composition (Wang et al., 2013;
Jordan and Payne, 1980). Weathering, thus, adds compositional com-
plexity to what is already one of the most complex natural mixtures
known to mankind (Hsu et al., 2011). The thousands of compounds
present in crude oil can be divided into four main classes: saturated hy-
drocarbons (straight, branched, and cyclic alkanes), aromatic com-
pounds (containing one or more rings), resins (relatively high
molecular weight and polar compounds, which are soluble in the oil,
and contain heteroatoms such as nitrogen, sulfur, and oxygen), and
asphaltenes (highest molecular weight and most polar compounds,
also containing heteroatoms such as nitrogen, oxygen and sulfur but un-
like resins insoluble in the oil) (Garrett et al., 1998; Speight, 2004).
These different compound types are affected differently by oil
weathering as each of the weathering processes is selective towards
specific compounds. For example, evaporation and emulsification de-
plete the oil of its volatile compounds, while water washing removes
water-soluble compounds (Mansuy et al., 1997), and biodegradation af-
fects primarily n-alkanes followed by branched and cyclic hydrocar-
bons, closely followed by naphthenic compounds (Wang et al., 2013).
Photo-oxidation has been shown to primarily modify select polycyclic
aromatic hydrocarbons (PAHs), and in addition to other oxidation
mechanisms (including biodegradation) to be responsible for the in-
crease of the oxygen content in the remaining oil (McKenna et al.,
2013; Prince et al., 2003). Since several constituents in crude oil have
been associated with some degree of toxicity, the characterization of
fresh and especially of the modified weathered crude oil is crucial in
order to understand the potential environmental effects.
Conventional oil characterization by gas chromatography flame
ionization detection (GC–FID), or gas chromatography mass spectrom-
etry (GC–MS) (Maki et al., 2001), has been able to elucidate weathering
related compositional changes of hydrocarbons and PAHs. However,
coelution and the inability to analyze polar, nonvolatile, or thermally
unstable compounds (Wang et al., 2013; Garrett et al., 1998; McKenna
et al., 2013; Burns, 1993; Charrie-Duhaut et al., 2000), limit the amount
and type of analytes that can be detected (McKenna et al., 2013). Conse-
quently, both techniques tend to overlook the analysis of oxygenated
hydrocarbons (Aeppli et al., 2012), which is particularly problematic
for weathered oil that has a lower amount of low-boiling and non-
polar compounds that are GC amenable, and has a higher amount of
high-boiling and polar compounds (Aeppli et al., 2012). The character-
istic oil “hump” or unresolved complex mixture (UCM), which is a
raised baseline due to the coelution of numerous compounds and is ob-
served in GC analysis and is most prominent in weathered oils, is an in-
dication of the limitations of these previously described techniques
(Gough and Rowland, 1990). In order to resolve a larger fraction of
the components present in oil, more advanced techniques need to be
used, such as two-dimensional gas chromatography mass spectrometry
(GC×GC–MS) or Fourier transform mass spectrometry (FT–MS).
GC×GC–MS somewhat expands the accessible analytical window and
allows for isomer differentiation (McKenna et al., 2013); however, it is
still limited to volatile compounds that are GC amenable (up to C45).
FT–MS, on the other hand, provides the possibility to extend this
range up to C100 (McKenna et al., 2013), and to analyze nonvolatile
and/or highly polar compounds (Qian et al., 2001a, 2001b; Mapolelo
et al., 2009). Moreover, FT–MS analysis provides ultrahigh-resolution
(Kaiser et al., 2011; Podgorski et al., 2013), and mass accuracy of less
than 1 ppm (with internal calibration) (Savory et al., 2011), which
leads to the possibility of assigning elemental compositions (Rodgers
et al., 2005). The ability to couple several different ionization techniques
to FT-MS is also crucial in the analysis of complex and diversified mix-
tures such as crude oil. Common sources that have been used are
electrospray ionization (ESI) and atmospheric pressure photo ionization
(APPI) (McKenna et al., 2013), but others such as atmospheric pressure
chemical ionization (APCI) (Roussis and Fedora, 2002), and atmospher-
ic pressure laser ionization (APLI) (Schrader et al., 2008) have also been
employed. APPI is particularly useful to characterize nonpolar or slightly
polar species, while ESI offers the advantage of accessing more polar
species while avoiding interferences of the hydrocarbon matrix. As a re-
sult, comprehensive characterizations of weathered oils must be
achieved by a combination of multiple techniques, aimed at accessing
the maximum possible number of compounds.
A big portion of the previous studies on the Macondo oil released
during the DWH accident have focused mainly on common analytes
that are GC amenable, such as PAHs, alkanes, and hopane and sterane
biomarkers (Aeppli et al., 2012; McKenna et al., 2013). Unsurprisingly,
reports have shown that, with increased weathering, the oil was deplet-
ed of most of its saturated and aromatic compounds (Aeppli et al., 2012;
Atlas and Hazen, 2011; Carmichael et al., 2012; Kostka et al., 2011; Lima
et al., 2005; Liu et al., 2012). However, McKenna et al. (2013) estimated
that in surface slicks only about 40% of the total mass of hydrocarbons
could be analyzed by conventional GC-based techniques, while Reddy
et al. (2012) estimated that for weathered Macondo oil traditional
analytes only account for less than 25% of the oil mass. Moreover, an
increase in oxygenated hydrocarbons with a concurrent decrease in
saturated hydrocarbons and aromatics was reported in weathered oil
deposited at the shoreline (Aeppli et al., 2012). Hall et al. (2013) further
predicted by GC×GC–MS analysis that this oxygenated fraction is large-
ly due to the oxidation of saturates, which has only recently been shown
to be a significant process during oil weathering (Hall et al., 2013). FT-
ICR analysis of oiled sands has shown a similar trend, more specifically
detecting the possible formation of carboxylic acids, ketones, and alco-
hols (Ruddy et al., 2014), all being consistent with photo-oxidation
and biodegradation transformation products. However, a significant
portion of the currently available knowledge originates from GC×GC–
MS analysis, and thus only applies to a limited amount of compounds.
Data currently available from ultrahigh-resolution mass spectrometry
(UHRMS) is limited, which evidences a strong need to expand the
knowledge on weathering products of the Macondo crude oil by FT–
MS techniques. This study, therefore, aims to characterize and identify
compositional changes that occurred in a weathering series (fresh
crude oil, two distinct oil slicks, and a beached oil mat) of the Macondo
crude oil. UHRMS coupled with APPI and ESI in both positive and nega-
tive ionization mode are used in order to expand the range and type of
compounds that can be detected.
2. Materials and methods
2.1. Samples and preparation
Four different field-collected oils were characterized in this study.
The unweathered Macondo oil (denoted as Massachusetts oil from
hereon) was collected by a production vessel on August 15, 2010 direct-
ly at the MC-252 wellhead, and transferred to the Massachusetts oil
barge. Two weathered oils originating from two distinct surface slicks
were skimmed from the Gulf of Mexico, and were collected by the
USCG Cutter Juniper and Barge No. CTC02404 on July 19, 2010 and
July 29, 2010, respectively (referred to as Juniper and CTC oil from
601A.K. Huba, P.R. Gardinali / Science of the Total Environment 563–564 (2016) 600–610
3. now on). The last oil was buried in the shoreline of Elmer's Island (Lou-
isiana), was exposed after hurricane Isaac, and was subsequently col-
lected in August 2012 (denoted as Elmer's Island mat from hereon). A
20,000 ppm oil stock solution was then created for the four oils by dis-
solving approximately 1 g of crude oil in 50 mL of methylene chloride.
The stock solutions were then diluted twofold to a final concentration
of 10,000 ppm for GC–FID and GC–MS analyses. GC–MS samples were
spiked with 100 μL of a PAH surrogate standard mixture (naphtha-
lene-d8, acenaphtene-d10, phenanthrene-d10, and perylene-d12), as
well as 100 μL of a PAH internal standard mixture (fluorene-d10 and
benzo(a)pyrene-d12). GC–FID samples, on the other hand, were spiked
with 100 μL of an aliphatic surrogate (n-dodecane-d26, n-eicosane-d42,
n-triacontane-d62, p-terphenyl-d14) as well as 100 μL of an aliphatic in-
ternal standard (5α androstane and n-hexadecane-d34). For UHRMS
analysis 50 μL of oil stock was left to air dry, and was subsequently
reconstituted into 50:50 toluene/methanol to a final concentration of
2500, 5000, 5000, and 10,000 ppm for Massachusetts, CTC, Juniper,
and Elmer's Island mat, respectively. The final solutions were spiked
with 1% formic acid, and 1% ammonium hydroxide for positive and neg-
ative ionization mode, respectively. An internal standard (tetradecanoic
14,14,14-d3 acid, 11.6 ppm) was added to all UHRMS samples. For
the model compound study, Elmer's Island mat was spiked with
ten standards covering a range of functional group types: phenol, 2-
ethylphenol, 4-isopropylphenol, coprostane, coprostan-3-one, choles-
terol, tetradecanoic 14,14,14,-d3 acid (all at approximately 10 ppm),
coprostan-3-ol (1 ppm), tetracosanol (2 ppm), and tetracosanoic acid
(5 ppm). All the solvents used were Optima LC/MS grade and were pur-
chased from Fisher Scientific (Fair Lawn, NJ, USA).
2.2. GC–FID analysis
GC–FID analysis was carried out on a Thermo Trace 1310 GC-FID, fitted
with an Rxi®-5Sil fused silica capillary column (30 m × 0.25 mm ×
0.25 μm). A sample volume of 2 μL was injected (in splitless mode) into
the instrument. The inlet temperature was held at 325 °C, and the carrier
gas was set at a constant flow rate of 2.4 mL/min. The starting oven tem-
perature was 40 °C, followed by an initial 7.5 °C/min ramp to 215 °C, and a
second 10 °C/min ramp to 320 °C, and then a final hold of 13 min.
2.3. GC–MS analysis
GC–MS analysis was carried out in electron impact mode (70eV) on
a Thermo Finnigan Ultra trace TSQ Quantum XLC GC–MS operated in
selected ion monitoring (SIM) mode. The GC–MS was fitted with an
Rxi®-5Sil fused silica capillary column (30 m × 0.25 mm × 0.25 μm),
and helium was used as the carrier gas and set at a constant flow of
1.7 mL/min. A sample volume of 2 μL was introduced (in splitless
mode) into the injector which was held at 300 °C. The initial oven tem-
perature was 40 °C, followed by a 7.5 °C/min ramp to 295 °C, and an
eight minute hold.
2.4. Ultrahigh-resolution mass spectrometric analysis
Analysis was carried out on a Q Exactive Orbitrap (Thermo Scientific,
NJ, USA) by direct infusion through a 500 μL syringe (Thermo Scientific,
NJ, USA) at a typical flow rate of 30 μL/min. In addition to the acquisition
of the sample, each infusion data file contained acquisitions of a mobile
phase background, and a solvent background. Data were acquired in full
scan mode over a mass range of 80–1200 m/z, and the instrument was
operated at a resolution of 140,000 FWHM. The automatic gain control
(AGC) target was set to 1 × e6
, while the maximum injection time was
set to 50 ms. External mass calibration provided a mass accuracy of
5 ppm. The APPI ionization source (Thermo Scientific, NJ, USA) was
equipped with a krypton UV gas discharge lamp (Syagen Technology,
Inc, Tustin, CA) that produces 10–10.2 eV photons (120 nm). N2 sheath
gas at 40 psi was used to facilitate the ionization, while the auxiliary
Fig. 1. GC–FID chromatograms of the weathering series (Mass, CTC, Juniper, and Elmer's Island mat), highlighting the decrease of overall signal, as well as the disappearance of low
molecular weight compounds and the formation of the UCM.
602 A.K. Huba, P.R. Gardinali / Science of the Total Environment 563–564 (2016) 600–610
4. port remained closed. The heated vaporizer region was held at 350 °C,
while the capillary temperature was set to 300 °C, for both positive
and negative mode. For the ESI analysis a heated electrospray (HESI)
source (Thermo Scientific, NJ, USA) was used, and typical conditions
for positive mode were a spray voltage of 5.20 V, a heated vaporizer re-
gion at 300 °C, capillary temperature of 300 °C, and sheath and auxiliary
gas at 40 and 5 psi, respectively. For negative mode, the typical condi-
tions were a spray voltage of 4.50 V, a heated vaporizer region at
300 °C, capillary temperature of 200 °C, and sheath and auxiliary gas
at 35 and 30 psi, respectively.
2.4.1. Data analysis
Mass spectra were obtained by averaging a selected range of consec-
utively acquired infusion spectra. A background spectrum acquired in
the same infusion run as the sample was subtracted to account for ex-
ternal contamination. Data processing was performed by using the
Composer 1.0.6 software (Sierra Analytics, CA, USA), which relies on
petroleum specific composition assignment algorithms. Criteria used
for peak detection and molecular formula assignments included: a
m/z range of 80–1000 Da, a match tolerance of 5 ppm for formula
assignments, a DBE range from −0.5 to 65, and element ranges of
C ≤ 200, H ≤ 1000, O ≤ 5, N ≤ 4, S ≤ 2. The setting for the minimum relative
peak abundance accepted was sample specific in order to adjust for the
variable nature of the samples.
3. Results and discussion
3.1. GC-FID and GC–MS analysis, and weathering studies
Initially, the characterization of the weathering series was per-
formed by visual inspection of the chromatograms obtained by GC-FID
analysis. The characteristic trend in depletion of volatile compounds
(predominantly alkanes, and to a lesser amount aromatics) for the
weathered oils was observed and is shown in Fig. 1. A clear loss of all
the front-end compounds (which represent the low molecular weight
and thus volatile hydrocarbons and aromatics), and an appearance
and increase of the characteristic oil UCM (which is due to hydrocarbon
species that coelute in chromatographic analysis) is clearly noticeable
when going from Massachusetts to the weathered oils (CTC, Juniper,
and Elmer’s Island mat). The specific order of the oils in the weathering
series is shown by the disappearance of more and more alkanes, and an
overall decrease in signal. Massachusetts is shown to be a relatively
fresh oil, while out of the two surface slick oils Juniper appears to be
more weathered than CTC (which agrees with previous studies on
total PAH depletion(BP, 2014), and the Elmer's Island mat is shown to
be the most weathered. Further characterization studies of the same
oils (shown in Fig. 2) were conducted in order to perform a more in-
depth characterization of the weathering series based on processes
other than dissolution and evaporation. GC–FID and GC–MS analyses
and subsequent quantifications of specific alkanes and PAHs,
Fig. 2. Ratios of the concentrations of chrysene/benz(a)anthracene (top) and n-C18/phytane (bottom) for the weathering series, showing an increase in photodegradation and
biodegradation, respectively. The top ratio was obtained from GC–MS data, while the bottom ratio used GC–FID data.
603A.K. Huba, P.R. Gardinali / Science of the Total Environment 563–564 (2016) 600–610
5. respectively, showed results that reinforce the previously determined
weathering order, showing an increase in both biodegradation as well
as photodegradation going from Massachusetts, to CTC, to Juniper, to
the Elmer's Island mat. Fig. 2 illustrates these results, and shows plots
of two degradation ratios (chrysene/benz(a)anthracene (Plata et al.,
2008; Lemkau et al., 2010; Yim et al., 2011; Behymer and Hites, 1988)
and n-C18/phytane (Lemkau et al., 2010; Yim et al., 2011; Wang et al.,
1995a, 1998)) that have previously been used as good indicators of
crude oil photodegradation and biodegradation, respectively. The ratio
of chrysene/benz(a)anthracene increases for the weathering series,
Fig. 4. (−) APPI spectra of the oil weathering series, with the zoomed in spectra shown on the right emphasizing the shift towards higher molecular weight.
Fig. 3. (−) ESI spectra of the oil weathering series, highlighting the three distinct areas of major changes, and a relative increase of higher molecular weight compounds with weathering.
604 A.K. Huba, P.R. Gardinali / Science of the Total Environment 563–564 (2016) 600–610
6. indicating an increase in photodegradation of the oils. On the other
hand, the n-C18/phytane ratio decreases, which is an indication of
increased biodegradation. This strongly suggests that this is a true
weathering series (going from Massachusetts, to CTC, to Juniper, to
the Elmer's Island mat), and likely includes both photodegradation
and biodegradation, in addition to other weathering processes such as
dissolution and evaporation. An interesting fact that is noticeable is
that, based on the results here obtained, the degree of weathering
does not appear to be strictly time or location dependent, but mainly as-
sociated to the oil’s path and the environmental factors related with
it (such as temperature, nutrients, salinity, pH, sun incidence, and
currents). Having a series of weathered oils is, therefore, essential in
order to achieve a more comprehensive understanding of the dynamic
changes that affect crude oil in a marine environment. This understand-
ing is the fundamental basis to any oil toxicity estimations.
3.2. Ultrahigh-resolution mass spectrometric analysis
Since GC–FID and GC-MS analyses pose significant limitations in a
comprehensive oil characterization, in order to expand the analytical
window of compounds detected, ultrahigh-resolution mass spectro-
metric analysis of the four oils was performed by means of an Orbitrap
Q Exactive instrument. The four oils were analyzed in both (±) ESI as
well as (±) APPI, in order to target a broader range of compounds
(polar and nonpolar). The resulting mass spectra show significant
changes, which can be seen particularly well in the negative mode spec-
tra provided in Figs. 3 and 4. Overall, a common trend independent of
the ionization source or mode, is the relative increase in higher molecu-
lar weight compounds. The (−) ESI spectra shown in Fig. 3, for example,
clearly show this trend as the first section of the spectrum significantly
decreases, while the second section increases with weathering. More-
over, a completely new series of compounds appears in the third section
of the Elmer's Island mat spectrum, which illustrates the additional
compositional complexity of beached oils (that may have incorporated
exogenous materials). Compared to the ESI data shown in Fig. 3, the
(−) APPI data shown in Fig. 4 show less dramatic changes, but also ap-
pear to present a slight shift towards higher molecular weight com-
pounds, which is especially visible in the magnified spectra shown in
the inserts. Furthermore, it can be seen that the APPI spectra appear to
contain a much larger amount of individual masses. This evidences the
more selective nature of the ESI ionization source towards more polar
compounds, as it eliminates the background hydrocarbon interference
that dominates the APPI spectrum. This is a good illustration of how
these two ionization techniques are complementary and how a compre-
hensive crude oil characterization must use a combination of both.
In order to confirm these visually apparent changes, class distribu-
tion plots were created by categorizing all the assigned molecular for-
mulae (CvHwNxOySz) into specific heteroatom classes (O1, O2, NO, NO2,
Fig. 5. Class distributions for (+) APPI (top) and (+) ESI (bottom) for samples of the weathering series (Massachusetts, CTC, Juniper, Elmer's Island mat). Full arrows depict a consistent
trend over the whole weathering series, while dashed arrows depict trends in which the Elmer’s Island mat is an exception. Compounds showing as protonated ions are denoted by the
(H), others are radical ions.
605A.K. Huba, P.R. Gardinali / Science of the Total Environment 563–564 (2016) 600–610
7. etc.), and by plotting the relative abundance of each of these classes.
These graphs are shown in Figs. 5 and 6, and show the presence of
large compositional diversity among the four oils and the two ionization
methods. Fig. 5 depicts the differences between ESI and APPI in positive
ionization mode. The most dominant class detected in (+) APPI is the
hydrocarbon class (protonated molecules are denoted by the (H)).
(+) ESI, on the other hand, is dominated by nitrogen containing com-
pounds, while the hydrocarbon portion is much smaller. Another inter-
esting concept shown in these two plots is that while ESI ionization
requires protonation, APPI provides the possibility to ionize other
species by charge transfer owing to the presence of dopant molecules
(toluene). This creates radical compound classes for the hydrocarbon,
nitrogen, and oxygen classes that become fairly prominent. Fig. 5 also
shows a clear increase in oxygenated species (O1, O2, O3), with a con-
current reduction in hydrocarbons as the weathering degree of the
oils increases. Some of the classes of the Elmer's Island mat are an ex-
ception to this trend, which could be due to the differing nature of
beached oils. The increase in oxidation with weathering that is observed
corroborates data from other studies (Aeppli et al., 2012; Hall et al.,
2013; Ruddy et al., 2014). Negative mode data (shown in Fig. 6) extends
the compositional coverage to highly oxygenated species (O4 and O5).
However, unlike for positive mode where all the oxygenated classes in-
creased with weathering, in negative mode there seems to be a decrease
in lower oxygenated species (O1 for APPI, and O1 and O2 for ESI) with a
concurrent increase in higher oxygenated species (O2–O5 for APPI, and
O3–O5 for ESI).
In order to more clearly depict the changes in hydrocarbons and ox-
ygenated compounds, Kendrick mass defect plots were created
(Kendrick mass = IUPAC mass×(14.00000/14.01565)). Such graphs
plot the Kendrick Mass Defect vs. the Nominal Kendrick Mass (differ-
ence between the nominal and the exact Kendrick masses), and can
be used in order to simplify the visualization of data originating from
complex matrices, and to better visualize compositional changes. An
example of such plots is given in Fig. 7 for (−) APPI data, and shows a
significant increase in oxygenated hydrocarbons (O1 to O5), with an
especially large increase in compounds in the mid-mass range (m/z
300–500) for weathered oils. This correlated to a reduction of the hy-
drocarbon component, which mainly lost its higher molecular weight
(m/z 350 and up) compounds.
The results so far have shown an overall increase in oxygenated hy-
drocarbons (mostly in the mid to high molecular weight range), but
have given little insight into the changes occurring within the specific
oxygen classes. Double bond equivalent (DBE) plots were created by
plotting the DBEs (number of rings and double bonds) versus the
carbon number, in order to visualize changes happening in individual
classes and get a better understanding on the saturation level of the
compounds involved. The (+) APPI plots are shown in Fig. 8 as an ex-
ample of the results that were obtained. The appearance of oxygenated
Fig. 6. Heteroatom class distributions for (−) APPI (top) and (−) ESI (bottom) of the weathering series (Massachusetts, CTC, Juniper, Elmer's Island mat). Full arrows depict a consistent
trend over the whole weathering series, while dashed arrows depict trends in which the Elmer's Island mat is an exception. Compounds showing as protonated ions are denoted by the
(H), others are radical ions.
606 A.K. Huba, P.R. Gardinali / Science of the Total Environment 563–564 (2016) 600–610
8. species that was previously observed with weathering is mostly con-
firmed by these plots; moreover, it becomes evident that for (+) APPI
mode the newly formed or enriched oxygenated compounds are mostly
unsaturated or aromatic compounds (DBE 5-15) with 15–40 carbons.
ESI and negative ionization mode results (not shown) have shown sim-
ilar ranges, and since PAHs are compounds that fall in that range, these
results may suggest that PAHs and their derivatives could be a signifi-
cant portion of the compounds that undergo oxidation during the
weathering process.
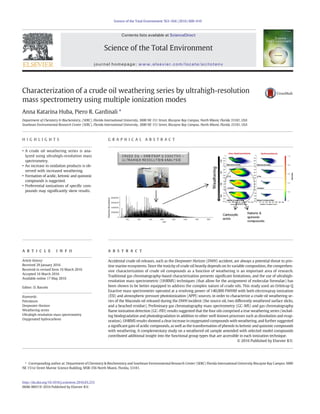
This possibility is confirmed by the results of Fig. 9, which shows a
Van Krevelen diagram (that plots H/C versus O/C and indicates
unsaturation and oxidation, respectively) for the unweathered
Fig. 8. DBE vs. carbon number for the O1–O3 containing hydrocarbons detected in the weathering series in (+) APPI mode.
Fig. 7. Kendrick Mass Defect (KMD) vs. Nominal Kendrick Mass contour plots for oxygen containing hydrocarbons (left) and hydrocarbons (right) obtained using (−) APPI conditions.
607A.K. Huba, P.R. Gardinali / Science of the Total Environment 563–564 (2016) 600–610
9. Massachusetts oil (top) and the weathered Juniper oil (bottom) in
(+) APPI mode. This plot depicts all the peaks that were assigned
a molecular formula containing at least one oxygen, and evidences
a drastic increase in the number and in the relative intensity of oxygenat-
ed compounds present in the weathered oil. The areas of major changes
(shown by the red rectangles) contain compounds with a H/C in the
range of 0.5–1.5. Completely saturated hydrocarbons would have a H/C
ratio of 2, while completely aromatic species would have a H/C of b1
(with benzene starting at 1, and the H/C decreasing with increasing num-
ber of rings, so that chrysene would have a H/C of about 0.67). The nature
of the compounds whose detected ions are enhanced is therefore either
completely aromatic in nature (when H/C b1), or contain some kind of
unsaturation and aromaticity if they fall in the H/C between 1 and 2.
All these different types of plots are essential in visualizing gen-
eral trends in data sets containing thousands of assigned compounds.
However, they do not provide unequivocal information on the functional
group types of the molecules. Some information regarding what specific
types of molecules are present can be inferred from ionization studies elu-
cidating selective ionization mechanisms or preferential ionization of in-
dividual heteroatoms. Figs. 5 and 6, show how the relative abundances
of the different oxygen classes vary based on the ionization source and
mode, and suggest that different functional group types may be involved.
For example, in negative ionization mode (Fig. 6) for weathered oils there
is a substantial prevalence of O2 species with respect to O1 species. This
agrees with previous reports (Mapolelo et al., 2009, 2011; Ruddy et al.,
2014), and has been attributed to a preferential ionization of carboxylic
acid species that can be easily deprotonated. For the unweathered oil
this is not always true as in (−) APPI the O1 species represent a larger rel-
ative fraction compared to the O2 species. This could either mean that the
O1 fraction (such as alcohols, phenols, ketones) is large enough to domi-
nate a preferential ionization of acidic O2 species, or that there are singly
oxygenated compounds mostly present in the unweathered oil that are
similarly well ionized as the carboxylic acids. In positive ionization
mode, on the other hand, there is a prevalence of O1 over O2 compounds
Fig. 10. (−) APPI spectrum of the Elmer's Island mat fortified with several individual model compounds used to test ionization efficiency, and Kendrick mass defect plot of the O1 and O2
classes of the same sample showing the corresponding detection and correct assignment of the model compounds.
Fig. 9. Van Krevelen plots of source (Massachusetts) and weathered (Juniper) oils obtained in (+) APPI mode, showing the relative increase of aromatic and unsaturated oxidation
products.
608 A.K. Huba, P.R. Gardinali / Science of the Total Environment 563–564 (2016) 600–610
10. (shown in Fig. 5), which is most likely due to the preferential ionization of
some O1 species (such as alcohols, phenols, or ketones) with respect to O2
compounds.
In order to gain a better understanding of the nature of specific oxy-
genated classes and the significance of these results, a systematic ioniza-
tion study was conducted by spiking several compounds into an Elmer's
Island mat sample. These model compounds spanned a wide range of
functional group types, including: hydrocarbons, phenols, alcohols, ke-
tones, and acids. The sample infused in APPI positive ionization mode fa-
vored the formation of the ketone functional group (coprostan-3-one),
while phenols and hydrocarbons were only weakly ionized, and straight
chain alcohols and acids showed no ionization. Negative ionization
mode, on the other hand, preferentially ionized the acids and phenols,
while none of the other compounds were detected. The mass spectrum
and Kendrick Mass Defect plot of the (−) APPI data for the Elmer's Is-
land mat are presented in Fig. 10, and show the phenols (in blue) and
the acid (in pink) that were ionized and correctly assigned. ESI results
from the same spiked sample (results not shown) mostly corroborated
the same preferential ionizations (ketones and to a lesser extent phe-
nols in positive mode, and carboxylic acids and phenols in negative
mode). These results clearly show that both the APPI and ESI sources
ionize only certain functional group types (and out of those some
much better than others) depending on the ionization mode, and this
has to be accounted for when interpreting heteroatom class assign-
ments plots from high-resolution mass spectrometric analyses. The
preferential ionization of singly oxygenated ketones in positive ioniza-
tion mode with respect to doubly oxygenated carboxylic acids suggests
that ketones could be a significant portion of the O1 class that dominates
(+) ESI and (+) APPI generated spectra, and this seems to corroborate
previous reports that have suggested ketones as oxidation products in
crude oil weathering (Ruddy et al., 2014). Phenols have shown to be
somewhat ionized and could therefore also contribute to the O1 class,
while the lack of ionization of straight chain alcohols makes them an
unlikely contributor. The O2 class (and other higher oxygen classes)
may be combinations of functional group types, and most likely contain
well ionizable groups such as ketones. In negative mode, acids are being
preferentially ionized by deprotonation, and are thus the most likely
contributor to the large relative fraction of the O2 classes, and the
acidification of crude oil compounds with weathering and especially
biodegradation has been previously reported (Charrie-Duhaut et al.,
2000; Ruddy et al., 2014; Watson et al., 2002). Moreover, based on the
H/C and DBE values detected, it is clear that the possible acidic fraction
consist of both an unsaturated and aromatic hydrocarbon backbone.
The model compound study has also shown that phenols, in addition
to acids, are a class that is well ionized in negative ionization mode,
and the abundant O1 class in the source oil could be largely due to phe-
nolic compounds, which have been proposed as intermediates in
photodegradation of PAHs (McConkey et al., 2002; Wang et al., 1995b;
Chen et al., 2006; Kong and Ferry, 2003). These compounds have been
shown to undergo further photo-oxidation, being converted to ketonic
and quinonic compounds (McConkey et al., 2002; Wang et al., 1995b;
Chen et al., 2006; Kong and Ferry, 2003). This could explain why the
O1 class in negative ionization mode decreases (oppositely to all other
oxygenated classes), as singly oxygenated phenols are converted to
doubly oxygenated quinones (see Fig. 6). GC×GC-TOF data on the
same weathering series show the enrichment of straight chain ketones
and acids and the depletion of phenols, strengthening the conclusions
on possible functional group types that are being transformed during
the weathering process (Ding and Gardinali, 2015). The higher oxygen-
ated fractions (O2 and up) are likely combinations of functional group
types and contain the well ionized carboxylic acid and phenolic groups.
The ionization study has also illustrated that since straight chain alco-
hols were not (or very poorly) ionized in any of the ionization tech-
niques, they are not likely to give a significant contribution to any
observed O1 class. This part of the study, overall, emphasized the need
to gain more in-depth knowledge on the ionization of crude oil
compounds, and offered valuable insight into the possible functional
group types that are making up the O1, O2 and higher oxygenated hy-
drocarbon classes that exhibit significant changes with weathering.
4. Conclusion
This study presented the first ultrahigh-resolution mass spectromet-
ric characterization of an oil weathering series, including the fresh
Macondo oil, two differently weathered surface slick oils, and a beached
oil tar. Preliminary GC–MS and GC–FID studies have confirmed the four
oils to be a true weathering series, and ratios of nC18/phytane and
chrysene/benz(a)anthracene have further shown the oils to be likely
biodegradation and photodegradation series. Studying a complete
weathering sequence provides the opportunity to achieve a better un-
derstanding of the type of weathering processes that were most signif-
icant in the DWH oil release, and consequently how these mechanisms
affected the composition of the oil. Ultrahigh-resolution results from
this study have shown an increase in oxygenated compounds as the
Macondo oil weathered, additionally suggesting a gain of ketones,
quinones, and acidic compounds, with a concurrent decrease in pheno-
lic compounds. The separate ionization study that was conducted by
spiking model compounds into an oil sample also helped put the results
into a new perspective and further point out serious defects in current
interpretations, as results from this study clearly showed how out of
the nine spiked compounds some were not ionized while others were
fully ionized. This proves that compound class assignment plots might
have relative intensities largely skewed by preferential ionization,
while some compounds could be abundant but poorly ionized and
thus be underestimated. Future work will include a more extensive
study of ionization mechanisms of several crude oil model compounds,
spanning a wide size range, and including more functional groups,
as well as heteroatom containing compounds. Results of such a study
will be necessary in order to make more conclusive compound assign-
ments. This will ultimately help to expand the understanding of the
type of weathering processes that have played a significant role in the
Deepwater Horizon accident, which will be fundamental in evaluating
the long-term fate and toxicity of the oil that was released.
Acknowledgments
This work was supported by BP Exploration & Production Inc. and
the BP Gulf Coast Restoration Organization through FIU project
800001596. This is contribution number 999 from the Southeast Envi-
ronmental Research Center (SERC) at Florida International University.
References
Aeppli, C., Carmichael, C.A., Nelson, R.K., Lemkau, K.L., Graham, W.M., Redmond, M.C.,
Valentine, D.L., Reddy, C.M., 2012. Oil weathering after the deepwater horizon
disaster led to the formation of oxygenated residues. Environ. Sci. Technol. 46 (16),
8799–8807. http://dx.doi.org/10.1021/es3015138.
Atlas, R.M., Hazen, T.C., 2011. Oil biodegradation and bioremediation: a tale of the two
worst spills in US history. Environ. Sci. Technol. 45 (16), 6709–6715. http://dx.doi.
org/10.1021/es2013227.
Behymer, T.D., Hites, R.A., 1988. Photolysis of polycyclic aromatic-hydrocarbons adsorbed
on fly-ash. Environ. Sci. Technol. 22 (11), 1311–1319. http://dx.doi.org/10.1021/
es00176a011.
BP, 2014. Gulf Science Data Reference Oil Characterization Data In Website: http://
gulfsciencedata.bp.com/, directory: Oil; subdirectory: Oil Characteristics – additional
reference oils; filename: OilChemistry_O-04v01-03.zip (Last modified January 22,
2014).
Burns, K.A., 1993. Evidence for the importance of including hydrocarbon oxidation-
products in environmental assessment studies. Mar. Pollut. Bull. 26 (2), 77–85.
http://dx.doi.org/10.1016/0025-326x(93)90095-2.
Camilli, R., Di Iorio, D., Bowen, A., Reddy, C.M., Techet, A.H., Yoerger, D.R., Whitcomb, L.L.,
Seewald, J.S., Sylva, S.P., Fenwick, J., 2012. Acoustic measurement of the Deepwater
Horizon Macondo well flow rate. Proc. Natl. Acad. Sci. U. S. A. 109 (50),
20235–20239. http://dx.doi.org/10.1073/pnas.1100385108.
Carmichael, C.A., Arey, J.S., Graham, W.M., Linn, L.J., Lemkau, K.L., Nelson, R.K., Reddy, C.M.,
2012. Floating oil-covered debris from Deepwater Horizon: identification and appli-
cation. Environ. Res. Lett. 7 (1). http://dx.doi.org/10.1088/1748-9326/7/1/015301.
609A.K. Huba, P.R. Gardinali / Science of the Total Environment 563–564 (2016) 600–610
11. Charrie-Duhaut, A., Lemoine, S., Adam, P., Connan, J., Albrecht, P., 2000. Abiotic oxidation
of petroleum bitumens under natural conditions. Org. Geochem. 31 (10), 977–1003.
http://dx.doi.org/10.1016/s0146-6380(00)00109-1.
Chen, J., Ehrenhauser, F.S., Valsaraj, K.T., Wornat, M.J., 2006. Uptake and UV-
photooxidation of gas-phase PAHs on the surface of atmospheric water films. 1.
Naphthalene. J. Phys. Chem. A 110 (29), 9161–9168. http://dx.doi.org/10.1021/
jp062860b.
Ding, Y., Gardinali, P.R., 2015. Application of silica gel chromatography coupled with
GCxGC-TOF in identification of oxygenated hydrocarbons in complex environmental
samples. 39th International Symposium on Capillary Chromatography & 12th GCxGC
Symposium, Fort Worth, TX, USA http://www.isccgcxgc2015.com/.
Garrett, R.M., Pickering, I.J., Haith, C.E., Prince, R.C., 1998. Photooxidation of crude oils. En-
viron. Sci. Technol. 32 (23), 3719–3723. http://dx.doi.org/10.1021/es980201r.
Gough, M.A., Rowland, S.J., 1990. Characterization of unresolved complex-mixtures of hy-
drocarbons in petroleum. Nature 344 (6267), 648–650. http://dx.doi.org/10.1038/
344648a0.
Hall, G.J., Frysinger, G.S., Aeppli, C., Carmichael, C.A., Gros, J., Lemkau, K.L., Nelson, R.K.,
Reddy, C.M., 2013. Oxygenated weathering products of Deepwater Horizon oil
come from surprising precursors. Mar. Pollut. Bull. 75 (1-2), 140–149. http://dx.doi.
org/10.1016/j.marpolbul.2013.07.048.
Hsu, C.S., Hendrickson, C.L., Rodgers, R.P., McKenna, A.M., Marshall, A.G., 2011.
Petroleomics: advanced molecular probe for petroleum heavy ends. J. Mass
Spectrom. 46 (4), 337–343. http://dx.doi.org/10.1002/jms.1893.
Jordan, R.E., Payne, J.R., 1980. Fate and Weathering of Petroleum Spills in the Marine En-
vironment: A Literature Review and Synopsis. Ann Arbor Science. Publ.
Kaiser, N.K., Savory, J.J., McKenna, A.M., Quinn, J.P., Hendrickson, C.L., Marshall, A.G., 2011.
Electrically compensated Fourier transform ion cyclotron resonance cell for complex
mixture mass analysis. Anal. Chem. 83 (17), 6907–6910. http://dx.doi.org/10.1021/
ac201546d.
Kong, L., Ferry, J.L., 2003. Effect of salinity on the photolysis of chrysene adsorbed to a
smectite clay. Environ. Sci. Technol. 37 (21), 4894–4900. http://dx.doi.org/10.1021/
es026124o.
Kostka, J.E., Prakash, O., Overholt, W.A., Green, S.J., Freyer, G., Canion, A., Delgardio, J.,
Norton, N., Hazen, T.C., Huettel, M., 2011. Hydrocarbon-degrading bacteria and the
bacterial community response in Gulf of Mexico beach sands impacted by the Deep-
water Horizon oil spill. Appl. Environ. Microbiol. 77 (22), 7962–7974. http://dx.doi.
org/10.1128/aem.05402-11.
Lemkau, K.L., Peacock, E.E., Nelson, R.K., Ventura, G.T., Kovecses, J.L., Reddy, C.M., 2010.
The M/V Cosco Busan spill: source identification and short-term fate. Mar. Pollut.
Bull. 60 (11), 2123–2129. http://dx.doi.org/10.1016/j.marpolbul.2010.09.001.
Lima, A.L.C., Farrington, J.W., Reddy, C.M., 2005. Combustion-derived polycyclic aromatic
hydrocarbons in the environment — a review. Environ. Forensic 6 (2), 109–131.
http://dx.doi.org/10.1080/15275920590952739.
Liu, Z.F., Liu, J.Q., Zhu, Q.Z., Wu, W., 2012. The weathering of oil after the Deepwater
Horizon oil spill: insights from the chemical composition of the oil from the sea sur-
face, salt marshes and sediments. Environ. Res. Lett. 7 (3). http://dx.doi.org/10.1088/
1748-9326/7/3/035302.
Maki, H., Sasaki, T., Harayama, S., 2001. Photo-oxidation of biodegraded crude oil and tox-
icity of the photo-oxidized products. Chemosphere 44 (5), 1145–1151. http://dx.doi.
org/10.1016/s0045-6535(00)00292-7.
Mansuy, L., Philp, R.P., Allen, J., 1997. Source identification of oil spills based on the isotopic
composition of individual components in weathered oil samples. Environ. Sci. Technol.
31 (12), 3417–3425. http://dx.doi.org/10.1021/es970068n.
Mapolelo, M.M., Stanford, L.A., Rodgers, R.P., Yen, A.T., Debord, J.D., Asomaning, S.,
Marshall, A.G., 2009. Chemical speciation of calcium and sodium naphthenate
deposits by electrospray ionization FT-ICR mass spectrometry. Energy Fuel 23 (1),
349–355. http://dx.doi.org/10.1021/ef800642b.
Mapolelo, M.M., Rodgers, R.P., Blakney, G.T., Yen, A.T., Asomaning, S., Marshall, A.G., 2011.
Characterization of naphthenic acids in crude oils and naphthenates by electraspray
ionization FT-ICR mass spectrometry. Int. J. Mass Spectrom. 300 (2-3), 149–157.
http://dx.doi.org/10.1016/j.ijms.2010.06.005.
McConkey, B.J., Hewitt, L.M., Dixon, D.G., Greenberg, B.M., 2002. Natural sunlight induced
photooxidation of naphthalene in aqueous solution. Water Air Soil Pollut. 136 (1-4),
347–359. http://dx.doi.org/10.1023/a:1015223806182.
McKenna, A.M., Nelson, R.K., Reddy, C.M., Savory, J.J., Kaiser, N.K., Fitzsimmons, J.E.,
Marshall, A.G., Rodgers, R.P., 2013. Expansion of the analytical window for oil spill
characterization by ultrahigh resolution mass spectrometry: beyond gas chromatog-
raphy. Environ. Sci. Technol. 47 (13), 7530–7539. http://dx.doi.org/10.1021/
es305284t.
McNutt, M.K., Camilli, R., Crone, T.J., Guthrie, G.D., Hsieh, P.A., Ryerson, T.B., Savas, O.,
Shaffer, F., 2012. Review of flow rate estimates of the Deepwater Horizon oil spill.
Proc. Natl. Acad. Sci. U. S. A. 109 (50), 20260–20267. http://dx.doi.org/10.1073/
pnas.1112139108.
Plata, D.L., Sharpless, C.M., Reddy, C.M., 2008. Photochemical degradation of polycyclic ar-
omatic hydrocarbons in oil films. Environ. Sci. Technol. 42 (7), 2432–2438. http://dx.
doi.org/10.1021/es702384f.
Podgorski, D.C., Corilo, Y.E., Nyadong, L., Lobodin, V.V., Bythell, B.J., Robbins, W.K.,
McKenna, A.M., Marshall, A.G., Rodgers, R.P., 2013. Heavy petroleum composition.
5. Compositional and structural continuum of petroleum revealed. Energy Fuel 27
(3), 1268–1276. http://dx.doi.org/10.1021/ef301737f.
Prince, R.C., Garrett, R.M., Bare, R.E., Grossman, M.J., Townsend, T., Suflita, J.M., Lee, K.,
Owens, E.H., Sergy, G.A., Braddock, J.F., Lindstrom, J.E., Lessard, R.R., 2003. The roles
of photooxidation and biodegradation in long-term weathering of crude and heavy
fuel oils. Spill Sci. Technol. Bull. 8 (2), 145–156. http://dx.doi.org/10.1016/s1353-
2561(03)00017-3.
Qian, K., Rodgers, R.P., Hendrickson, C.L., Emmett, M.R., Marshall, A.G., 2001a. Reading
chemical fine print: resolution and identification of 3000 nitrogen-containing
aromatic compounds from a single electrospray ionization Fourier transform ion cy-
clotron resonance mass spectrum of heavy petroleum crude oil. Energy Fuel 15 (2),
492–498. http://dx.doi.org/10.1021/ef000255y.
Qian, K.N., Robbins, W.K., Hughey, C.A., Cooper, H.J., Rodgers, R.P., Marshall, A.G., 2001b.
Resolution and identification of elemental compositions for more than 3000 crude
acids in heavy petroleum by negative-ion microelectrospray high-field Fourier trans-
form ion cyclotron resonance mass spectrometry. Energy Fuel 15 (6), 1505–1511.
http://dx.doi.org/10.1021/ef010111z.
Reddy, C.M., Arey, J.S., Seewald, J.S., Sylva, S.P., Lemkau, K.L., Nelson, R.K., Carmichael, C.A.,
McIntyre, C.P., Fenwick, J., Ventura, G.T., Van Mooy, B.A.S., Camilli, R., 2012. Composi-
tion and fate of gas and oil released to the water column during the Deepwater
Horizon oil spill. Proc. Natl. Acad. Sci. U. S. A. 109 (50), 20229–20234. http://dx.doi.org/
10.1073/pnas.1101242108.
Rodgers, R.P., Schaub, T.M., Marshall, A.G., 2005. Petroleomics: MS returns to its roots.
Anal. Chem. 77 (1), 20A–27A. http://dx.doi.org/10.1021/ac053302y.
Roussis, S.G., Fedora, J.W., 2002. Quantitative determination of polar and ionic compounds
in petroleum fractions by atmospheric pressure chemical ionization and electrospray
ionization mass spectrometry. Rapid Commun. Mass Spectrom. 16 (13), 1295–1303.
http://dx.doi.org/10.1002/rcm.714.
Ruddy, B.M., Huettel, M., Kostka, J.E., Lobodin, V.V., Bythell, B.J., McKenna, A.M., Aeppli, C.,
Reddy, C.M., Nelson, R.K., Marshall, A.G., Rodgers, R.P., 2014. Targeted petroleomics:
analytical investigation of Macondo well oil oxidation products from Pensacola
Beach. Energy Fuel 28 (6), 4043–4050. http://dx.doi.org/10.1021/ef500427n.
Savory, J.J., Kaiser, N.K., McKenna, A.M., Xian, F., Blakney, G.T., Rodgers, R.P., Hendrickson,
C.L., Marshall, A.G., 2011. Parts-per-billion Fourier transform ion cyclotron resonance
mass measurement accuracy with a “walking” calibration equation. Anal. Chem. 83
(5), 1732–1736. http://dx.doi.org/10.1021/ac102943z.
Schrader, W., Panda, S.K., Brockmann, K.J., Benter, T., 2008. Characterization of non-polar
aromatic hydrocarbons in crude oil using atmospheric pressure laser ionization and
Fourier transform ion cyclotron resonance mass spectrometry (APLI FT-ICR MS).
Analyst 133 (7), 867–869. http://dx.doi.org/10.1039/b801031e.
Speight, J.G., 2004. Petroleum asphaltenes - Part 1 — asphaltenes, resins and the structure
of petroleum. Oil Gas Sci. Technol. Rev. Ifp Energ. Nouvelles 59 (5), 467–477. http://
dx.doi.org/10.2516/ogst:2004032.
Wang, Z.D., Fingas, M., Sergy, G., 1995a. Chemical characterization of crude-oil residues
from an arctic beach by GC/MS and GC/FID. Environ. Sci. Technol. 29 (10),
2622–2631. http://dx.doi.org/10.1021/es00010a025.
Wang, C.X., Yediler, A., Peng, A., Kettrup, A., 1995b. Photodegradation of phenanthrene in
the presence of humic substances and hydrogen-peroxide. Chemosphere 30 (3),
501–510. http://dx.doi.org/10.1016/0045-6535(94)00413-o.
Wang, Z.D., Fingas, M., Blenkinsopp, S., Sergy, G., Landriault, M., Sigouin, L., Foght, J.,
Semple, K., Westlake, D.W.S., 1998. Comparison of oil composition changes due
to biodegradation and physical weathering in different oils. J. Chromatogr. A 809
(1-2), 89–107. http://dx.doi.org/10.1016/s0021-9673(98)00166-6.
Wang, C.Y., Chen, B., Zhang, B.Y., He, S.J., Zhao, M.M., 2013. Fingerprint and weathering
characteristics of crude oils after Dalian oil spill, China. Mar. Pollut. Bull. 71 (1-2),
64–68. http://dx.doi.org/10.1016/j.marpolbul.2013.03.034.
Watson, J.S., Jones, D.M., Swannell, R.P.J., van Duin, A.C.T., 2002. Formation of carboxylic
acids during aerobic biodegradation of crude oil and evidence of microbial oxidation
of hopanes. Org. Geochem. 33 (10), 1153–1169. http://dx.doi.org/10.1016/s0146-
6380(02)00086-4.
Yim, U.H., Ha, S.Y., An, J.G., Won, J.H., Han, G.M., Hong, S.H., Kim, M., Jung, J.H., Shim, W.J.,
2011. Fingerprint and weathering characteristics of stranded oils after the Hebei
Spirit oil spill. J. Hazard. Mater. 197, 60–69. http://dx.doi.org/10.1016/j.jhazmat.
2011.09.055.
610 A.K. Huba, P.R. Gardinali / Science of the Total Environment 563–564 (2016) 600–610