1. 4
Inputs for Health
Laveesh Bhandari and Ankur Gupta
the health sector, but also the related sectors that create an
overall environment for good health outcomes.
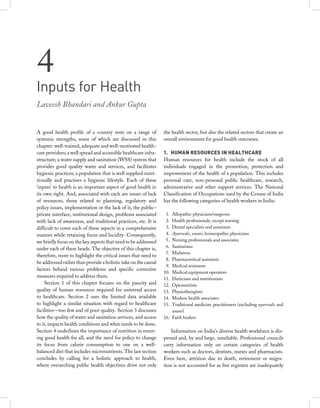
1. HUMAN RESOURCES IN HEALTHCARE
Human resources for health include the stock of all
individuals engaged in the promotion, protection and
improvement of the health of a population. This includes
personal care, non-personal public healthcare, research,
administrative and other support services. The National
Classification of Occupations used by the Census of India
has the following categories of health workers in India:
1. Allopathic physicians/surgeons
2. Health professionals, except nursing
3. Dental specialists and assistants
4. Ayurvedic, unani, homeopathic physicians
5. Nursing professionals and associates
6. Sanitarians
7. Midwives
8. Pharmaceutical assistants
9. Medical assistants
10. Medical equipment operators
11. Dieticians and nutritionists
12. Optometrists
13. Physiotherapists
14. Modern health associates
15. Traditional medicine practitioners (excluding ayurvedic and
unani)
16. Faith healers
Information on India’s diverse health workforce is dis-
persed and, by and large, unreliable. Professional councils
carry information only on certain categories of health
workers such as doctors, dentists, nurses and pharmacists.
Even here, attrition due to death, retirement or migra-
tion is not accounted for as live registers are inadequately
A good health profile of a country rests on a range of
systemic strengths, some of which are discussed in this
chapter: well-trained, adequate and well-motivated health-
care providers; a well spread and accessible healthcare infra-
structure; a water supply and sanitation (WSS) system that
provides good quality water and services, and facilitates
hygienic practices; a population that is well supplied nutri-
tionally and practises a hygienic lifestyle. Each of these
‘inputs’ to health is an important aspect of good health in
its own right. And, associated with each are issues of lack
of resources, those related to planning, regulatory and
policy issues, implementation or the lack of it, the public–
private interface, institutional design, problems associated
with lack of awareness, and traditional practices, etc. It is
difficult to cover each of these aspects in a comprehensive
manner while retaining focus and lucidity. Consequently,
we briefly focus on the key aspects that need to be addressed
under each of these heads. The objective of this chapter is,
therefore, more to highlight the critical issues that need to
be addressed rather than provide a holistic take on the causal
factors behind various problems and specific corrective
measures required to address them.
Section 1 of this chapter focuses on the paucity and
quality of human resources required for universal access
to healthcare. Section 2 uses the limited data available
to highlight a similar situation with regard to healthcare
facilities—too few and of poor quality. Section 3 discusses
how the quality of water and sanitation services, and access
to it, impacts health conditions and what needs to be done.
Section 4 underlines the importance of nutrition in ensur-
ing good health for all, and the need for policy to change
its focus from calorie consumption to one on a well-
balanced diet that includes micronutrients. The last section
concludes by calling for a holistic approach to health,
where overarching public health objectives drive not only
2. 52 Laveesh Bhandari and Ankur Gupta
maintained. Survey-based estimates, such as those of the
National Sample Survey Organisation (NSSO), are based
on self-reporting which brings in an element of incon-
sistency and inaccuracy as unqualified providers may be
counted as qualified healthcare providers.
Our findings indicate that there is a shortage of health-
care providers across almost all categories. And those
that do exist do not perform optimally due to a variety of
reasons: (a) they tend to be concentrated in particular areas;
(b) lack of motivation and incentives in public healthcare
results in problems such as absenteeism; (c) lack of mid-
career training, essential in an era of technological growth,
further reduces the output. Not surprisingly, then, there
are problems of out-migration of qualified healthcare
providers.
1.1 Inadequacy
Estimating the optimal number of healthcare providers
required for a population depends on a range of factors such
astheage,demographicanddiseaseprofileofthepopulation
as also its geographic spread and ability to access services.
The benchmark set by the World Health Organization
(WHO) is one physician per 1,000 persons, while the world
average has been estimated as 1.5 (World Bank 2009).
India stands at about 0.6 per 1,000 persons. Compare this
with other countries: Cuba has a doctor-to-population
ratio of 1:165, South Korea 1:337, United Kingdom
1:610, United States 1:358 and Italy 1:165 (UNDP 2004).
Further, consider the nurse-to-physician ratio of about 4:1,
which in India is about 2:1. Only about 40 per cent of the
nearly 1.5 million registered nurses were said to be active
because of low recruitment, migration, attrition and drop-
outs due to poor working conditions (NCMH 2005). So,
in other words, India has about half the nurses per doctor
than is required, with the number of doctors falling 40 per
cent below the minimum requirement. We posit a similar
problem in the case of paramedics, technicians, specialists,
etc., but are unable to present hard evidence due to the lack
of adequate data.
What India does have is a large network of those trained
in Indian systems of medicine and AYUSH (ayurvedic,
yoga, unani, siddha and homeopathy)—their numbers
together equalling that of trained allopathic practitioners.
Urban slums and rural areas also have concentrations of
unqualified practitioners such as folk and magico-religious
healers and traditional birth attendants (dais). However,
little or no reliable data is available on these health (or
pseudo-health) workers.
One main reason for the lack of adequate medical
manpower is the low number of medical graduates (out-
migration is another and is discussed later). While in
2001, less than 20,000 students were being admitted to
medical colleges annually in the country, in 2009 the figure
increased to about 32,000, on the back of some reforms.
However, even this increase is inadequate, and it is unlikely
that the demand–supply gap will ever be met even at this
increased level of intake. Such human resource constraints
not only impact overall public health, but will specifically
impact the successful conduct of programmes such as the
National Rural Health Mission (NRHM) and National
Urban Health Mission (NUHM).
1.2 Poorly Distributed
The problem of inadequacy is compounded by the uneven
geographical distribution of healthcare providers. For
example, Goa and Punjab have allopathic doctor densities
up to three to four times as high as states like Madhya
Pradesh and Orissa. Also, states with higher incomes,
such as Punjab, Kerala and Tamil Nadu, tend to have
more healthcare professionals (Table 4.1). In a few states
like Uttar Pradesh, Bihar and Maharashtra, the density of
AYUSH doctors is much higher than that of allopathic
doctors—but as healthcare providers trained in allopathy
form the basis of any modern public health system, we
cannot consider them as filling the breach in these states.
Allopathic medicine may well supplement other forms of
medicine but it cannot be supplanted by them.
Such disparity exists between rural and urban areas
as well. Almost all types of healthcare providers have
significantly greater densities in urban areas (Figure 4.1).
About 80 per cent of dentists and more than 60 per cent of
allopathic doctors are reportedly engaged in urban areas,
leaving the large rural hinterland unserved or underserved.
The public healthcare system in the rural areas suffers
as a consequence of this rural–urban disparity, with many
positions remaining unoccupied. This can be evidenced
by the following statistics: as of March 2008, the overall
shortfall in female health workers/Auxiliary Nurse Midwife
(ANM) was 12.4 per cent of the total requirement; 56.8
per cent for male health workers; 29.1 per cent for female
health assistants; 39.1 per cent for male health assistants;
and, finally, 15.1 per cent for doctors at the primary health
centres (PHCs; Figure 4.2).
Similarly, there are significant shortfalls in sanctioned
posts at community health centres (CHCs), with vacancy
levels as high as 55.3 per cent for surgeons, 48.2 per cent
3. Inputs for Health 53
TABLE 4.1: Total Registered Allopathic Doctors, Dental Surgeons and AYUSH Practitioners, by State/Union Territory
State/union territory
Allopathic
doctors
(2008)
Dental
surgeons
(as on 31
December
2007)
AYUSH doctors
(as on 1 January
2008)
Allopathic
doctors
per 10,000
population
(2008)
Dental surgeons
per 10,000
population (as on
31 December
2007)
AYUSH
practitioners per
10,000 population
(as on 1 January
2008)
Delhi 37,696 4,909 8,001 22.2 2.9 4.7
Goa 2,773 602 564 17.4 3.8 3.5
Punjab 37,925 4,098 26,654 14.2 1.5 10
Karnataka 78,531 21,713 28,805 13.6 3.8 5
Tamil Nadu 80,223 9,482 27,692 12.1 1.4 4.2
Kerala 37,440* 5,968 26,373 11.1 1.8 7.8
Jammu & Kashmir 10,096 1,090 4,205 9.0 1 3.7
Maharashtra 96,560** 6,857 122,451 8.9 0.6 11.3
Gujarat 42,985 2,558 31,343 7.6 0.5 5.5
Sikkim 442 n.a. n.a. 7.5 n.a. n.a.
Andhra Pradesh 54,382 1,793 30,049 6.6 0.2 3.6
West Bengal 56,488 1,733 48,175 6.5 0.2 5.5
Assam 17,587 766 1,111 6.0 0.3 0.4
Madhya Pradesh 32,154* 1,361 57,593 4.7 0.2 8.4
Rajasthan 26,592 364 30,450 4.1 0.1 4.7
Orissa 16,068* 490 7,571 4.0 0.1 1.9
Bihar 37,753 1,436 166,152 4.0 0.2 17.7
Uttar Pradesh 52,181 4,533 93,794 2.7 0.2 4.9
Andaman & Nicobar Islands 116 n.a. n.a. 2.6 n.a. n.a.
Arunachal Pradesh 181 n.a. 101 1.5 n.a. 0.8
Haryana 3,347 2,243 26,724 1.4 0.9 11.1
Uttarakhand 1,142 n.a. 1,106 1.2 n.a. 1.2
Chhattisgarh 1,924 85 1,465 0.8 0 0.6
Himachal Pradesh 442* 406 8,826 0.7 0.6 13.4
Jharkhand 1,420 40 n.a. 0.5 0 n.a.
Manipur n.a. n.a. n.a. n.a. n.a. n.a.
Meghalaya n.a. n.a. 255 n.a. n.a. 1
Mizoram n.a. n.a. n.a. n.a. n.a. n.a.
Nagaland n.a. n.a. 1,997 n.a. n.a. 9.2
Tripura n.a. 48 145 n.a. 0.1 0.4
Chandigarh n.a. 570 324 n.a. 4.6 2.6
Dadra & Nagar Haveli n.a. n.a. n.a. n.a. n.a. n.a.
Daman & Diu n.a. n.a. n.a. n.a. n.a. n.a.
Lakshadweep n.a. n.a. n.a. n.a. n.a. n.a.
Puducherry n.a. n.a. n.a. n.a. n.a. n.a.
India 725,190 73,057 751,926 6.3 0.6 6.6
Source: CBHI (2008); Indicus estimates.
Note: * Incomplete information received; ** 2005 figure.
for obstetricians and gynaecologists, 54.5 per cent for
physicians and about 47.2 per cent for paediatricians.
Overall, about 51.6 per cent of the sanctioned posts of
specialists at CHCs remained unoccupied (Figure 4.3).
Many factors, such as working environment, lack of
incentives and modern facilities for living in rural areas,
rural-to-urban migration, and inadequate medical edu-
cation are responsible for this situation. We now discuss
the major challenges posed by these factors.
1.3 Working Conditions at Public Health Facilities
By and large, working conditions at public health facilities
are very poor. Most such facilities lack basic infrastructure
(such as refrigerators) and supplies (such as sterilisation
equipment and needles). The shortage of drugs, medical
devices and other consumables further worsens the working
conditions of healthcare providers (WHO 2007).
Incentives are another issue. Promotions are an import-
ant motivating factor, as are rewards for good performance.
The promotion system within the government is based
more on the availability of vacancies than on improved
abilities and performance. Not only that, but there are
said to be significant irregularities in this process, as some
government documents also point to: irregularities in the
constitution of departmental promotional committees and
the non-availability of annual confidential reports at the
time of promotion (CBHI–WHO 2007). There are no
clear policies determining transfers. And the icing on the
4. 54 Laveesh Bhandari and Ankur Gupta
FIGURE 4.1: Rural–Urban Distribution of Health Workers
0 20 40 60 80 100
Percentage
Rural Urban
Allopathic physician 3.28 13.34
Nurse and midwife 4.13 15.88
AYUSH 1.04 3.64
Dentist 0.06 0.59
Pharmacist 1.33 4.28
Others 0.66 3.37
Other traditional 0.28 0.92
All 10.78 42.03
Source: Census of India 2001, as cited in Rao, Bhatnagar and Berman (2008).
Note: Numbers within the bars indicate the density per 10,000 population.
FIGURE 4.2: Shortfall in Manpower (as on March 2008)
12.4
56.8
29.1
39.1
15.1
0
10
20
30
40
50
60
HW(F)/ANM HW(M) LHV/Health
assistants
(F)
Health
assistants
(M)
Doctors at
PHC
Percentage
Source: MoHFW (2009).
FIGURE 4.3: Vacancies in Sanctioned Posts for Specialist (as on
March 2008)
55.3
48.2
54.5
47.2
51.6
42
44
46
48
50
52
54
56
Surgeons O&G Physicians Paedi-
atricians
Total
Percentage
Source: MoHFW (2009).
cake is the lack of quality housing and poor living conditions
which are further exacerbated by the absence of transport
facilities. Together, these lead to a lack of accountability
and motivation among the healthcare providers.
One obvious outcome of the problems just stated is
‘absenteeism’, which has the effect of crippling the func-
tioning of the entire public health system (Table 4.2). Some
health workers just do not turn up for work while others are
simply not available when needed. All this is a clear sign of
corruption and leads to wastage of public money. Figure 4.4
shows that even the ‘better governed’ states such as Tamil
Nadu, Andhra Pradesh and Karnataka are not immune to
the problem.
TABLE 4.2: Absenteeism, by Country and Sector
Country Absence rates (%) in
Primary schools Primary health centre
India 25 40
Bangladesh 16 35
Ecuador 14 –
Peru 11 25
Uganda 27 37
Unweighted average 19 35
Source: Chaudhury et al. (2006).
5. Inputs for Health 55
Chaudhary et al. (2006) measured absenteeism among
teachers and health workers in nearly nationally repre-
sentative samples in several countries using a common
methodology. The survey data reveals that absenteeism
among primary healthcare providers is highest in India
(40 per cent) among the surveyed countries (Table 4.2).
Their survey findings reveal that absenteeism is fairly
widespread and across levels of seniority. High ranked
and more powerful providers, such as doctors, are absent
more than lower-ranking ones. Men are absent more
often than women. The findings were consistent with the
idea that government service providers are unlikely to be
fired for absence, but their reasons for such absence were
a function of their working conditions. The study also
revealed that the health workers (mostly doctors) found to
be absent from public clinics during the survey were mostly
engaged in private medical practice.
The World Bank Development Policy Review (2006a)
also reveals the same scenario. Yet another study (Banerjee,
Deaton and Duflo 2004) replicated almost the same figure
regarding absenteeism of health workers from the surveyed
facilities. Around 45 per cent of doctors were found absent
from PHCs. It was also found that at sub-centres and aid
posts, doors were closed 56 per cent of the time these were
visited. Moreover, the patterns of absences from duty as
well as closure of facility were found to be unpredictable,
so people could not even count on facilities being open on
certain days or at certain times.
Though a serious problem, absenteeism is relatively
easy to address: community monitoring, backed by an
incentive system, can address the issue. The larger issue
of motivation and incentives, however, requires a systemic
change in the way the public healthcare system is run.
1.4 Migration
In recent years, international recruitment has generated a
high level of cross-border mobility among healthcare pro-
fessionals. India is the largest supplier of foreign medical
graduatestotheUSandUK.AccordingtoaWHOestimate
(2007), India was the most important source of registered
nurses under the H1A category to the US—around 81,091
compared to merely 15,838 from China. Figure 4.5 shows
a steep growth in the number of Indian doctors working
in Australia between 2000 and 2003. Similarly, the number
of Indian nurses registered in the UK increased by about
3.5 times during the period 2000–05 (Figure 4.6).
Unfulfilling working conditions, paltry salaries, and
poor career opportunities lead to the movement of health
workers from rural to urban areas, from public to private
institutions, from India to other countries. According to
an estimate (Kaushik et. al. 2008b), 50 per cent of students
from the All India Institute of Medical Sciences (AIIMS)
migrate overseas, or move to the private sector. Kaushik
et al. (2008a) found that graduates from institutions
providing better quality medical training had a greater
likelihood of emigrating.
FIGURE 4.4: Absenteeism amongst Doctors in PHCs, by State and Reason
0
10
20
30
40
50
60
70
80
Official Duty
Leave
No reason
Punjab
Haryana
Gujarat
Maharashtra
TamilNadu
Karnataka
AndhraPradesh
WestBengal
Chhatisgarh
MadhyaPradesh
Rajasthan
Assam
UttarPradesh
Uttarakhand
Orissa
Jharkhand
Bihar
Source: Cited in the presentation by Peter Berman, ‘Issues in Healthcare Financing and Provision in India’, The World Bank, New Delhi, 2006.
6. 56 Laveesh Bhandari and Ankur Gupta
Due to international demand, curbing out-migration
would be difficult even with a perfectly functioning
healthcare system. As such, an expansion of capacities to
train medical manpower becomes critical. Moreover, in
instances where the government finances or subsidises
medical training, traineeship in rural areas should be made
compulsory. Most crucial, however, is the alignment of
incentives and motivations with the career objectives of
healthcare providers.
1.5 Medical Education and Training
Between 1991 and 2008, the enrolment capacity at the
undergraduate level grew by nearly three times in medical
schools (Table 4.3). While this growth has enhanced the
access of the average Indian to doctors, there are a number
of concerns.
TABLE 4.3: Growth in the Number of Medical Colleges and
Students Admitted for the Undergraduate Medical
Degree, 1991–92 to 2008–09
Year No. of medical colleges Total admissions
1991–92 146 12,199
1992–93 146 11,241
1993–94 146 10,400
1994–95 152 12,249
1995–96 165 7,039
1996–97 165 3,568
1997–98* 165 3,949
1998–99* 147 11,733
1999–2000†
147 10,104
2000–01 189 18,168
2004–05 229 24,690
2005–06 242 26,449
2006–07 262 28,928
2007–08 266 30,290
2008–09 289 32,815
Source: Compiled from data from the Medical Council of India, various years.
Notes: The data for the years 2001–02, 2002–03 and 2003–04 were not
provided by the source agency. * data not received from 59 colleges
in 1997–98 and 1998–1999; †
data not received from 89 colleges in
1999–2000.
First, there has been rapid growth in the number
of medical colleges with limited regulation relating to
admissions, faculty strength and infrastructure. In addition,
privatisation is linked to an increased bias in the regional
location of practicing doctors. All this has a direct impact
on the availability of well-trained manpower. To make the
situation worse, a bulk of this growth has occurred in the
richer states, leading to increased regional inequity in access
to medical education and healthcare services (see Mahal
and Mohanan [2006] for a discussion on these issues).
Second, there are issues related to the curriculum. Basic
clinical skills, social and community healthcare, managerial
skills, and medical ethics have not received due attention
in the existing curriculum (Sood and Adkoli 2000). As a
result, even after five years of rigorous training, graduates
have little ‘hands-on’ experience which prepares them for
real life working conditions.
Third, there is an issue of the qualifications of those
practicing medicine. Rural areas are often served by tra-
ditional and unqualified health practitioners. According
to a case study in rural Udaipur, 41 per cent of those who
FIGURE 4.5: Indian Doctors Working in Australia
1997–98
1998–99
1999–2000
2000–01
2001–02
2002–03
250
200
150
100
50
0
Numberofdoctors
Source: Adapted from Birrell and Hawthorne (2004).
FIGURE 4.6: Indian Nurses Registered in the UK
1998–99
1999–2000
2000–01
2001–02
2002–03
4,000
3,500
3,000
2,500
2,000
0
1,500
1,000
500
2003–04
2004–05
Numberofnurses
Source: Adapted from Bach (2007).
7. Inputs for Health 57
called themselves ‘doctors’ did not have a medical degree,
18 per cent had no medical training whatsoever and 17 per
cent had not even graduated from high school (Banerjee,
Deaton and Duflo 2004).
Also, there are challenges related to the induction
training of the healthcare workforce. In the corporate
world, induction training is an important activity where
participants are oriented towards the organisational vision,
mission, goals and importance of working there. Examples
of such induction programmes in healthcare organisations
in India are rare (Box 4.1).
BOX 4.1: Recruitment of Healthcare Professionals at Aravind Eye
Hospital
Aravind’s paramedical staff are the key to the success of its business
model. They are recruited from villages and just need to have passed
the 10th standard. They are trained intensively for two years and then
placed as nurses. They multi-task from patient preparation to nursing
to patient counseling. The girls are also placed in Aurolabs and produce
IOL lenses, sutures, needles, medicines and dyes for surgery. Initially,
the salary is quite low at Rs 2000 per month but they get tremendous
satisfaction from helping people regain their sight and earn respect
and recognition in the community.
This is one of Aravind’s breakthrough innovations. It’s a win–win
arrangement—Aravind gets affordable, dedicated manpower, and the
nurses get a good job as well as tremendous respect in society. Aravind
has also challenged the establishment in doing this. All Indian nurses
have to be graduates and have to have passed a nursing examination.
Aravind decided to set up its own syllabus and training and to recruit
those who have passed the 10th standard.
The screening and selection of paramedical staff thus becomes very
important. And Drs. Natchiar and Usha spend a lot of time on this. They
meet the girls along with their parents to understand the family. They
talk about the organization as [an] extended family.
As Dr Natchiar says, ‘We don’t look for intelligence; we look for
common sense’; they don’t ask general knowledge questions like
‘Who’s the prime minister’, etc. Instead, if the girl is from a farming
family, they ask her questions like how much water an acre of the
crop they grow requires, or what the ploughing time for an acre is.
If she is able to answer these questions, it shows that she has been
interested in and engaged with the family business. And this is the kind
of engaged, involved person they want. After she is selected, she is put
through an orientation programme for a month. Everyone from doctors
to non-clinical workers go through this programme, which highlight[s]
the heritage, the value system and the culture of Aravind. During this
time, they are partnered with mentors—exceptional performers at a
similar job—who act as an inspiration and inculcate the Aravind way
of life into them.
Munshi (2009)
1.6 Concluding Note
Creation, training, allocation, motivation and monitoring
characterise the five key challenges faced by the country
in meeting its health goals. The inadequate supply of
healthcare manpower is a result of the inadequate creation
of capacity in our educational institutions. This inadequacy
is further impacted by the poor quality of training imparted
by many institutions, quality that regulations have been
unable to correct. Hence, there is need to improve the regu-
lation of these educational institutions while at the same
time ensuring that the regulations do not stifle the growth
in capacity. Few healthcare facilities or organisations,
whether in the public or private sector, attach importance
to training, be it during induction or mid-career. This is
a major hurdle as staff need to be adequately trained and
kept up-to-date with the latest developments.
Despite data limitations, it is quite obvious that health-
care professionals are inadequately spread across the
country, and seem to be concentrated in higher income
and urban areas. Public sector facilities are unable to
offer a good enough combination of incentives—working
conditions–lifestyles that are in sync with the aspirations of
such trained manpower. At the same time, incentives are
more favourable for urban rather than rural practice in the
private domain. This situation thus calls for compulsory
internship in rural or low income areas and/or well targeted
tax incentives or subsidies for working in such locations.
Moreover, improvements in working conditions in public
sector facilities would be critical, not only from an efficiency
perspective but also from a motivational perspective.
Motivation is by far the key element in ensuring the
supply of healthcare providers, and here the issues are
primarily in the public healthcare domain. A system of
rewards and punishments that is fair and transparent needs
to be put in place across the country. Facilities need to be
improved in rural areas so as to make it attractive for people
to consider working there. Hence, transport facilities and
other avenues to facilitate a comfortable lifestyle in rural
areas would need to be put in place if India wants good
quality healthcare manpower to be available to its rural
residents and urban poor.
2. HEALTH INFRASTRUCTURE
Health infrastructure constitutes educational (for example,
medical colleges) and service infrastructure (such as health
centres, hospitals, beds and equipment). The latter can be
studied under three broad heads—primary, secondary and
tertiary healthcare infrastructure. Rural–urban and public–
private classifications of healthcare infrastructure also offer
an understanding of the current status and opportunity gap
in the sector.
While detailed data for public health infrastructure
in rural areas is available from various government
8. 58 Laveesh Bhandari and Ankur Gupta
sources (though sometimes scattered and inconsistent),
information on urban public health infrastructure is not
easily available due to infrequent and incomplete com-
pilation of data by state and local authorities. Further,
little or no data is available on private health infrastructure,
neither urban nor rural. Despite these obvious limitations,
our findings reveal that, qualitatively and quantitatively,
the country’s public and private sectors are inadequate to
meet current and future needs. Consider Table 4.4 that
reflects the gross inadequacy in tertiary care. The present
hospital bed density in India (0.7) lags miserably behind
the current world average of 2.6, Brazil’s 2.4 and China’s
2.2, even as India’s disease burden is around 37 per cent
higher than that of Brazil and 86 per cent higher than that
of China (Das 2009). The situation in rural areas is even
more grim where the bed density ratio is an astonishingly
low 0.1 (compared to 1.8 in urban areas; Inhovi 2009).
TABLE 4.4: Hospital Beds per 1,000 population (2008)
Country Hospital beds (per 1,000 population)
India 0.7
Brazil 2.4
China 2.2
Mexico 1.6
South Africa 2.8
Source: World Health Organization (2009).
2.1 Government Healthcare Infrastructure in
Rural India
The Indian state has developed an extensive three-tiered
rural public health delivery system. The three tiers—the
sub-centre, PHC and CHC—are set up on the basis of
population norms (Table 4.5). We find the population
norms highly flawed as these are independent of the
specific requirements of different areas and do not take
into consideration greater or lesser need. Moreover, these
highly inflexible norms have stayed constant despite it
being well known that their use tends to underserve areas
that require public health facilities the most. Not only can
this approach be faulted for its inflexibility but also for its
inadequacy. Consider the following.
TABLE 4.5: Health Centre Norms
Primary health
infrastructure in rural India
Population Norms
Plains Hilly/tribal/difficult terrain
Sub-centre 5,000 3,000
Primary health centre 30,000 20,000
Community health centre 120,000 80,000
Source: MoHFW, Government of India.
The sub-centre is the first contact point between the
primary healthcare system and the community. They
are tasked with bringing about behavioural change and
providing services in relation to maternal and child health,
family welfare, nutrition, immunisation and control of
communicable diseases. They are provided with basic drugs
for minor ailments. According to figures provided by the
Ministry of Health and Family Welfare (MoHFW), there
were 146,036 sub-centres functioning in the country as on
March 2008—about 13 per cent lower than the set target
(Table 4.6 and Figure 4.7).
TABLE 4.6: Sub-centres, PHCs and CHCs, by State/Union Territory
(as on March 2008)
States/UTs Sub-centres PHCs CHCs
Andhra Pradesh 12,522 1,570 167
Arunachal Pradesh 592 116 44
Assam 4,592 844 103
Bihar 8,858 1,641 70
Chhattisgarh 4,741 721 136
Goa 172 19 5
Gujarat 7,274 1,073 273
Haryana 2,433 420 86
Himachal Pradesh 2,071 449 73
Jammu & Kashmir 1,907 375 85
Jharkhand 3,958 330 194
Karnataka 8,143 2,195 323
Kerala 5,094 909 107
Madhya Pradesh 8,834 1,149 270
Maharashtra 10,579 1,816 407
Manipur 420 72 16
Meghalaya 401 103 26
Mizoram 366 57 9
Nagaland 397 86 21
Orissa 6,688 1,279 231
Punjab 2,858 484 126
Rajasthan 10,742 1,503 349
Sikkim 147 24 4
Tamil Nadu 8,706 1,215 206
Tripura 579 76 11
Uttarakhand 1,765 239 55
Uttar Pradesh 20,521 3,690 515
West Bengal 10,356 924 349
Andaman & Nicobar Islands 114 19 4
Chandigarh 14 0 2
Dadra & Nagar Haveli 38 6 1
Daman & Diu 22 3 1
Delhi 41 8 0
Lakshadweep 14 4 3
Puducherry 77 39 4
All-India 146,036 23,458 4,276
Source: MoHFW (2009).
PHCs were envisaged to provide integrated curative
and preventive healthcare to the rural population. They are
maintained by the state governments under the Minimum
Needs Programme (MNP). A medical officer mans the
PHC and is supported by 14 paramedical and other staff.
9. Inputs for Health 59
It acts as a referral unit for six sub-centres, and has four
to six beds for patients. According to the MoHFW, there
were 23,458 PHCs as on March 2008, a shortfall of about
17 per cent.
The upper-most tier, the CHC, is also maintained by
the state government under the MNP. Here, four medical
specialists (surgeon, physician, gynaecologist and paedia-
trician) are supported by 21 paramedical and other staff.
A typical CHC should have 30 beds with one operation
theatre and labour room, and X-ray and laboratory faci-
lities. It serves as a referral centre for four PHCs. As on
March 2008, there were 4,276 CHCs, almost 36 per cent
lower than the target.
Rural health infrastructure is characterised not only
by inflexibility of the norms and inadequacy, but also by
poor operations. Issues such as poor stewardship, lack of
accountability, lack of medical equipment and essential
medicines, and lack of complementary facilities such as 24-
hour running water and electricity back-up are some other
problems that adversely impact their effectiveness (Nundy
2005). For instance, a survey conducted by Indicus in 2009
revealed that out of the 23 surveyed sub-centres in Madhya
Pradesh, about 40 per cent reported persistent water and
electricity problems, about 25 per cent lacked in-patient
beds and more than 40 per cent had poorly maintained build-
ings. A similar picture is true for most parts of the country.
The problems of administration, monitoring and
allocation that the NRHM (discussed in later chapters)
seeks to address are critical towards this end, but the
received evidence is mixed. It can be expected that these
systemic problems will not disappear in a limited time
period and, consequently, will require sustained effort
spread over a long time and across the country.
2.2 Government Healthcare Infrastructure in
Urban India
The National Health Policy, 2002 (NHP) highlighted
the inadequacy of public health services in urban areas.
Apart from the few basic healthcare facilities provided by
urban local bodies, the bulk of the scarce urban primary
healthcare infrastructure is an outcome of the scattered
schemes and programmes sponsored by the central and
state governments (see Table 4.7 for state-wise distribution
of government hospitals). The structure conceived under
NHP is a two-tiered one: the primary centre is seen as the
first tier, covering a population of 1 lakh, with a dispensary
providing out-patient facility and essential drugs; and
the second tier is at the level of the government general
hospital, where reference is made from the primary centre.
However, all of this is largely on paper and the current
hope lies in the implementation of the NUHM (discussed
in later chapters).
But the NUHM will need to be built on the back of
the existing system. Though municipal and district hos-
pitals exist in most cities, they are quite inadequate for
the rapidly-expanding urban population (Bhandari 2006).
These are supplemented by state government or urban local
body-run PHCs and dispensaries, industrial hospitals,
facilities set up as a part of the Employees State Insurance
Schemes (ESIS) and the Central Government Health
Scheme (CGHS), and the Urban Health and Family
Welfare Centres (UHFWC). Most supply some curative
services but are unable to cover slum populations (Sahni
and Kshirsagar 1993). Such facilities together service a very
small proportion of the population (and an insignificant
share of the underprivileged).
Despite some data in the aggregate that is made avail-
able by the MoHFW, there are significant flaws in the
data collection and dissemination mechanism that pre-
vents our ability to analyse or comment on the spread
of the urban health infrastructure. The MoHFW does
not collect data on health infrastructure directly but only
aggregates information provided by state governments,
which in turn depend upon their own departments as well
as urban local bodies for information. This system has
till date been unable to put together a comprehensive list
of primary and secondary facilities in the public sector.
There are large gaps, missing data, delayed publication
and many incomparabilities in the data. However, despite
these flaws there are some characteristics of urban public
sector healthcare that are well known. The most important
of these is that there is a very limited system of primary
FIGURE 4.7: Shortfall in Health Infrastructure (as on March 2008)
12.9
17.2
36
0
5
10
15
20
25
30
35
40
Sub-centres PHCs CHCs
Percentage
Source: MoHFW (2009).
10. 60 Laveesh Bhandari and Ankur Gupta
healthcare. The emphasis of most facilities is on curative
aspects. Dissemination of information, public health func-
tions, etc., are largely missing.
This is now recognised, and the proposed NUHM
seeks to improve upon the current conditions and put in
place a more comprehensive and inclusive mechanism of
provision of healthcare in urban areas.
2.3 Private Healthcare Infrastructure
What is true of public sector urban health facilities is even
more true of those in the private domain. However, even
the little information available from the Central Bureau
of Health Investigation (CBHI) has been said to be
incomplete and inconsistent and inadequate in capturing
private sector activities (CAG 2002).
If we consider the CBHI data (that grossly under-
estimates private sector facilities), states such as Andhra
Pradesh, Goa, Kerala and Maharashtra were mainly
served by private hospitals, with 50–70 per cent private
hospital beds in each of these states (Figure 4.8). It is
further observed that in less prosperous regions, such
as West Bengal and Orissa and in the north-eastern
states, the contribution of the private sector in health
infrastructure was significantly low in 2002. Moreover,
more than 60 per cent of the private hospitals in India
were concentrated in five states of Maharashtra, Gujarat,
Karnataka, Tamil Nadu and Kerala (all high income states)
in 2002 (Table 4.8). Though this points to the uneven
growth of the private sector, little insight is available about
the cause of such lopsided growth apart from the obvious
TABLE 4.7: Government Hospitals and Beds, by State and Rural/Urban Areas, 2007–08
State/UT/Division
Rural Urban Total Population
served per
govt hospital
Population
served per govt
hospital bedHospitals Beds Hospitals Beds Hospitals Beds
Assam 100 3,000 NR NR 100 3,000 278,780 9,293
Uttar Pradesh 397 11,910 528 20,550 925 32,460 198,143 5,646
Jharkhand NR NR NR NR 500 5,414 59,490 5,494
Bihar NR NR NR NR 1,717 22,494 54,533 4,163
Maharashtra 365 10,950 127 19,356 492 30,306 219,455 3,563
Madhya Pradesh 275 8,179 102 11,739 377 19,918 179,228 3,392
Haryana 57 1,204 92 6,515 149 7,719 162,221 3,131
Jammu & Kashmir 61 1,820 31 2,125 92 3,945 120,641 2,813
Orissa 1,623 5,882 84 8,669 1,707 14,551 23,231 2,725
Punjab 72 2,180 159 8,440 231 10,620 114,247 2,485
Chhattisgarh 119 3,270 99 6,158 218 9,428 105,202 2,433
Andhra Pradesh 167 6,220 192 28,113 359 34,333 224,825 2,351
Rajasthan 347 11,850 128 20,217 475 32,067 133,491 1,977
Gujarat 284 11,077 104 18,791 388 29,868 145,943 1,896
West Bengal 99 5,171 284 44,510 383 49,681 224,869 1,734
Tripura 16 500 15 1,762 31 2,262 111,258 1,525
Tamil Nadu 533 25,078 48 22,120 581 47,198 112,959 1,391
Kerala 173 12,450 77 15,945 250 28,395 134,140 1,217
Uttarakhand 666 3,746 29 4,219 695 7,965 13,685 1,194
Nagaland 23 705 15 1,145 38 1,850 57,132 1,174
Karnataka 466 8,010 426 41,482 892 49,492 64,518 1,163
Dadra & Nagar Haveli 1 30 1 231 2 261 149,500 1,146
Manipur 24 669 4 1,251 28 1,920 83,429 1,067
Daman & Diu 2 52 2 140 4 192 45,500 948
Meghalaya 26 780 8 1,839 34 2,619 72,647 943
Mizoram 10 320 10 904 20 1,224 47,900 783
Delhi 21 972 109 22,886 130 23,858 130,423 711
Sikkim 29 700 2 320 31 1,020 1,906 579
Goa 22 714 11 2,127 33 2,841 48,364 562
Arunachal Pradesh 185 1,356 15 862 200 2,218 5,920 533
Chandigarh 1 50 5 2,562 6 2,612 193,500 444
Andaman & Nicobar Islands 26 595 1 450 27 1,045 16,630 430
Lakshadweep 9 200 _ _ 9 200 8,111 365
Puducherry 4 110 12 3,315 16 3,425 75,250 352
India 6,298 142,396 2,774 324,206 11,289 494,510 101,403 2,315
Source: Directorate General of Health Services, various states and union territories.
Note: Rural and urban bifurcation is not available for Bihar and Jharkhand.
11. Inputs for Health 61
impact of higher incomes being more attractive for the
non-subsidised private sector service providers. But, as
mentioned earlier, these figures underestimate the extent of
private sector facilities; their share is likely to be far higher
than they indicate.1
The CAG estimated that in 2002 less
than a third of private sector nursing homes and hospitals
were subjected to assessment by the government (out of a
total of more than 21,000).
It is apparent that over time the role of the private
sector has been increasing. Of all the different types of
private healthcare facilities that span dispensaries, clinics,
nursing homes and hospitals, there is some data on hospital
beds that reflects this sustained growth. The government’s
figures indicate that the contribution of the private sector
in terms of the availability of hospital beds has gradually
increased from about 28 per cent in 1973 to about 61 per
cent in 1996. Indicus estimates this to have reached about
78 per cent in 2009 (Table 4.9). In addition, medical
tourism is growing, with India offering quality healthcare
facilities at relatively low costs in comparison to the western
world (see Box 4.2).
1
Greater insights can be ascertained from other studies.
Muraleedharan and Nandraj (2003), for instance, find that though
the distribution of private sector facilities is urban-centric, in absolute
numbers they are highly significant. In 2008, at least 70 per cent of
the 37,733 allopathic physicians in Tamil Nadu were reportedly in the
private sector.
FIGURE 4.8: State-wise Distribution of Private Hospitals and Beds (% to total; 2002)
10
0
20
30
40
50
60
70
80
90
100
%
Private hospitals as % of total Private hospital beds as % of total
Puducherry
Delhi
WestBengal
Tripura
Sikkim
Punjab
Orissa
Mizoram
Manipur
Maharashtra
Kerala
Karnataka
Jammu&Kashmir
HimachalPradesh
Haryana
Goa
ArunachalPradesh
AndhraPradesh
Source: Central Bureau of Health Intelligence, Directorate General of Health Services, MoHFW.
TABLE 4.8: Private Hospitals/Nursing Homes on the Records of IT
Department for Filing/ Non-Filing of Returns (2001)
States/union territories
Actual number of
private hospitals
and nursing homes,
as ascertained
from different
sources
Actual number
of private
hospitals and
nursing homes
subject to
assessment
Maharashtra 4,564 575
Gujarat 3,746 783
Karnataka and Goa 1,861 1,037
Kerala 1,537 492
Haryana 1,228 667
West Bengal 1,228 366
Uttar Pradesh and Uttarakhand 1,202 486
Tamil Nadu and Puducherry 1,168 966
Punjab 941 410
Madhya Pradesh 788 501
Delhi 536 93
Rajasthan 530 290
Bihar and Jharkhand 320 50
Orissa 299 84
Assam and North-Eastern States 132 36
Chandigarh 48 26
India 21,103 7,240
Source: CAG (2002).
The large expansion notwithstanding, they are not
being monitored adequately by either the urban local bodies
or state government health departments, both of which
lack the capacity to oversee such a large network of private
providers. Consequently, the quality of care, consumer
redressal mechanisms, facilities, etc., are not being overseen
12. 62 Laveesh Bhandari and Ankur Gupta
by any entity. These issues are further discussed in a later
chapter on the role of the government and regulations.
2.4 Concluding Note
Most of rural India is served by a three-tiered public
primary healthcare infrastructure which is well-networked
barring a few exceptions in remote and inaccessible areas.
However, poor maintenance of healthcare facilities, wide-
spread absenteeism and lack of integration among various
levels of health service providers are some of the most
common problems impacting the rural health ecosystem.
This, in turn, leads to limited utilisation of such healthcare
services.
The primary public healthcare infrastructure in urban
India is marked by its low spread, leaving slum dwellers
and the urban poor to their own fate. The NUHM would
be a positive step in the right direction though it has yet
to be implemented. Moreover, the existing secondary and
tertiary health infrastructure is not sufficient to meet the
ever-increasing disease burden in urban areas. In addition,
it tends to be concentrated in large urban and high income
areas.
When resources are limited, prioritisation and good
understanding of the requirements at a micro-level become
even more critical. Monitoring of existing facilities—
whether in the private or public sector—needs to become
a critical element of health sector reform. Only a good
monitoring system can appropriately identify specific gaps
that need to be filled either through public provision or
some mechanism of incentivising the private sector. More-
over, a good monitoring system is a necessary precondition
for a universally implemented regulatory mechanism.
3. WATER AND SANITATION
Safe drinking water is essential for good health, as is
improved ‘sanitation’.2
This has been recognised by the
‘Right to Water and Sanitation’3
which includes right
to sufficient, clean, accessible and affordable water and
sanitation for all. The lack of these two essential elements of
good health, along with poor hygiene, result in significantly
increased morbidity and mortality (Jalan and Ravallion
2001; Shreshtha 2006; and World Bank 2006a).
Water-related diseases can be broadly classified as
follows (Bradley 1977):
• Water-borne: caused by the consumption of contaminated
water (for example, diarrhoeal diseases, infectious hepatitis,
typhoid, guinea worm). These are highly prevalent in India.
• Water-washed: caused by inadequate volumes for personal
hygiene (for example, diarrhoeal disease, infectious hepatitis,
typhoid, trachoma, skin and eye infections). These are strongly
connected to levels of hygiene awareness and highly prevalent
in urban India.
• Water-based: where an intermediate aquatic host is required
(for example, guinea worm, schistosomiasis). The latter has
been widely reported from hand pump sites in rural and urban
India (Habibi, Burton and Chinniah 2002).
• Water-related vector: spread through insect vectors associated
with water (for example, malaria, dengue fever). These are
highly prevalent in both urban and rural India.
2
According to the WHO, ‘sanitation’ refers to the provision of
facilities and services for the safe disposal of human urine and faeces. It
also refers to the maintenance of hygienic conditions, through services
such as garbage collection and wastewater disposal.
3
Adopted by the Committee on Economic, Social and Cultural
Rights (CESCR) and the United Nations Sub-Commission on the
Promotion and Protection of Human Rights in 2002 as General
Comment No. 15: The Right to Water & Sanitation.
BOX 4.2: Medical Tourism in India
Medical tourism is one of the major external drivers of growth of the
Indian healthcare sector.
The emergence of India as a destination for medical tourism leverages
the country’s well educated, English-speaking medical staff, state-of-
the art private hospitals and diagnostic facilities, and relatively low cost
to address the spiralling healthcare costs of the western world. India’s
private hospitals excel in fields such as cardiology, joint replacement,
orthopaedic surgery, gastroenterology, ophthalmology, transplants
and urology.
To capitalise on medical tourism and build a sustained public–
private partnership in the hospital industry, the Indian government
is supporting an initiative by well known heart surgeon Dr Naresh
Trehan to build a ‘Medi City’ in Gurgaon, on the outskirts of Delhi.
The compound will include a 900-bed hospital that supports 17 super
specialties, a medical college and paramedical college. The project, on
43 acres of land, will cost an estimated $493 million. The Medi City will
integrate allopathic care with alternative treatments, including unani,
ayurvedic and homeopathic medicine, and it will provide telemedicine
services as well.
To encourage the growth of medical tourism, the government is also
providing a variety of incentives, including lower import duties and
higher depreciation rates on medical equipment, as well as expedited
visas for overseas patients seeking medical care in India.
Source: PricewaterhouseCoopers (2007).
TABLE 4.9: Share of Hospital Beds (%)
Year Private Public
1973 28.8 71.2
1983 40.7 59.3
1993 57.7 42.3
1996 61 39
2009* 78.3 21.7
Source: CBHI (respective years).
Note: * Indicus estimates.
13. Inputs for Health 63
The aim of a good WSS is, therefore, to ensure access
for all to adequate water of good quality and to ensure the
use of sanitation facilities where sewage is disposed of
appropriately such that it does not contaminate sources
of drinking water. Though the conditions in India have
improved significantly over the past few decades, they are
still not commensurate with the requirements. Health
outcomes therefore continue to be adversely affected, and
show up in India’s infant mortality rate, prevalence of com-
municable diseases and overall morbidity. This is not sur-
prising given that about 89 per cent of Indians use drinking
water that could be classified as ‘safe drinking water’ but
only about 28 per cent have access to improved sanitation
(WHO 2009). Consequently, India is far behind its peers
in meeting the water and sanitation needs of its population
(Table 4.10).
TABLE 4.10: Access to Safe Drinking Water and Improved
Sanitation in Emerging Economies (%)
Country Drinking water Sanitation
India 89 28
Brazil 91 77
China 88 65
Mexico 95 81
South Africa 93 59
Source: WHO (2009).
3.1 Water Supply: The Requirements
The human body requires a minimum intake of water to
sustain life before dehydration occurs. Functions of wash-
ing, cleaning and bathing require much larger amounts of
water, especially in countries such as India. In addition,
sewage disposal systems also require water; they can only
be put in place where there is running water. The minimal
drinking water requirement for tropical climates is approxi-
mately 3 litres per capita per day (lpcd; White, Bradley and
White 1972). Add hygiene (washing and cleaning) to this,
and it increases to 45–55 lpcd. Though estimates differ,
somewhere between 100–200 lpcd is considered to be the
normal requirement of a household.4
This minimum lpcd
criteria is not met in many cities (both large and small), and
more so in slum areas. In rural areas, the over-dependence
on hand pumps and the manual transport of water to the
place of residence place a natural limit on the water con-
sumed (though the need is also lower as the dependence
4
According to the Compendium of Environment Statistics, 2002,
India would annually need 56 billion cubic metres (BCM) of water
for domestic purposes in 2010. This figure, when converted to lpcd, is
approximately 130 lpcd.
on sewage systems is very low, if not non-existent).
Table 4.11 provides a summary of water requirement to
promote health.
TABLE 4.11: Summary of Requirement for Water Service to
Promote Health
Service level Access
measure
Needs met Level of
health
concern
No access
(quantity
collected often
below 5 l/c/d)
More than
1,000m or 30
minutes total
Consumption—cannot
be assured
Hygiene—not possible
(unless practised at
source)
Very high
Basic access
(average
quantity
unlikely to
exceed
20 l/c/d)
Between 100
and 1,000m or
5 to 30 minutes
total collection
time
Consumption—should
be assured
Hygiene—handwashing
and basic food hygiene
possible; laundry/bathing
difficult to assure unless
carried out at source
High
Intermediate
access (average
quantity about
50 l/c/d)
Water delivered
through one
tap on-plot (or
within 100m or
5 minutes total
collection time
Consumption—assured
Hygiene—all basic
personal and food
hygiene assured; laundry
and bathing should also
be assured
Low
Optimal access
(average
quantity 100
l/c/d and above)
Water supplied
through
multiple taps
continuously
Consumption—all needs
met
Hygiene—all needs
should be met
Very low
Sources: Howard and Bartram (2003).
Notes: l/c/d: litre per capita per day; m: metre
The quantity of water aside, quality too is critical. There
are three broad classes of characteristics that are considered
to gauge the quality of water: physical, biological and
chemical.
Physical quality parameters: These include turbidity,
odour, colour, taste, temperature, salinity and such other
factors. Typically, poor physical quality is highly correlated
with poor performance on the biological and chemical
fronts as well. Excess brackishness and salinity of water
affect taste, and have laxative effects. The Indian govern-
ment has set guidelines for the supply of safe drinking
water to rural habitations with a view to tackling problems
of flourosis, high arsenic content and excess iron.
Biological quality parameters: Water-borne diseases
are caused by viral or bacteriological contamination of
water. This is exemplified by the fact that a single gram
of faeces can contain 10 million viruses, 1 million bacteria,
1,000 parasite cysts and 100 eggs of worms (WSSCC
2002). Water-borne diseases are among the highest
causes of morbidity and child mortality in the country.
Also, treatment is becoming increasingly difficult due to
14. 64 Laveesh Bhandari and Ankur Gupta
an increase in anti-microbial drug resistance in diseases
such as typhoid fever and bacillary dysentery. India loses
about 1.5 million children under 5 years of age annually to
diarrhoea, and this might be an underestimate.5
Moreover,
morbidity and mortality due to water-borne diseases
have not declined commensurate with improvements in
coverage as has been shown by many studies (CPHEEO
2002; Howard and Bartram 2003).
Chemicals: Many serious diseases result from the con-
sumption of water containing toxic levels of chemicals.
Water quality degradation from agro-chemicals, industrial
and domestic pollution, groundwater depletion, siltation,
etc., have consequent health impacts. Over extraction of
groundwater, for instance, has given rise to compounded
arsenic and fluoride contamination (which result in signi-
ficant health burden) as well as saline ingress. Moreover,
nitrate levels have been found to be high in groundwater
in areas where intensive agriculture is practiced (CPCB
2003).
3.2 Water Supply and Sanitation: An Assessment
The need is for an adequate quantity of water in both rural
and urban areas that is devoid of various contaminants and
is accessible to all. In addition, access to sanitation facilities
and good sewage disposal systems not only enable hygienic
practices, but also limit the level of contamination of water
sources.
Urban India largely depends upon water supply
systems that either draw from proximate surface water
bodies or draw sub-surface water. Water treatment plants
with adequate capacity are either lacking in many areas
or are maintained inadequately. In cities where they are
adequate, a poor distribution system leads to leakages and
transmission losses which further compound the situation.
Non-existent water metering in many parts of the country
prevents a monitoring of requirements in different areas,
which in turn impacts the proper allocation of water. There
are very few areas with continuous water supply, with
many cities having infrequent and irregular water supply.
5
Current data grossly underestimates the true burden of water-
borne diseases. For example, reported data states that the incidence of
viral hepatitis is around 12 per 100,000. In contrast, studies reveal that
the incidence may be around 100 per 100,000. Similarly, other studies
indicate that every child below 5 years of age has two to three episodes of
diarrhoea every year. It means many hundred million cases of diarrhoea
occur every year, and only a small percentage of diarrhoeal diseases are
reported through routine surveillance systems (Planning Commission
2002). Thus, there is a critical need to address water quality monitoring
and sanitation as part of service provision.
This necessitates the storage of water which, in turn,
affects its quality. Poor and slum areas are characterised
by the sharing of points of water supply (such as public
taps and tube wells) which impacts accessibility to water
in terms of its timeliness and adequacy for the underserved
households. While there has been significant improvement
over the past (Figure 4.9), increasing urbanisation and low
resource allocation, among other factors, have adversely
impacted improvements in overall coverage of good quality
water supply.
FIGURE 4.9: Access to Water: Urban Households
20
12
63
16
16
65
8
21
69
1981 1991 2001
Tap Hand pump/tube well Well Others
Source: Census of India, 1991 and 2001.
Through the 1980s and 1990s rural India saw improve-
ments in access to water. However, drinking water supply
is largely through shared hand pumps and tube wells, and
tap water connections form a small part of the total mode
of access to water (Figure 4.10). Increasingly, rural water
supply has to grapple with the problem of ‘slippage’ (where
sources dry or the equipment stops functioning or water
quality parameters fall below acceptable benchmarks). This
requires good quality maintenance, all round monitoring
and rapid responses to changing circumstances, which
many state water supply departments are unable to manage
to the extent required.
Though inadequacy of resources is one factor in the
sub-optimal access to water, that is not the only reason.
Poor planning, focus on infrastructure creation rather than
water supply as a consumer service, and rapidly falling
groundwater levels have contributed to the problem.
Next consider sanitation. Urban India largely depends
on sanitation systems or septic tanks for disposal. However,
both are inaccessible to many (Figure 4.11), and open
defecation continues to be prevalent particularly in poor
and slum areas. Sewage systems are non-existent in many
15. Inputs for Health 65
cities and often sewage tends to be disposed of in proximate
rivers and water bodies. The net result: both surface and
sub-surface drinking water sources are contaminated—
and the lack of adequate drinking water treatment plants
further compounds this situation.
Rural India (Figure 4.12), on the other hand, continues
to depend primarily on open defecation. In fact, even
in 2008, only about 20 per cent of rural households had
access to improved sanitation (WHO–UNICEF 2010).
Moreover, even where toilet facilities are available,
habit, poor awareness and lack of running water together
contribute to low usage. For instance, it has been found
that toilets constructed under programmes such as the
Central Rural Sanitation Programme (CRSP) were not put
to use due to reasons ranging from lack of demand, lack of
hygiene awareness among the community, apprehensions
about a new practice, and increased water requirements
for flushing purposes. The net result: contamination of
drinking water supply and poor overall hygiene (see World
Bank [2006b] for a good discussion on these issues).
Through the Rajiv Gandhi National Drinking Water
Mission(RGNDWM),thegovernmenthasbeenallocating
increasing resources towards the WSS sector (Figure 4.13).
But the rural focus has impacted improvements in urban
areas, and this will clearly need to change. However, we
argue that the problem is not just allocative; rather, it is a
systemic problem and needs to be addressed as such. First,
water supply and sanitation is one of the most critical com-
ponents of public health and therefore needs to have a public
health entity driving it. Currently, it is within the ambit of
the central Ministry of Rural Development rather than the
FIGURE 4.10: Access to Water: Rural Households
0
20
40
60
80
100
120
10
21 24
16
35
49
62
38
22
12 6 5
Census 1981 Census 1991 Census 2001
Tap Hand pump and tube well Wells Others
Sources: Census of India (1981, 1991 and 2001).
FIGURE 4.11: Urban Households with No Access to Toilets
40
30
20
10
0
1988 1993 1998 2002
32 31
26
18
Households (%)
15
10
5
0
1993 1998 2002
12 12
10
Households (millions)
Sources: NSS 44th (1988), NSS 49th (1993), NSS 54th (1998) and NSS 58th
(2002),
FIGURE 4.12: Rural Households with No Access to Toilets
1988 1993 1998 2002
89.0 85.8
82.5
76.3
Households (%)
1993 2002
99
112
Households (millions)
Sources: NSS 44th (1988), NSS 49th (1993), NSS 54th (1998) and NSS 58th
(2002),
16. 66 Laveesh Bhandari and Ankur Gupta
MoHFW. Second, at the state level, water and sanitation
is typically overseen by departments of public health and
engineering whose focus has tended to be on infrastructure
creation (number of hand pumps and tube wells installed,
number of villages covered, number of toilets constructed,
etc.). However, infrastructure is only one component
of WSS; the other is ensuring that the infrastructure is
accessible and usable by all. In other words, there is a utility
and service component to WSS which is as important (if
not more) than mere creation of infrastructure.
3.3 Concluding Note: Concerns and Challenges
The coverage of the WSS system is low and systems gov-
erning their functioning leave much to be desired. The
focus on infrastructure creation by itself will not lead to
sustainable outcomes. Greater investments in ensuring
quality services, generating public awareness, and ensuring
efficient use of scarce resources are critical.
Though required, greater public investment in the
WSS sector will not solve the problem on its own. The key
issue is that of orientation: WSS is a public health service
and needs to be implemented as such. Consequently, the
separation of the WSS sector from the health departments
and ministries is a serious institutional flaw that needs
to be corrected. While the NHP recognises that water
supply, sanitation and health are interconnected and need
to be addressed holistically, there is still little institutional
interface between the departments.
Needless to say, there are a host of other issues (falling
groundwater levels, lack of use of appropriate low-cost
technologies, limited community participation, etc.). How-
ever, all of these require a completely different approach
than is currently the norm across India. This can only
change if the focus shifts towards facilitating desirable
health outcomes for all and not just on the creation of
infrastructure.
BOX 4.3: Drinking Water and Sanitation Ladders
Drinking Water Ladder
Unimproved drinking water sources: Unprotected dug well, unprotected
spring, cart with small tank/drum, surface water (river, dam, lake,
pond, stream, canal, irrigation channels), and bottled water.
Other improved drinking water sources: Public taps or standpipes, tube
wells or boreholes, protected dug wells, protected springs or rainwater
collection.
Piped water on premises: Piped household water connection located
inside the user’s dwelling, plot or yard.
Sanitation Ladder
Open defecation: When human faeces are disposed of in fields, forests,
bushes, open bodies of water, beaches or other open spaces or
disposed of with solid waste.
Unimproved sanitation facilities: Do not ensure hygienic separation of
human excreta from human contact. Unimproved facilities include
pit latrines without a slab or platform, hanging latrines and bucket
latrines.
Sharedsanitationfacilities: Sanitation facilities of an otherwise acceptable
type shared between two or more households. Only facilities that are
not shared or not public are considered improved.
Improved sanitation facilities: Ensure hygienic separation of human
excreta from human contact. They use the following facilities:
• Flush/pour flush to
- piped sewer system
- septic tank
- pit latrine
• Ventilated improved pit (VIP) latrine
• Pit latrine with slab
• Composting toilet
Source: WHO–UNICEF (2010).
4. NUTRITION
Nutrition has a direct impact on health and hence on
productivity; conversely, productivity impacts incomes
which in turn impact nutrition. The nutrition–health–
productivity cycle (Figure 4.14) is affected by many exo-
genous factors at each stage. Greater incomes, for instance,
need not translate into better nutrition for all household
members due to inequities in intra-household nutrition
allocation; low awareness levels can also affect the nutrition
allocation.
The human body requires a well-balanced diet for
healthy growth and proper functioning. The issue,
FIGURE 4.13: Government Spending on Water Supply and
Sanitation across Five Year Plans
0.0
0.5
1.0
1.5
2.0
2.5
3.0
3.5
4.0
4.5
5.0
%ofTotalPublicSectorOutlay
Urban WSS Rural WSS XPlan
IXPlan
VIIIPlan
VIIPlan
VIPlan
VPlan
IVPlan
IIIPlan
IIPlan
IPlan
Source: Lok Sabha Unstarred Question No. 3534, dated 15 December 2006.
17. Inputs for Health 67
therefore, is not necessarily ‘more of everything’ (as has
historically been the stance in India due to large-scale
poverty), but the right balance. Calories, proteins, vitamins,
iron and a host of other micronutrients are essential for the
proper development and functioning of the human body.
Their intake is affected by many factors, not just lack of
incomes—food preferences, low awareness, relative prices
are some of the other factors that impact the intake of
adequate nutrition.
While India’s poverty and food security policies have
tended to concentrate on calorific intake, and while much
of the discussion on (in)adequacy of food intake in the
policy literature tends to be centred around calories, it is
well recognised that policy in India needs to move to the
next level, where other nutrients (proteins, iron, calcium
and micronutrients) are not ignored. The following sec-
tions briefly review the issues relating to child and adult
nutrition and the poor outcomes being observed in India
despite significant improvements in incomes over the last
two decades.
4.1 Child Nutrition
India remains home to one-third of the world’s undernou-
rished children. Between 1992 and 2006, the percentage of
underweight infants under 3 years of age saw an insignificant
decline—from 52 to 46 per cent (National Family Health
Survey, various rounds). Judged in terms of the proportion
of underweight children, the level of child malnutrition in
India is exceptionally high—higher than the average for all
of sub-Saharan Africa. This is paradoxical given that India’s
per capita income is much higher, and the growth record
much better, than that of sub-Saharan Africa. Add to that
the fact that India has not had to face as many famines as
sub-Saharan Africa nor has it been adversely affected by
political turmoil and military conflicts.
Table 4.12 reveals that, in general, undernourishment
is higher among rural children than urban. For instance, in
2005–06, the proportion of underweight children in urban
areas was 36 per cent as against 49 per cent in rural areas.
Similarly, levels of stunting and wasting are higher in rural
than in urban areas. Though malnutrition among children
in urban areas is lower, it is still significant enough and
points towards a serious deficiency in our understanding of
the causal factors. There are various indicators of malnutri-
tion: for example, consider anaemia among children which
is all-pervasive and has been worsening over time. The
proportion of anaemic children in the age range of 6 and
35 months rose from 74 per cent in 1998–99 to 79 per
cent in 2005–06, the increase being higher in rural than in
urban areas (Table 4.13). There are inter-state variations
too: 56 per cent in Kerala and 59 per cent in Himachal
Pradesh compared to 85 per cent in Uttar Pradesh and 88
per cent in Bihar. In terms of the levels of anaemia, while
West Bengal and Kerala have shown progress over the past
seven years, other states—Haryana, Rajasthan, Jammu &
Kashmir, Jharkhand, Chhattisgarh, Himachal Pradesh and
Uttarakhand—have seen an increase. The levels of anaemia
are also higher among rural than urban children, and the
rural–urban differential has widened from 4 percentage
points in 1998–99 to 8 percentage points in 2005–06.
TABLE 4.12: Nutritional Status of Children under 3 Years of Age,
2005–06 (%)
Status Urban Rural All-India
Stunted 31 41 38
Wasted 17 20 19
Underweight 36 49 46
Source: NFHS-3 (2005–06), Fact Sheets.
Micronutrient deficiency is a serious contributor to
childhood morbidity and mortality. Children can receive
micronutrients from mother’s milk, food, food forti-
fication, and direct supplementation. As vitamin A is an
essential micronutrient for the immune system, the central
government has recommended that children should be
given supplements every six months until they reach the
age of 3, starting at 9 months. Some states have decided
to extend that period to include children until they reach
5 years of age, as recommended by WHO. However,
NFHS-3 found that only one-quarter of the children
FIGURE 4.14: The Nutrition Cycle
Nutrition supplementation
Access to
healthcare
Use of better
technologies
Access to
efficient markets
Low prices
and awareness
Nutrition Health
Effort
Productivity
Incomes
Source: Bhandari and Zaidi (2004).
18. 68 Laveesh Bhandari and Ankur Gupta
between 12 and 35 months of age received vitamin A
supplements in the six months before the survey. This
figure drops further, to 18 per cent, among children
between 6 and 59 months.
Next consider breastfeeding.6
While breastfeeding is
common in India, very few children are put to the breast
immediately after birth. Only one-quarter of the children
who were ever breastfed started breastfeeding within half
an hour of birth, as is recommended, and almost half
(45 per cent) did not start breastfeeding within one day of
birth. Overall, slightly less than half of the children under
6 months of age are exclusively breastfed (as is recom-
mended). Between the ages of 6 and 8 months, only about
half of the children (53 per cent) are given timely comple-
mentary feeding (breast milk and complementary food).
The timely complementary feeding rate increases to 74 per
cent at the age 9–11 months and 81 per cent at age 12–17
months. The NFHS-3 also found that only 44 per cent
of breastfed children are fed the recommended minimum
number of times, and only half of them also consume food
from three or more food groups. Feeding recommendations
are followed even less often for children who have not been
breastfed. Overall, only 21 per cent of children (breastfed
or not) are fed according to feeding recommendations.
Last, consider severe undernourishment (Table 4.14):
24 per cent are severely stunted and 16 per cent are severely
underweight. Wasting is quite a serious problem in India,
affecting 20 per cent of children under 5 years of age. Very
few children under 5 years of age are overweight.
6
It is recommended that infants should only be breastfed till the age
of 6 months, those between 6 to 8 months should be fed three or more
food groups at least twice a day, and children between the ages of 9 and
23 months should be fed at least three times a day. Children between
the ages of 6 and 23 months who have not been breastfed should be fed
milk or milk products every day in addition to at least four food groups,
and they should be fed four or more times a day.
The available data shows that malnutrition is all-
pervasive, impacting significant proportions across all
segments of the population. Moreover, the lack of suc-
cess of long-running programmes such as the Integrated
Child Development Services (ICDS), and the continu-
ing existence of malnutrition points to something more
than merely a problem of awareness and lack of access to
adequate nutrition. There may be other reasons as well,
genetic or related to morbidity or the presence of parasites
or worms.7
But we find little in the policy literature that
seeks to investigate and address other possible causes.
4.2 Adult Nutrition: Women and Men
As in the case of children, adults—both men and
women—show significantly high levels of malnutrition.
This is reflected in the data from NFHS-3 which collected
information on the height and weight of women between
the ages of 15 and 49 and men between the ages of 15 and
54, as also their consumption of specific foods. The height
and weight measurements provide an estimate of the body
mass index (BMI), a measure of nutritional status. A cut-
off point of 18.5 is used to define thinness or acute under-
nutrition, and a BMI of 25 or above indicates obesity.
More than one-third (36 per cent) of women (in the sur-
veyed age group) have a BMI below 18.5, indicating chronic
nutritional deficiency. The proportion of ever-married
women who are thin (33 per cent) decreased slightly from
36 per cent in NFHS-2. Inter-state comparisons reveal
that the proportion of undernourished women is highest
in Bihar (45 per cent), Chhattisgarh (43 per cent), Madhya
Pradesh (42 per cent) and Orissa (41 per cent). It is lowest
in Sikkim (11 per cent) and Mizoram (14 per cent).
7
We are grateful to Pronab Sen for this suggestion.
TABLE 4.13: Children Aged between 6–35 months Classified as Having Anaemia, by Residence (%)
NFHS-3 (2005–06) NFHS-2 (1998–99)
Anaemia status by haemoglobin level Urban Rural Total Urban Rural Total
Mild (10.0–10.9 g/dl) 25.8 25.7 25.7 23.7 22.7 22.9
Moderate (7.0–9.9 g/dl) 42 51.7 49.4 42 47.1 45.9
Severe (<7.0 g/dl) 4.4 3.5 3.7 5.1 5.5 5.4
Any anaemia (<11.0 g/dl) 72.2 80.9 78.9 70.8 75.3 74.3
Number of children 5,404 17,498 22,903 4,642 15,374 20,016
Source: NFHS-2 (1998–99); NFHS-3 (2005–06).
Notes: 1. Table includes only the last two children aged 6–35 months of every married woman who were interviewed.
2. g/dl should be read as gram per decilitre.
19. Inputs for Health 69
Nationally, 34 per cent of men in the surveyed age
group have a BMI below 18.5, and more than half of
these men are moderately to severely undernourished. The
highest proportion of undernourished men, two in five, can
be found in Madhya Pradesh and Rajasthan.
Anaemia affects 55 per cent of women and 24 per
cent of men. The prevalence of anaemia for ever-married
women has increased from 52 per cent in NFHS-2 to 56
per cent in NFHS-3. Pregnant women are much more
likely to be moderately-to-severely anaemic.
Obesity (Table 4.15), the other side of poor nutrition,
is a significant problem among several groups of women
in India, particularly urban women, well-educated women,
and women from households with a high standard of living.
Among ever-married women, 15 per cent are overweight
or obese, up from 11 per cent in NFHS-2. Obesity is
particularly prevalent for both men and women in Delhi,
Kerala and Punjab, and it is increasing rapidly.
Needless to say there are other deficiencies as well:
for instance, the lack of calcium leads to osteoporosis, a
common problem across India; iodine deficiency continues
to be prevalent despite government orders prohibiting the
sale of non-iodised salt. It has been estimated that 200
million people in India are exposed to the risk of iodine
deficiency and more than 71 million suffer from goitre and
related deficiency disorders (Vir 2002).
TABLE 4.15: Malnutrition and Obesity in Men and Women (2005–06)
Body mass index in kg/m2
Mean
Underweight/
malnourished
Overweight/
obese
<17.0
(moderately/
severely thin)
>25.0
(overweight
or obese)
Males
Age
15–19 18.3 29.3 1.7
20–29 20.1 11.3 6.5
30–39 21 8.9 13
40–49 21.2 10.4 15.2
Total age 15–49 20.2 13.8 9.3
Residence
Urban 21.2 11.5 15.9
Rural 19.7 15.1 5.6
Females
Age
15–19 19 20.9 2.4
20–29 20 16.4 8.2
30–39 21.1 14 17.4
40–49 21.9 12.3 23.7
Total age 15–49 20.5 15.8 12.6
Marital Status
Never married 19.3 20.9 4.5
Currently married 20.8 14.4 14.9
Residence
Urban 22 11.8 23.5
Rural 19.8 17.8 7.4
Source: NFHS-3 (2005–06).
Note: Excludes pregnant women and women due to give birth in the
preceding two months.
TABLE 4.14: Children Under 5 Years of Age Classified as Malnourished According to Height-for-Age and Weight-for-Height by Background
Characteristics, India, 2005–06
Height-for-age Weight-for-height
Background characteristics Percentage below Percentage below Percentage below Percentage below
Severely stunted
-3 SD
Moderately stunted
-2 SD
Severely wasted
-3 SD
Moderately wasted
-2 SD
Sex
Male 23.9 48.1 6.8 20.5
Female 23.4 48.0 6.1 19.1
Residence
Urban 17.6 39.6 5.7 16.9
Rural 25.6 50.7 6.7 20.7
Mother’s nutritional status
Underweight (BMI < 18.5) 27.3 53.5 7.9 25.2
Normal (BMI 18.5-24.9) 22.5 46.3 5.9 17.4
Overweight (BMI > 25) 12.0 31.2 2.7 9.3
Mother not measured 28.9 51.7 7.7 19.6
Wealth index
Lowest 34.2 59.9 8.7 25.0
Middle 23.1 48.9 6.2 18.8
Highest 8.2 25.3 4.2 12.7
Total 23.7 48.0 6.4 19.8
Source: NFHS-3 Fact Sheets (2005–06).
Note: Height-for-age and weight-for-height are the standard measurements of growth.
20. 70 Laveesh Bhandari and Ankur Gupta
4.3 Concluding Note: Concerns and Challenges
The previous sections have briefly highlighted the all-
pervasive character of malnutrition in India. It affects the
proper growth and development in children, the overall
health of women as well as their ability to safely give birth
to healthy infants, and the productivity of both men and
women. There are some common factors that public health
in India needs to address, and these can broadly be classified
into four challenges.
Poverty: Those who are unable to afford adequate food
are bound to be undernourished. Though the central and
state governments have focused on tackling this problem
through a variety of initiatives—with mid-day meals,
the food security act, the public distribution system, the
ICDS—whichprovidesubsidiesofdifferentkinds,leakages
in the systems as well as the inability to reach all those who
deserve are critical issues. The universal identification pro-
ject currently underway will help in targeting those most in
need, but this will be some years down the line.
Citizen awareness: It is quite well known that even when
poor households can afford greater quantity of foods they
tend not to consume those providing the most nutrition.
Awareness campaigns on the importance of nutrition need
to become an integral part of India’s health policy.
Policy orientation: Even policy makers lack an appreci-
ationofwellbalancednutrition.Governmentpoliciesaimed
at ensuring food security, poverty alleviation, and even con-
sumption security have tended to focus on food crops that
score high on calories but not necessarily on proteins or
micronutrients. Moreover, policies that subsidise activities
such as food processing but not food supply logistics may
work against the consumption of important foods that
supply micronutrients. In other words, well balanced
nutrition can only be possible when a variety of foods are
accessible to the masses. And policy makers will need to
incorporate the impact of their decisions on the nutrition
profile of Indian households. The focus, therefore, needs
to increasingly shift away from merely foodgrains and
towards the intake of a variety of foods, including the intake
of calories, fats, proteins, etc., in the correct proportions.
Research: This challenge is by far the most critical. There
has been little research to explain the problem of persistent
malnutritionamongallsegmentsofthepopulation.Genetic
and biological factors, habits and preferences, economic
conditions, all combine in some manner to produce such an
outcome, but we have not yet understood in what manner.
It is this understanding that will finally drive an effective
policy addressing malnutrition in India.
5. CONCLUSION: THE NEED FOR A PUBLIC
HEALTH ENTITY IN INDIA
In this chapter, we have reviewed four different areas that
provide inputs to the health sector: human resources, infra-
structure, water supply and sanitation, and nutrition. The
other inputs—pharmaceuticals and finance—have been
addressed separately. Whatever the input, however,
all suffer from one key constraint: the lack of a public
health focus. Monitoring, investigation, research, plan-
ning, management, evaluation, advocacy, regulation and
effectivepolicymaking,areallrequiredifapositiveenviron-
ment is to be created for good health for all. A range of
entities undertake such functions in India, some ‘within’
the health sector and some on the sidelines: the MoHFW
at the centre, the public health engineering departments
in the states, the Ministry of Rural Development (oversee-
ing water supply to rural areas), the Registrar General of
India (monitoring performance on infant mortality and
fertility), the Ministry of Women and Child Development
(which runs the ICDS), the Ministry of Consumer
Affairs (which oversees the department of food and public
distribution), etc.
This listing is clearly indicative of the fact that a central-
ised entity, able to synchronise and coordinate various
policy measures that are in line with the received evidence
on improving health outcomes, is missing. Though on
paper the MoHFW is assigned such a task, its ability to
bring the other entities together is limited. In such a situa-
tion, a well-oiled coordination mechanism needs to be in
place. But even that is missing. While the creation of a new
entity, as recommended by some, has its own advantages
and disadvantages, the fact remains that India requires a
driver for public health which currently the MoHFW is
not empowered enough to be.
Even within the MoHFW, the focus is largely on the
implementation of important or ‘flagship’ programmes
rather than on generating awareness on health issues. In-
depth monitoring is also taking a back seat; with little data
available, the planning process too is hampered. Important
sectors such as the WSS remain outside its domain. In
effect, what is required is a ‘horizontal’ public health
system that can work across various tiers of government,
public, and private sectors. This would require it to address
issues arising from its own expertise and staff experience.
The creation of a good human resource base would need
to be followed by (a) building institutions and institu-
tional abilities at coordination, (b) putting in institutional
21. Inputs for Health 71
structures at central, state and even local government
levels for public health functions, (c) creating the right
career incentives for public health experts, (d) greater
focus towards advocacy, and also a better understanding of
how regulations can be properly implemented within the
country.
REFERENCES
Bach, S. 2007. ‘Going Global? The Regulation of Nurse
Migration in the UK’, British Journal of Industrial Relations,
45 (2), pp. 383–403.
Banerjee, Abhijit, Angus Deaton and Esther Duflo. 2004.
‘Wealth, Health, and Health Services in Rural Rajasthan’,
American Economic Review, 94 (2), May, pp. 326–30.
Bhandari, Laveesh and Lehar Zaidi. 2004. ‘Reviewing the Costs
of Malnutrition in India’, November, Indicus Analytics.
Bhandari, Laveesh. 2006. ‘Social Infrastructure: Urban Health
and Education’, in 3inetwork, India Infrastructure Report 2006:
Urban Infrastructure. New Delhi: Oxford University Press.
Birrell, B and L Hawthorne. 2004. ‘Medicare Plus and Overseas-
Trained Medical Doctors’, People and Place, 12 (2), pp. 83–98.
Bradley, D. 1977. ‘Health Aspects of Water Supplies in Tropical
Countries’, in R Feachem, M McGarry and D Mara (eds),
Water, Wastes and Health in Hot Climates. Chichester: John
Wiley and Sons, pp. 3-17.
Central Bureau of Health Intelligence (CBHI). 2008. National
Health Profile of India–2008, Directorate General of Health
Services, Ministry of Health and Family Welfare. Available at
http://cbhidghs.nic.in/index2.asp?slid=1000&sublinkid=706
———. Respective years. Health Information of India. Available
at http://cbhidghs.nic.in/Introduction.asp. Accessed on
29 April 2010.
Central Bureau of Health Intelligence in collaboration with
the World Health Organization (CBHI–WHO). 2007.
‘Managing Human Resources for Health in India: A Case
Study of Madhya Pradesh & Gujarat’, Ministry of Health and
Family Welfare, Government of India (October).
Central Pollution Control Board (CPCB). 2003. ‘Water Quality
in India: Status and Trends 1990–2001’, in Monitoring
of Indian National Aquatic Resources Series, Ministry of
Environment and Forests, New Delhi.
Central Public Health and Environmental Engineering
Organisation (CPHEEO). 2002. Report of the Technology
Advisory Group on Solid Waste Management. Ministry of Urban
Development and Poverty Alleviation, Government of India.
Chaudhury, Nazmul, Jeffrey S Hammer, Michael Kremer,
Karthik Muralidharan and F Halsey Rogers. 2006. ‘Missing in
Action: Teacher and Health Worker Absence in Developing
Countries’, Journal of Economic Perspectives, 20 (1), pp. 91–116.
Comptroller and Auditor General (CAG). 2002. Report on the
Union Government for the Year Ended March 2001, System
Appraisals. Available at http://www.cag.gov.in/html/reports/
d_taxes/2002_book2/index.htm. Accessed on 4 May 2010.
Das, Soma. 2009. ‘India’s Patient–Hospital Bed Ratio Not in the
Pink of Health’, The Financial Express, 18 September.
Habibi, S, R Burton and Y Chinniah. 2002. ‘Estimation Using
a New Variable Structure Filter (VSF)’. Paper presented at
the American Control Conference (2002), Saskatchewan
University, Canada.
Howard, Guy and Jamie Bartram. 2003. ‘Domestic Water
Quantity, Service Level and Health’, World Health
Organization. Available at http://www.bvsde.paho.org/
CD-GDWQ/Biblioteca/Support%20docs%20GDWQ/
WSH0302.pdf.
Inhovi, Zain. 2009. ‘Health Infrastructure in India’, The
Viewspaper, August. Available at http://theviewspaper.net/
health-infrastructure-in-india. Accessed on 4 May 2010.
Jalan, Jyotsna and Martin Ravallion. 2001. ‘Does Piped Water
Reduce Diarrhea for Children in Rural India?’ Indian
Statistical Institute and The World Bank (August).
Kaushik, Manas, Ananya Roy, Anand A Bang and Ajay Mahal.
2008a. ‘Quality of Medical Training and Emigration of
Physicians from India’, BMC Health Services Research
(December).
Kaushik, M, A Jaiswal, N Shah and A Mahal. 2008b. ‘High-End
Physician Emigration from India’, Bulletin of the World Health
Organization, 86.
Mahal, A and M Mohanan. 2006. ‘Medical Education in India:
Implications for Quality and Access to Care’, Journal of
Educational Planning and Administration, 20 (4), pp. 173–84.
Ministry of Health and Family Welfare (MoHFW). 2009.
Bulletin on Rural Health Statistics in India 2008. Available
at http://mohfw.nic.in/Bulletin%20on%20RHS%20-
%20March,%202008%20-%20PDF%20Version/
Title%20Page.htm. Accessed on 28 April 2010.
Munshi, Porus. 2009. Making Breakthrough Innovation Happen:
How 11 Indians Pulled Off The Impossible. New Delhi:
HarperCollins.
Muraleedharan, V R and S Nandraj. 2003. ‘Private Health
Care Sector in India: Policy Challenges and Options for
Partnership’, in A S Yazbeck and D H Peters (eds), Health
Policy Research in South Asia: Building Capacity for Reform.
Washington, D C: The International Bank fo r Reconstruction
and Development and The World Bank.
National Commission on Macroeconomics and Health
(NCMH). 2005. Report of the National Commission on
Macroeconomics and Health. New Delhi: Ministry of Health
and Family Welfare. Available at http://nrhm mis.nic.in/ui/
who/PDF/Report%20of%20the%20National%20Commissi
on%20on%20Macroeconomics%20and%20Health%202005.
pdf. Accessed on 27 April 2010.
National Family Health Survey (NFHS-3). 2005–06. Ministry
of Health and Family Welfare, Government of India.
22. 72 Laveesh Bhandari and Ankur Gupta
Nundy, Madhurima. 2005. ‘Primary Health Care in India: Review
of Policy, Plan and Committee Reports’, Background Papers,
National Commission on Macroeconomics and Health.
Planning Commission. 2002. India—Assessment 2002, Water
Supply and Sanitation. A WHO–UNICEF sponsored study.
Available at http://planningcommission.nic.in/reports/
genrep/wtrsani.pdf.
PricewaterhouseCoopers. 2007. Healthcare in India: Emerging
Market Report 2007. Available at http://www.pwc.com/en_
GX/gx/healthcare/pdf/emerging-market-report-hc-in-india.
pdf. Accessed on 29 April 2010.
Rao, Krishna D, Aarushi Bhatnagar and Peter Berman.
2008. ‘India’s Health Workforce: Size, Composition, and
Distribution’. The World Bank.
Sahni,AandSudhaKshirsagar.1993.‘HealthCareInfrastructure
and Institutional Arrangement for the Urban Slums’, in P K
Umashankar and Girish K Mishra (eds), Urban Health System.
New Delhi: Reliance Publishing House.
Shreshtha, Laura B. 2006. ‘Life Expectancy in the United States’,
Congressional Research Service, August.
Sood, Rita and B V Adkoli. 2000. ‘Medical Education in India:
Problems and Prospects’, Indian Journal of Clinical Medicine,
1 (3), October–December.
The World Bank. 2006a. India Inclusive Growth and Service
Delivery: Building on India’s Success, Development Policy
Review. Available at http://siteresources.worldbank.org/
SOUTHASIAEXT/Resources/DPR_FullReport.pdf.
Accessed on 29 April 2010.
———. 2006b. ‘India: Water Supply and Sanitation—Bridging
the Gap Between Infrastructure and Service’. Background
Papers, ‘Urban Water Supply and Sanitation’ and ‘Rural
Water Supply and Sanitation’ (data and research inputs for
the study were provided by Indicus Analytics).
———. 2009. World Development Indicators 2009. Available
at http://databank.worldbank.org/ddp/home.do?Step=2&id
=4&DisplayAggregation=N&SdmxSupported=Y&CNO=2.
Accessed on 27 April 2010.
United Nations Development Programme (UNDP). 2004.
Human Development Report 2004: Cultural Liberty in Today’s
Diverse World. Available at http://hdr.undp.org/en/media/
hdr04_complete.pdf. Accessed on 27 April 2010.
Vir, S C. 2002. ‘Current Status of Iodine Deficiency Disorders
(IDD) and Strategy for its Control in India’, Indian Journal of
Pediatrics, 69 (7), pp. 589–96.
Water Supply and Sanitation Collaborative Council (WSSCC).
2002. ‘It’s the Big Issue’ Available at http://www.wsscc.org/
fileadmin/files/pdf/publication/big_issue/BIG_ISSUE_
English.pdf
White, G F, D J Bradley and A U White. 1972. Drawers of
Water: Domestic Water Use in East Africa. Chicago: University
of Chicago Press.
World Health Organization (WHO). 2007. Not Enough Here
… Too Many There … Health Workforce in India. Available
at http://www.whoindia.org/LinkFiles/Human_Resources_
Health_Workforce_in_India_-_Apr07.pdf. Accessed on
29 April 2010.
———. 2009. World Health Statistics. Available at http://www.
who.int/whosis/whostat/2009/en/index.html. Accessed on
29 April 2010.
WHO–UNICEF Joint Monitoring Programme for Water
Supply and Sanitation. 2010. Progress on Sanitation and
Drinking Water. Available at http://www.who.int/water_
sanitation_health/publications/9789241563956/en/index.
html. Accessed on 30 April 2010.