1. Model overview
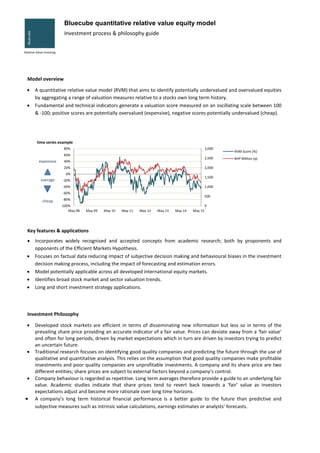
A quantitative relative value model (RVM) that aims to identify potentially undervalued and overvalued equities
by aggregating a range of valuation measures relative to a stocks own long term history.
Fundamental and technical indicators generate a valuation score measured on an oscillating scale between 100
& -100; positive scores are potentially overvalued (expensive), negative scores potentially undervalued (cheap).
Key features & applications
Incorporates widely recognised and accepted concepts from academic research; both by proponents and
opponents of the Efficient Markets Hypothesis.
Focuses on factual data reducing impact of subjective decision making and behavioural biases in the investment
decision making process, including the impact of forecasting and estimation errors.
Model potentially applicable across all developed international equity markets.
Identifies broad stock market and sector valuation trends.
Long and short investment strategy applications.
Investment Philosophy
Developed stock markets are efficient in terms of disseminating new information but less so in terms of the
prevailing share price providing an accurate indicator of a fair value. Prices can deviate away from a ‘fair value’
and often for long periods, driven by market expectations which in turn are driven by investors trying to predict
an uncertain future.
Traditional research focuses on identifying good quality companies and predicting the future through the use of
qualitative and quantitative analysis. This relies on the assumption that good quality companies make profitable
investments and poor quality companies are unprofitable investments. A company and its share price are two
different entities; share prices are subject to external factors beyond a company’s control.
Company behaviour is regarded as repetitive. Long term averages therefore provide a guide to an underlying fair
value. Academic studies indicate that share prices tend to revert back towards a ‘fair’ value as investors
expectations adjust and become more rationale over long time horizons.
A company’s long term historical financial performance is a better guide to the future than predictive and
subjective measures such as intrinsic value calculations, earnings estimates or analysts’ forecasts.
0
500
1,000
1,500
2,000
2,500
3,000
-100%
-80%
-60%
-40%
-20%
0%
20%
40%
60%
80%
May 08 May 09 May 10 May 11 May 12 May 13 May 14 May 15
time series example
RVM Score (%)
BHP Billiton (p)
Bluecube
Bluecube quantitative relative value equity model
Investment process & philosophy guide
Relative Value Investing
expensive
average
cheap