1. HGFL Dependent Ron Signaling Reduces Sensitivity to Chemotherapy and is
Associated with Type I Interferon Responses
Abstract
The Ron receptor tyrosine kinase is overexpressed in many cancers, including
breast cancer. Overexpression of Ron and its ligand, Hepatocyte Growth Factor
Like protein (HGFL), is associated with breast cancer that is more aggressive and
resistant to therapy. Recent publications have shown that chemotherapeutics can
initiate anti-tumor responses through activation of the interferon (IFN) response
pathway. We have preliminary RNAseq and western blot data suggesting that
Ron activation suppresses IFN signaling. Based on this information, we
hypothesized that Ron limits the effectiveness of chemotherapy treatment in part
by inhibition of type I interferon signaling. To test this hypothesis, we utilized a
mammary tumor cell line (R7 cells) which expresses high levels of Ron and
HGFL. Ron and HGFL were knocked down in R7 cells using short hairpin (sh)
RNAs and lentiviral transduction methods. Control R7 cells as well as Ron
(shRon) and HGFL (shHGF) targeted cells were subjected to chemotherapy
treatment and cell growth and mRNA expression were evaluated. Our results
show that both knockdown of Ron and HGFL led to significant increases in mRNA
expression of genes involved in type I IFN signaling and that this expression
decreased with drug treatment in control R7 cells. These data will help improve
patient care by providing an understanding in how to make the
chemotherapeutics more effective against tumors, perhaps by employing
combination therapies with Ron inhibitors already in clinical trials.
Introduction
• Ron receptor tyrosine kinase is over expressed in cancerous cells
• Ligand for Ron is hepatocyte growth factor-like protein (HGFL)
• Chemotherapeutics initiate interferon responses in cancer cells
• Ron overexpressing tumors are less responsive to chemotherapy
• Ron inhibitors are currently in clinical trials
Hypothesis: HGFL dependent-Ron signaling limits the effectiveness of
chemotherapy in part by inhibition of type I interferon signaling.
Conclusion
• Ron inhibition in combination with chemotherapy decreases tumor growth
• Ron and HGFL knockdown cells are more sensitive to chemotherapeutics
than the control R7 cells
• Ron expressing cells suppress IFN signaling in response to chemotherapy
while knockdown cells upregulate it
• Future Work
-Soft agar assays to mimic 3D environment
Acknowledgements
SURF-GE
University of Cincinnati Department of Cancer Biology
Waltz laboratory
Allison A. Foster1, Nancy M. Benight1, Abby Johnson1, Susan E. Waltz1,2
1Department of Cancer Biology, University of Cincinnati College of Medicine, and 2Research Service, Cincinnati Veterans Hospital Medical Center,
Cincinnati, OH 45267
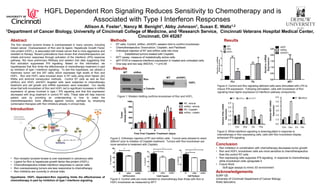
Results
Figure 2: Orthotopic injection of R7 and shRon cells. Tumors were allowed to reach
200mm3 prior to initiation of Cisplatin treatment. Tumors with Ron knockdown are
more sensitive to treatment with Cisplatin.
R7 shRon shHGFL
0
20
40
60
80
*
*
10uM Cisplatin
%Control
R7 shRon shHGFL
0
20
40
60
5uM Paclitaxel
*
*
%Control
R7 shRon shHGFL
0
20
40
60
80
100
*
2uM Doxorubicin
%Control
WT shRon
Ron
α-Tubulin
WT shHGFL
HGFL
Figure 1: Western blotting confirms knockdown of Ron and HGFL.
Figure 3: Control cells are more resistant to chemotherapy than those with Ron or
HGFL knockdown as measured by MTT.
Figure 4: Control and Ron signaling deficient cells were stimulated with LPS to
induce IFN expression. Following stimulation, cells with knockdown of Ron
signaling have higher expression of interferon pathway components.
Figure 5: While interferon signaling is downregulated in response to
chemotherapy in Ron expressing cells, cells with Ron knockdown display
enhanced IFN signaling.
Methods
• R7 cells: Control, shRon, shHGFL-western blot to confirm knockdown
• Chemotherapeutics: Doxorubicin, Cisplatin, and Paclitaxel
• Orthotopic injection of R7 and shRon cells into mice
• Established tumors treated with Cisplatin
• MTT assay- measure of metabolically active cells
• qRT-PCR to measure interferon expression in treated and untreated cells
• One way and two way ANOVA, * = p<0.05
0 5 7
0
200
400
600
800
1000
R7, vehicle
shRon, vehicle
R7, Cisplatin
shRon, ciplatin
Time Post Cisplatin Treatment (days)
Tumor
Volume(mm3
)
0.0
1.0
2.0
3.0
4.0
5.0
6.0
Con Dox Cis Pac
RelativeIRF7mRNA
Expression
R7 shRon
0.0
0.5
1.0
1.5
2.0
2.5
Con Dox Cis Pac
RelativeIFNamRNA
Expression
R7 shRon shHGFL
Results