SlideShare a Scribd company logo
1 of 12
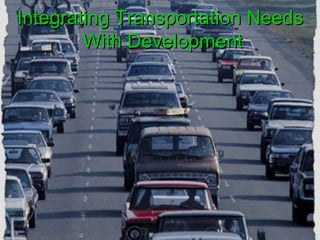
Integrating Transportation Needs
        With Development
Vision

            w
                             Impact Guidelines
        vie
                            Top Level Numbers
      / Re


                                                                        Tra
                                                 Development
                Fina
   ck


                                     Education
                          Histo


                                                               Hous


                                                                           n
    a


                                                                         spo
                     nc
 db


                               ric


                                                                   in
                ial


                                                                            r
                                                                           tati
                                                                 g
   e
Fe


                                                                                on
                      Implementation
                  Priorities / Cost Benefit


                      Operations / Details
Route          495           Resources

Capacity begins           Rte. 495 Per Lane Maximum
                               Vehicle Population
Failing
@ 4,200                 2000
                        1800
Vehicles/hr.            1600
1`way.       Vehicles
                        1400
               Per Hour
               Per Lane 1200
Peak 2.5 Hours          1000
                        800
with no mishaps         600
is 21,000               400

vehicles both           200
                         0
ways                             10    20     30   40    50   60   70
                                      Average Speed, M.P.H.
Avoid 128 Dilemma

        2000
        1800
        1600
         1400
Vehicles
Per Hour 1200
Per Lane 1000
         800

         600
         400
         200
          0
                10   20      30     40    50      60   70

                          Average Speed, M.P.H.
Currently


  30,000 Jobs in Marlborough Vicinity

          Which is 34% of the
88,000 Jobs In + Proximate to Marlborough
Lower Income Displaced by Higher Income
    Forcing more lower income commuters
New Jobs are not geographically linked to residence
60% increase in 45 minute commutes across entire state
Boom to Local Business resulting in strain to resources
Less disposable income available
Salaries Down, Less local housing, Solo Transit costs Up


                    Economic Trends
Marlborough Development
TCSP Marlborough Build out     "Planned Growth"                 Population Employment
physical capacity is 110,000   Projected At buildout              340,037 458,888
   jobs Which is 39% of        Year 2000                          264,949 171,601
         anticipated                                               75,088 287,287
 280,000 Jobs Proximate to     Employment Will Increase Almost 4 Fold
       Marlborough             Increased Population does not represent new employees


ilding 2
Marlborough Development
   and Population Estimates

5 Million Sq. Ft. Approved for construction

5 Million Sq. Ft. in Approval stages

Equivalent of 40,000 new jobs
@ 250Sq./Ft. per employee

Fidelity is 150 Sq./Ft. per employee
21,000 Vehicles in 2.5 Hours
        on Route 495
40,000 anticipated new commuters to Marlborough
 Which is 40% of 100,000 new to Proximate area

88,000 Present commuters to 6 town area
100,000 new to area


188,000 probable new population to area
Solutions ?
All Modes of Transit Speak to Each Other,
 We have the Technology.
 Cooperation is key to Expansion

Green Wave       Door 2 Door Program   30%
  Assisting      Commuter Rail         30%
  Feeding        Fixed Bus Routes      20%
  Enabling       Business Change       20%
Winning Results
Commuters, Children, Elders also get their transportation needs fulfilled
                    Savings $4,000-$10,000 each commuter


Communities, Accumulation of Wealth           Needed Transit services, Employment
                       Opportunities,   3,000 clients X $6,000 savings = $18,000,000 year


Business Opportunities, Vendors, Corporations Capitol Equipment,
                             Franchise Services, R + D   $$$$ Reoccurring Revenue


Government, Local, State, Federal       Savings of Hidden and Direct Costs
                    $3,000 - $6,000 each vehicle with very little or no subsidy


Environment, Conservation, Less Pollution        Exportable Positive Transportation
                      Solution, Savings of 11 cents per undriven solo miles


Economy, Local Money Supply, Utility with better distribution of Capitol Equipment,
                   Savings over time debt loads are diminished

More Related Content

Similar to Integrating Transportation And Development Marlborough, Massachusetts

Fred Morley, Greater Halifax Partnership presentation
Fred Morley, Greater Halifax Partnership presentationFred Morley, Greater Halifax Partnership presentation
Fred Morley, Greater Halifax Partnership presentationHalifax_Gateway
 
Sahaj corporate presentation1
Sahaj corporate presentation1Sahaj corporate presentation1
Sahaj corporate presentation1Jagdish Peswani
 
Metrolinx - Intro to Regional Planning in the GTA
Metrolinx - Intro to Regional Planning in the GTAMetrolinx - Intro to Regional Planning in the GTA
Metrolinx - Intro to Regional Planning in the GTAjeff_ranson
 
What's Next ATL: Top 10 Challenges for Metro Atlanta (2018)
What's Next ATL: Top 10 Challenges for Metro Atlanta (2018)What's Next ATL: Top 10 Challenges for Metro Atlanta (2018)
What's Next ATL: Top 10 Challenges for Metro Atlanta (2018)Susan Chana
 
Caltrain Capacity Mountain View
Caltrain Capacity Mountain ViewCaltrain Capacity Mountain View
Caltrain Capacity Mountain ViewAdina Levin
 
Metrolinx - Regional Planning - Leslie Woo
Metrolinx - Regional Planning - Leslie WooMetrolinx - Regional Planning - Leslie Woo
Metrolinx - Regional Planning - Leslie WooToronto 2030 District
 
State of Center City, 2012: Part 2
State of Center City, 2012: Part 2State of Center City, 2012: Part 2
State of Center City, 2012: Part 2Center City District
 
Reston Transportation Funding Plan-Updates and Funding Scenarios: Sept. 12, 2016
Reston Transportation Funding Plan-Updates and Funding Scenarios: Sept. 12, 2016Reston Transportation Funding Plan-Updates and Funding Scenarios: Sept. 12, 2016
Reston Transportation Funding Plan-Updates and Funding Scenarios: Sept. 12, 2016Fairfax County
 
Building A Virtual Operator in China
Building A Virtual Operator in ChinaBuilding A Virtual Operator in China
Building A Virtual Operator in ChinaXiaolin Lu
 
Jamaica's ICT industry: Maximising our intellectual assets
Jamaica's ICT industry: Maximising our intellectual assetsJamaica's ICT industry: Maximising our intellectual assets
Jamaica's ICT industry: Maximising our intellectual assetsMichele Marius
 

Similar to Integrating Transportation And Development Marlborough, Massachusetts (20)

Innovative regional economics and strategic infrastructure
Innovative regional economics and strategic infrastructureInnovative regional economics and strategic infrastructure
Innovative regional economics and strategic infrastructure
 
Talent Transformation in ICT
Talent Transformation in ICT Talent Transformation in ICT
Talent Transformation in ICT
 
E chaupal
E chaupalE chaupal
E chaupal
 
Fred Morley, Greater Halifax Partnership presentation
Fred Morley, Greater Halifax Partnership presentationFred Morley, Greater Halifax Partnership presentation
Fred Morley, Greater Halifax Partnership presentation
 
Sahaj corporate presentation1
Sahaj corporate presentation1Sahaj corporate presentation1
Sahaj corporate presentation1
 
Cape townstartup infographic-final
Cape townstartup infographic-finalCape townstartup infographic-final
Cape townstartup infographic-final
 
Metrolinx - Intro to Regional Planning in the GTA
Metrolinx - Intro to Regional Planning in the GTAMetrolinx - Intro to Regional Planning in the GTA
Metrolinx - Intro to Regional Planning in the GTA
 
Cict cavite[1]
Cict cavite[1]Cict cavite[1]
Cict cavite[1]
 
What's Next ATL: Top 10 Challenges for Metro Atlanta (2018)
What's Next ATL: Top 10 Challenges for Metro Atlanta (2018)What's Next ATL: Top 10 Challenges for Metro Atlanta (2018)
What's Next ATL: Top 10 Challenges for Metro Atlanta (2018)
 
Su Kahumbu - Bio-Landbau in der Praxis: Beispiele aus Kenia
Su Kahumbu - Bio-Landbau in der Praxis: Beispiele aus KeniaSu Kahumbu - Bio-Landbau in der Praxis: Beispiele aus Kenia
Su Kahumbu - Bio-Landbau in der Praxis: Beispiele aus Kenia
 
Caltrain Capacity Mountain View
Caltrain Capacity Mountain ViewCaltrain Capacity Mountain View
Caltrain Capacity Mountain View
 
Metrolinx - Regional Planning - Leslie Woo
Metrolinx - Regional Planning - Leslie WooMetrolinx - Regional Planning - Leslie Woo
Metrolinx - Regional Planning - Leslie Woo
 
Mw Resources Forum 2012 Tony Brun Presentation
Mw Resources Forum 2012   Tony Brun PresentationMw Resources Forum 2012   Tony Brun Presentation
Mw Resources Forum 2012 Tony Brun Presentation
 
State of Center City, 2012: Part 2
State of Center City, 2012: Part 2State of Center City, 2012: Part 2
State of Center City, 2012: Part 2
 
Cc rday ing
Cc rday ingCc rday ing
Cc rday ing
 
Reston Transportation Funding Plan-Updates and Funding Scenarios: Sept. 12, 2016
Reston Transportation Funding Plan-Updates and Funding Scenarios: Sept. 12, 2016Reston Transportation Funding Plan-Updates and Funding Scenarios: Sept. 12, 2016
Reston Transportation Funding Plan-Updates and Funding Scenarios: Sept. 12, 2016
 
Building A Virtual Operator in China
Building A Virtual Operator in ChinaBuilding A Virtual Operator in China
Building A Virtual Operator in China
 
TASC-Hampton Roads Partnership Presentation
TASC-Hampton Roads Partnership Presentation TASC-Hampton Roads Partnership Presentation
TASC-Hampton Roads Partnership Presentation
 
169 Bren - GFOA Conf Atlanta 6-9-10
169 Bren - GFOA Conf Atlanta 6-9-10169 Bren - GFOA Conf Atlanta 6-9-10
169 Bren - GFOA Conf Atlanta 6-9-10
 
Jamaica's ICT industry: Maximising our intellectual assets
Jamaica's ICT industry: Maximising our intellectual assetsJamaica's ICT industry: Maximising our intellectual assets
Jamaica's ICT industry: Maximising our intellectual assets
 

Integrating Transportation And Development Marlborough, Massachusetts

  • 2. Vision w Impact Guidelines vie Top Level Numbers / Re Tra Development Fina ck Education Histo Hous n a spo nc db ric in ial r tati g e Fe on Implementation Priorities / Cost Benefit Operations / Details
  • 3. Route 495 Resources Capacity begins Rte. 495 Per Lane Maximum Vehicle Population Failing @ 4,200 2000 1800 Vehicles/hr. 1600 1`way. Vehicles 1400 Per Hour Per Lane 1200 Peak 2.5 Hours 1000 800 with no mishaps 600 is 21,000 400 vehicles both 200 0 ways 10 20 30 40 50 60 70 Average Speed, M.P.H.
  • 4. Avoid 128 Dilemma 2000 1800 1600 1400 Vehicles Per Hour 1200 Per Lane 1000 800 600 400 200 0 10 20 30 40 50 60 70 Average Speed, M.P.H.
  • 5. Currently 30,000 Jobs in Marlborough Vicinity Which is 34% of the 88,000 Jobs In + Proximate to Marlborough
  • 6. Lower Income Displaced by Higher Income Forcing more lower income commuters New Jobs are not geographically linked to residence 60% increase in 45 minute commutes across entire state Boom to Local Business resulting in strain to resources Less disposable income available Salaries Down, Less local housing, Solo Transit costs Up Economic Trends
  • 7. Marlborough Development TCSP Marlborough Build out "Planned Growth" Population Employment physical capacity is 110,000 Projected At buildout 340,037 458,888 jobs Which is 39% of Year 2000 264,949 171,601 anticipated 75,088 287,287 280,000 Jobs Proximate to Employment Will Increase Almost 4 Fold Marlborough Increased Population does not represent new employees ilding 2
  • 8. Marlborough Development and Population Estimates 5 Million Sq. Ft. Approved for construction 5 Million Sq. Ft. in Approval stages Equivalent of 40,000 new jobs @ 250Sq./Ft. per employee Fidelity is 150 Sq./Ft. per employee
  • 9. 21,000 Vehicles in 2.5 Hours on Route 495 40,000 anticipated new commuters to Marlborough Which is 40% of 100,000 new to Proximate area 88,000 Present commuters to 6 town area 100,000 new to area 188,000 probable new population to area
  • 11. All Modes of Transit Speak to Each Other, We have the Technology. Cooperation is key to Expansion Green Wave Door 2 Door Program 30% Assisting Commuter Rail 30% Feeding Fixed Bus Routes 20% Enabling Business Change 20%
  • 12. Winning Results Commuters, Children, Elders also get their transportation needs fulfilled Savings $4,000-$10,000 each commuter Communities, Accumulation of Wealth Needed Transit services, Employment Opportunities, 3,000 clients X $6,000 savings = $18,000,000 year Business Opportunities, Vendors, Corporations Capitol Equipment, Franchise Services, R + D $$$$ Reoccurring Revenue Government, Local, State, Federal Savings of Hidden and Direct Costs $3,000 - $6,000 each vehicle with very little or no subsidy Environment, Conservation, Less Pollution Exportable Positive Transportation Solution, Savings of 11 cents per undriven solo miles Economy, Local Money Supply, Utility with better distribution of Capitol Equipment, Savings over time debt loads are diminished

Editor's Notes

  1. The ratios are equal because all Transportation regimes are operating on the basis of cooperation through a centralized transaction system that is Similar to a parcel delivery system but more human in nature.