
Recommended
Recommended
More Related Content
What's hot
What's hot (20)
Similar to Total factor productivity(TFP) and chinese economic reform
Similar to Total factor productivity(TFP) and chinese economic reform (20)
Recently uploaded
Recently uploaded (20)
Total factor productivity(TFP) and chinese economic reform
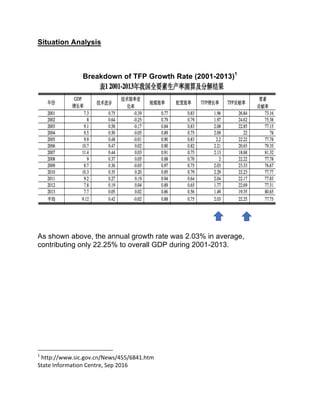
- 1. Situation Analysis Breakdown of TFP Growth Rate (2001-2013)1 As shown above, the annual growth rate was 2.03% in average, contributing only 22.25% to overall GDP during 2001-2013. 1 http://www.sic.gov.cn/News/455/6841.htm State Information Centre, Sep 2016
- 2. Growth Trend for Total Factor Productivity(TFP), (1990-2014) 2 2 http://www.igef.cuhk.edu.hk/igef_media/working- paper/IGEF/igef_working_paper_no_44%20sim.pdf
- 3. Breakdown for GDP Growth Rate (1990-2014) 2000-2008 witnessed continuous growth for TFP, with China joining WTO and the capital driven model applied. After 2011 however, both TFP and GDP started experiencing a downtrend, with an even -0.2% growth for TFP in 2014.
- 4. Look Ahead China has not published any official data for its annual TFP growth target. However, since 2015, in the Central Economic Work Conference, the concept of TFP growth was welcomed while deploying the requirement for Demand-Supply side reform. One think tank under NDRC, the Academy of Macroeconomic Research suggested 2% annual growth3 like Singapore set in 1990s. With the horn of ‘Growth in Quality’ by 19th Congress, we may expect more attention to TFP in future Chinese economic growth. 3 http://www.amr.gov.cn/ghbg/xsfx/201712/t20171208_69056.html