Recommended

Recommended
More Related Content
What's hot
What's hot (15)
Similar to Capstone Project Poster
Similar to Capstone Project Poster (20)
Recently uploaded
Recently uploaded (20)
Capstone Project Poster
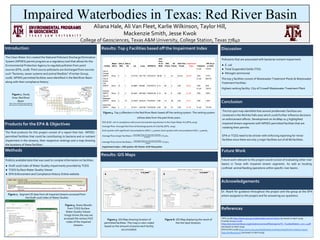
- 1. Products for the EPA & Objectives Methods The Clean Water Act created the National Pollutant Discharge Elimination System (NPDES) permit program as a regulatory tool that allows for the Environmental Protection Agency to regulate pollution from point sources (EPA, 2018). Point source pollutants are discharged from sources such “factories, sewer systems and animal feedlots” (Frontier Group, 2018). NPDES permitted facilities were identified in the Red River Basin along with their compliance history . Impaired Waterbodies in Texas: Red River Basin Basin Aliana Hale, Ali Van Fleet, Karlie Wilkinson, Taylor Hill, Mackenzie Smith, Jesse Kwok College of Geosciences, Texas A&M University, College Station, Texas 77840 Results: Top 5 Facilities based off the Impairment Index Discussion Conclusion Introduction The final products for this project consist of a report that lists NPDES- permitted facilities that could be contributing to bacteria and or nutrient impairment in the streams, their respective rankings and a map showing the locations of these facilities. Publicly available data that was used to compile information on facilities: ● Draft 2016 Index of Water Quality Impairments provided by TCEQ ● TCEQ Surface Water Quality Viewer ● EPA Enforcement and Compliance History Online website Results: GIS Maps Dr. Roark for guidance throughout the project and the group at the EPA whom assigned us this project and for answering our questions. Acknowledgements Figure 1. Study Area: Red River Basin http://www.twdb.texas.gov/surfacew ater/rivers/river_basins/red/index.asp Future Work Future work relevant to this project would consist of evaluating other river basins in Texas with impaired stream segments. As well as locating confined animal feeding operations within specific river basins. References Figure 6. GIS Map displaying the result of the Hot Spot Analysis. Figure 4. Top 5 offenders in the Red River Basin based off the ranking system. The ranking system utilizes data from the past three years. Figure 5. GIS Map showing location of permitted facilities. This map is color coded based on the amount of points each facility accumulated. The hot spot map identified that several problematic facilities are clustered in the Wichita Falls area which could further influence decisions on enforcement efforts. Development on ArcMap 10.5 highlighted impaired stream segments with NPDES-permitted facilities that are violating their permits. EPA or TCEQ need to be stricter with enforcing reporting for minor facilities since there are only 3 major facilities out of all 66 facilities. Pollutants that are associated with bacteria/ nutrient impairment: ● E. coli ● Total Suspended Solids (TSS) ● Nitrogen (ammonia) The top 5 facilities consist of Wastewater Treatment Plants & Wastewater Treatment Facilities Highest ranking facility: City of Crowell Wastewater Treatment Plant EPA (2018) https://www.epa.gov/npdes/npdes-permit-basics (accessed 20 April 2019) Frontier Group (2018) https://environmenttexas.org/sites/environment/files/reports/TX_TroubledWaters_scrn_0.pdf (accessed 20 April 2019) EPA ECHO (2018) https://echo.epa.gov/help/loading-tool/reports/pollutant-loading-report- help-dmr#summary (accessed 20 April 2019) Figure 2. Segment ID data from all impaired streams accessed from the Draft 2016 Index of Water Quality Figure 3. Query Results from TCEQ Surface Water Quality Viewer. Image shows the way we accessed the various HUC codes of the impaired streams. SNC & NC: not in compliance with an environmental requirement in the Clean Water Act (EPA,2019) Average Flow: Average flow from all discharge points of a facility (EPA, 2019) Each quarter with significant noncompliance (SNC) = 5 points, Each quarter with noncompliance (NC) = 3 points, Average Flow (major facilities) = !"#$%&# '()* )+ ,-$$#./ +%,0(0/1 23 456 ×5 9:;, Average Flow (minor facilities) = !"#$%&# '()* )+ ,-$$#./ +%,0(0/1 2 456 ×5 9:;, Impairment Index = SNC points+ NC Points+ AVG Flow points