SlideShare a Scribd company logo
1 of 12
Download to read offline
Journal of Economics and Sustainable Development www.iiste.org
ISSN 2222-1700 (Paper) ISSN 2222-2855 (Online)
Vol.4, No.10, 2013
74
The Impact of Fiscal Decentralization toward Regional
Inequalities in Eastern Region of Indonesia
Syawal Zakaria
Faculty of Economics, Darussalam University, Ambon (Indonesia)
E-mail address zakaria.syawal@ymail.com
Abstract
This research aims to reveal whether fiscal decentralization is able to reduce regional inequality at Eastern
Region of Indonesia. This research also endeavors to detect other variables (such as population growth,
education participation level, open-unemployment rate, and investment rate) as the control variables that may
affect regional inequality.
The estimation result using panel data from 16 provinces during 2001-2010 in Eastern Region of Indonesia
confirms that (1) fiscal decentralization is not able to reduce regional inequality, (2) population growth,
education participation level, and investment rate have an effect to reduce regional inequality, and (3) in long
term, economic performance tend to be better in the Eastern Region of Indonesia due to the change on the
economic structure from traditional pattern to modern pattern. This condition is reflected on the Kuznets’
Inverted-U hypothesis confirmation.
Keywords: fiscal decentralization, regional inequality, change on the economy structure pattern.
1. Introduction
Debate that comes up among economics experts and practitioners until recent time that become the core of
discussion and exploration is about fiscal decentralization policy. The main issue that is discussed is related to
the relationship between fiscal decentralization and regional inequality.
Some of the empirical studies have been conducted related to the relationship between fiscal decentralization and
regional inequality. The results of those studies have come to various conclusions. According to Kim et.al. (2003)
and Bonet (2006), fiscal decentralization has positive effect on regional inequality. It means that higher fiscal
decentralization’s dimension results in higher rate of regional inequality. This finding is responded by Canaleta
et.al (2004), Widhyanto (2008), and Rodriguez-Pose and Ezcurra (2009). They argue that fiscal decentralization
has negative effect toward regional inequality. Their view resembles the theoretical hypothesis based on the
Kuznets’ Inverted-U curve. Further, in another perspective, Shah (1997) records with some exceptions in
developing countries that explicitly the transfer that is allocated to poor region for achieving equality is not well-
utilized so that it causes fiscal disruption, weakens economic growth, and even makes the local government’s
financial worst; those, in turn, will widen regional inequality. This view is supported by Shankar and Shah (2003)
when decentralization policy is failed to create development equality on each country or region.
This research is aimed to analyze the role of fiscal decentralization on regional inequality in Easter Region of
Indonesia. Considering that fiscal decentralization policy has been started since 2001, this research is also an
evaluation of its effect on each province in the Eastern Region of Indonesia. The next part will deliver theoretical
framework and analysis model development that are utilized in this research. The last part is related to the
discussion and suggestion of the research result.
2. Theoretical Framework
2.1. Fiscal Decentralization Objective
In simple term, fiscal decentralization theory and practice are about how fiscal decentralization provides
contribution on the achievement of economics target such as economics efficiency, income redistribution, and
macroeconomics stability.
Fiscal decentralization is often defined as fiscal authority delegation from central government to local
government. Fiscal decentralization can bring huge economics efficiency in resource allocation among public
sector. Since the public service preference differs on each region, the standardized service provided by the
government is perceived to be less-efficient. Therefore, local government is more suitable to deliver the service
since local government is assumed to be able to understand the preference uniqueness of each region. When
local government holds the authority, it will sets off competition among local governments in delivering public
service and chasing economic growth.
According to Prud’home (1995), since individual’s preference and mobility are different for each region,
decentralization system can be more efficient. On the contrary, if the individual’s preference is similar, then the
standardization of public service will be more efficient. Prud’home (1995) also states that even the society who
lives at particular region has similarity on its preference, and local government can be more efficient in public
Journal of Economics and Sustainable Development www.iiste.org
ISSN 2222-1700 (Paper) ISSN 2222-2855 (Online)
Vol.4, No.10, 2013
75
service compared to central government.
Oates (1993) mentions that fiscal decentralization is able to improve economic efficiency since local government
is closer to local society than central government so that local government will be more responsive toward
local’s needs and preferences. Local government also has a better understanding on local preference and finance.
Economic efficiency induces population to move and live at the regions and community that can meet their
preferences. Oates (1999) also states that fiscal decentralization issue becomes a trend, both in developed and
developing countries. Several countries encourage devolution to improve the performance of their public sector’s
service. Decentralization enhances wealth that is more than the outcome achieved from centralized governmental
system. The output efficiency level is quite varied among regions due to various preferences and finance.
However, it should be the responsibility of the lowest structure of government. Thus, to run the governmental
function, it needs fiscal instrument’s specification. Fiscal instrument of a federal system consists of taxation,
inter-governments aid, and sharing income. The problem is which tax imposition that is proper and good to be
utilized on the different government level.
Jonathan Rodden (2002) says that one of the most difficult challenges faced by several governmental systems is
fiscal indiscipline among local governments. Vertical fiscal inequality has negative effect on local government
fiscal performance. Fiscal decentralization is risky when local government marks up its expenditure far beyond
actual finance. The improvement of government aid causes tax reduction; money transfer improvement instigates
higher expenditure than local government development. Central government will limit local autonomy loan
when vertical fiscal inequality is high. Vertical fiscal inequality affects local government performance if local
autonomy loan is high. When local autonomy loan is low, loan deficit is still below tight control of central
government. This kind of political atmosphere disturbs fiscal performance of local government.
From the explanation above, there are two opposing views related to fiscal decentralization and economic
efficiency. Decentralization system is more efficient than centralization system since decentralization creates
competition among local governments. Decentralization can become less efficient if local government
expenditure cannot be covered by its local income; furthermore, if the competition role is quite dominant, it
triggers regional inequality. Fiscal decentralization instrument on each country or region is similar: tax, financial
aid, and loan.
2.2. Fiscal Decentralization and Regional Inequality
Bonet (2006) examined the effect of fiscal decentralization toward regional income inequality in Colombia. By
using inter-departments data panel set, it found strong evidence that fiscal decentralization process increased
regional income inequality. This trend was caused by a set of factors such as recent expenditure that was mostly
allocated to new resources of the local government (for instance: salary and wage) not to capital or infrastructure
investment, lack of national transfer redistribution components, no sufficient incentive from national until local
levels to promote efficient benefit from them, lack of institutional capacity in local government.
The empirical result also confirms that the crucial elements of fiscal decentralization policy affecting regional
income inequality are: fair transfer system, ability to select the sector, to where the resources are allocated and
proper incentive allocation. Those elements play important role in succeeding decentralization to reduce regional
income inequality. According to Bonet (2006), there are two variables that should be controlled: economic
openness level and economic agglomeration trend that have negative effect on regional inequality.
Rediguez-Pose and Ezcurra (2010) analyzed the relationship between decentralization and regional inequality
among developed and developing countries. In general, it is assumed that authority and resource transfer from
central government to local government can cause unpleasant effect on the national economics cohesion. The
result showed that fiscal decentralization and politic were completely cut-off from the inequality evolution
among regions. It implies that there is a constraint on institutional capacity, fiscal capacity, and political capacity
which administratively disadvantaged regions compete with rich, strong, and bigger region in achieving higher
autonomy. To balance the inequality, it needs better capacity of the local government in disadvantaged regions to
mobilize and exploit their economics potentials and make policies preferred by local population mainly for the
ignored or less-prioritized region in national policy. The presence of national government with fiscal
redistribution capacity becomes one of the significant factors that bounds negative potentials of rural regions
decentralization. The relationship between decentralization and regional inequality evolution are much varied
depending on the development rate of a country. The result indicates that in developed country, political
decentralization does not affect inter regions inequality evolution; whereas, fiscal decentralization contributes to
reduce regional inequality. Inequality increase cannot be compensated by the positive effect of politics. It was
also explained that local governments’ policy decision in a developed country were diverse which tended to
ignore the evolution of inter regions inequality. One of the exceptions only came from health sector which could
reduce poverty. Inequality among regions which either increased or decreased depended on decentralization
degree. The relationship between decentralization and inequality evolution at regional/local level was obviously
Journal of Economics and Sustainable Development www.iiste.org
ISSN 2222-1700 (Paper) ISSN 2222-2855 (Online)
Vol.4, No.10, 2013
76
affected by a county’s wealth, dimensions difference, and firm fiscal distribution system. Therefore, when a
nation’s income is high, internal inequality is limited, nation’s wealth is strong, and fiscal territorial system is
progressive, then decentralization will not be continued since it endangers territorial cohesion (and, if any, will
improve regional inequality); meanwhile, low and middle income nations should take more careful steps since
the positive effect potential of political decentralization toward cohesion will be equally compensated by core
and rural regions’ capacity inequality to make the resources more decentralized, particularly by omitting
progressive fiscal territorial system.
Widhiyanto (2008) examined fiscal decentralization and regional income inequality in Indonesia in 1994-2006.
By considering economic convergence, it found empirical evidence that during 1994-2000 there was economic
inequality; meanwhile, during 2001-2004, there was no economic convergence. This finding resembles new
theories in fiscal decentralization. Sigma convergence will not take place since income per capita’s variance
coefficient is fluctuated during observation period. Meanwhile, local government fiscal decentralization policy
implementation faced higher variance coefficient of government’s income per capita. It is due to the regions
which have natural resources can take a benefit on it; whereas, those regions which are lack of natural resources
cannot. Other finding also proves that fiscal decentralization has negative effect on the income inequality among
regions per capita. It also supports new theories in fiscal decentralization as fiscal decentralization is mentioned
to be able to reduce regional income inequality.
Lessman (2006) observed the role of fiscal decentralization on regional inequality. The finding indicated that
countries with high decentralization level had relatively low regional inequality. It implied that inter-regions
distribution in decentralization was not risky but could reduce regional inequality. This result can only be
generalized in well-developed countries. Alternatively, decentralization in under-developed countries has
negative effect on regional equity. It is based on the assumption that developing countries have high corruption
rate, so that decentralization opens an opportunity for local government authority to exploit its population and
local public sector. Therefore, decentralization is much risky in under-developed countries. In transition
countries such as East Europe, decentralization can improve inequality among regions due to its historical and
organizational backgrounds that are totally different: in communist centralized fiscal, core agglomeration can
develop rapidly. The test result demonstrates that decentralization has positive effect on regional inequality, but
not significant. The conclusion is that decentralization improvement is not risky for convergence process; and,
competition among countries or regions can reduce regional inequality.
Akai and Sakata (2005) examined fiscal decentralization, commitment, and regional inequality. In conventional
approach, fiscal decentralization appeared to reduce redistribution power among regions since fiscal
decentralization worked in a set of commitments.
2.3. Research Conceptual Framework
Figure 1. Research Conceptual Framework
3. Method
3.1. Research Approach
This research utilizes positivist approach. According to Neuman (2006:82-83), positivist approach is a method
that is organized to combine deductive logic and empirical observation precisely on the individual or group
behavior to find the pattern and confirm the causal relationship that is usable to predict the general pattern of
human activities. Positivist approach not only analyzes the inter-dependent correlation and co-existence of
causality, but also is able to explain the condition that occurs in society (explanatory capability) as well as
predict things which are going to happen (predictive capability) related to fiscal decentralization, economic
growth, and regional inequality.
Journal of Economics and Sustainable Development www.iiste.org
ISSN 2222-1700 (Paper) ISSN 2222-2855 (Online)
Vol.4, No.10, 2013
77
3.2. Type and Source of the Data
The data type in this research is secondary data. Most of the secondary data is obtained from Indonesia
Statistic, Directorate General of Budget of Finance Ministry of Indonesia Republic, Ministry of Development
Acceleration, and other relevant institutions as well as internet websites. Those collected data include APBD’s
(Local Government Revenue and Expenditure) data consisting of Regional Income (Dana Alokasi
Umum/General Allocation Fund, Dana Alokasi Khusus/Special Allocation Fund, Dana Bagi Hasil/ Revenue
Sharing Fund, and Pendapatan Asli Daerah/ Fiscal Autonomy) and Local Expenditure, PDRB (Produk Domestik
Regional Bruto/ Regional Gross Domestic Product), economic growth of provinces, RGDP development rate,
income per capita growth of provinces, population members who are 15 – 18 years old that have graduated from
the middle schools level (Senior and Junior High Schools levels), population growth and number, level of open-
unemployment, and domestic investment in GDP value, and other supporting data for this research. The data is
collected from 2001-2010. The data is expected to be able to explain the consequences of fiscal decentralization
implementation in Eastern Region of Indonesia.
3.3. Definition and Measurement of Variables
Definition and measurement of variables are intended to explain the observed variables. In other words,
variable definition is the guidance on how to measure a variable.
Table 1. Definition and Measurement of Variables
Num. Variable Variable Measurement
1 Regional Inequality (RI) Regional Gross Domestic Product inequality on the constant price
among regencies/cities in a province by using Williamson’s Index
method
2 Regional Economic
Growth (REG)
Regional Gross Domestic Product’s growth percentage on the
constant price year by year
3 Population (POP) Population growth of in a province (%)
4 Education Level (EPR) Education Participation Rate (%)
5 Unemployment (OUR) Open-Unemployment Rate (%)
6 Investment Rate (IR) Ratio between Investment and province’s Regional Gross Domestic
Product
7 Fiscal Decentralization
(FD)
Ratio between Balance Fund (General Allocation Fund, Revenue
Sharing Fund, and Special Allocation Fund) and Total Local
Expenditure.
4. Data Analysis
Data analysis in this research is aimed to test the hypothesis as the answers of the research problems. Since the
data is time series and cross-section, data analysis method uses panel data analysis. Panel data or pooled data is
the combination between time series and cross-section data. By accommodating cross-section and time series
variables, pooled data is able to derive omitted-variables since this model ignores relevant variables. Besides, it
can overcome inter-correlation among independent variables that may cause bias interpretation of the regression
analysis (Nachrowi and Usman, 2006).
In econometrics estimation model, there are three techniques. First, it is Pool Least Square (PLS) which uses
Ordinary Least Square (OLS) method to estimate. This technique combines or pools all of the time series and
cross-section data. Second, it is Fixed Effect Model (FEM). This approach is a technique that considers dummy
variables since there is a possibility of omitted variable problem to occur which causes intercept time series and
cross-section change. Third, it is Random Effect Model (REM) which emphasizes on the efficiency refinement
of the least square process by considering the error of cross-section and time series. Random Effect Model is the
development of Generalized Least Square (GLS) estimation. In general, the econometrics model is as follow:
RI = + + + + + + +
5. Result and Discussion
5.1. Result
5.1.1. Analysis Model Test
Since this research uses panel data analysis model, it needs to test the analysis model. The model analysis result
that uses three estimation techniques on the panel data in all of the provinces of Eastern Region of Indonesia is
presented below:
Journal of Economics and Sustainable Development www.iiste.org
ISSN 2222-1700 (Paper) ISSN 2222-2855 (Online)
Vol.4, No.10, 2013
78
Table 2
Model Analysis Test Result of Regional InequalityIn Eastern Region of Indonesia
PLS FEM REM
Variable
C 0.016465
(0,0833225)
0.305752
(6,506668)*
0.258325
(2,764997)**
FD -0.218881
(-2,014145**
-0.024790
(-1,031194)
-0.152882
(-1,113730)
REG 0.298737
(3,773490)*
0.105400
(3,297621)*
0.085054
(0,894670)
(REG)2
-0.028310
(-3,594958)*
-0.013859
(-3,091973)*
-0.008796
(-0,694921)
POP -0.257311
(-1,437456)
-0.086870
(-1,142304)
-0.291536
(-1,396029)
EPR -0.000310
(-0,531005)
0.001903
(5,882753)*
0.001697
(1,135335)
OUR 0.006862
(3,023653)*
-0.000471
(-1,127092)
0.000374
(0,089051)
IR -0.465728
(-5,696581)*
-0.139412
(-5,905636)*
0.264210
(1,302136)
Adj R2
0.409899 0.937922*** 0.040979
DW 0.521332 1.207855**** 1.193339
Hausman test (FEM vs REM) - 0.5896 0.5896****
F-test (PLS vs FEM) 8,087293 8,087293**** -
Description:
* Significant with α = 1%
** Significant with α = 5%
*** the best model based on determinant coefficient indicator
**** the best model based on Durbin-Watson indicator
***** the best model based on Hausman’s Specification Test
****** the best model based on F-test Specification Model (F-table 99% = 2.41)
Based on the Table 2 above, it reveals some information. First, observed from the variable’s coefficient
perspective, PLS and FEM techniques are better than REM technique when in REM all of the variable’s
coefficients are not significant unless for intercept variable. Second, though based on the Hausman’s
specification test, it recommends that REM is more consistent and more efficient based on null hypothesis, the
score of determinant coefficient (R2
) and Durbin-Watson coefficient are not better than FEM technique. It
implies that REM can be ignored in further analysis on the regional inequality. Third, the result from F-test
through PLS and FEM is quite robust. It is proven by the F-test score that is quite far beyond the limit of the F-
table. The F-value is 8.09, while the F table with numerator (N1) 10 and denominator 153, at 99% level of
confidence shows 2.41. Also, the other indicator that can be used is adjusted R2
and Durbin-Watson values which
are statistically indicate better and more efficient FEM technique to be considered in analyzing the consequences
of fiscal decentralization on regional inequality in Eastern Region of Indonesia.
5.1.2. Estimation Result
Here is the estimation result of the fiscal decentralization’s consequences toward regional inequality in Eastern
Region of Indonesia. Table 3 below displays estimation result using Fixed Effect Model (FEM) in panel for 160
observations in Easter Region of Indonesia.
Journal of Economics and Sustainable Development www.iiste.org
ISSN 2222-1700 (Paper) ISSN 2222-2855 (Online)
Vol.4, No.10, 2013
79
Table 3
Estimation Result of Fiscal Decentralization and Regional Inequality
Variable Coefficient Std. Error t-Statistic Prob
C 0.305752 0.046991 6.506668 0.0000
FD -0.024790 0.024040 -1.031194 0.3043
REG
(REG)2
0.105400
-0.013859
0.031962
0.004482
3.297621
-3.091973
0.0012
0.0024
POP -0.086870 0.076048 -1.142304 0.2553
EPR 0.001903 0.000324 5.882753 0.0000
OUR -0.000471 0.000418 -1.127092 0.2617
IR -0.139412 0.023607 -5.905636 0.0000
Weighted Statistic
Adjusted R-squared 0,937922
F-statistic 110,1950
Prob(F-statistic) 0,000000
DW 1,207855
In general, based on the information presented in Table 3 above, it can be confirmed that there are some points
of fiscal decentralization’s consequences toward regional inequality in Eastern Region of Indonesia. First, by
using FEM technique on 160 observations, it obtains determinant coefficient (adjusted R2
) of 0.9379. It means
that fiscal decentralization (DF), economic growth (REG), population growth (POP), education participation rate
(EPR), open-unemployment rate (OUR), and investment rate (IR) variables are able to explain regional
inequality (RD) coefficient as much as 93.79 percent; whereas, the rest 6.21 percent is explained by other
variables other than variables in the equation model of this research. The ability of the independent variable is
also confirmed by F-statistic which scores 110.20 at the probability of F-statistic in 99 percent level of
confidence (α=1%). Second, based on t-statistic test to detect the relationship among variables demonstrates that
regional economic growth (REG) and investment rate (IR) variables have quite significant effect which is able to
reduce regional inequality. Education participation rate (EPR) number is positive significant to improve regional
inequality. On the other hand, fiscal decentralization (FD) population growth (POP), and open-unemployment
rate (OUR) are not quite strong to reduce regional inequality (RI). Third, as perceived from Fixed Effect Model,
Cross-Section, which describes regional inequality condition of each province in Easter Region of Indonesia, is
negative; unless, it is for West Nusa Tenggara and East Kalimantan provinces that get positive result.
5.2. Discussion
5.2.1. Fiscal Decentralization and Regional Inequality
Based on the result, it confirms that fiscal decentralization’s coefficient is negative 0.024790. It implies that
when the transferred fund allocation of Local Government Revenue and Income (APBD) decreases, it improves
regional inequality for 0.024790 or 0.02 percent. Conversely, if the transferred fund allocation increases, it
reduces regional inequality. Even fiscal decentralization is able reduce regional inequality, the relationship
between the two variables is not significant.
Journal of Economics and Sustainable Development
ISSN 2222-1700 (Paper) ISSN 2222-2855 (Online)
Vol.4, No.10, 2013
The Relationship between Fiscal Decentralization and Regional
Fig. 2 above displays the relationship between fiscal decentralization and regional
by using Williamson’s Index. The relationship between the two variables is not consistent. In 20
decentralization fund tended to decrease, it resulted in increasing regional
decentralization fund increased; yet, regional
decentralization fund tended to decrease; whereas, regional
increase. It implies that local government must be sensitive and give more attention on this indication. Therefore,
though the improvement percentage is relatively smal
development sustainability.
The cause of the weak relationship between fiscal decentralization and regional
First, decentralization fund allocation is not yet abl
is quite small. Second, local government expenditure allocation is not precisely on the target that causes
inefficiency in managing expenditure budget of the local government as most of the a
expenditure for government officer and capital expenditure. For instance, capital expenditure was expected to be
able to finance productive economic activities; yet, it was more to finance less
activities. It resembles Canaleta’s et.al.
regional inequality. Third, administration system and economic institution do not provide sufficient support and
are not well-managed; thus, it hinders
5.2.2. The Relationship between Control Variable and Regional
5.2.2.1 Economic Growth and Regional
Referring to Kuznets’ view that on the initial stage of development (short term development), it cause
however, after some processes in long term (to particular point) it will reduce the
the inverted-U hypothesis model of Kuznets, there are two stages of economic development process to achieve
nation prosperity and wealth.
5.2.2.1.1. Economic Growth and Income Per Capita
Based on the research result by using the first model, it confirms that the coefficient of regional economic
growth (REG) is positive 0.105400 and significant at 99% (α=1%) level of con
that it the regional economic growth increases, it causes an increase on regional discrepancy for 0.105400 or
0.11 percent.
0.00
0.20
0.40
0.60
0.80
1.00
1.20
2001 2002
Journal of Economics and Sustainable Development
2855 (Online)
80
Figure 2
The Relationship between Fiscal Decentralization and Regional Inequa
Source: Indonesia Statistic, 2001-2010
Fig. 2 above displays the relationship between fiscal decentralization and regional inequality
by using Williamson’s Index. The relationship between the two variables is not consistent. In 20
decentralization fund tended to decrease, it resulted in increasing regional inequality
decentralization fund increased; yet, regional inequality continued to improve. Next, in 2006
ded to decrease; whereas, regional inequality was relatively stable though it tended to
increase. It implies that local government must be sensitive and give more attention on this indication. Therefore,
though the improvement percentage is relatively small, it brings quite huge contribution on the local autonomy
The cause of the weak relationship between fiscal decentralization and regional inequality
First, decentralization fund allocation is not yet able to meet the basic needs of local’s basic fiscal needs since it
is quite small. Second, local government expenditure allocation is not precisely on the target that causes
inefficiency in managing expenditure budget of the local government as most of the a
expenditure for government officer and capital expenditure. For instance, capital expenditure was expected to be
able to finance productive economic activities; yet, it was more to finance less-productive and consumptive
et.al. (2004) view as public sector measurement has positive relationship with
. Third, administration system and economic institution do not provide sufficient support and
managed; thus, it hinders the society in conducting economic activities.
The Relationship between Control Variable and Regional Inequality
Economic Growth and Regional Inequality
Referring to Kuznets’ view that on the initial stage of development (short term development), it cause
however, after some processes in long term (to particular point) it will reduce the inequality
U hypothesis model of Kuznets, there are two stages of economic development process to achieve
Economic Growth and Income Per Capita Inequality Increase
Based on the research result by using the first model, it confirms that the coefficient of regional economic
growth (REG) is positive 0.105400 and significant at 99% (α=1%) level of confidence. This coefficient implies
that it the regional economic growth increases, it causes an increase on regional discrepancy for 0.105400 or
2003 2004 2005 2006 2007 2008 2009 2010
www.iiste.org
Inequality
inequality which is measured
by using Williamson’s Index. The relationship between the two variables is not consistent. In 2001-2003, when
inequality. In 2004-2005, fiscal
continued to improve. Next, in 2006-2010, fiscal
was relatively stable though it tended to
increase. It implies that local government must be sensitive and give more attention on this indication. Therefore,
l, it brings quite huge contribution on the local autonomy
inequality is due to some factors.
e to meet the basic needs of local’s basic fiscal needs since it
is quite small. Second, local government expenditure allocation is not precisely on the target that causes
mount is distributed to
expenditure for government officer and capital expenditure. For instance, capital expenditure was expected to be
productive and consumptive
(2004) view as public sector measurement has positive relationship with
. Third, administration system and economic institution do not provide sufficient support and
Referring to Kuznets’ view that on the initial stage of development (short term development), it causes inequality;
inequality. It indicates that in
U hypothesis model of Kuznets, there are two stages of economic development process to achieve
Based on the research result by using the first model, it confirms that the coefficient of regional economic
fidence. This coefficient implies
that it the regional economic growth increases, it causes an increase on regional discrepancy for 0.105400 or
RI
FD
Journal of Economics and Sustainable Development
ISSN 2222-1700 (Paper) ISSN 2222-2855 (Online)
Vol.4, No.10, 2013
Williamson’s Index and Regional Gross Domestic Product Per Capita
Figure 3 above presents that when the Regional Gross Domestic Product (RGDP) per Capita increases, it is
followed by an increase on the Williamson’s Index of
decreases, it reduces the Williamson’s Index as well. It means that the economic growth that was expected to be
able to reduce regional inequality in Eastern Region of Indonesia cannot be achieved during initial period.
5.2.2.1.2. Economic Growth and Income pe
By utilizing the second model, it can explain the Kuznets’ phenomenon. It confirmed by the coefficient score
which shows -0.013859 and significant at probability level less than 5%. The negative sign but significant
indicate that Kuznets’ hypothesis is confirmed. At first, economic growth made the
after coming at particular point, economic growth reduced the
Based on the two analysis models above, to combine the two models based on the Tab
of X1= X3= X4= X5= X6= 0, it arrives to the following equation:
RI = 0.3058 + 0.1054X2 – 0.0139
Williamson’s Index Curve and Regional Gross Domestic Product Per Capita
Figure 4 confirms that the relationship bet
Region of Indonesia has inverted-U shape. During the initial stage of development, regional
by Williamsons’ Index continued to improve when the RGDP also increased. However, when
particular extreme point, regional inequality
growth.
The process to arrive at sustainable development stage can decrease regional
known as structural transformation development theory. According to Lewis’ development model, sustainable
growth process which from the modern sector expansion as well the development and advancement from
traditional sector to modern sector of economic. The expan
from the investment on education sector; therefore education sector increases. However, since the modern sector
requires skillful labors, the investment return on education sector decreases due to the in
educated labors and decreasing supply on uneducated
consistent with the inverted-U hypothesis as the development process in Eastern Region of Indonesia also
follows the development stage as reflected on the inverted
This finding is also in accordance with Ardani’s finding (1996, 1992; in Kuncoro, 2003) which analyzed the
-0.50
0.00
0.50
1.00
1.50
2.00
2.50
2001 2002
0.00
0.10
0.20
0.30
0.40
0.50
0.60
1 2
WILLIAMSONINDEX
Journal of Economics and Sustainable Development
2855 (Online)
81
Figure 3
Williamson’s Index and Regional Gross Domestic Product Per Capita in Eastern Region of
Source: Indonesia Statistic, 2001-2010
Figure 3 above presents that when the Regional Gross Domestic Product (RGDP) per Capita increases, it is
followed by an increase on the Williamson’s Index of inequality (WI); conversely, when the RGDP per
decreases, it reduces the Williamson’s Index as well. It means that the economic growth that was expected to be
in Eastern Region of Indonesia cannot be achieved during initial period.
Economic Growth and Income per Capita Inequality Decrease
By utilizing the second model, it can explain the Kuznets’ phenomenon. It confirmed by the coefficient score
0.013859 and significant at probability level less than 5%. The negative sign but significant
at Kuznets’ hypothesis is confirmed. At first, economic growth made the inequality
after coming at particular point, economic growth reduced the inequality.
Based on the two analysis models above, to combine the two models based on the Table 3 with the assumption
= 0, it arrives to the following equation:
Figure 4
Williamson’s Index Curve and Regional Gross Domestic Product Per Capita
Figure 4 confirms that the relationship between economic growth and Williamson’s Index in the Eastern
U shape. During the initial stage of development, regional
by Williamsons’ Index continued to improve when the RGDP also increased. However, when
inequality started to decrease that was followed by the increase on the RGDP
The process to arrive at sustainable development stage can decrease regional inequality. In Lewis’ theory, it is
s structural transformation development theory. According to Lewis’ development model, sustainable
growth process which from the modern sector expansion as well the development and advancement from
traditional sector to modern sector of economic. The expansion from traditional sector to modern sector starts
from the investment on education sector; therefore education sector increases. However, since the modern sector
requires skillful labors, the investment return on education sector decreases due to the in
educated labors and decreasing supply on uneducated-labors. Therefore, basically, the result of this research is
U hypothesis as the development process in Eastern Region of Indonesia also
elopment stage as reflected on the inverted-U figure.
This finding is also in accordance with Ardani’s finding (1996, 1992; in Kuncoro, 2003) which analyzed the
2003 2004 2005 2006 2007 2008 2009 2010
0.51
3 4 5 6 7 8 9
GDP PER CAPITA (%)
www.iiste.org
in Eastern Region of Indonesia
Figure 3 above presents that when the Regional Gross Domestic Product (RGDP) per Capita increases, it is
(WI); conversely, when the RGDP per capita
decreases, it reduces the Williamson’s Index as well. It means that the economic growth that was expected to be
in Eastern Region of Indonesia cannot be achieved during initial period.
By utilizing the second model, it can explain the Kuznets’ phenomenon. It confirmed by the coefficient score
0.013859 and significant at probability level less than 5%. The negative sign but significant
inequality got worst; yet,
le 3 with the assumption
Williamson’s Index Curve and Regional Gross Domestic Product Per Capita
ween economic growth and Williamson’s Index in the Eastern
U shape. During the initial stage of development, regional inequality showed
by Williamsons’ Index continued to improve when the RGDP also increased. However, when it came to the
started to decrease that was followed by the increase on the RGDP
. In Lewis’ theory, it is
s structural transformation development theory. According to Lewis’ development model, sustainable
growth process which from the modern sector expansion as well the development and advancement from
sion from traditional sector to modern sector starts
from the investment on education sector; therefore education sector increases. However, since the modern sector
requires skillful labors, the investment return on education sector decreases due to the increasing supply of the
labors. Therefore, basically, the result of this research is
U hypothesis as the development process in Eastern Region of Indonesia also
This finding is also in accordance with Ardani’s finding (1996, 1992; in Kuncoro, 2003) which analyzed the
WI
REG
10
Journal of Economics and Sustainable Development
ISSN 2222-1700 (Paper) ISSN 2222-2855 (Online)
Vol.4, No.10, 2013
economic growth and regional inequality
1983 – 1993. The conclusion supports Williamson’s hypothesis (1965) which refers to Kuznets’ hypothesis
which mentions that during the initial stage of economic development, it occurs disparities among several
regions; yet, as the economic develo
narrower. Furthermore, the study conducted by Sutarno and Kuncoro (2007) in Banyumas Regency during 1993
2000 using Williamson’s Index resembles Inverted
stage, the inequality gets worst; however, for the next stages, the
there occurs another inequality which in turn will reduce again.
5.3. Population Growth and Regional
The result confirms that population growth has negative effect toward regional
coefficient of population growth which shows negative 0.0086870. The coefficient implies that when the
population decreases, it will improve regiona
population increases, it reduces the inequality
The number of population in the Eastern Region of Indonesia until 2010 is 35,550,800 million. Compared to the
land area of 14,000 km2
, Eastern Region of Indonesia is categorized in to a region which has relatively small
number of population; therefore, it affects the advancement or the development of regional economic that cause
inter-regions inequality.
This research result has proven that
However, this conclusion cannot be taken as the basic consideration since in the test of significance, the
relationship is not significant at 5% of α. Population, other than its quantit
quality related to the education level or skill. This causes non significant relationship.
5.4. Education Participation and Regional
The research result confirms that education participation has positive effect tha
inequality. It is verified by the coefficient of education participation which shows positive 0.001903 and
significant at α=1%. The coefficient of education participation implies that when the education participation
increases, it will cause on the regional
decreases, it reduces regional inequality
Education Participation Rate and Regional
in Eastern Region of Indonesia, 2001
Figure 5 presents positive relationship between education participation and regional
the education participation is higher, it results in higher regional
between the two variables can be negative, since at particular period, the education participation is able to reduce
regional inequality (for instance, in 2004 until 2010) that is indicated from the distance between education
participation’s graph gets wider from the regional
with the possessed education level, it can reduce regional
condition highly depends on the local or provincial gove
5.5. Open-Unemployment and Regional
The result of this research confirms that unemployment rate has negative effect on the development
implementation since it can cause regional
which is – 0.00471. This coefficient implies that when the open
followed be regional inequality reduction for 0.000471 or 0.005 percent.
The value of open-unemployment’s coefficient which shows
unemployment problem is not the main factor that can make worst economic condition in Eastern Region of
Indonesia because it does break the tolerable limit defined by the local government. However, the government
should monitor and control the rate of the open
30.00
35.00
40.00
45.00
50.00
55.00
60.00
2001 2002
Journal of Economics and Sustainable Development
2855 (Online)
82
inequality in Indonesia by using Williamson’s Index during 1968
1993. The conclusion supports Williamson’s hypothesis (1965) which refers to Kuznets’ hypothesis
which mentions that during the initial stage of economic development, it occurs disparities among several
regions; yet, as the economic development gets more and more advanced, the inequality
narrower. Furthermore, the study conducted by Sutarno and Kuncoro (2007) in Banyumas Regency during 1993
2000 using Williamson’s Index resembles Inverted-U of Kuznets’ hypothesis. The study finds that during initial
gets worst; however, for the next stages, the inequality decreases and in particular time,
which in turn will reduce again.
Population Growth and Regional Inequality
result confirms that population growth has negative effect toward regional inequality
coefficient of population growth which shows negative 0.0086870. The coefficient implies that when the
population decreases, it will improve regional inequality for 0.0086870 or 0.01 percent. On the other hand, it the
inequality.
The number of population in the Eastern Region of Indonesia until 2010 is 35,550,800 million. Compared to the
stern Region of Indonesia is categorized in to a region which has relatively small
number of population; therefore, it affects the advancement or the development of regional economic that cause
This research result has proven that population growth has negative relationship with regional
However, this conclusion cannot be taken as the basic consideration since in the test of significance, the
relationship is not significant at 5% of α. Population, other than its quantity, is also perceived more from its
quality related to the education level or skill. This causes non significant relationship.
Education Participation and Regional Inequality
The research result confirms that education participation has positive effect that is able to improve regional
. It is verified by the coefficient of education participation which shows positive 0.001903 and
significant at α=1%. The coefficient of education participation implies that when the education participation
, it will cause on the regional inequality improvement. On the other hand, it the education participation
inequality.
Figure 5
Education Participation Rate and Regional Inequality
in Eastern Region of Indonesia, 2001-2010
Source: Indonesia Statistic, 2001-2010
Figure 5 presents positive relationship between education participation and regional inequality
the education participation is higher, it results in higher regional inequality. Nevertheless, the relat
between the two variables can be negative, since at particular period, the education participation is able to reduce
(for instance, in 2004 until 2010) that is indicated from the distance between education
gets wider from the regional inequality’s graph. It means that in particular period of time,
with the possessed education level, it can reduce regional inequality in Eastern Region of Indonesia. This
condition highly depends on the local or provincial government’s policy.
Unemployment and Regional Inequality
The result of this research confirms that unemployment rate has negative effect on the development
implementation since it can cause regional inequality. It is showed by the coefficient of unemploy
0.00471. This coefficient implies that when the open-unemployment rate decreases, it will be
reduction for 0.000471 or 0.005 percent.
unemployment’s coefficient which shows -0.005 percent is relatively low. It indicates that
unemployment problem is not the main factor that can make worst economic condition in Eastern Region of
Indonesia because it does break the tolerable limit defined by the local government. However, the government
uld monitor and control the rate of the open-unemployment because it can be the source of severe fault on the
2003 2004 2005 2006 2007 2008 2009 2010
www.iiste.org
in Indonesia by using Williamson’s Index during 1968 – 1983 and
1993. The conclusion supports Williamson’s hypothesis (1965) which refers to Kuznets’ hypothesis
which mentions that during the initial stage of economic development, it occurs disparities among several
inequality will get narrower and
narrower. Furthermore, the study conducted by Sutarno and Kuncoro (2007) in Banyumas Regency during 1993-
study finds that during initial
decreases and in particular time,
inequality. It is proven by the
coefficient of population growth which shows negative 0.0086870. The coefficient implies that when the
for 0.0086870 or 0.01 percent. On the other hand, it the
The number of population in the Eastern Region of Indonesia until 2010 is 35,550,800 million. Compared to the
stern Region of Indonesia is categorized in to a region which has relatively small
number of population; therefore, it affects the advancement or the development of regional economic that cause
population growth has negative relationship with regional inequality.
However, this conclusion cannot be taken as the basic consideration since in the test of significance, the
y, is also perceived more from its
t is able to improve regional
. It is verified by the coefficient of education participation which shows positive 0.001903 and
significant at α=1%. The coefficient of education participation implies that when the education participation
improvement. On the other hand, it the education participation
inequality. It means that as
. Nevertheless, the relationship
between the two variables can be negative, since at particular period, the education participation is able to reduce
(for instance, in 2004 until 2010) that is indicated from the distance between education
’s graph. It means that in particular period of time,
in Eastern Region of Indonesia. This
The result of this research confirms that unemployment rate has negative effect on the development
. It is showed by the coefficient of unemployment rate
unemployment rate decreases, it will be
nt is relatively low. It indicates that
unemployment problem is not the main factor that can make worst economic condition in Eastern Region of
Indonesia because it does break the tolerable limit defined by the local government. However, the government
unemployment because it can be the source of severe fault on the
EPR
RI
Journal of Economics and Sustainable Development www.iiste.org
ISSN 2222-1700 (Paper) ISSN 2222-2855 (Online)
Vol.4, No.10, 2013
83
development to be worst in the Eastern Region of Indonesia. This is also confirmed by its probability level which
is not significant at α = 5%.
5.6. Investment Rate and Regional Inequality
Based on research result related to the relationship between investment rate and regional inequality, it shows that
investment rate negatively affects regional inequality. This finding is confirmed by the coefficient of investment
rate which is -0.139412 and significant at probability level of α=1%. The value implies that when the investment
rate decreases, it improves regional inequality for 0.1393412 or 0.14 percent. On the contrary, if the investment
rate increases, it reduces regional inequality as much as the coefficient value.
Though the relationship between the two variables is negative significant, its role in regional inequality reduction
is relatively low just like displayed in its coefficient. Low investment rate is affected by several factors. The first
is interest rate; interest rate is an important factor that can stimulate investment since most of investment is
financed through bank loan. If the interest rate is high, it reduces investor’s intention to borrow capital from bank.
The second is the low income per capita as the reflection of the society’s purchase power. The third is the
condition of facilities and infrastructures that provide less support on investment activities. Fourth, the
bureaucracy of approval system burdens the investor since it is too long and complicated. Fifth, the low human
resource in accessing technology development related to investment matters and interests. The sixth is unstable
political and security condition that much affect the investor in making investment decision.
6. Conclusion and Suggestion
6.1. Conclusion
Based on the research result, it concludes that:
1. Fiscal decentralization is not able to reduce regional inequality in Eastern Region of Indonesia due to the
allocation of local government’s budget mostly is not dedicated to public service matters but for
governmental matters such as: salary, official travel, and office appliances/supplies.
2. Related to the utilization of control variable: first, population growth and open-unemployment rate does
have an effect on improving regional inequality; second, economic growth, education participation, and
investment rate are able to reduce regional inequality.
3. The occurrence of economic patter’s change in Eastern Region of Indonesia from traditional pattern to
modern pattern is reflected on the Kuznets’ Inverted-U hypothesis confirmation.
4. Fiscal decentralization policy has run in about ten years; however, the effort to achieve independent local
government is not yet on the expected target.
6.2. Suggestion
1. It needs efficient local budget and income management that meet good governance values. It means that
budget allocation intended to finance local development activities should consider priority scale which
truly has implication on the refinement and improvement of society’s wealth.
2. To encourage economic growth and reduce regional inequality, government needs to promote
development acceleration in strategic regions which have potential to develop in advance by arranging
partnership opportunity with private sectors to that it will be able to develop the disadvantaged regions.
REFERENCES
Akai, Nobuo. dan Sakata, M., 2005. Fiscal Decentralization Commitment and Regional Inequality Evidence
from State-Level Cross Section Data for the U.S., Faculty of Economic University of Tokyo.
Bonet, Jaeme, 2006. Fiscal Decentralization and Regional Income Disparities: Evidence from the Colombian
Experience, JEL Classification H77, O18, R11, R58
Canaleta, C. Gil, Pedro Pascual A and Manuel R. G. 2004. Regional Economic Disparities and Decentralization.
Urban Studies, Vol. 41, No. 1, 71-94
Kim, Euijune, Sung Woong Hong, Soo Jung Ha. 2003. Impacts of national development and decentralization
policies on regional income disparity in Korea. The Annals Regional Science (2003) 37:79–91
Kuncoro, Mudrajad. 2003. Ekonomi Pembangunan: Teori, Masalah, dan Kebijakan. Edisi Ketiga. Penerbit
UUP AMP YKPN, Yoyakarta.
Lessmann, Christian, 2006. Fiscal Decentralization and Regional Disparity: A Panel Data Approach for OECD
Countries. CESifo Working Paper No. 25, JEL Code: H72, H77, R11, R50.
Neuman, W. Lawrence. 2006. Social Research Methods: Qualitative and Quantitative Approaches. Sixth Edition,
Pearson International Edition,USA
Nachrowi, Nachrowi D and Hardius Usman, 2006. Popular and practical approach to Econometrics: financial
and Economic Analysis, the Agency Publisher of Faculty of Economics, University of Indonesia,
Jakarta
Oates, Wallace E., 1993. Fiscal Decentralization and Economic Development. National Tax Journal, LXVI (2):
Journal of Economics and Sustainable Development www.iiste.org
ISSN 2222-1700 (Paper) ISSN 2222-2855 (Online)
Vol.4, No.10, 2013
84
237-34
Oates, Wallace E., 1999. An Essy on Fiscal Federalism, Journal of Economic Literature, Vol. 37. No. 3. Pp,
1120 - 1149
Rodden, J. 2002. The dilemma of fiscal federalism: Grants and fiscal performances around the world. American
Journal of Political Science. 46(3): 670–687
Rodríguez-Pose, Andrés and Anne Krøijer, 2009. Fiscal Decentralization and Economic Growth in Central and
Eastern Europe. Growth and Change, Vol. 40 No. 3, pp. 387–417
Shah, A. 1997. Fiscal Federalism and Macroeconomic Governance: For Better or for Worse. The World Bank,
Washington, District of Columbia
Shankar, Radja and Anwar Shah. 2003. Bridging the Economic Divide Within Countries: A Scorecard on the
Performance of Regional Policies in Reducing Regional Income Disparities, World Development. Vol.
31, No. 8, pp. 1421–1441
Tanzi, Vito. 2005. The Economic Role Of The State In The 21st Century. Cato Journal. Vol. 25, No. 3.
Copyright © Cato Institute. All rights reserved.
White, R and P Smoke. 2005. East Asia Decentralizes. In East Asia Decentralizes, P Smoke and R White (eds),
Washington DC: World Bank.
Widyanto, Iman. 2008. Fiscal Decentralization and Indonesia Regional Income Disparity (1994-2004). Jurnal
Keuangan Publik. Vol. 5 No. 1 Hal. 19-53
This academic article was published by The International Institute for Science,
Technology and Education (IISTE). The IISTE is a pioneer in the Open Access
Publishing service based in the U.S. and Europe. The aim of the institute is
Accelerating Global Knowledge Sharing.
More information about the publisher can be found in the IISTE’s homepage:
http://www.iiste.org
CALL FOR PAPERS
The IISTE is currently hosting more than 30 peer-reviewed academic journals and
collaborating with academic institutions around the world. There’s no deadline for
submission. Prospective authors of IISTE journals can find the submission
instruction on the following page: http://www.iiste.org/Journals/
The IISTE editorial team promises to the review and publish all the qualified
submissions in a fast manner. All the journals articles are available online to the
readers all over the world without financial, legal, or technical barriers other than
those inseparable from gaining access to the internet itself. Printed version of the
journals is also available upon request of readers and authors.
IISTE Knowledge Sharing Partners
EBSCO, Index Copernicus, Ulrich's Periodicals Directory, JournalTOCS, PKP Open
Archives Harvester, Bielefeld Academic Search Engine, Elektronische
Zeitschriftenbibliothek EZB, Open J-Gate, OCLC WorldCat, Universe Digtial
Library , NewJour, Google Scholar

More Related Content

What's hot

Remittance levels and entrepreneurial activity in post soviet countries
Remittance levels and entrepreneurial activity in post soviet countriesRemittance levels and entrepreneurial activity in post soviet countries
Remittance levels and entrepreneurial activity in post soviet countriesAzer Dilanchiev
 
Information Sources for Policymakers: Congressional Budget Office 101
Information Sources for Policymakers: Congressional Budget Office 101Information Sources for Policymakers: Congressional Budget Office 101
Information Sources for Policymakers: Congressional Budget Office 101Congressional Budget Office
 
the-influence-of-reference-group-contributions-on-a-familys-charitable-giving
the-influence-of-reference-group-contributions-on-a-familys-charitable-givingthe-influence-of-reference-group-contributions-on-a-familys-charitable-giving
the-influence-of-reference-group-contributions-on-a-familys-charitable-givingKeegan Skeate
 
Governance and economic performance
Governance and economic performanceGovernance and economic performance
Governance and economic performanceOECD Governance
 
National Debt and How to Deal With It
National Debt and How to Deal With ItNational Debt and How to Deal With It
National Debt and How to Deal With ItLuke Rzepiennik
 
Decentralized tax system and public expenditures in rwanda
Decentralized tax system and public expenditures in rwandaDecentralized tax system and public expenditures in rwanda
Decentralized tax system and public expenditures in rwandaTheogene Habimana
 
American Express Credit Corp.2007
American Express Credit Corp.2007American Express Credit Corp.2007
American Express Credit Corp.2007finance8
 
Aid and taxation in ethiopia
Aid and taxation in ethiopiaAid and taxation in ethiopia
Aid and taxation in ethiopiaalemneh
 
2012 Rebalancing England: Sub-National Development (Once Again) at the Crossr...
2012 Rebalancing England: Sub-National Development (Once Again) at the Crossr...2012 Rebalancing England: Sub-National Development (Once Again) at the Crossr...
2012 Rebalancing England: Sub-National Development (Once Again) at the Crossr...Lee Pugalis
 
Policy paper DDLG 2016 english
Policy paper DDLG 2016 englishPolicy paper DDLG 2016 english
Policy paper DDLG 2016 englishAntoine Rerolle
 
URSP Poster- Orshi Buzas
URSP Poster- Orshi BuzasURSP Poster- Orshi Buzas
URSP Poster- Orshi BuzasOrsolya Buzas
 
Mobilizing Local Government Tax Revenue for Adequate Service Delivery in Nige...
Mobilizing Local Government Tax Revenue for Adequate Service Delivery in Nige...Mobilizing Local Government Tax Revenue for Adequate Service Delivery in Nige...
Mobilizing Local Government Tax Revenue for Adequate Service Delivery in Nige...Oghenovo Egbegbedia
 
Independent oversight bodies lessons from fiscal productivity and regulatory ...
Independent oversight bodies lessons from fiscal productivity and regulatory ...Independent oversight bodies lessons from fiscal productivity and regulatory ...
Independent oversight bodies lessons from fiscal productivity and regulatory ...OECDtax
 
Microsoft Word Stabilizingtransfers2 6 02 Rosenblatt
Microsoft Word   Stabilizingtransfers2 6 02 RosenblattMicrosoft Word   Stabilizingtransfers2 6 02 Rosenblatt
Microsoft Word Stabilizingtransfers2 6 02 RosenblattG Garcia
 
Growth-Debt Nexus: An Examination of Public Debt Levelsand Debt Crisis in Zim...
Growth-Debt Nexus: An Examination of Public Debt Levelsand Debt Crisis in Zim...Growth-Debt Nexus: An Examination of Public Debt Levelsand Debt Crisis in Zim...
Growth-Debt Nexus: An Examination of Public Debt Levelsand Debt Crisis in Zim...iosrjce
 
Fiscal decentralization and subnational revenue experience of the emerging re...
Fiscal decentralization and subnational revenue experience of the emerging re...Fiscal decentralization and subnational revenue experience of the emerging re...
Fiscal decentralization and subnational revenue experience of the emerging re...Alexander Decker
 
Bass cognitive dissonance
Bass cognitive dissonanceBass cognitive dissonance
Bass cognitive dissonanceFrank Ragol
 

What's hot (20)

City Fiscal Conditions in 2013
City Fiscal Conditions in 2013City Fiscal Conditions in 2013
City Fiscal Conditions in 2013
 
Remittance levels and entrepreneurial activity in post soviet countries
Remittance levels and entrepreneurial activity in post soviet countriesRemittance levels and entrepreneurial activity in post soviet countries
Remittance levels and entrepreneurial activity in post soviet countries
 
Information Sources for Policymakers: Congressional Budget Office 101
Information Sources for Policymakers: Congressional Budget Office 101Information Sources for Policymakers: Congressional Budget Office 101
Information Sources for Policymakers: Congressional Budget Office 101
 
the-influence-of-reference-group-contributions-on-a-familys-charitable-giving
the-influence-of-reference-group-contributions-on-a-familys-charitable-givingthe-influence-of-reference-group-contributions-on-a-familys-charitable-giving
the-influence-of-reference-group-contributions-on-a-familys-charitable-giving
 
Governance and economic performance
Governance and economic performanceGovernance and economic performance
Governance and economic performance
 
National Debt and How to Deal With It
National Debt and How to Deal With ItNational Debt and How to Deal With It
National Debt and How to Deal With It
 
Decentralized tax system and public expenditures in rwanda
Decentralized tax system and public expenditures in rwandaDecentralized tax system and public expenditures in rwanda
Decentralized tax system and public expenditures in rwanda
 
American Express Credit Corp.2007
American Express Credit Corp.2007American Express Credit Corp.2007
American Express Credit Corp.2007
 
Aid and taxation in ethiopia
Aid and taxation in ethiopiaAid and taxation in ethiopia
Aid and taxation in ethiopia
 
2012 Rebalancing England: Sub-National Development (Once Again) at the Crossr...
2012 Rebalancing England: Sub-National Development (Once Again) at the Crossr...2012 Rebalancing England: Sub-National Development (Once Again) at the Crossr...
2012 Rebalancing England: Sub-National Development (Once Again) at the Crossr...
 
Policy paper DDLG 2016 english
Policy paper DDLG 2016 englishPolicy paper DDLG 2016 english
Policy paper DDLG 2016 english
 
URSP Poster- Orshi Buzas
URSP Poster- Orshi BuzasURSP Poster- Orshi Buzas
URSP Poster- Orshi Buzas
 
Mobilizing Local Government Tax Revenue for Adequate Service Delivery in Nige...
Mobilizing Local Government Tax Revenue for Adequate Service Delivery in Nige...Mobilizing Local Government Tax Revenue for Adequate Service Delivery in Nige...
Mobilizing Local Government Tax Revenue for Adequate Service Delivery in Nige...
 
Independent oversight bodies lessons from fiscal productivity and regulatory ...
Independent oversight bodies lessons from fiscal productivity and regulatory ...Independent oversight bodies lessons from fiscal productivity and regulatory ...
Independent oversight bodies lessons from fiscal productivity and regulatory ...
 
05082
0508205082
05082
 
sl
slsl
sl
 
Microsoft Word Stabilizingtransfers2 6 02 Rosenblatt
Microsoft Word   Stabilizingtransfers2 6 02 RosenblattMicrosoft Word   Stabilizingtransfers2 6 02 Rosenblatt
Microsoft Word Stabilizingtransfers2 6 02 Rosenblatt
 
Growth-Debt Nexus: An Examination of Public Debt Levelsand Debt Crisis in Zim...
Growth-Debt Nexus: An Examination of Public Debt Levelsand Debt Crisis in Zim...Growth-Debt Nexus: An Examination of Public Debt Levelsand Debt Crisis in Zim...
Growth-Debt Nexus: An Examination of Public Debt Levelsand Debt Crisis in Zim...
 
Fiscal decentralization and subnational revenue experience of the emerging re...
Fiscal decentralization and subnational revenue experience of the emerging re...Fiscal decentralization and subnational revenue experience of the emerging re...
Fiscal decentralization and subnational revenue experience of the emerging re...
 
Bass cognitive dissonance
Bass cognitive dissonanceBass cognitive dissonance
Bass cognitive dissonance
 

Similar to The impact of fiscal decentralization toward regional inequalities in eastern region of indonesia

Fiscal Decentralization and Special Local Autonomy: Evidence from an Emerging...
Fiscal Decentralization and Special Local Autonomy: Evidence from an Emerging...Fiscal Decentralization and Special Local Autonomy: Evidence from an Emerging...
Fiscal Decentralization and Special Local Autonomy: Evidence from an Emerging...Suwandi, Dr. SE.,MSi
 
Do Regional Finance Accountability And Budgetary Composition Enhance Regional...
Do Regional Finance Accountability And Budgetary Composition Enhance Regional...Do Regional Finance Accountability And Budgetary Composition Enhance Regional...
Do Regional Finance Accountability And Budgetary Composition Enhance Regional...inventionjournals
 
The optimal point for fiscal decentralization
The optimal point for fiscal decentralizationThe optimal point for fiscal decentralization
The optimal point for fiscal decentralizationAlexander Decker
 
Significant changes with little progress: evaluation on the 3 rd year of the ...
Significant changes with little progress: evaluation on the 3 rd year of the ...Significant changes with little progress: evaluation on the 3 rd year of the ...
Significant changes with little progress: evaluation on the 3 rd year of the ...Tri Widodo W. UTOMO
 
Effect of Fiscal Independence and Local Revenue Against Human Development Index
Effect of Fiscal Independence and Local Revenue Against Human Development IndexEffect of Fiscal Independence and Local Revenue Against Human Development Index
Effect of Fiscal Independence and Local Revenue Against Human Development IndexUniversitas Pembangunan Panca Budi
 
International Journal of Business and Management Invention (IJBMI)
International Journal of Business and Management Invention (IJBMI)International Journal of Business and Management Invention (IJBMI)
International Journal of Business and Management Invention (IJBMI)inventionjournals
 
The Nexus between Fiscal Decentralization and Economic Growth: Evidence from ...
The Nexus between Fiscal Decentralization and Economic Growth: Evidence from ...The Nexus between Fiscal Decentralization and Economic Growth: Evidence from ...
The Nexus between Fiscal Decentralization and Economic Growth: Evidence from ...RSIS International
 
An evaluation and forecast of the impact of foreign direct investment in nige...
An evaluation and forecast of the impact of foreign direct investment in nige...An evaluation and forecast of the impact of foreign direct investment in nige...
An evaluation and forecast of the impact of foreign direct investment in nige...Alexander Decker
 
Dimensions of Accountability and Transparency at Local Level Finance Manageme...
Dimensions of Accountability and Transparency at Local Level Finance Manageme...Dimensions of Accountability and Transparency at Local Level Finance Manageme...
Dimensions of Accountability and Transparency at Local Level Finance Manageme...Triple A Research Journal
 
Relationship Between Fiscal Decentralization and Health Care Financing in Uas...
Relationship Between Fiscal Decentralization and Health Care Financing in Uas...Relationship Between Fiscal Decentralization and Health Care Financing in Uas...
Relationship Between Fiscal Decentralization and Health Care Financing in Uas...Triple A Research Journal
 
11.[1 12]challenges of managing local government finance in nigeria
11.[1 12]challenges of managing local government finance in nigeria11.[1 12]challenges of managing local government finance in nigeria
11.[1 12]challenges of managing local government finance in nigeriaAlexander Decker
 
11.[1 12]challenges of managing local government finance in nigeria
11.[1 12]challenges of managing local government finance in nigeria11.[1 12]challenges of managing local government finance in nigeria
11.[1 12]challenges of managing local government finance in nigeriaAlexander Decker
 
Does government spending spur economic growth evidence from nigeria
Does government spending spur economic growth  evidence from nigeriaDoes government spending spur economic growth  evidence from nigeria
Does government spending spur economic growth evidence from nigeriaAlexander Decker
 
Local Level Financial Systems: A Study on Three Union at Sylhet Sadar Upazill...
Local Level Financial Systems: A Study on Three Union at Sylhet Sadar Upazill...Local Level Financial Systems: A Study on Three Union at Sylhet Sadar Upazill...
Local Level Financial Systems: A Study on Three Union at Sylhet Sadar Upazill...Triple A Research Journal
 
Budget Deficit and Economic Growth in Liberia: An Empirical Investigation
Budget Deficit and Economic Growth in Liberia: An Empirical InvestigationBudget Deficit and Economic Growth in Liberia: An Empirical Investigation
Budget Deficit and Economic Growth in Liberia: An Empirical InvestigationAJHSSR Journal
 
Budget implementation and economic growth in nigeria
Budget implementation and economic growth in nigeriaBudget implementation and economic growth in nigeria
Budget implementation and economic growth in nigeriaAlexander Decker
 

Similar to The impact of fiscal decentralization toward regional inequalities in eastern region of indonesia (20)

Fiscal Decentralization and Special Local Autonomy: Evidence from an Emerging...
Fiscal Decentralization and Special Local Autonomy: Evidence from an Emerging...Fiscal Decentralization and Special Local Autonomy: Evidence from an Emerging...
Fiscal Decentralization and Special Local Autonomy: Evidence from an Emerging...
 
Do Regional Finance Accountability And Budgetary Composition Enhance Regional...
Do Regional Finance Accountability And Budgetary Composition Enhance Regional...Do Regional Finance Accountability And Budgetary Composition Enhance Regional...
Do Regional Finance Accountability And Budgetary Composition Enhance Regional...
 
The optimal point for fiscal decentralization
The optimal point for fiscal decentralizationThe optimal point for fiscal decentralization
The optimal point for fiscal decentralization
 
Intergovernment fiscal
Intergovernment fiscalIntergovernment fiscal
Intergovernment fiscal
 
Analysis of the Effects of Fiscal Decentralization on Financial Performance a...
Analysis of the Effects of Fiscal Decentralization on Financial Performance a...Analysis of the Effects of Fiscal Decentralization on Financial Performance a...
Analysis of the Effects of Fiscal Decentralization on Financial Performance a...
 
Group 6
Group 6Group 6
Group 6
 
Significant changes with little progress: evaluation on the 3 rd year of the ...
Significant changes with little progress: evaluation on the 3 rd year of the ...Significant changes with little progress: evaluation on the 3 rd year of the ...
Significant changes with little progress: evaluation on the 3 rd year of the ...
 
Effect of Fiscal Independence and Local Revenue Against Human Development Index
Effect of Fiscal Independence and Local Revenue Against Human Development IndexEffect of Fiscal Independence and Local Revenue Against Human Development Index
Effect of Fiscal Independence and Local Revenue Against Human Development Index
 
International Journal of Business and Management Invention (IJBMI)
International Journal of Business and Management Invention (IJBMI)International Journal of Business and Management Invention (IJBMI)
International Journal of Business and Management Invention (IJBMI)
 
The Nexus between Fiscal Decentralization and Economic Growth: Evidence from ...
The Nexus between Fiscal Decentralization and Economic Growth: Evidence from ...The Nexus between Fiscal Decentralization and Economic Growth: Evidence from ...
The Nexus between Fiscal Decentralization and Economic Growth: Evidence from ...
 
An evaluation and forecast of the impact of foreign direct investment in nige...
An evaluation and forecast of the impact of foreign direct investment in nige...An evaluation and forecast of the impact of foreign direct investment in nige...
An evaluation and forecast of the impact of foreign direct investment in nige...
 
Dimensions of Accountability and Transparency at Local Level Finance Manageme...
Dimensions of Accountability and Transparency at Local Level Finance Manageme...Dimensions of Accountability and Transparency at Local Level Finance Manageme...
Dimensions of Accountability and Transparency at Local Level Finance Manageme...
 
Relationship Between Fiscal Decentralization and Health Care Financing in Uas...
Relationship Between Fiscal Decentralization and Health Care Financing in Uas...Relationship Between Fiscal Decentralization and Health Care Financing in Uas...
Relationship Between Fiscal Decentralization and Health Care Financing in Uas...
 
11.[1 12]challenges of managing local government finance in nigeria
11.[1 12]challenges of managing local government finance in nigeria11.[1 12]challenges of managing local government finance in nigeria
11.[1 12]challenges of managing local government finance in nigeria
 
11.[1 12]challenges of managing local government finance in nigeria
11.[1 12]challenges of managing local government finance in nigeria11.[1 12]challenges of managing local government finance in nigeria
11.[1 12]challenges of managing local government finance in nigeria
 
Does government spending spur economic growth evidence from nigeria
Does government spending spur economic growth  evidence from nigeriaDoes government spending spur economic growth  evidence from nigeria
Does government spending spur economic growth evidence from nigeria
 
Local Level Financial Systems: A Study on Three Union at Sylhet Sadar Upazill...
Local Level Financial Systems: A Study on Three Union at Sylhet Sadar Upazill...Local Level Financial Systems: A Study on Three Union at Sylhet Sadar Upazill...
Local Level Financial Systems: A Study on Three Union at Sylhet Sadar Upazill...
 
Budget Deficit and Economic Growth in Liberia: An Empirical Investigation
Budget Deficit and Economic Growth in Liberia: An Empirical InvestigationBudget Deficit and Economic Growth in Liberia: An Empirical Investigation
Budget Deficit and Economic Growth in Liberia: An Empirical Investigation
 
Yoyo
YoyoYoyo
Yoyo
 
Budget implementation and economic growth in nigeria
Budget implementation and economic growth in nigeriaBudget implementation and economic growth in nigeria
Budget implementation and economic growth in nigeria
 

More from Alexander Decker

Abnormalities of hormones and inflammatory cytokines in women affected with p...
Abnormalities of hormones and inflammatory cytokines in women affected with p...Abnormalities of hormones and inflammatory cytokines in women affected with p...
Abnormalities of hormones and inflammatory cytokines in women affected with p...Alexander Decker
 
A validation of the adverse childhood experiences scale in
A validation of the adverse childhood experiences scale inA validation of the adverse childhood experiences scale in
A validation of the adverse childhood experiences scale inAlexander Decker
 
A usability evaluation framework for b2 c e commerce websites
A usability evaluation framework for b2 c e commerce websitesA usability evaluation framework for b2 c e commerce websites
A usability evaluation framework for b2 c e commerce websitesAlexander Decker
 
A universal model for managing the marketing executives in nigerian banks
A universal model for managing the marketing executives in nigerian banksA universal model for managing the marketing executives in nigerian banks
A universal model for managing the marketing executives in nigerian banksAlexander Decker
 
A unique common fixed point theorems in generalized d
A unique common fixed point theorems in generalized dA unique common fixed point theorems in generalized d
A unique common fixed point theorems in generalized dAlexander Decker
 
A trends of salmonella and antibiotic resistance
A trends of salmonella and antibiotic resistanceA trends of salmonella and antibiotic resistance
A trends of salmonella and antibiotic resistanceAlexander Decker
 
A transformational generative approach towards understanding al-istifham
A transformational  generative approach towards understanding al-istifhamA transformational  generative approach towards understanding al-istifham
A transformational generative approach towards understanding al-istifhamAlexander Decker
 
A time series analysis of the determinants of savings in namibia
A time series analysis of the determinants of savings in namibiaA time series analysis of the determinants of savings in namibia
A time series analysis of the determinants of savings in namibiaAlexander Decker
 
A therapy for physical and mental fitness of school children
A therapy for physical and mental fitness of school childrenA therapy for physical and mental fitness of school children
A therapy for physical and mental fitness of school childrenAlexander Decker
 
A theory of efficiency for managing the marketing executives in nigerian banks
A theory of efficiency for managing the marketing executives in nigerian banksA theory of efficiency for managing the marketing executives in nigerian banks
A theory of efficiency for managing the marketing executives in nigerian banksAlexander Decker
 
A systematic evaluation of link budget for
A systematic evaluation of link budget forA systematic evaluation of link budget for
A systematic evaluation of link budget forAlexander Decker
 
A synthetic review of contraceptive supplies in punjab
A synthetic review of contraceptive supplies in punjabA synthetic review of contraceptive supplies in punjab
A synthetic review of contraceptive supplies in punjabAlexander Decker
 
A synthesis of taylor’s and fayol’s management approaches for managing market...
A synthesis of taylor’s and fayol’s management approaches for managing market...A synthesis of taylor’s and fayol’s management approaches for managing market...
A synthesis of taylor’s and fayol’s management approaches for managing market...Alexander Decker
 
A survey paper on sequence pattern mining with incremental
A survey paper on sequence pattern mining with incrementalA survey paper on sequence pattern mining with incremental
A survey paper on sequence pattern mining with incrementalAlexander Decker
 
A survey on live virtual machine migrations and its techniques
A survey on live virtual machine migrations and its techniquesA survey on live virtual machine migrations and its techniques
A survey on live virtual machine migrations and its techniquesAlexander Decker
 
A survey on data mining and analysis in hadoop and mongo db
A survey on data mining and analysis in hadoop and mongo dbA survey on data mining and analysis in hadoop and mongo db
A survey on data mining and analysis in hadoop and mongo dbAlexander Decker
 
A survey on challenges to the media cloud
A survey on challenges to the media cloudA survey on challenges to the media cloud
A survey on challenges to the media cloudAlexander Decker
 
A survey of provenance leveraged
A survey of provenance leveragedA survey of provenance leveraged
A survey of provenance leveragedAlexander Decker
 
A survey of private equity investments in kenya
A survey of private equity investments in kenyaA survey of private equity investments in kenya
A survey of private equity investments in kenyaAlexander Decker
 
A study to measures the financial health of
A study to measures the financial health ofA study to measures the financial health of
A study to measures the financial health ofAlexander Decker
 

More from Alexander Decker (20)

Abnormalities of hormones and inflammatory cytokines in women affected with p...
Abnormalities of hormones and inflammatory cytokines in women affected with p...Abnormalities of hormones and inflammatory cytokines in women affected with p...
Abnormalities of hormones and inflammatory cytokines in women affected with p...
 
A validation of the adverse childhood experiences scale in
A validation of the adverse childhood experiences scale inA validation of the adverse childhood experiences scale in
A validation of the adverse childhood experiences scale in
 
A usability evaluation framework for b2 c e commerce websites
A usability evaluation framework for b2 c e commerce websitesA usability evaluation framework for b2 c e commerce websites
A usability evaluation framework for b2 c e commerce websites
 
A universal model for managing the marketing executives in nigerian banks
A universal model for managing the marketing executives in nigerian banksA universal model for managing the marketing executives in nigerian banks
A universal model for managing the marketing executives in nigerian banks
 
A unique common fixed point theorems in generalized d
A unique common fixed point theorems in generalized dA unique common fixed point theorems in generalized d
A unique common fixed point theorems in generalized d
 
A trends of salmonella and antibiotic resistance
A trends of salmonella and antibiotic resistanceA trends of salmonella and antibiotic resistance
A trends of salmonella and antibiotic resistance
 
A transformational generative approach towards understanding al-istifham
A transformational  generative approach towards understanding al-istifhamA transformational  generative approach towards understanding al-istifham
A transformational generative approach towards understanding al-istifham
 
A time series analysis of the determinants of savings in namibia
A time series analysis of the determinants of savings in namibiaA time series analysis of the determinants of savings in namibia
A time series analysis of the determinants of savings in namibia
 
A therapy for physical and mental fitness of school children
A therapy for physical and mental fitness of school childrenA therapy for physical and mental fitness of school children
A therapy for physical and mental fitness of school children
 
A theory of efficiency for managing the marketing executives in nigerian banks
A theory of efficiency for managing the marketing executives in nigerian banksA theory of efficiency for managing the marketing executives in nigerian banks
A theory of efficiency for managing the marketing executives in nigerian banks
 
A systematic evaluation of link budget for
A systematic evaluation of link budget forA systematic evaluation of link budget for
A systematic evaluation of link budget for
 
A synthetic review of contraceptive supplies in punjab
A synthetic review of contraceptive supplies in punjabA synthetic review of contraceptive supplies in punjab
A synthetic review of contraceptive supplies in punjab
 
A synthesis of taylor’s and fayol’s management approaches for managing market...
A synthesis of taylor’s and fayol’s management approaches for managing market...A synthesis of taylor’s and fayol’s management approaches for managing market...
A synthesis of taylor’s and fayol’s management approaches for managing market...
 
A survey paper on sequence pattern mining with incremental
A survey paper on sequence pattern mining with incrementalA survey paper on sequence pattern mining with incremental
A survey paper on sequence pattern mining with incremental
 
A survey on live virtual machine migrations and its techniques
A survey on live virtual machine migrations and its techniquesA survey on live virtual machine migrations and its techniques
A survey on live virtual machine migrations and its techniques
 
A survey on data mining and analysis in hadoop and mongo db
A survey on data mining and analysis in hadoop and mongo dbA survey on data mining and analysis in hadoop and mongo db
A survey on data mining and analysis in hadoop and mongo db
 
A survey on challenges to the media cloud
A survey on challenges to the media cloudA survey on challenges to the media cloud
A survey on challenges to the media cloud
 
A survey of provenance leveraged
A survey of provenance leveragedA survey of provenance leveraged
A survey of provenance leveraged
 
A survey of private equity investments in kenya
A survey of private equity investments in kenyaA survey of private equity investments in kenya
A survey of private equity investments in kenya
 
A study to measures the financial health of
A study to measures the financial health ofA study to measures the financial health of
A study to measures the financial health of
 

Recently uploaded

Automating Business Process via MuleSoft Composer | Bangalore MuleSoft Meetup...
Automating Business Process via MuleSoft Composer | Bangalore MuleSoft Meetup...Automating Business Process via MuleSoft Composer | Bangalore MuleSoft Meetup...
Automating Business Process via MuleSoft Composer | Bangalore MuleSoft Meetup...shyamraj55
 
Gen AI in Business - Global Trends Report 2024.pdf
Gen AI in Business - Global Trends Report 2024.pdfGen AI in Business - Global Trends Report 2024.pdf
Gen AI in Business - Global Trends Report 2024.pdfAddepto
 
Install Stable Diffusion in windows machine
Install Stable Diffusion in windows machineInstall Stable Diffusion in windows machine
Install Stable Diffusion in windows machinePadma Pradeep
 
Bun (KitWorks Team Study 노별마루 발표 2024.4.22)
Bun (KitWorks Team Study 노별마루 발표 2024.4.22)Bun (KitWorks Team Study 노별마루 발표 2024.4.22)
Bun (KitWorks Team Study 노별마루 발표 2024.4.22)Wonjun Hwang
 
Unleash Your Potential - Namagunga Girls Coding Club
Unleash Your Potential - Namagunga Girls Coding ClubUnleash Your Potential - Namagunga Girls Coding Club
Unleash Your Potential - Namagunga Girls Coding ClubKalema Edgar
 
costume and set research powerpoint presentation
costume and set research powerpoint presentationcostume and set research powerpoint presentation
costume and set research powerpoint presentationphoebematthew05
 
Kotlin Multiplatform & Compose Multiplatform - Starter kit for pragmatics
Kotlin Multiplatform & Compose Multiplatform - Starter kit for pragmaticsKotlin Multiplatform & Compose Multiplatform - Starter kit for pragmatics
Kotlin Multiplatform & Compose Multiplatform - Starter kit for pragmaticscarlostorres15106
 
My INSURER PTE LTD - Insurtech Innovation Award 2024
My INSURER PTE LTD - Insurtech Innovation Award 2024My INSURER PTE LTD - Insurtech Innovation Award 2024
My INSURER PTE LTD - Insurtech Innovation Award 2024The Digital Insurer
 
"Debugging python applications inside k8s environment", Andrii Soldatenko
"Debugging python applications inside k8s environment", Andrii Soldatenko"Debugging python applications inside k8s environment", Andrii Soldatenko
"Debugging python applications inside k8s environment", Andrii SoldatenkoFwdays
 
Scanning the Internet for External Cloud Exposures via SSL Certs
Scanning the Internet for External Cloud Exposures via SSL CertsScanning the Internet for External Cloud Exposures via SSL Certs
Scanning the Internet for External Cloud Exposures via SSL CertsRizwan Syed
 
"Subclassing and Composition – A Pythonic Tour of Trade-Offs", Hynek Schlawack
"Subclassing and Composition – A Pythonic Tour of Trade-Offs", Hynek Schlawack"Subclassing and Composition – A Pythonic Tour of Trade-Offs", Hynek Schlawack
"Subclassing and Composition – A Pythonic Tour of Trade-Offs", Hynek SchlawackFwdays
 
Human Factors of XR: Using Human Factors to Design XR Systems
Human Factors of XR: Using Human Factors to Design XR SystemsHuman Factors of XR: Using Human Factors to Design XR Systems
Human Factors of XR: Using Human Factors to Design XR SystemsMark Billinghurst
 
AI as an Interface for Commercial Buildings
AI as an Interface for Commercial BuildingsAI as an Interface for Commercial Buildings
AI as an Interface for Commercial BuildingsMemoori
 
New from BookNet Canada for 2024: BNC CataList - Tech Forum 2024
New from BookNet Canada for 2024: BNC CataList - Tech Forum 2024New from BookNet Canada for 2024: BNC CataList - Tech Forum 2024
New from BookNet Canada for 2024: BNC CataList - Tech Forum 2024BookNet Canada
 
Advanced Test Driven-Development @ php[tek] 2024
Advanced Test Driven-Development @ php[tek] 2024Advanced Test Driven-Development @ php[tek] 2024
Advanced Test Driven-Development @ php[tek] 2024Scott Keck-Warren
 
Unraveling Multimodality with Large Language Models.pdf
Unraveling Multimodality with Large Language Models.pdfUnraveling Multimodality with Large Language Models.pdf
Unraveling Multimodality with Large Language Models.pdfAlex Barbosa Coqueiro
 
Understanding the Laravel MVC Architecture
Understanding the Laravel MVC ArchitectureUnderstanding the Laravel MVC Architecture
Understanding the Laravel MVC ArchitecturePixlogix Infotech
 
Streamlining Python Development: A Guide to a Modern Project Setup
Streamlining Python Development: A Guide to a Modern Project SetupStreamlining Python Development: A Guide to a Modern Project Setup
Streamlining Python Development: A Guide to a Modern Project SetupFlorian Wilhelm
 

Recently uploaded (20)

Automating Business Process via MuleSoft Composer | Bangalore MuleSoft Meetup...
Automating Business Process via MuleSoft Composer | Bangalore MuleSoft Meetup...Automating Business Process via MuleSoft Composer | Bangalore MuleSoft Meetup...
Automating Business Process via MuleSoft Composer | Bangalore MuleSoft Meetup...
 
Gen AI in Business - Global Trends Report 2024.pdf
Gen AI in Business - Global Trends Report 2024.pdfGen AI in Business - Global Trends Report 2024.pdf
Gen AI in Business - Global Trends Report 2024.pdf
 
Install Stable Diffusion in windows machine
Install Stable Diffusion in windows machineInstall Stable Diffusion in windows machine
Install Stable Diffusion in windows machine
 
Bun (KitWorks Team Study 노별마루 발표 2024.4.22)
Bun (KitWorks Team Study 노별마루 발표 2024.4.22)Bun (KitWorks Team Study 노별마루 발표 2024.4.22)
Bun (KitWorks Team Study 노별마루 발표 2024.4.22)
 
Unleash Your Potential - Namagunga Girls Coding Club
Unleash Your Potential - Namagunga Girls Coding ClubUnleash Your Potential - Namagunga Girls Coding Club
Unleash Your Potential - Namagunga Girls Coding Club
 
DMCC Future of Trade Web3 - Special Edition
DMCC Future of Trade Web3 - Special EditionDMCC Future of Trade Web3 - Special Edition
DMCC Future of Trade Web3 - Special Edition
 
costume and set research powerpoint presentation
costume and set research powerpoint presentationcostume and set research powerpoint presentation
costume and set research powerpoint presentation
 
Kotlin Multiplatform & Compose Multiplatform - Starter kit for pragmatics
Kotlin Multiplatform & Compose Multiplatform - Starter kit for pragmaticsKotlin Multiplatform & Compose Multiplatform - Starter kit for pragmatics
Kotlin Multiplatform & Compose Multiplatform - Starter kit for pragmatics
 
My INSURER PTE LTD - Insurtech Innovation Award 2024
My INSURER PTE LTD - Insurtech Innovation Award 2024My INSURER PTE LTD - Insurtech Innovation Award 2024
My INSURER PTE LTD - Insurtech Innovation Award 2024
 
"Debugging python applications inside k8s environment", Andrii Soldatenko
"Debugging python applications inside k8s environment", Andrii Soldatenko"Debugging python applications inside k8s environment", Andrii Soldatenko
"Debugging python applications inside k8s environment", Andrii Soldatenko
 
Hot Sexy call girls in Panjabi Bagh 🔝 9953056974 🔝 Delhi escort Service
Hot Sexy call girls in Panjabi Bagh 🔝 9953056974 🔝 Delhi escort ServiceHot Sexy call girls in Panjabi Bagh 🔝 9953056974 🔝 Delhi escort Service
Hot Sexy call girls in Panjabi Bagh 🔝 9953056974 🔝 Delhi escort Service
 
Scanning the Internet for External Cloud Exposures via SSL Certs
Scanning the Internet for External Cloud Exposures via SSL CertsScanning the Internet for External Cloud Exposures via SSL Certs
Scanning the Internet for External Cloud Exposures via SSL Certs
 
"Subclassing and Composition – A Pythonic Tour of Trade-Offs", Hynek Schlawack
"Subclassing and Composition – A Pythonic Tour of Trade-Offs", Hynek Schlawack"Subclassing and Composition – A Pythonic Tour of Trade-Offs", Hynek Schlawack
"Subclassing and Composition – A Pythonic Tour of Trade-Offs", Hynek Schlawack
 
Human Factors of XR: Using Human Factors to Design XR Systems
Human Factors of XR: Using Human Factors to Design XR SystemsHuman Factors of XR: Using Human Factors to Design XR Systems
Human Factors of XR: Using Human Factors to Design XR Systems
 
AI as an Interface for Commercial Buildings
AI as an Interface for Commercial BuildingsAI as an Interface for Commercial Buildings
AI as an Interface for Commercial Buildings
 
New from BookNet Canada for 2024: BNC CataList - Tech Forum 2024
New from BookNet Canada for 2024: BNC CataList - Tech Forum 2024New from BookNet Canada for 2024: BNC CataList - Tech Forum 2024
New from BookNet Canada for 2024: BNC CataList - Tech Forum 2024
 
Advanced Test Driven-Development @ php[tek] 2024
Advanced Test Driven-Development @ php[tek] 2024Advanced Test Driven-Development @ php[tek] 2024
Advanced Test Driven-Development @ php[tek] 2024
 
Unraveling Multimodality with Large Language Models.pdf
Unraveling Multimodality with Large Language Models.pdfUnraveling Multimodality with Large Language Models.pdf
Unraveling Multimodality with Large Language Models.pdf
 
Understanding the Laravel MVC Architecture
Understanding the Laravel MVC ArchitectureUnderstanding the Laravel MVC Architecture
Understanding the Laravel MVC Architecture
 
Streamlining Python Development: A Guide to a Modern Project Setup
Streamlining Python Development: A Guide to a Modern Project SetupStreamlining Python Development: A Guide to a Modern Project Setup
Streamlining Python Development: A Guide to a Modern Project Setup
 

The impact of fiscal decentralization toward regional inequalities in eastern region of indonesia

  • 1. Journal of Economics and Sustainable Development www.iiste.org ISSN 2222-1700 (Paper) ISSN 2222-2855 (Online) Vol.4, No.10, 2013 74 The Impact of Fiscal Decentralization toward Regional Inequalities in Eastern Region of Indonesia Syawal Zakaria Faculty of Economics, Darussalam University, Ambon (Indonesia) E-mail address zakaria.syawal@ymail.com Abstract This research aims to reveal whether fiscal decentralization is able to reduce regional inequality at Eastern Region of Indonesia. This research also endeavors to detect other variables (such as population growth, education participation level, open-unemployment rate, and investment rate) as the control variables that may affect regional inequality. The estimation result using panel data from 16 provinces during 2001-2010 in Eastern Region of Indonesia confirms that (1) fiscal decentralization is not able to reduce regional inequality, (2) population growth, education participation level, and investment rate have an effect to reduce regional inequality, and (3) in long term, economic performance tend to be better in the Eastern Region of Indonesia due to the change on the economic structure from traditional pattern to modern pattern. This condition is reflected on the Kuznets’ Inverted-U hypothesis confirmation. Keywords: fiscal decentralization, regional inequality, change on the economy structure pattern. 1. Introduction Debate that comes up among economics experts and practitioners until recent time that become the core of discussion and exploration is about fiscal decentralization policy. The main issue that is discussed is related to the relationship between fiscal decentralization and regional inequality. Some of the empirical studies have been conducted related to the relationship between fiscal decentralization and regional inequality. The results of those studies have come to various conclusions. According to Kim et.al. (2003) and Bonet (2006), fiscal decentralization has positive effect on regional inequality. It means that higher fiscal decentralization’s dimension results in higher rate of regional inequality. This finding is responded by Canaleta et.al (2004), Widhyanto (2008), and Rodriguez-Pose and Ezcurra (2009). They argue that fiscal decentralization has negative effect toward regional inequality. Their view resembles the theoretical hypothesis based on the Kuznets’ Inverted-U curve. Further, in another perspective, Shah (1997) records with some exceptions in developing countries that explicitly the transfer that is allocated to poor region for achieving equality is not well- utilized so that it causes fiscal disruption, weakens economic growth, and even makes the local government’s financial worst; those, in turn, will widen regional inequality. This view is supported by Shankar and Shah (2003) when decentralization policy is failed to create development equality on each country or region. This research is aimed to analyze the role of fiscal decentralization on regional inequality in Easter Region of Indonesia. Considering that fiscal decentralization policy has been started since 2001, this research is also an evaluation of its effect on each province in the Eastern Region of Indonesia. The next part will deliver theoretical framework and analysis model development that are utilized in this research. The last part is related to the discussion and suggestion of the research result. 2. Theoretical Framework 2.1. Fiscal Decentralization Objective In simple term, fiscal decentralization theory and practice are about how fiscal decentralization provides contribution on the achievement of economics target such as economics efficiency, income redistribution, and macroeconomics stability. Fiscal decentralization is often defined as fiscal authority delegation from central government to local government. Fiscal decentralization can bring huge economics efficiency in resource allocation among public sector. Since the public service preference differs on each region, the standardized service provided by the government is perceived to be less-efficient. Therefore, local government is more suitable to deliver the service since local government is assumed to be able to understand the preference uniqueness of each region. When local government holds the authority, it will sets off competition among local governments in delivering public service and chasing economic growth. According to Prud’home (1995), since individual’s preference and mobility are different for each region, decentralization system can be more efficient. On the contrary, if the individual’s preference is similar, then the standardization of public service will be more efficient. Prud’home (1995) also states that even the society who lives at particular region has similarity on its preference, and local government can be more efficient in public
  • 2. Journal of Economics and Sustainable Development www.iiste.org ISSN 2222-1700 (Paper) ISSN 2222-2855 (Online) Vol.4, No.10, 2013 75 service compared to central government. Oates (1993) mentions that fiscal decentralization is able to improve economic efficiency since local government is closer to local society than central government so that local government will be more responsive toward local’s needs and preferences. Local government also has a better understanding on local preference and finance. Economic efficiency induces population to move and live at the regions and community that can meet their preferences. Oates (1999) also states that fiscal decentralization issue becomes a trend, both in developed and developing countries. Several countries encourage devolution to improve the performance of their public sector’s service. Decentralization enhances wealth that is more than the outcome achieved from centralized governmental system. The output efficiency level is quite varied among regions due to various preferences and finance. However, it should be the responsibility of the lowest structure of government. Thus, to run the governmental function, it needs fiscal instrument’s specification. Fiscal instrument of a federal system consists of taxation, inter-governments aid, and sharing income. The problem is which tax imposition that is proper and good to be utilized on the different government level. Jonathan Rodden (2002) says that one of the most difficult challenges faced by several governmental systems is fiscal indiscipline among local governments. Vertical fiscal inequality has negative effect on local government fiscal performance. Fiscal decentralization is risky when local government marks up its expenditure far beyond actual finance. The improvement of government aid causes tax reduction; money transfer improvement instigates higher expenditure than local government development. Central government will limit local autonomy loan when vertical fiscal inequality is high. Vertical fiscal inequality affects local government performance if local autonomy loan is high. When local autonomy loan is low, loan deficit is still below tight control of central government. This kind of political atmosphere disturbs fiscal performance of local government. From the explanation above, there are two opposing views related to fiscal decentralization and economic efficiency. Decentralization system is more efficient than centralization system since decentralization creates competition among local governments. Decentralization can become less efficient if local government expenditure cannot be covered by its local income; furthermore, if the competition role is quite dominant, it triggers regional inequality. Fiscal decentralization instrument on each country or region is similar: tax, financial aid, and loan. 2.2. Fiscal Decentralization and Regional Inequality Bonet (2006) examined the effect of fiscal decentralization toward regional income inequality in Colombia. By using inter-departments data panel set, it found strong evidence that fiscal decentralization process increased regional income inequality. This trend was caused by a set of factors such as recent expenditure that was mostly allocated to new resources of the local government (for instance: salary and wage) not to capital or infrastructure investment, lack of national transfer redistribution components, no sufficient incentive from national until local levels to promote efficient benefit from them, lack of institutional capacity in local government. The empirical result also confirms that the crucial elements of fiscal decentralization policy affecting regional income inequality are: fair transfer system, ability to select the sector, to where the resources are allocated and proper incentive allocation. Those elements play important role in succeeding decentralization to reduce regional income inequality. According to Bonet (2006), there are two variables that should be controlled: economic openness level and economic agglomeration trend that have negative effect on regional inequality. Rediguez-Pose and Ezcurra (2010) analyzed the relationship between decentralization and regional inequality among developed and developing countries. In general, it is assumed that authority and resource transfer from central government to local government can cause unpleasant effect on the national economics cohesion. The result showed that fiscal decentralization and politic were completely cut-off from the inequality evolution among regions. It implies that there is a constraint on institutional capacity, fiscal capacity, and political capacity which administratively disadvantaged regions compete with rich, strong, and bigger region in achieving higher autonomy. To balance the inequality, it needs better capacity of the local government in disadvantaged regions to mobilize and exploit their economics potentials and make policies preferred by local population mainly for the ignored or less-prioritized region in national policy. The presence of national government with fiscal redistribution capacity becomes one of the significant factors that bounds negative potentials of rural regions decentralization. The relationship between decentralization and regional inequality evolution are much varied depending on the development rate of a country. The result indicates that in developed country, political decentralization does not affect inter regions inequality evolution; whereas, fiscal decentralization contributes to reduce regional inequality. Inequality increase cannot be compensated by the positive effect of politics. It was also explained that local governments’ policy decision in a developed country were diverse which tended to ignore the evolution of inter regions inequality. One of the exceptions only came from health sector which could reduce poverty. Inequality among regions which either increased or decreased depended on decentralization degree. The relationship between decentralization and inequality evolution at regional/local level was obviously
  • 3. Journal of Economics and Sustainable Development www.iiste.org ISSN 2222-1700 (Paper) ISSN 2222-2855 (Online) Vol.4, No.10, 2013 76 affected by a county’s wealth, dimensions difference, and firm fiscal distribution system. Therefore, when a nation’s income is high, internal inequality is limited, nation’s wealth is strong, and fiscal territorial system is progressive, then decentralization will not be continued since it endangers territorial cohesion (and, if any, will improve regional inequality); meanwhile, low and middle income nations should take more careful steps since the positive effect potential of political decentralization toward cohesion will be equally compensated by core and rural regions’ capacity inequality to make the resources more decentralized, particularly by omitting progressive fiscal territorial system. Widhiyanto (2008) examined fiscal decentralization and regional income inequality in Indonesia in 1994-2006. By considering economic convergence, it found empirical evidence that during 1994-2000 there was economic inequality; meanwhile, during 2001-2004, there was no economic convergence. This finding resembles new theories in fiscal decentralization. Sigma convergence will not take place since income per capita’s variance coefficient is fluctuated during observation period. Meanwhile, local government fiscal decentralization policy implementation faced higher variance coefficient of government’s income per capita. It is due to the regions which have natural resources can take a benefit on it; whereas, those regions which are lack of natural resources cannot. Other finding also proves that fiscal decentralization has negative effect on the income inequality among regions per capita. It also supports new theories in fiscal decentralization as fiscal decentralization is mentioned to be able to reduce regional income inequality. Lessman (2006) observed the role of fiscal decentralization on regional inequality. The finding indicated that countries with high decentralization level had relatively low regional inequality. It implied that inter-regions distribution in decentralization was not risky but could reduce regional inequality. This result can only be generalized in well-developed countries. Alternatively, decentralization in under-developed countries has negative effect on regional equity. It is based on the assumption that developing countries have high corruption rate, so that decentralization opens an opportunity for local government authority to exploit its population and local public sector. Therefore, decentralization is much risky in under-developed countries. In transition countries such as East Europe, decentralization can improve inequality among regions due to its historical and organizational backgrounds that are totally different: in communist centralized fiscal, core agglomeration can develop rapidly. The test result demonstrates that decentralization has positive effect on regional inequality, but not significant. The conclusion is that decentralization improvement is not risky for convergence process; and, competition among countries or regions can reduce regional inequality. Akai and Sakata (2005) examined fiscal decentralization, commitment, and regional inequality. In conventional approach, fiscal decentralization appeared to reduce redistribution power among regions since fiscal decentralization worked in a set of commitments. 2.3. Research Conceptual Framework Figure 1. Research Conceptual Framework 3. Method 3.1. Research Approach This research utilizes positivist approach. According to Neuman (2006:82-83), positivist approach is a method that is organized to combine deductive logic and empirical observation precisely on the individual or group behavior to find the pattern and confirm the causal relationship that is usable to predict the general pattern of human activities. Positivist approach not only analyzes the inter-dependent correlation and co-existence of causality, but also is able to explain the condition that occurs in society (explanatory capability) as well as predict things which are going to happen (predictive capability) related to fiscal decentralization, economic growth, and regional inequality.
  • 4. Journal of Economics and Sustainable Development www.iiste.org ISSN 2222-1700 (Paper) ISSN 2222-2855 (Online) Vol.4, No.10, 2013 77 3.2. Type and Source of the Data The data type in this research is secondary data. Most of the secondary data is obtained from Indonesia Statistic, Directorate General of Budget of Finance Ministry of Indonesia Republic, Ministry of Development Acceleration, and other relevant institutions as well as internet websites. Those collected data include APBD’s (Local Government Revenue and Expenditure) data consisting of Regional Income (Dana Alokasi Umum/General Allocation Fund, Dana Alokasi Khusus/Special Allocation Fund, Dana Bagi Hasil/ Revenue Sharing Fund, and Pendapatan Asli Daerah/ Fiscal Autonomy) and Local Expenditure, PDRB (Produk Domestik Regional Bruto/ Regional Gross Domestic Product), economic growth of provinces, RGDP development rate, income per capita growth of provinces, population members who are 15 – 18 years old that have graduated from the middle schools level (Senior and Junior High Schools levels), population growth and number, level of open- unemployment, and domestic investment in GDP value, and other supporting data for this research. The data is collected from 2001-2010. The data is expected to be able to explain the consequences of fiscal decentralization implementation in Eastern Region of Indonesia. 3.3. Definition and Measurement of Variables Definition and measurement of variables are intended to explain the observed variables. In other words, variable definition is the guidance on how to measure a variable. Table 1. Definition and Measurement of Variables Num. Variable Variable Measurement 1 Regional Inequality (RI) Regional Gross Domestic Product inequality on the constant price among regencies/cities in a province by using Williamson’s Index method 2 Regional Economic Growth (REG) Regional Gross Domestic Product’s growth percentage on the constant price year by year 3 Population (POP) Population growth of in a province (%) 4 Education Level (EPR) Education Participation Rate (%) 5 Unemployment (OUR) Open-Unemployment Rate (%) 6 Investment Rate (IR) Ratio between Investment and province’s Regional Gross Domestic Product 7 Fiscal Decentralization (FD) Ratio between Balance Fund (General Allocation Fund, Revenue Sharing Fund, and Special Allocation Fund) and Total Local Expenditure. 4. Data Analysis Data analysis in this research is aimed to test the hypothesis as the answers of the research problems. Since the data is time series and cross-section, data analysis method uses panel data analysis. Panel data or pooled data is the combination between time series and cross-section data. By accommodating cross-section and time series variables, pooled data is able to derive omitted-variables since this model ignores relevant variables. Besides, it can overcome inter-correlation among independent variables that may cause bias interpretation of the regression analysis (Nachrowi and Usman, 2006). In econometrics estimation model, there are three techniques. First, it is Pool Least Square (PLS) which uses Ordinary Least Square (OLS) method to estimate. This technique combines or pools all of the time series and cross-section data. Second, it is Fixed Effect Model (FEM). This approach is a technique that considers dummy variables since there is a possibility of omitted variable problem to occur which causes intercept time series and cross-section change. Third, it is Random Effect Model (REM) which emphasizes on the efficiency refinement of the least square process by considering the error of cross-section and time series. Random Effect Model is the development of Generalized Least Square (GLS) estimation. In general, the econometrics model is as follow: RI = + + + + + + + 5. Result and Discussion 5.1. Result 5.1.1. Analysis Model Test Since this research uses panel data analysis model, it needs to test the analysis model. The model analysis result that uses three estimation techniques on the panel data in all of the provinces of Eastern Region of Indonesia is presented below:
  • 5. Journal of Economics and Sustainable Development www.iiste.org ISSN 2222-1700 (Paper) ISSN 2222-2855 (Online) Vol.4, No.10, 2013 78 Table 2 Model Analysis Test Result of Regional InequalityIn Eastern Region of Indonesia PLS FEM REM Variable C 0.016465 (0,0833225) 0.305752 (6,506668)* 0.258325 (2,764997)** FD -0.218881 (-2,014145** -0.024790 (-1,031194) -0.152882 (-1,113730) REG 0.298737 (3,773490)* 0.105400 (3,297621)* 0.085054 (0,894670) (REG)2 -0.028310 (-3,594958)* -0.013859 (-3,091973)* -0.008796 (-0,694921) POP -0.257311 (-1,437456) -0.086870 (-1,142304) -0.291536 (-1,396029) EPR -0.000310 (-0,531005) 0.001903 (5,882753)* 0.001697 (1,135335) OUR 0.006862 (3,023653)* -0.000471 (-1,127092) 0.000374 (0,089051) IR -0.465728 (-5,696581)* -0.139412 (-5,905636)* 0.264210 (1,302136) Adj R2 0.409899 0.937922*** 0.040979 DW 0.521332 1.207855**** 1.193339 Hausman test (FEM vs REM) - 0.5896 0.5896**** F-test (PLS vs FEM) 8,087293 8,087293**** - Description: * Significant with α = 1% ** Significant with α = 5% *** the best model based on determinant coefficient indicator **** the best model based on Durbin-Watson indicator ***** the best model based on Hausman’s Specification Test ****** the best model based on F-test Specification Model (F-table 99% = 2.41) Based on the Table 2 above, it reveals some information. First, observed from the variable’s coefficient perspective, PLS and FEM techniques are better than REM technique when in REM all of the variable’s coefficients are not significant unless for intercept variable. Second, though based on the Hausman’s specification test, it recommends that REM is more consistent and more efficient based on null hypothesis, the score of determinant coefficient (R2 ) and Durbin-Watson coefficient are not better than FEM technique. It implies that REM can be ignored in further analysis on the regional inequality. Third, the result from F-test through PLS and FEM is quite robust. It is proven by the F-test score that is quite far beyond the limit of the F- table. The F-value is 8.09, while the F table with numerator (N1) 10 and denominator 153, at 99% level of confidence shows 2.41. Also, the other indicator that can be used is adjusted R2 and Durbin-Watson values which are statistically indicate better and more efficient FEM technique to be considered in analyzing the consequences of fiscal decentralization on regional inequality in Eastern Region of Indonesia. 5.1.2. Estimation Result Here is the estimation result of the fiscal decentralization’s consequences toward regional inequality in Eastern Region of Indonesia. Table 3 below displays estimation result using Fixed Effect Model (FEM) in panel for 160 observations in Easter Region of Indonesia.
  • 6. Journal of Economics and Sustainable Development www.iiste.org ISSN 2222-1700 (Paper) ISSN 2222-2855 (Online) Vol.4, No.10, 2013 79 Table 3 Estimation Result of Fiscal Decentralization and Regional Inequality Variable Coefficient Std. Error t-Statistic Prob C 0.305752 0.046991 6.506668 0.0000 FD -0.024790 0.024040 -1.031194 0.3043 REG (REG)2 0.105400 -0.013859 0.031962 0.004482 3.297621 -3.091973 0.0012 0.0024 POP -0.086870 0.076048 -1.142304 0.2553 EPR 0.001903 0.000324 5.882753 0.0000 OUR -0.000471 0.000418 -1.127092 0.2617 IR -0.139412 0.023607 -5.905636 0.0000 Weighted Statistic Adjusted R-squared 0,937922 F-statistic 110,1950 Prob(F-statistic) 0,000000 DW 1,207855 In general, based on the information presented in Table 3 above, it can be confirmed that there are some points of fiscal decentralization’s consequences toward regional inequality in Eastern Region of Indonesia. First, by using FEM technique on 160 observations, it obtains determinant coefficient (adjusted R2 ) of 0.9379. It means that fiscal decentralization (DF), economic growth (REG), population growth (POP), education participation rate (EPR), open-unemployment rate (OUR), and investment rate (IR) variables are able to explain regional inequality (RD) coefficient as much as 93.79 percent; whereas, the rest 6.21 percent is explained by other variables other than variables in the equation model of this research. The ability of the independent variable is also confirmed by F-statistic which scores 110.20 at the probability of F-statistic in 99 percent level of confidence (α=1%). Second, based on t-statistic test to detect the relationship among variables demonstrates that regional economic growth (REG) and investment rate (IR) variables have quite significant effect which is able to reduce regional inequality. Education participation rate (EPR) number is positive significant to improve regional inequality. On the other hand, fiscal decentralization (FD) population growth (POP), and open-unemployment rate (OUR) are not quite strong to reduce regional inequality (RI). Third, as perceived from Fixed Effect Model, Cross-Section, which describes regional inequality condition of each province in Easter Region of Indonesia, is negative; unless, it is for West Nusa Tenggara and East Kalimantan provinces that get positive result. 5.2. Discussion 5.2.1. Fiscal Decentralization and Regional Inequality Based on the result, it confirms that fiscal decentralization’s coefficient is negative 0.024790. It implies that when the transferred fund allocation of Local Government Revenue and Income (APBD) decreases, it improves regional inequality for 0.024790 or 0.02 percent. Conversely, if the transferred fund allocation increases, it reduces regional inequality. Even fiscal decentralization is able reduce regional inequality, the relationship between the two variables is not significant.
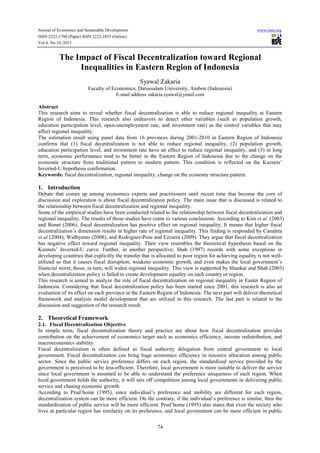
  • 7. Journal of Economics and Sustainable Development ISSN 2222-1700 (Paper) ISSN 2222-2855 (Online) Vol.4, No.10, 2013 The Relationship between Fiscal Decentralization and Regional Fig. 2 above displays the relationship between fiscal decentralization and regional by using Williamson’s Index. The relationship between the two variables is not consistent. In 20 decentralization fund tended to decrease, it resulted in increasing regional decentralization fund increased; yet, regional decentralization fund tended to decrease; whereas, regional increase. It implies that local government must be sensitive and give more attention on this indication. Therefore, though the improvement percentage is relatively smal development sustainability. The cause of the weak relationship between fiscal decentralization and regional First, decentralization fund allocation is not yet abl is quite small. Second, local government expenditure allocation is not precisely on the target that causes inefficiency in managing expenditure budget of the local government as most of the a expenditure for government officer and capital expenditure. For instance, capital expenditure was expected to be able to finance productive economic activities; yet, it was more to finance less activities. It resembles Canaleta’s et.al. regional inequality. Third, administration system and economic institution do not provide sufficient support and are not well-managed; thus, it hinders 5.2.2. The Relationship between Control Variable and Regional 5.2.2.1 Economic Growth and Regional Referring to Kuznets’ view that on the initial stage of development (short term development), it cause however, after some processes in long term (to particular point) it will reduce the the inverted-U hypothesis model of Kuznets, there are two stages of economic development process to achieve nation prosperity and wealth. 5.2.2.1.1. Economic Growth and Income Per Capita Based on the research result by using the first model, it confirms that the coefficient of regional economic growth (REG) is positive 0.105400 and significant at 99% (α=1%) level of con that it the regional economic growth increases, it causes an increase on regional discrepancy for 0.105400 or 0.11 percent. 0.00 0.20 0.40 0.60 0.80 1.00 1.20 2001 2002 Journal of Economics and Sustainable Development 2855 (Online) 80 Figure 2 The Relationship between Fiscal Decentralization and Regional Inequa Source: Indonesia Statistic, 2001-2010 Fig. 2 above displays the relationship between fiscal decentralization and regional inequality by using Williamson’s Index. The relationship between the two variables is not consistent. In 20 decentralization fund tended to decrease, it resulted in increasing regional inequality decentralization fund increased; yet, regional inequality continued to improve. Next, in 2006 ded to decrease; whereas, regional inequality was relatively stable though it tended to increase. It implies that local government must be sensitive and give more attention on this indication. Therefore, though the improvement percentage is relatively small, it brings quite huge contribution on the local autonomy The cause of the weak relationship between fiscal decentralization and regional inequality First, decentralization fund allocation is not yet able to meet the basic needs of local’s basic fiscal needs since it is quite small. Second, local government expenditure allocation is not precisely on the target that causes inefficiency in managing expenditure budget of the local government as most of the a expenditure for government officer and capital expenditure. For instance, capital expenditure was expected to be able to finance productive economic activities; yet, it was more to finance less-productive and consumptive et.al. (2004) view as public sector measurement has positive relationship with . Third, administration system and economic institution do not provide sufficient support and managed; thus, it hinders the society in conducting economic activities. The Relationship between Control Variable and Regional Inequality Economic Growth and Regional Inequality Referring to Kuznets’ view that on the initial stage of development (short term development), it cause however, after some processes in long term (to particular point) it will reduce the inequality U hypothesis model of Kuznets, there are two stages of economic development process to achieve Economic Growth and Income Per Capita Inequality Increase Based on the research result by using the first model, it confirms that the coefficient of regional economic growth (REG) is positive 0.105400 and significant at 99% (α=1%) level of confidence. This coefficient implies that it the regional economic growth increases, it causes an increase on regional discrepancy for 0.105400 or 2003 2004 2005 2006 2007 2008 2009 2010 www.iiste.org Inequality inequality which is measured by using Williamson’s Index. The relationship between the two variables is not consistent. In 2001-2003, when inequality. In 2004-2005, fiscal continued to improve. Next, in 2006-2010, fiscal was relatively stable though it tended to increase. It implies that local government must be sensitive and give more attention on this indication. Therefore, l, it brings quite huge contribution on the local autonomy inequality is due to some factors. e to meet the basic needs of local’s basic fiscal needs since it is quite small. Second, local government expenditure allocation is not precisely on the target that causes mount is distributed to expenditure for government officer and capital expenditure. For instance, capital expenditure was expected to be productive and consumptive (2004) view as public sector measurement has positive relationship with . Third, administration system and economic institution do not provide sufficient support and Referring to Kuznets’ view that on the initial stage of development (short term development), it causes inequality; inequality. It indicates that in U hypothesis model of Kuznets, there are two stages of economic development process to achieve Based on the research result by using the first model, it confirms that the coefficient of regional economic fidence. This coefficient implies that it the regional economic growth increases, it causes an increase on regional discrepancy for 0.105400 or RI FD
  • 8. Journal of Economics and Sustainable Development ISSN 2222-1700 (Paper) ISSN 2222-2855 (Online) Vol.4, No.10, 2013 Williamson’s Index and Regional Gross Domestic Product Per Capita Figure 3 above presents that when the Regional Gross Domestic Product (RGDP) per Capita increases, it is followed by an increase on the Williamson’s Index of decreases, it reduces the Williamson’s Index as well. It means that the economic growth that was expected to be able to reduce regional inequality in Eastern Region of Indonesia cannot be achieved during initial period. 5.2.2.1.2. Economic Growth and Income pe By utilizing the second model, it can explain the Kuznets’ phenomenon. It confirmed by the coefficient score which shows -0.013859 and significant at probability level less than 5%. The negative sign but significant indicate that Kuznets’ hypothesis is confirmed. At first, economic growth made the after coming at particular point, economic growth reduced the Based on the two analysis models above, to combine the two models based on the Tab of X1= X3= X4= X5= X6= 0, it arrives to the following equation: RI = 0.3058 + 0.1054X2 – 0.0139 Williamson’s Index Curve and Regional Gross Domestic Product Per Capita Figure 4 confirms that the relationship bet Region of Indonesia has inverted-U shape. During the initial stage of development, regional by Williamsons’ Index continued to improve when the RGDP also increased. However, when particular extreme point, regional inequality growth. The process to arrive at sustainable development stage can decrease regional known as structural transformation development theory. According to Lewis’ development model, sustainable growth process which from the modern sector expansion as well the development and advancement from traditional sector to modern sector of economic. The expan from the investment on education sector; therefore education sector increases. However, since the modern sector requires skillful labors, the investment return on education sector decreases due to the in educated labors and decreasing supply on uneducated consistent with the inverted-U hypothesis as the development process in Eastern Region of Indonesia also follows the development stage as reflected on the inverted This finding is also in accordance with Ardani’s finding (1996, 1992; in Kuncoro, 2003) which analyzed the -0.50 0.00 0.50 1.00 1.50 2.00 2.50 2001 2002 0.00 0.10 0.20 0.30 0.40 0.50 0.60 1 2 WILLIAMSONINDEX Journal of Economics and Sustainable Development 2855 (Online) 81 Figure 3 Williamson’s Index and Regional Gross Domestic Product Per Capita in Eastern Region of Source: Indonesia Statistic, 2001-2010 Figure 3 above presents that when the Regional Gross Domestic Product (RGDP) per Capita increases, it is followed by an increase on the Williamson’s Index of inequality (WI); conversely, when the RGDP per decreases, it reduces the Williamson’s Index as well. It means that the economic growth that was expected to be in Eastern Region of Indonesia cannot be achieved during initial period. Economic Growth and Income per Capita Inequality Decrease By utilizing the second model, it can explain the Kuznets’ phenomenon. It confirmed by the coefficient score 0.013859 and significant at probability level less than 5%. The negative sign but significant at Kuznets’ hypothesis is confirmed. At first, economic growth made the inequality after coming at particular point, economic growth reduced the inequality. Based on the two analysis models above, to combine the two models based on the Table 3 with the assumption = 0, it arrives to the following equation: Figure 4 Williamson’s Index Curve and Regional Gross Domestic Product Per Capita Figure 4 confirms that the relationship between economic growth and Williamson’s Index in the Eastern U shape. During the initial stage of development, regional by Williamsons’ Index continued to improve when the RGDP also increased. However, when inequality started to decrease that was followed by the increase on the RGDP The process to arrive at sustainable development stage can decrease regional inequality. In Lewis’ theory, it is s structural transformation development theory. According to Lewis’ development model, sustainable growth process which from the modern sector expansion as well the development and advancement from traditional sector to modern sector of economic. The expansion from traditional sector to modern sector starts from the investment on education sector; therefore education sector increases. However, since the modern sector requires skillful labors, the investment return on education sector decreases due to the in educated labors and decreasing supply on uneducated-labors. Therefore, basically, the result of this research is U hypothesis as the development process in Eastern Region of Indonesia also elopment stage as reflected on the inverted-U figure. This finding is also in accordance with Ardani’s finding (1996, 1992; in Kuncoro, 2003) which analyzed the 2003 2004 2005 2006 2007 2008 2009 2010 0.51 3 4 5 6 7 8 9 GDP PER CAPITA (%) www.iiste.org in Eastern Region of Indonesia Figure 3 above presents that when the Regional Gross Domestic Product (RGDP) per Capita increases, it is (WI); conversely, when the RGDP per capita decreases, it reduces the Williamson’s Index as well. It means that the economic growth that was expected to be in Eastern Region of Indonesia cannot be achieved during initial period. By utilizing the second model, it can explain the Kuznets’ phenomenon. It confirmed by the coefficient score 0.013859 and significant at probability level less than 5%. The negative sign but significant inequality got worst; yet, le 3 with the assumption Williamson’s Index Curve and Regional Gross Domestic Product Per Capita ween economic growth and Williamson’s Index in the Eastern U shape. During the initial stage of development, regional inequality showed by Williamsons’ Index continued to improve when the RGDP also increased. However, when it came to the started to decrease that was followed by the increase on the RGDP . In Lewis’ theory, it is s structural transformation development theory. According to Lewis’ development model, sustainable growth process which from the modern sector expansion as well the development and advancement from sion from traditional sector to modern sector starts from the investment on education sector; therefore education sector increases. However, since the modern sector requires skillful labors, the investment return on education sector decreases due to the increasing supply of the labors. Therefore, basically, the result of this research is U hypothesis as the development process in Eastern Region of Indonesia also This finding is also in accordance with Ardani’s finding (1996, 1992; in Kuncoro, 2003) which analyzed the WI REG 10
  • 9. Journal of Economics and Sustainable Development ISSN 2222-1700 (Paper) ISSN 2222-2855 (Online) Vol.4, No.10, 2013 economic growth and regional inequality 1983 – 1993. The conclusion supports Williamson’s hypothesis (1965) which refers to Kuznets’ hypothesis which mentions that during the initial stage of economic development, it occurs disparities among several regions; yet, as the economic develo narrower. Furthermore, the study conducted by Sutarno and Kuncoro (2007) in Banyumas Regency during 1993 2000 using Williamson’s Index resembles Inverted stage, the inequality gets worst; however, for the next stages, the there occurs another inequality which in turn will reduce again. 5.3. Population Growth and Regional The result confirms that population growth has negative effect toward regional coefficient of population growth which shows negative 0.0086870. The coefficient implies that when the population decreases, it will improve regiona population increases, it reduces the inequality The number of population in the Eastern Region of Indonesia until 2010 is 35,550,800 million. Compared to the land area of 14,000 km2 , Eastern Region of Indonesia is categorized in to a region which has relatively small number of population; therefore, it affects the advancement or the development of regional economic that cause inter-regions inequality. This research result has proven that However, this conclusion cannot be taken as the basic consideration since in the test of significance, the relationship is not significant at 5% of α. Population, other than its quantit quality related to the education level or skill. This causes non significant relationship. 5.4. Education Participation and Regional The research result confirms that education participation has positive effect tha inequality. It is verified by the coefficient of education participation which shows positive 0.001903 and significant at α=1%. The coefficient of education participation implies that when the education participation increases, it will cause on the regional decreases, it reduces regional inequality Education Participation Rate and Regional in Eastern Region of Indonesia, 2001 Figure 5 presents positive relationship between education participation and regional the education participation is higher, it results in higher regional between the two variables can be negative, since at particular period, the education participation is able to reduce regional inequality (for instance, in 2004 until 2010) that is indicated from the distance between education participation’s graph gets wider from the regional with the possessed education level, it can reduce regional condition highly depends on the local or provincial gove 5.5. Open-Unemployment and Regional The result of this research confirms that unemployment rate has negative effect on the development implementation since it can cause regional which is – 0.00471. This coefficient implies that when the open followed be regional inequality reduction for 0.000471 or 0.005 percent. The value of open-unemployment’s coefficient which shows unemployment problem is not the main factor that can make worst economic condition in Eastern Region of Indonesia because it does break the tolerable limit defined by the local government. However, the government should monitor and control the rate of the open 30.00 35.00 40.00 45.00 50.00 55.00 60.00 2001 2002 Journal of Economics and Sustainable Development 2855 (Online) 82 inequality in Indonesia by using Williamson’s Index during 1968 1993. The conclusion supports Williamson’s hypothesis (1965) which refers to Kuznets’ hypothesis which mentions that during the initial stage of economic development, it occurs disparities among several regions; yet, as the economic development gets more and more advanced, the inequality narrower. Furthermore, the study conducted by Sutarno and Kuncoro (2007) in Banyumas Regency during 1993 2000 using Williamson’s Index resembles Inverted-U of Kuznets’ hypothesis. The study finds that during initial gets worst; however, for the next stages, the inequality decreases and in particular time, which in turn will reduce again. Population Growth and Regional Inequality result confirms that population growth has negative effect toward regional inequality coefficient of population growth which shows negative 0.0086870. The coefficient implies that when the population decreases, it will improve regional inequality for 0.0086870 or 0.01 percent. On the other hand, it the inequality. The number of population in the Eastern Region of Indonesia until 2010 is 35,550,800 million. Compared to the stern Region of Indonesia is categorized in to a region which has relatively small number of population; therefore, it affects the advancement or the development of regional economic that cause This research result has proven that population growth has negative relationship with regional However, this conclusion cannot be taken as the basic consideration since in the test of significance, the relationship is not significant at 5% of α. Population, other than its quantity, is also perceived more from its quality related to the education level or skill. This causes non significant relationship. Education Participation and Regional Inequality The research result confirms that education participation has positive effect that is able to improve regional . It is verified by the coefficient of education participation which shows positive 0.001903 and significant at α=1%. The coefficient of education participation implies that when the education participation , it will cause on the regional inequality improvement. On the other hand, it the education participation inequality. Figure 5 Education Participation Rate and Regional Inequality in Eastern Region of Indonesia, 2001-2010 Source: Indonesia Statistic, 2001-2010 Figure 5 presents positive relationship between education participation and regional inequality the education participation is higher, it results in higher regional inequality. Nevertheless, the relat between the two variables can be negative, since at particular period, the education participation is able to reduce (for instance, in 2004 until 2010) that is indicated from the distance between education gets wider from the regional inequality’s graph. It means that in particular period of time, with the possessed education level, it can reduce regional inequality in Eastern Region of Indonesia. This condition highly depends on the local or provincial government’s policy. Unemployment and Regional Inequality The result of this research confirms that unemployment rate has negative effect on the development implementation since it can cause regional inequality. It is showed by the coefficient of unemploy 0.00471. This coefficient implies that when the open-unemployment rate decreases, it will be reduction for 0.000471 or 0.005 percent. unemployment’s coefficient which shows -0.005 percent is relatively low. It indicates that unemployment problem is not the main factor that can make worst economic condition in Eastern Region of Indonesia because it does break the tolerable limit defined by the local government. However, the government uld monitor and control the rate of the open-unemployment because it can be the source of severe fault on the 2003 2004 2005 2006 2007 2008 2009 2010 www.iiste.org in Indonesia by using Williamson’s Index during 1968 – 1983 and 1993. The conclusion supports Williamson’s hypothesis (1965) which refers to Kuznets’ hypothesis which mentions that during the initial stage of economic development, it occurs disparities among several inequality will get narrower and narrower. Furthermore, the study conducted by Sutarno and Kuncoro (2007) in Banyumas Regency during 1993- study finds that during initial decreases and in particular time, inequality. It is proven by the coefficient of population growth which shows negative 0.0086870. The coefficient implies that when the for 0.0086870 or 0.01 percent. On the other hand, it the The number of population in the Eastern Region of Indonesia until 2010 is 35,550,800 million. Compared to the stern Region of Indonesia is categorized in to a region which has relatively small number of population; therefore, it affects the advancement or the development of regional economic that cause population growth has negative relationship with regional inequality. However, this conclusion cannot be taken as the basic consideration since in the test of significance, the y, is also perceived more from its t is able to improve regional . It is verified by the coefficient of education participation which shows positive 0.001903 and significant at α=1%. The coefficient of education participation implies that when the education participation improvement. On the other hand, it the education participation inequality. It means that as . Nevertheless, the relationship between the two variables can be negative, since at particular period, the education participation is able to reduce (for instance, in 2004 until 2010) that is indicated from the distance between education ’s graph. It means that in particular period of time, in Eastern Region of Indonesia. This The result of this research confirms that unemployment rate has negative effect on the development . It is showed by the coefficient of unemployment rate unemployment rate decreases, it will be nt is relatively low. It indicates that unemployment problem is not the main factor that can make worst economic condition in Eastern Region of Indonesia because it does break the tolerable limit defined by the local government. However, the government unemployment because it can be the source of severe fault on the EPR RI
  • 10. Journal of Economics and Sustainable Development www.iiste.org ISSN 2222-1700 (Paper) ISSN 2222-2855 (Online) Vol.4, No.10, 2013 83 development to be worst in the Eastern Region of Indonesia. This is also confirmed by its probability level which is not significant at α = 5%. 5.6. Investment Rate and Regional Inequality Based on research result related to the relationship between investment rate and regional inequality, it shows that investment rate negatively affects regional inequality. This finding is confirmed by the coefficient of investment rate which is -0.139412 and significant at probability level of α=1%. The value implies that when the investment rate decreases, it improves regional inequality for 0.1393412 or 0.14 percent. On the contrary, if the investment rate increases, it reduces regional inequality as much as the coefficient value. Though the relationship between the two variables is negative significant, its role in regional inequality reduction is relatively low just like displayed in its coefficient. Low investment rate is affected by several factors. The first is interest rate; interest rate is an important factor that can stimulate investment since most of investment is financed through bank loan. If the interest rate is high, it reduces investor’s intention to borrow capital from bank. The second is the low income per capita as the reflection of the society’s purchase power. The third is the condition of facilities and infrastructures that provide less support on investment activities. Fourth, the bureaucracy of approval system burdens the investor since it is too long and complicated. Fifth, the low human resource in accessing technology development related to investment matters and interests. The sixth is unstable political and security condition that much affect the investor in making investment decision. 6. Conclusion and Suggestion 6.1. Conclusion Based on the research result, it concludes that: 1. Fiscal decentralization is not able to reduce regional inequality in Eastern Region of Indonesia due to the allocation of local government’s budget mostly is not dedicated to public service matters but for governmental matters such as: salary, official travel, and office appliances/supplies. 2. Related to the utilization of control variable: first, population growth and open-unemployment rate does have an effect on improving regional inequality; second, economic growth, education participation, and investment rate are able to reduce regional inequality. 3. The occurrence of economic patter’s change in Eastern Region of Indonesia from traditional pattern to modern pattern is reflected on the Kuznets’ Inverted-U hypothesis confirmation. 4. Fiscal decentralization policy has run in about ten years; however, the effort to achieve independent local government is not yet on the expected target. 6.2. Suggestion 1. It needs efficient local budget and income management that meet good governance values. It means that budget allocation intended to finance local development activities should consider priority scale which truly has implication on the refinement and improvement of society’s wealth. 2. To encourage economic growth and reduce regional inequality, government needs to promote development acceleration in strategic regions which have potential to develop in advance by arranging partnership opportunity with private sectors to that it will be able to develop the disadvantaged regions. REFERENCES Akai, Nobuo. dan Sakata, M., 2005. Fiscal Decentralization Commitment and Regional Inequality Evidence from State-Level Cross Section Data for the U.S., Faculty of Economic University of Tokyo. Bonet, Jaeme, 2006. Fiscal Decentralization and Regional Income Disparities: Evidence from the Colombian Experience, JEL Classification H77, O18, R11, R58 Canaleta, C. Gil, Pedro Pascual A and Manuel R. G. 2004. Regional Economic Disparities and Decentralization. Urban Studies, Vol. 41, No. 1, 71-94 Kim, Euijune, Sung Woong Hong, Soo Jung Ha. 2003. Impacts of national development and decentralization policies on regional income disparity in Korea. The Annals Regional Science (2003) 37:79–91 Kuncoro, Mudrajad. 2003. Ekonomi Pembangunan: Teori, Masalah, dan Kebijakan. Edisi Ketiga. Penerbit UUP AMP YKPN, Yoyakarta. Lessmann, Christian, 2006. Fiscal Decentralization and Regional Disparity: A Panel Data Approach for OECD Countries. CESifo Working Paper No. 25, JEL Code: H72, H77, R11, R50. Neuman, W. Lawrence. 2006. Social Research Methods: Qualitative and Quantitative Approaches. Sixth Edition, Pearson International Edition,USA Nachrowi, Nachrowi D and Hardius Usman, 2006. Popular and practical approach to Econometrics: financial and Economic Analysis, the Agency Publisher of Faculty of Economics, University of Indonesia, Jakarta Oates, Wallace E., 1993. Fiscal Decentralization and Economic Development. National Tax Journal, LXVI (2):
  • 11. Journal of Economics and Sustainable Development www.iiste.org ISSN 2222-1700 (Paper) ISSN 2222-2855 (Online) Vol.4, No.10, 2013 84 237-34 Oates, Wallace E., 1999. An Essy on Fiscal Federalism, Journal of Economic Literature, Vol. 37. No. 3. Pp, 1120 - 1149 Rodden, J. 2002. The dilemma of fiscal federalism: Grants and fiscal performances around the world. American Journal of Political Science. 46(3): 670–687 Rodríguez-Pose, Andrés and Anne Krøijer, 2009. Fiscal Decentralization and Economic Growth in Central and Eastern Europe. Growth and Change, Vol. 40 No. 3, pp. 387–417 Shah, A. 1997. Fiscal Federalism and Macroeconomic Governance: For Better or for Worse. The World Bank, Washington, District of Columbia Shankar, Radja and Anwar Shah. 2003. Bridging the Economic Divide Within Countries: A Scorecard on the Performance of Regional Policies in Reducing Regional Income Disparities, World Development. Vol. 31, No. 8, pp. 1421–1441 Tanzi, Vito. 2005. The Economic Role Of The State In The 21st Century. Cato Journal. Vol. 25, No. 3. Copyright © Cato Institute. All rights reserved. White, R and P Smoke. 2005. East Asia Decentralizes. In East Asia Decentralizes, P Smoke and R White (eds), Washington DC: World Bank. Widyanto, Iman. 2008. Fiscal Decentralization and Indonesia Regional Income Disparity (1994-2004). Jurnal Keuangan Publik. Vol. 5 No. 1 Hal. 19-53
  • 12. This academic article was published by The International Institute for Science, Technology and Education (IISTE). The IISTE is a pioneer in the Open Access Publishing service based in the U.S. and Europe. The aim of the institute is Accelerating Global Knowledge Sharing. More information about the publisher can be found in the IISTE’s homepage: http://www.iiste.org CALL FOR PAPERS The IISTE is currently hosting more than 30 peer-reviewed academic journals and collaborating with academic institutions around the world. There’s no deadline for submission. Prospective authors of IISTE journals can find the submission instruction on the following page: http://www.iiste.org/Journals/ The IISTE editorial team promises to the review and publish all the qualified submissions in a fast manner. All the journals articles are available online to the readers all over the world without financial, legal, or technical barriers other than those inseparable from gaining access to the internet itself. Printed version of the journals is also available upon request of readers and authors. IISTE Knowledge Sharing Partners EBSCO, Index Copernicus, Ulrich's Periodicals Directory, JournalTOCS, PKP Open Archives Harvester, Bielefeld Academic Search Engine, Elektronische Zeitschriftenbibliothek EZB, Open J-Gate, OCLC WorldCat, Universe Digtial Library , NewJour, Google Scholar