SlideShare a Scribd company logo
1 of 1
Download to read offline
Monthly fund report March 31, 2012
NAV (30/12/2016)
8.53 m
2.18%
Inception date
ISIN Code FR 001 108 91 92
Subscription fee 0 - 2% max
Redemption fee None
Management fee Part A : 0.8% Part B : 1.1%
Amount per share EUR 1.000
Currency Euro
Auditor PWC - SELLAM
Custodian RBC IS
Redemption Daily
Important Information
daily cut-off time is 11:00AM
Available for fund execution on HSBC fast
BRYAN GARNIER ASSET MANAGEMENT SA
26 avenue des Champs-Elysées 75008 Paris
Tel : +33 1 56 68 75 82 Bertrand VALTON + 33 1 56 68 75 48
www.bryangarnier-am.fr
September 16, 2011
Eonia -0,03% -0,09% -0,32%
Subscription/Redemption
-0,32%
CHARACTERISTICS
-0,33%
8,40%4,15% 4,15%
CONTACT
0,24%
GEOGRAPHIC DISTRIBUTIONRATING DISTRIBUTION
EVOLUTION & EXPOSURE
- The Fund may invest all of its net assets on money market
instruments and bonds issued by public or private entities rated
"Investment Grade" (with a minimum rating BBB-) and may invest up
to 50% max of net assets in "Not Rated" and speculative bonds ("Non-
Investment Grade").
- All bonds are denominated in Euro.
- The overall bond risk is being actively managed within a sensitivity
range between 0 and 3.
- Emphasis on (non-financial) corporate bonds.
SECTOR DISTRIBUTION
Adriaan Klop
He managed alternative investments at ABP Pension
Fund in Amsterdam from 2001. From 1991 to 2001
Adriaan worked for Banque CPR (an affiliate of Crédit
Agricole group) and its subsidiaries, where he headed
the bank’s European Bond portfolio. Before joining
CPR, Adriaan worked in Amsterdam for James Capel
(now HSBC Securities), as Head of Economic Research
from 1988 to 1991, and for Eduard de Graaff (part of
the Achmea Insurance Group) as a Fixed Income
Analyst from 1984 to 1988.
Morningstar Rating (3 years) :
Category : "EUR Corporate Bond - Short Term"
PERFORMANCE
1 month 3 Years
UCITS fund authorised to be offered in FRANCE and ITALY
Adriaan is independent
investment advisor of the
fund since april 2016. He was
Chief Investment Officer at
BGAM.
Before joining Bryan Garnier in 2006, Adriaan advised
institutional investors on asset allocation and
manager selection from 2003.
1 Year
Bryan Garnier Credit Fund gained 0.78% in December, ending the year 2016 with a performance of 4.15%. Since inception
(September 2011) the short duration fund has produced +27.38% cumulative return, which equates to 4.77% annualized
performance (Eonia 0.05%) with 2.18% volatility. The fund duration is 2.52 years and its average yield is 1.42% (-53bp from
November).
Slowing growth of the world economy, devaluation of the Chinese currency, commodity prices spiralling down and geopolitical
tensions counted among factors that caused credit spreads to widen in the first half of the year. However, stubbornly low inflation
coupled with anaemic growth, high government debt and still high unemployment in the Eurozone were behind further monetary
stimulus of the European Central Bank and caused interest rates on the highest quality government bonds in the EZ to fall deep into
negative territory. This vigorous approach of the ECB helped to counter the effect of rising rates in the US, but some spread widening
on peripheral EZ countries including Italy and Portugal could not be fully avoided. Credit risk as measured by the Crossover index
reached a high of nearly 500bp in the first half of the year. But the index ended 2016 much lower at 287bp, 26bp less than a year
before, on the back of some improved confidence in the economic outlook, led by the US and by rising equity and commodity
markets. The manager’s stance of staying long the credit curve within the confines of the fund’s limits and objectives, while only
partially hedging interest rate risk have paid off, has reinforced the fund's top position amongst peers.
At the end of the month, exposure to fixed income Investment Grade decreased by 3.6 points to 51.9%, High-Yield and Not Rated
Bonds increased by 3.9 points to 48.1%. Hybrid bonds exposure increased by 1.7 points to 11.6%. Cash exposure was 1,1%. The
interest rate hedge was reduced by 23.3 points to -12.5%.
In December, contributions to the performance from bond investments were as follows: Investment-Grade gained 0.40%, High-Yield
and Not Rated 0.56%. The hedge book contribution was -0.11%. Among individual bonds, the 5 main positive contributions to the
monthly performance were SALINI IMPREGILO at 9bp, LOUIS DREYFUS and TELECOM ITALIA at 8bp, FAURECIA and FIAT for 7bp.
There were no negative contributions.
The manager positions the fund in order to benefit from a scenario whereby interest rates stay low for a prolonged period in Europe.
The QE program of the ECB is benefitting credit and corporate bonds. The inclusion of corporate bonds in QE is underpinning the
attraction of Bryan Garnier Credit Fund in a negative government bond yield environment. Occasionally credit exposure is reduced
under adverse market conditions. Interest rate exposure is hedged by derivatives on expensive government bonds including those of
Germany. The duration of this (negative) exposure decreased by 0.47 years to -0.57; the weighted average yield of the underlying
government bonds of this position is -0.09% and therefore the hedge adds 0.09% to the fund yield. Duration of the bond portfolio
was reduced to 3.1 years; its average yield is 1.33%. Fund duration was slightly increased at 2.52 years. Fund yield is 1.42% (vs 1.95%
in November).
Bryan Garnier Credit Fund 0,78%
3 months YTD
Part B : 1 093.80 EUR
Part A : 1 273.77 EUR
Total Assets
Annualized Volatility
0%
20%
40%
60%
80%
100%
120%
Investment Grade Exposure Non-Investment Grade Excess Cash & Investment Funds
0% 5% 10% 15% 20%
Avg. Other Sectors
United States
Denmark
Netherlands
Spain
Czech
Portugal
France
Germany`
Italy
0% 20% 40%
HY & NR
BBB/BBB-
AAA/BBB+
0% 5% 10% 15% 20%
Avg. Other sectors
Telecommunication
Construction
Oil & Gas
Real Estate
Industrial Gds. & Serv.
Automobiles
Utilities
BRYAN GARNIER CREDIT FUND
Monthly Fund Report December 31st 2016
970
1020
1070
1120
1170
1220
1270
NAV Bryan Garnier Credit Fund
EONIA
10 days moving average

More Related Content

What's hot

Daily Forex Technical Analysis Report - January 07, 2021
Daily Forex Technical Analysis Report - January 07, 2021Daily Forex Technical Analysis Report - January 07, 2021
Daily Forex Technical Analysis Report - January 07, 2021TPGlobalFX
 
FIRC Fixed Inocme, Rates, and Credit
FIRC Fixed Inocme, Rates, and CreditFIRC Fixed Inocme, Rates, and Credit
FIRC Fixed Inocme, Rates, and CreditMinyanville Media
 
Presentation cfa final version
Presentation cfa final versionPresentation cfa final version
Presentation cfa final versionJohn Kim
 
Dynamic fx presentation slide
Dynamic fx presentation slideDynamic fx presentation slide
Dynamic fx presentation slideanikinder
 
Daily Forex Technical Analysis Report - January 12, 2021
Daily Forex Technical Analysis Report - January 12, 2021Daily Forex Technical Analysis Report - January 12, 2021
Daily Forex Technical Analysis Report - January 12, 2021TPGlobalFX
 
Weekly Market Commentary, April 23, 2012
Weekly Market Commentary, April 23, 2012Weekly Market Commentary, April 23, 2012
Weekly Market Commentary, April 23, 2012vilord
 
Fx Investment Overview October2009
Fx Investment Overview October2009Fx Investment Overview October2009
Fx Investment Overview October2009Francesco D'Antonio
 
Daily Forex Technical Analysis Report - June 24, 2020
Daily Forex Technical Analysis Report - June 24, 2020Daily Forex Technical Analysis Report - June 24, 2020
Daily Forex Technical Analysis Report - June 24, 2020TPGlobalFX
 
Daily Forex Technical Analysis Report - July 20, 2020
Daily Forex Technical Analysis Report - July 20, 2020Daily Forex Technical Analysis Report - July 20, 2020
Daily Forex Technical Analysis Report - July 20, 2020TPGlobalFX
 
Daily Forex Technical Analysis Report - November 26, 2020
Daily Forex Technical Analysis Report - November 26, 2020Daily Forex Technical Analysis Report - November 26, 2020
Daily Forex Technical Analysis Report - November 26, 2020TPGlobalFX
 
A Lost Decade For GICs
A Lost Decade For GICsA Lost Decade For GICs
A Lost Decade For GICsrobichaud
 
Rethinking Exposure to Loss
Rethinking Exposure to LossRethinking Exposure to Loss
Rethinking Exposure to LossWindham Labs
 
Risk & Volatility
Risk & VolatilityRisk & Volatility
Risk & VolatilityGreg Ferguson
 
Flexible Equity Euro Long-Short (Market Neutral) strategy_End of January '19
Flexible Equity Euro Long-Short (Market Neutral) strategy_End of January '19Flexible Equity Euro Long-Short (Market Neutral) strategy_End of January '19
Flexible Equity Euro Long-Short (Market Neutral) strategy_End of January '19Giuseppe Piazzolla
 
Daily i forex-report-21-may-2018-by-epic-research
Daily i forex-report-21-may-2018-by-epic-researchDaily i forex-report-21-may-2018-by-epic-research
Daily i forex-report-21-may-2018-by-epic-researchEpic Research
 
2022 Navigate Uncertainty with the Right Asset Allocation
2022 Navigate Uncertainty with the Right Asset Allocation2022 Navigate Uncertainty with the Right Asset Allocation
2022 Navigate Uncertainty with the Right Asset AllocationQuantum Mutual Fund
 
DAILY FOREX REPORT FOR 31 DEC 2014
DAILY FOREX REPORT FOR 31 DEC 2014DAILY FOREX REPORT FOR 31 DEC 2014
DAILY FOREX REPORT FOR 31 DEC 2014Reena Sharma
 
Mansfield Capital Brochure Ppt Mar2009 1110
Mansfield Capital Brochure Ppt Mar2009 1110Mansfield Capital Brochure Ppt Mar2009 1110
Mansfield Capital Brochure Ppt Mar2009 1110Trader1mm
 

What's hot (20)

Daily Forex Technical Analysis Report - January 07, 2021
Daily Forex Technical Analysis Report - January 07, 2021Daily Forex Technical Analysis Report - January 07, 2021
Daily Forex Technical Analysis Report - January 07, 2021
 
FIRC Fixed Inocme, Rates, and Credit
FIRC Fixed Inocme, Rates, and CreditFIRC Fixed Inocme, Rates, and Credit
FIRC Fixed Inocme, Rates, and Credit
 
Presentation cfa final version
Presentation cfa final versionPresentation cfa final version
Presentation cfa final version
 
Dynamic fx presentation slide
Dynamic fx presentation slideDynamic fx presentation slide
Dynamic fx presentation slide
 
Daily Forex Technical Analysis Report - January 12, 2021
Daily Forex Technical Analysis Report - January 12, 2021Daily Forex Technical Analysis Report - January 12, 2021
Daily Forex Technical Analysis Report - January 12, 2021
 
Weekly Market Commentary, April 23, 2012
Weekly Market Commentary, April 23, 2012Weekly Market Commentary, April 23, 2012
Weekly Market Commentary, April 23, 2012
 
Fx Investment Overview October2009
Fx Investment Overview October2009Fx Investment Overview October2009
Fx Investment Overview October2009
 
Daily Forex Technical Analysis Report - June 24, 2020
Daily Forex Technical Analysis Report - June 24, 2020Daily Forex Technical Analysis Report - June 24, 2020
Daily Forex Technical Analysis Report - June 24, 2020
 
Daily Forex Technical Analysis Report - July 20, 2020
Daily Forex Technical Analysis Report - July 20, 2020Daily Forex Technical Analysis Report - July 20, 2020
Daily Forex Technical Analysis Report - July 20, 2020
 
Daily Forex Technical Analysis Report - November 26, 2020
Daily Forex Technical Analysis Report - November 26, 2020Daily Forex Technical Analysis Report - November 26, 2020
Daily Forex Technical Analysis Report - November 26, 2020
 
A Lost Decade For GICs
A Lost Decade For GICsA Lost Decade For GICs
A Lost Decade For GICs
 
Rethinking Exposure to Loss
Rethinking Exposure to LossRethinking Exposure to Loss
Rethinking Exposure to Loss
 
Risk & Volatility
Risk & VolatilityRisk & Volatility
Risk & Volatility
 
Flexible Equity Euro Long-Short (Market Neutral) strategy_End of January '19
Flexible Equity Euro Long-Short (Market Neutral) strategy_End of January '19Flexible Equity Euro Long-Short (Market Neutral) strategy_End of January '19
Flexible Equity Euro Long-Short (Market Neutral) strategy_End of January '19
 
Daily i forex-report-21-may-2018-by-epic-research
Daily i forex-report-21-may-2018-by-epic-researchDaily i forex-report-21-may-2018-by-epic-research
Daily i forex-report-21-may-2018-by-epic-research
 
2022 Navigate Uncertainty with the Right Asset Allocation
2022 Navigate Uncertainty with the Right Asset Allocation2022 Navigate Uncertainty with the Right Asset Allocation
2022 Navigate Uncertainty with the Right Asset Allocation
 
DAILY FOREX REPORT FOR 31 DEC 2014
DAILY FOREX REPORT FOR 31 DEC 2014DAILY FOREX REPORT FOR 31 DEC 2014
DAILY FOREX REPORT FOR 31 DEC 2014
 
Stanlib Group
Stanlib GroupStanlib Group
Stanlib Group
 
Mansfield Capital Brochure Ppt Mar2009 1110
Mansfield Capital Brochure Ppt Mar2009 1110Mansfield Capital Brochure Ppt Mar2009 1110
Mansfield Capital Brochure Ppt Mar2009 1110
 
Official website presentation 16.07.2014
Official website presentation 16.07.2014Official website presentation 16.07.2014
Official website presentation 16.07.2014
 

Similar to bgcreditfund-reporting-December-2016-EN

Financial Report January- June 2013
Financial Report January- June 2013Financial Report January- June 2013
Financial Report January- June 2013BANCO SANTANDER
 
Presentación Nordea: Funds Experience 2016
Presentación Nordea: Funds Experience 2016Presentación Nordea: Funds Experience 2016
Presentación Nordea: Funds Experience 2016Rankia
 
Swmcef dec 2013_ucits_fund
Swmcef dec 2013_ucits_fundSwmcef dec 2013_ucits_fund
Swmcef dec 2013_ucits_fundFrank Ragol
 
Atadius Market Monitor - Sept
Atadius Market Monitor - SeptAtadius Market Monitor - Sept
Atadius Market Monitor - Septjspeltz
 
6M results 2012
6M results 20126M results 2012
6M results 2012Ageas
 
2015_05_07_UCG_Beware the Underdog
2015_05_07_UCG_Beware the Underdog2015_05_07_UCG_Beware the Underdog
2015_05_07_UCG_Beware the UnderdogAndrea Filtri
 
Monthly Systematic Product Review - Jan 2015
Monthly Systematic Product Review - Jan 2015Monthly Systematic Product Review - Jan 2015
Monthly Systematic Product Review - Jan 2015Christos Spanos
 
Elo’s return on investment 1.9 per cent – burdened by uncertainty, the first...
Elo’s return on investment  1.9 per cent – burdened by uncertainty, the first...Elo’s return on investment  1.9 per cent – burdened by uncertainty, the first...
Elo’s return on investment 1.9 per cent – burdened by uncertainty, the first...Työeläkeyhtiö Elo
 
Deutsche EuroShop | Half-Year Financial Report 2020
Deutsche EuroShop | Half-Year Financial Report 2020Deutsche EuroShop | Half-Year Financial Report 2020
Deutsche EuroShop | Half-Year Financial Report 2020Deutsche EuroShop AG
 
Commentary - Top 5 Europe Based Multiline Insurance Groups 09Sep2016
Commentary - Top 5 Europe Based Multiline Insurance Groups 09Sep2016Commentary - Top 5 Europe Based Multiline Insurance Groups 09Sep2016
Commentary - Top 5 Europe Based Multiline Insurance Groups 09Sep2016Linas Grigali?nas
 
Full year results 2011
Full year results 2011Full year results 2011
Full year results 2011Ageas
 
Deutsche EuroShop | Half-Year Financial Report 2022
Deutsche EuroShop | Half-Year Financial Report 2022Deutsche EuroShop | Half-Year Financial Report 2022
Deutsche EuroShop | Half-Year Financial Report 2022Deutsche EuroShop AG
 
VFB - Dag van de tips (2010)
VFB - Dag van de tips (2010)VFB - Dag van de tips (2010)
VFB - Dag van de tips (2010)Ageas
 

Similar to bgcreditfund-reporting-December-2016-EN (20)

Financial Report January- June 2013
Financial Report January- June 2013Financial Report January- June 2013
Financial Report January- June 2013
 
Financial Report 1Q2013
Financial Report 1Q2013Financial Report 1Q2013
Financial Report 1Q2013
 
Interim report 1 January – 30 September 2020
Interim report 1 January – 30 September 2020Interim report 1 January – 30 September 2020
Interim report 1 January – 30 September 2020
 
Presentación Nordea: Funds Experience 2016
Presentación Nordea: Funds Experience 2016Presentación Nordea: Funds Experience 2016
Presentación Nordea: Funds Experience 2016
 
Swmcef dec 2013_ucits_fund
Swmcef dec 2013_ucits_fundSwmcef dec 2013_ucits_fund
Swmcef dec 2013_ucits_fund
 
Atadius Market Monitor - Sept
Atadius Market Monitor - SeptAtadius Market Monitor - Sept
Atadius Market Monitor - Sept
 
6M results 2012
6M results 20126M results 2012
6M results 2012
 
Interim report 1 January – 30 June 2020
Interim report 1 January – 30 June 2020Interim report 1 January – 30 June 2020
Interim report 1 January – 30 June 2020
 
2015_05_07_UCG_Beware the Underdog
2015_05_07_UCG_Beware the Underdog2015_05_07_UCG_Beware the Underdog
2015_05_07_UCG_Beware the Underdog
 
Monthly Systematic Product Review - Jan 2015
Monthly Systematic Product Review - Jan 2015Monthly Systematic Product Review - Jan 2015
Monthly Systematic Product Review - Jan 2015
 
Elo’s return on investment 1.9 per cent – burdened by uncertainty, the first...
Elo’s return on investment  1.9 per cent – burdened by uncertainty, the first...Elo’s return on investment  1.9 per cent – burdened by uncertainty, the first...
Elo’s return on investment 1.9 per cent – burdened by uncertainty, the first...
 
Financial Report 3Q13
Financial Report 3Q13Financial Report 3Q13
Financial Report 3Q13
 
Deutsche EuroShop | Half-Year Financial Report 2020
Deutsche EuroShop | Half-Year Financial Report 2020Deutsche EuroShop | Half-Year Financial Report 2020
Deutsche EuroShop | Half-Year Financial Report 2020
 
Deutsche EuroShop | Magazine 2021
Deutsche EuroShop | Magazine 2021Deutsche EuroShop | Magazine 2021
Deutsche EuroShop | Magazine 2021
 
Commentary - Top 5 Europe Based Multiline Insurance Groups 09Sep2016
Commentary - Top 5 Europe Based Multiline Insurance Groups 09Sep2016Commentary - Top 5 Europe Based Multiline Insurance Groups 09Sep2016
Commentary - Top 5 Europe Based Multiline Insurance Groups 09Sep2016
 
credit-suisse Press Release
credit-suisse Press Releasecredit-suisse Press Release
credit-suisse Press Release
 
Full year results 2011
Full year results 2011Full year results 2011
Full year results 2011
 
Deutsche EuroShop | Half-Year Financial Report 2022
Deutsche EuroShop | Half-Year Financial Report 2022Deutsche EuroShop | Half-Year Financial Report 2022
Deutsche EuroShop | Half-Year Financial Report 2022
 
VFB - Dag van de tips (2010)
VFB - Dag van de tips (2010)VFB - Dag van de tips (2010)
VFB - Dag van de tips (2010)
 
Allianz: Group Financial Results 2013
Allianz: Group Financial Results 2013Allianz: Group Financial Results 2013
Allianz: Group Financial Results 2013
 

bgcreditfund-reporting-December-2016-EN

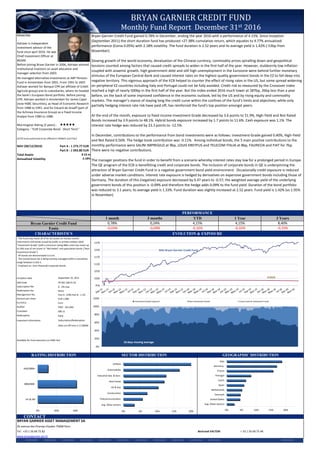
  • 1. Monthly fund report March 31, 2012 NAV (30/12/2016) 8.53 m 2.18% Inception date ISIN Code FR 001 108 91 92 Subscription fee 0 - 2% max Redemption fee None Management fee Part A : 0.8% Part B : 1.1% Amount per share EUR 1.000 Currency Euro Auditor PWC - SELLAM Custodian RBC IS Redemption Daily Important Information daily cut-off time is 11:00AM Available for fund execution on HSBC fast BRYAN GARNIER ASSET MANAGEMENT SA 26 avenue des Champs-Elysées 75008 Paris Tel : +33 1 56 68 75 82 Bertrand VALTON + 33 1 56 68 75 48 www.bryangarnier-am.fr September 16, 2011 Eonia -0,03% -0,09% -0,32% Subscription/Redemption -0,32% CHARACTERISTICS -0,33% 8,40%4,15% 4,15% CONTACT 0,24% GEOGRAPHIC DISTRIBUTIONRATING DISTRIBUTION EVOLUTION & EXPOSURE - The Fund may invest all of its net assets on money market instruments and bonds issued by public or private entities rated "Investment Grade" (with a minimum rating BBB-) and may invest up to 50% max of net assets in "Not Rated" and speculative bonds ("Non- Investment Grade"). - All bonds are denominated in Euro. - The overall bond risk is being actively managed within a sensitivity range between 0 and 3. - Emphasis on (non-financial) corporate bonds. SECTOR DISTRIBUTION Adriaan Klop He managed alternative investments at ABP Pension Fund in Amsterdam from 2001. From 1991 to 2001 Adriaan worked for Banque CPR (an affiliate of Crédit Agricole group) and its subsidiaries, where he headed the bank’s European Bond portfolio. Before joining CPR, Adriaan worked in Amsterdam for James Capel (now HSBC Securities), as Head of Economic Research from 1988 to 1991, and for Eduard de Graaff (part of the Achmea Insurance Group) as a Fixed Income Analyst from 1984 to 1988. Morningstar Rating (3 years) : Category : "EUR Corporate Bond - Short Term" PERFORMANCE 1 month 3 Years UCITS fund authorised to be offered in FRANCE and ITALY Adriaan is independent investment advisor of the fund since april 2016. He was Chief Investment Officer at BGAM. Before joining Bryan Garnier in 2006, Adriaan advised institutional investors on asset allocation and manager selection from 2003. 1 Year Bryan Garnier Credit Fund gained 0.78% in December, ending the year 2016 with a performance of 4.15%. Since inception (September 2011) the short duration fund has produced +27.38% cumulative return, which equates to 4.77% annualized performance (Eonia 0.05%) with 2.18% volatility. The fund duration is 2.52 years and its average yield is 1.42% (-53bp from November). Slowing growth of the world economy, devaluation of the Chinese currency, commodity prices spiralling down and geopolitical tensions counted among factors that caused credit spreads to widen in the first half of the year. However, stubbornly low inflation coupled with anaemic growth, high government debt and still high unemployment in the Eurozone were behind further monetary stimulus of the European Central Bank and caused interest rates on the highest quality government bonds in the EZ to fall deep into negative territory. This vigorous approach of the ECB helped to counter the effect of rising rates in the US, but some spread widening on peripheral EZ countries including Italy and Portugal could not be fully avoided. Credit risk as measured by the Crossover index reached a high of nearly 500bp in the first half of the year. But the index ended 2016 much lower at 287bp, 26bp less than a year before, on the back of some improved confidence in the economic outlook, led by the US and by rising equity and commodity markets. The manager’s stance of staying long the credit curve within the confines of the fund’s limits and objectives, while only partially hedging interest rate risk have paid off, has reinforced the fund's top position amongst peers. At the end of the month, exposure to fixed income Investment Grade decreased by 3.6 points to 51.9%, High-Yield and Not Rated Bonds increased by 3.9 points to 48.1%. Hybrid bonds exposure increased by 1.7 points to 11.6%. Cash exposure was 1,1%. The interest rate hedge was reduced by 23.3 points to -12.5%. In December, contributions to the performance from bond investments were as follows: Investment-Grade gained 0.40%, High-Yield and Not Rated 0.56%. The hedge book contribution was -0.11%. Among individual bonds, the 5 main positive contributions to the monthly performance were SALINI IMPREGILO at 9bp, LOUIS DREYFUS and TELECOM ITALIA at 8bp, FAURECIA and FIAT for 7bp. There were no negative contributions. The manager positions the fund in order to benefit from a scenario whereby interest rates stay low for a prolonged period in Europe. The QE program of the ECB is benefitting credit and corporate bonds. The inclusion of corporate bonds in QE is underpinning the attraction of Bryan Garnier Credit Fund in a negative government bond yield environment. Occasionally credit exposure is reduced under adverse market conditions. Interest rate exposure is hedged by derivatives on expensive government bonds including those of Germany. The duration of this (negative) exposure decreased by 0.47 years to -0.57; the weighted average yield of the underlying government bonds of this position is -0.09% and therefore the hedge adds 0.09% to the fund yield. Duration of the bond portfolio was reduced to 3.1 years; its average yield is 1.33%. Fund duration was slightly increased at 2.52 years. Fund yield is 1.42% (vs 1.95% in November). Bryan Garnier Credit Fund 0,78% 3 months YTD Part B : 1 093.80 EUR Part A : 1 273.77 EUR Total Assets Annualized Volatility 0% 20% 40% 60% 80% 100% 120% Investment Grade Exposure Non-Investment Grade Excess Cash & Investment Funds 0% 5% 10% 15% 20% Avg. Other Sectors United States Denmark Netherlands Spain Czech Portugal France Germany` Italy 0% 20% 40% HY & NR BBB/BBB- AAA/BBB+ 0% 5% 10% 15% 20% Avg. Other sectors Telecommunication Construction Oil & Gas Real Estate Industrial Gds. & Serv. Automobiles Utilities BRYAN GARNIER CREDIT FUND Monthly Fund Report December 31st 2016 970 1020 1070 1120 1170 1220 1270 NAV Bryan Garnier Credit Fund EONIA 10 days moving average