The daily analysis report from TP Global FX indicates that the New Zealand dollar is falling notably against major currencies following an unchanged interest rate decision, while most Asian markets are positive and gold prices are at a record high since 2012. Key trends for major currency pairs like USD/JPY, AUD/USD, and EUR/USD are outlined, highlighting resistance and support levels crucial for traders. Additionally, the report emphasizes the risks of forex trading and advises potential investors to seek independent financial advice.


![XAU / [GOLD]USD
REPORTFROM:TPGLOBALFXJUNE,2020
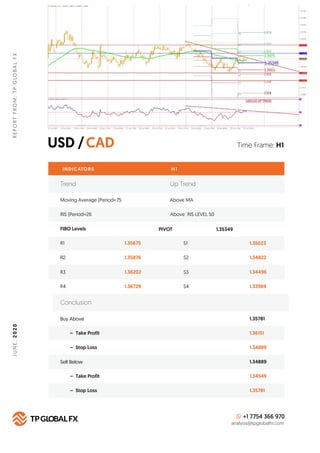
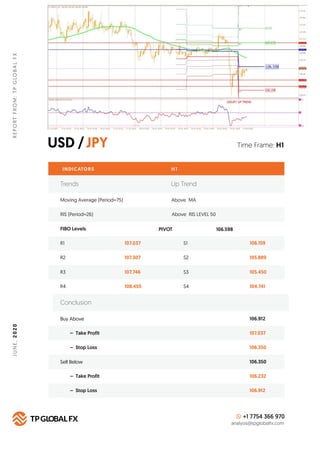
Time Frame: H1
INDICATORS H 1
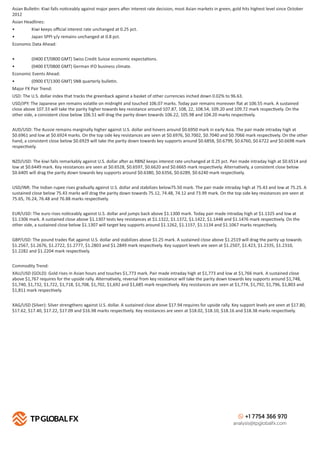
FIBO Levels PIVOT
R1 1770.82 S1 1752.70
Buy Above 1773.82
1779.39
1755.13
1755.13
1749.03
1773.82
– Take Profit
– Stop Loss
Sell Below
– Take Profit
– Stop Loss
R2 1776.43 S2 1747.09
R3 1785.49 S3 1738.03
R4 S4 1723.36
Conclusion
+1 7754 366 970
analysis@tpglobalfx.com
1761.76
Trends Up Trend
Moving Average (Period=75) Above MA
RIS (Period=26) Above RIS LEVEL 50
1800.16](https://image.slidesharecdn.com/dailyanalysisreportjune242020-200624055324/85/Daily-Forex-Technical-Analysis-Report-June-24-2020-8-320.jpg)