Weekly Projects Update - w/e 8th September 2017
•
1 like•443 views

AcuComm's weekly projects update - w/e 8th September 2017. For more information on our latest projects, visit our website: acucomm.net

Recommended
Recommended
More Related Content
What's hot
What's hot (20)
Similar to Weekly Projects Update - w/e 8th September 2017
Similar to Weekly Projects Update - w/e 8th September 2017 (20)
More from AcuComm
Recently uploaded
Recently uploaded (20)
Weekly Projects Update - w/e 8th September 2017
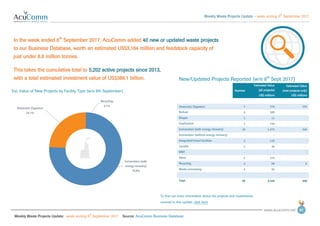
- 1. Weekly Waste Projects Update – week ending 8 th September 2017 Weekly Waste Projects Update: week ending 8 th September 2017 Source: AcuComm Business Database 01 2nd September 2016 New/Updated Projects Reported (w/e 8th Sept 2017) Number Estimated Value (all projects) Estimated Value (new projects only) US$ millionsUS$ millions Anaerobic Digestion 7 276 104 Biofuel 6 599 - Biogas 1 12 - Gasification 1 150 - Incineration (with energy recovery) 10 1,273 326 Incineration (without energy recovery) - - - Integrated/mixed facilities 3 510 - Landfill 2 36 - MBT - - - Other 2 115 - Recycling 4 98 0 Waste processing 4 95 - Total 40 3,164 430 In the week ended 8th September 2017, AcuComm added 40 new or updated waste projects to our Business Database, worth an estimated US$3,164 million and feedstock capacity of just under 8.8 million tonnes. This takes the cumulative total to 5,202 active projects since 2013, with a total estimated investment value of US$389.1 billion. To find out more information about the projects and investments covered in this update, click here Incineration (with energy recovery) 75.8% Anaerobic Digestion 24.1% Recycling 0.1% Est. Value of New Projects by Facility Type (w/e 8th September)
- 2. Weekly Waste Projects Update – week ending 8 th September 2017 Weekly Waste Projects Update: week ending 8 th September 2017 Source: AcuComm Business Database 02 New/Updated Projects Reported (w/e 8th Sept 2017) Number Capacity (tonnes) MW Anaerobic Digestion 7 951,748 18 Biofuel 6 2,824,951 114 Biogas 1 38,816 2 Gasification 1 309,405 45 Incineration (with energy recovery) 10 2,477,366 326 Incineration (without energy recovery) - - - Integrated/mixed facilities 3 877,322 62 Landfill 2 398,549 18 MBT - - - Other 2 74,874 37 Recycling 4 242,487 - Waste processing 4 555,989 - Total 40 8,751,506 621 The total estimated feedstock capacity of projects reported on in the past week is just under 8.8 million tonnes. Biofuel was the largest category, accounting for 2.8 million tonnes, equal to 28.3% of the total. The total estimated power generation from these projects was 621 MW. WtE incineration was the largest category, accounting for 326 MW. Biofuel 32.3% Incineration (with energy recovery) 28.3% Anaerobic Digestion 10.9% Others 28.5% Reported Capacity of Projects by Facility Type (w/e 8th September) To find out more information about the projects and investments covered in this update, click here
- 3. Weekly Waste Projects Update – week ending 8 th September 2017 Weekly Waste Projects Update: week ending 8 th September 2017 Source: AcuComm Business Database 03 New Projects Reported by Waste Types (w/e 8th Sept 2017) Number Capacity (tonnes) MW Animal 1 341,806 - Clinical - - - Construction/Demolition - - - e-Waste - - - Food 5 187,241 8 Gas 1 - 37 Glass - - - Hazardous - - - Heat - - - Industrial - - - Metals - - - MSW 16 3,260,848 268 Oil - - - Organic (general/unspecified) 4 783,076 52 Other - - - Paper - - - Plant biomass (non-waste) 4 2,319,847 99 Plant biomass (waste) 5 1,307,493 64 Plastics - - - Radioactive - - - Rubber - - - Sewage/wastewater 1 136,078 - Wood 3 415,117 93 Total 40 8,751,506 621 MSW was the leading feedstock type reported on in the past week, accounting for an estimated 3.3 million tonnes, or 37.3% of the total. This was followed by general plant biomass matter with 2.3 million tonnes or 26.5%. MSW 37.3% Plant biomass (non- waste) 26.5% Plant biomass (waste) 14.9% Others 21.3% Reported Capacity of Projects by Waste Type (w/e 8th September) To find out more information about the projects and investments covered in this update, click here
- 4. Weekly Waste Projects Update – week ending 8 th September 2017 Weekly Waste Projects Update: week ending 8 th September 2017 Source: AcuComm Business Database 04 New/Updated Projects, Country Coverage, (w/e 8th Sept 2017) Projects USA 9 Australia 5 Canada 4 China 4 Japan 2 France 2 Spain 2 Denmark 2 Greece 2 Others 8 Total 40 The leading country in the past week was the USA, with nine projects reported on. This was followed by Australia with five and Canada/China with four each. 9 5 4 4 2 2 2 2 2 0 0 8 0 1 2 3 4 5 6 7 8 9 10 USA Australia Canada China Japan France Spain Denmark Greece Others Reported Projects by Country (w/e 8th September) To find out more information about the projects and investments covered in this update, click here
- 5. Weekly Waste Projects Update – week ending 8 th September 2017 Weekly Waste Projects Update: week ending 8 th September 2017 Source: AcuComm Business Database 05 Average Project Values by Facility Type US$ millions Anaerobic Digestion 27 Biofuel 116 Biogas 21 Gasification 141 Incineration (with energy recovery) 107 Incineration (without energy recovery) 46 Integrated/mixed facilities 179 Landfill 22 MBT 63 Other 64 Recycling 35 Waste processing 81 All Projects 75 Average Project Values by Feedstock Type US$ millions Animal 18 Clinical 24 Construction/Demolition 7 e-Waste 21 Food 21 Gas 65 Glass 14 Hazardous 58 Heat 37 Industrial 117 Metals 47 MSW 91 Oil 40 Organic (general/unspecified) 84 Other 63 Paper 74 Plant biomass (non-waste) 113 Plant biomass (waste) 77 Plastics 21 Radioactive 606 Rubber 33 Sewage/wastewater 47 Wood 82 All Projects 75 The average active waste project is worth US$75 million. There are naturally wide variations in average project value, due to the size, duration and complexity of different types of project. The figures on this page represent our latest estimates, based on data from 2013 to the current week. To find out more information about the projects and investments covered in this update, click here
- 6. Weekly Waste Projects Update – week ending 8 th September 2017 Weekly Waste Projects Update: week ending 8 th September 2017 Source: AcuComm Business Database 06 Top Five Projects, week ending 8th September 2017, by Estimated Value (US$ millions) Click the flag for more information on each project 1 Spain 271 Development of a waste management centre. 2 Belarus 250 Development of a waste-to-energy incinerator. 3 Canada 212 Upgrading of a biodiesel refinery. 4 China 186 Construction of an MBT & WtE facility. 5 Indonesia 150 Construction of a WtE plant. Top Five Projects, week ending 8th September 2017, by Reported Waste Capacity (tonnes) 1 Denmark 600,000 Construction of a 600,000 tpa biogas plant with five reactors. 2 Belarus 600,000 Development of a waste-to-energy incinerator. 3 Belgium 315,360 Development of a composting facility. 4 China 219,000 Installation of two 300 tpd grate systems. 5 China 200,750 Installation of a 550 tpd grate system. Top Five Projects, week ending 8th September 2017, by Reported Power Generation (MW) 1 Japan 50 Construction of a 50 MW biomass plant. 2 USA 37 Installation of fuel cells at data centres. 3 Switzerland 33 Supply of a 250 tpd combustion line for biomass plant. 4 Australia 24 Construction of a A$60 million biorefinery and biomass plant. 5 Japan 11 Refurbishment of a WtE facility.
- 7. Weekly Waste Projects Update – week ending 8 th September 2017 Weekly Waste Projects Update: week ending 8 th September 2017 Source: AcuComm Business Database 07