1. The students analyzed pollen in honey samples from bee hives at UNC-Pembroke and from a beekeeper in Knightdale to determine pollen abundance and compare foraging between the two locations.
2. They found the Knightdale honey had much higher pollen abundance per 10 grams (121,000 on average) than honeys from UNC-Pembroke hives (33,000 on average), though the reason for the difference is unclear.
3. The Knightdale honey's pollen concentration qualified as "rich" on international standards while UNC-Pembroke honeys were "intermediate," possibly related to the urban vs. rural locations.
Beginners Guide to TikTok for Search - Rachel Pearson - We are Tilt __ Bright...
Pollen in Honey poster final.pptx
1. d
Pollen Abundance in Honey to Tell About Honeybee
Foraging in North Carolina
Eli Hicks1, Hugo Mundo-Jonsson2
1 Spring Hill Middle School, 2 Southeastern Academy
d
Research Questions
Bee pollination is vital to about one-third of the food
consumed by humans. Honey production for
human consumption in the United States is an
additional resource amounting to more than 70
million kilograms annually despite colony collapse
disorder in recent years (e.g., USDA, 2016). We
analyzed pollen in the honey to evaluate how
honeybees forage for honeys from UNC-Pembroke
(UNCP) and the Raleigh area. Pollen abundance
per 10 g in these samples ranges from 25,000
(intermediate by the international standard;
Bogdanov and others, 1999) in UNC-Pembroke
honey to 122,000 (rich pollen abundance) in the
Knightdale honey. We are not sure why the
Knightdale honey was higher than the UNC-
Pembroke honeys but it could be because the
Knightdale was from an urban/suburban
environment whereas UNC-Pembroke is rural.
Location of Honey Samples
Summary
Conclusions
1.What is different among honey bee hives at UNC-
Pembroke and Raleigh? How variable are they?
2. What does the concentration of pollen in honey
mean about the honey ?
3. What is different about each area’s pollen
concentration?
Pollen Extraction and Slide Making
See the notebook for details of the lab processing.
The samples had marked spores added so that the
abundance of pollen per gram of honey can be
determined. Lycopodium clavatum, a fern ally, are
spores not collected by bees. Spores are processed
and pressed into tablets. Lund University (Sweden)
produces these tablets and determined that Batch
3862 averages 19332 spores per 2 tablets (standard
deviation 4.91%). The formula to determine number
of pollen per 10 grams of honey is
(# of pollen grains counted)(# of Lycopodium added)
(# of Lycopodium counted)
Results
Bogdanov S, and others. (1999) Honey quality, methods of analysis and
international regulatory standards: review of the work of the International
honey commission. Mitt. Lebensm. Hyg., 90:108-125.
Bryant, V. (2014) The Basics of Honey Identification: Bee Culture (April issue),
59-63.
Bryant, V. (2018) Melissopalynology: Bee Culture (November issue), 41-45.
Jones, G. D & Bryant, V. M (2014) Pollen studies of east Texas honey.
Palynology, 38: 242-258.
Tschudy, R.H., 1969, The plant kingdom and its palynological representation:
in Tschudy, R.H. and Scott, R.A. (eds.), Aspects of Palynology: Wiley-
Interscience, New York, p. 5-34.
USDA. (2016) Honey. Retrieved from
http://usda.mannlib.cornell.edu/usda/current/Hone/Hone- 03-22-2016.pdf
References
Our Procedure
1. We looked into a microscope at the slides.
2. First we looked down the oculars.
3. We adjusted our focus so we could see the
pollen and Lycopodium clearly.
4. Once that was done we used the movement
knobs on the side of the microscope, which allows
us to look in different directions (up, down, left,
right).
5. We then proceeded to count our pollen and
Lycopodium.
6. When we counted to around 200 pollen grains
we stop our counting.
Methods
General Form of Pollen
Results (Continued)
Figure 2: General pollen types (modified from Tschudy, 1969).
The figure below shows the usual types of flowering plant pollen.
The number of pollen per 10 g of honey is the
standard method to analyzing abundance for
comparison of different honeys. Our samples came
from honeys from three hives in the UNC-Pembroke
(UNCP) Campus Garden and a honey from a
beekeeper in Knightdale near Raleigh. Abundance
per 10 g ranged from about 25,000 pollen/10 g to
122,000/10 g of honey. The Knightdale honey had
higher abundance (average 121,000/10 g) than the
honeys from UNCP hives (average about 33,000/10
g). On the international abundance scale, the
Knightdale is considered “rich”, but the UNCP hives
are “intermediate”.
The reason the Knightdale honey is richer in pollen
than the UNCP hives is unclear, although perhaps it
has something to do with the urban/suburban
environment around the Knightdale location. UNCP
is very rural. We would have to do more work to
understand this.
Figure 1. Location Photos for Honey Samples. UNCP Campus
Garden, note bee hives on right side (left, photo from UNCP Kids
in the Garden project) and Knightdale (right: photo from Google
maps)
From all of the data we collected from Knightdale
and UNCP hives: The two of us looked at different
slides to see if each of us or the slides made a
difference in results. The good news is that our
results are nearly the same for each honey sample.
This means we did similar work.
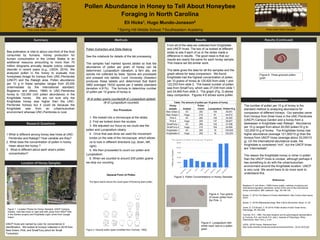
The table gives the data for all the samples and the
graph allows for easy comparison. We found
Knightdale had the highest concentration of pollen
per 10 grams of honey at 120,825 from slide 1 and
122,033 from slide 2. The lowest number of pollen
was from SmallTurq, which was 27,038 from slide 1
and 24,906 from slide 2. The graph (Fig. 3) allows
easy comparison. Figures 4-6 shows some pollen.
Figure 4. Two grains
of clover pollen from
the Pink- 3.
Photo credit: Kaitlin Campbell Photo credit: Kaitlin Campbell
Figure 5. Lycopodium with
trilete mark next to a pollen
grain.
Figure 6: Three-grooved pollen
grain
UNCP hives are named by color for convenience in
identification. We looked at honeys collected in 2018 from
New Green, Pink, and SmallTurq (short for Small
Turquoise).
Table: The amount of pollen per 10 grams of honey
Honey
sample Analyst
Pollen
Count Lycopodium Pollen/10 g
New Green-2 Eli 202 100 39,051
New Green-1 Hugo 210 91 44,612
Pink-3 Eli 200 120 32,220
Pink-4 Hugo 205 137 28,927
SmallTurq-1 Eli 200 143 27,038
SmallTurq-2 Hugo 210 163 24,906
Knightdale-1 Eli 200 16 120,825
Knightdale-2 Hugo 202 16 122,033
Figure 3. Pollen Concentrations in Honey Samples