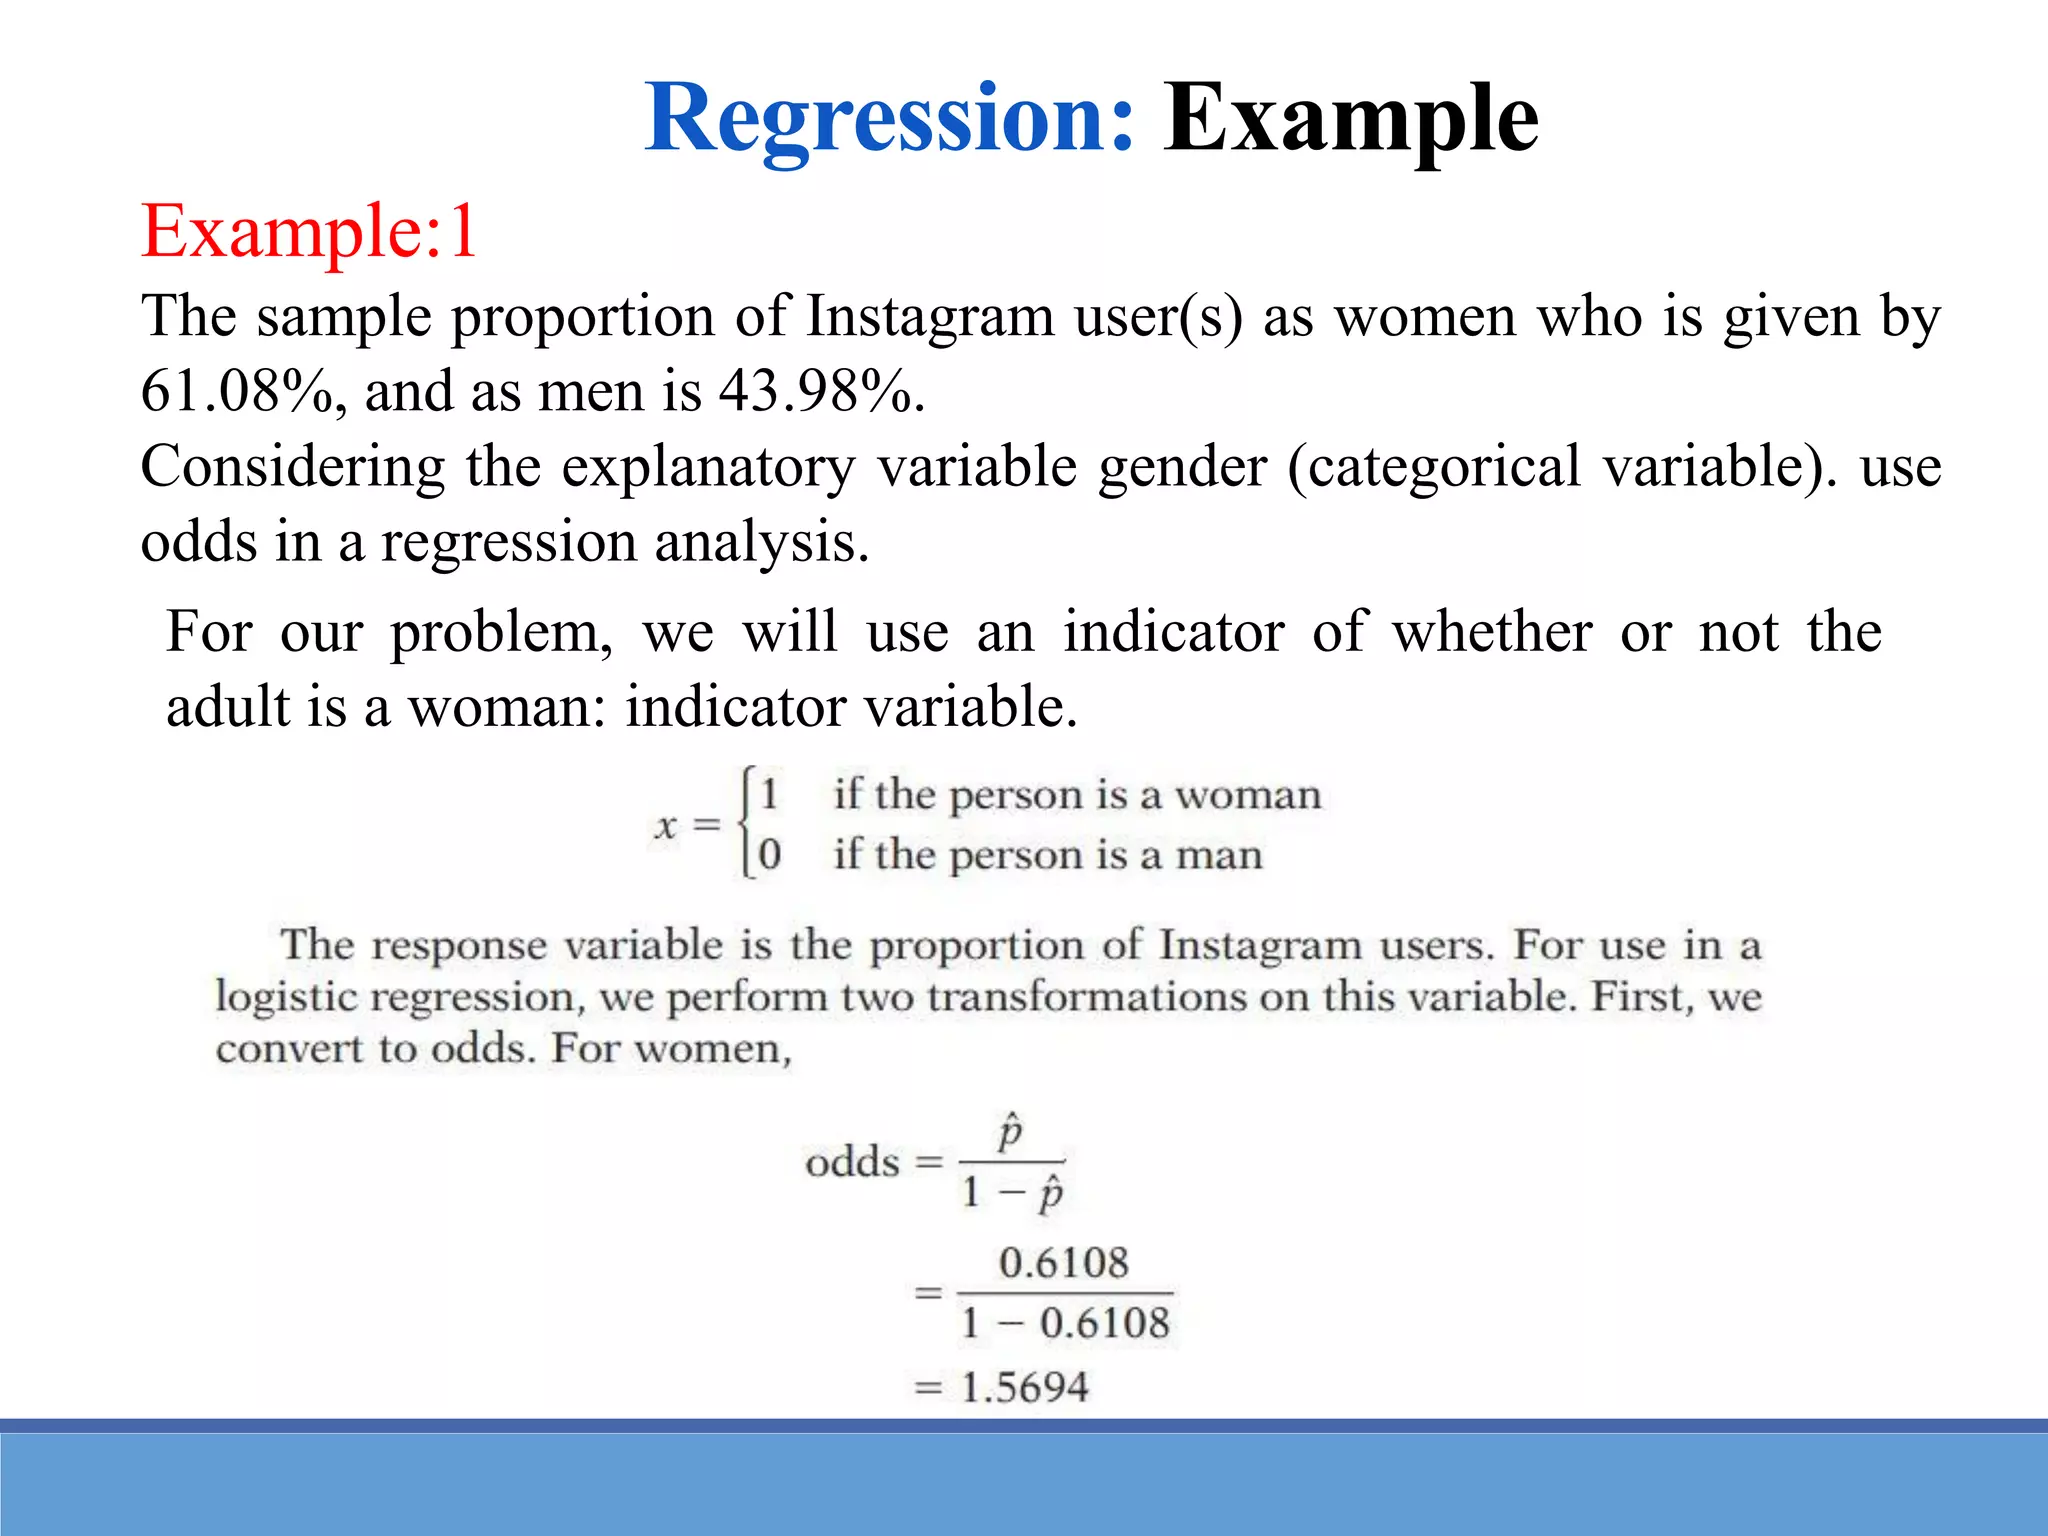
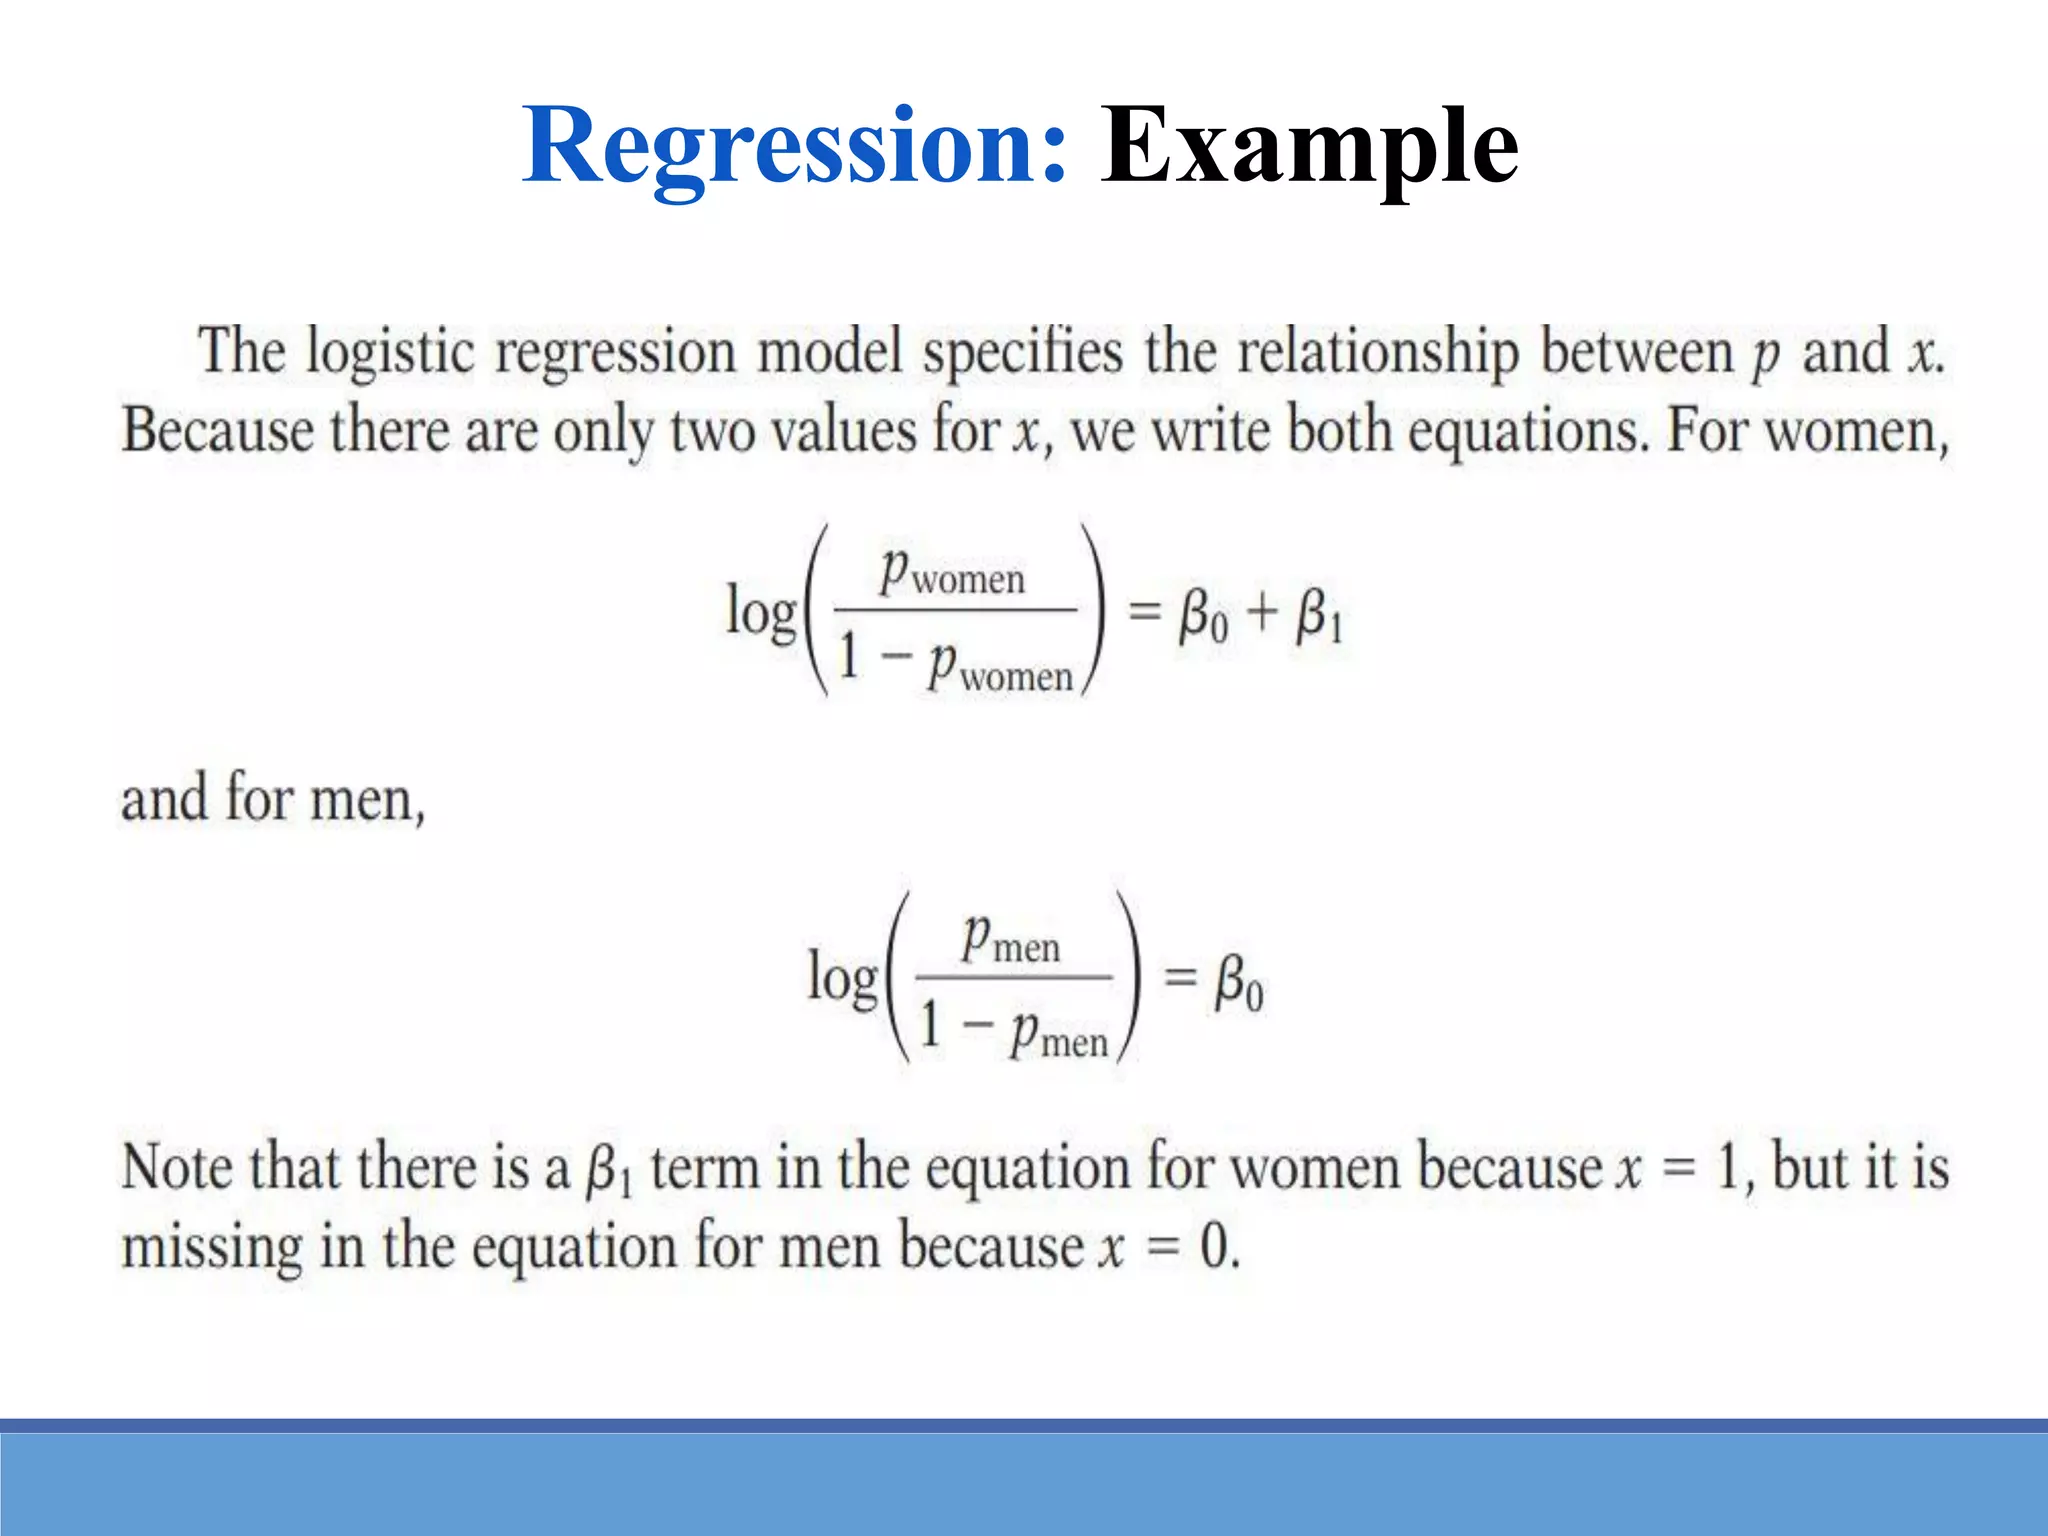
REGRESSION ANALYSIS (EXAMPLE)
DEPARTMENT OF COMPUTER SCIENCE & ENGINEERING
Data Science & Machine Learning
CS-3203
Spring 2023
Example:1
The sample proportion of Instagram user(s) as women who is given by
61.08%, and as men is 43.98%.
Considering the explanatory variable gender (categorical variable). use
odds in a regression analysis.
Regression: Example
For our problem, we will use an indicator of whether or not the
adult is a woman: indicator variable.
In simple linear regression, we modelled the mean of the
response variable y as a linear function of the explanatory
variable :
When y is just 1 or 0 (success or failure), the mean is the
probability p of a success.
Logistic regression models the mean p in terms of an
explanatory variable x :
We might try to relate p and x as in simple linear regression.
Unfortunately, this is not a good model. Whenever ,
extreme values of x will give values of that fall
outside the range of possible values of p, .
Regression: Logit and Odds
Regression: Logit form
The logistic model assumes a linear relationship
between the predictors and log(odds).
log
p
1- p
æ
è
ç
ö
ø
÷ = b0
+ b1
X
⇒
odds =
p
1- p
= e
b0 +b1 X
Regression: Examples
For our Instagram example, there are n=1069 young persons in
the sample. The explanatory variable is gender, which we have
coded using an indicator variable with values x = 1 for women
and x = 0 for men. The response variable, y, is also an indicator
variable.
Thus, each person either is an Instagram user or is not an
Instagram user. Think of a process of selecting a young person
at random and recording y and x.
The model says that the probability, p, that this person is an
Instagram user can depend upon the user’s gender (x = 1 or x =
0).
Regression: Analysis
Regression: Example
Regression: Example
Regression: Example
Regression: Example

Logistic.pdf

  • 1.
    REGRESSION ANALYSIS (EXAMPLE) DEPARTMENTOF COMPUTER SCIENCE & ENGINEERING Data Science & Machine Learning CS-3203 Spring 2023
  • 2.
    Example:1 The sample proportionof Instagram user(s) as women who is given by 61.08%, and as men is 43.98%. Considering the explanatory variable gender (categorical variable). use odds in a regression analysis. Regression: Example For our problem, we will use an indicator of whether or not the adult is a woman: indicator variable.
  • 3.
    In simple linearregression, we modelled the mean of the response variable y as a linear function of the explanatory variable : When y is just 1 or 0 (success or failure), the mean is the probability p of a success. Logistic regression models the mean p in terms of an explanatory variable x : We might try to relate p and x as in simple linear regression. Unfortunately, this is not a good model. Whenever , extreme values of x will give values of that fall outside the range of possible values of p, . Regression: Logit and Odds
  • 4.
    Regression: Logit form Thelogistic model assumes a linear relationship between the predictors and log(odds). log p 1- p æ è ç ö ø ÷ = b0 + b1 X ⇒ odds = p 1- p = e b0 +b1 X
  • 5.
  • 6.
    For our Instagramexample, there are n=1069 young persons in the sample. The explanatory variable is gender, which we have coded using an indicator variable with values x = 1 for women and x = 0 for men. The response variable, y, is also an indicator variable. Thus, each person either is an Instagram user or is not an Instagram user. Think of a process of selecting a young person at random and recording y and x. The model says that the probability, p, that this person is an Instagram user can depend upon the user’s gender (x = 1 or x = 0). Regression: Analysis
  • 7.
  • 8.
  • 9.
  • 10.