SlideShare a Scribd company logo
1 of 10
Download to read offline
American Journal of Humanities and Social Sciences Research (AJHSSR) 2023
A J H S S R J o u r n a l P a g e | 107
American Journal of Humanities and Social Sciences Research (AJHSSR)
e-ISSN : 2378-703X
Volume-07, Issue-10, pp-107-116
www.ajhssr.com
Research Paper Open Access
Detecting Financial Statement Manipulation in Selected Indian
Telecom Companies Using Beneish M-Score Model
Arshe Azam1
, Afreen Begum2
1
Research Scholar, Department of Management and Commerce, Maulana Azad National Urdu University
Hyderabad, Telangana, India
Email: azamarshe0@gmail.com
2
Research Scholar, Department of Management and Commerce, Maulana Azad National Urdu University
Hyderabad, Telangana, India
Email: afreenbegum94407@gmail.com
ABSTRACT : The Indian telecom sector, with 1.17 billion users and the second-largest market globally, is
experiencing exponential growth due to factors like affordable prices, accessibility, and government initiatives.
The introduction of 5G technology has accelerated this growth, with projections of 920 million mobile users by
2025 and an economic boost of $450 billion between 2023 and 2040. Financial statement manipulation poses a
significant challenge in the realm of corporate finance, potentially misleading investors and stakeholders. This
study delves into the intricate domain of financial statement analysis, focusing on five Indian telecom companies,
a sector pivotal to the nation's economic growth with a period of five years from 2018 to 2022. Employing the
renowned Beneish M-Score Model, this research endeavors to detect instances of financial statement manipulation
within the chosen telecom entities. This paper also explores a quantitative analysis using the Beneish M-score
model was used to investigate earnings manipulation within Indian telecom firms. The study highlights the
complexities of financial statement fraud in the telecom sector and the need for vigilance for sustainable growth
and investor confidence.
KEYWORDS: Financial Statement Manipulation, Beneish M-Score Model, Indian Telecom Companies,
Financial Fraud Detection, Earnings Manipulation, Not Earnings Manipulation.
I. INTRODUCTION
The Indian telecom companies have 1.17 billion users (wireless + wireline subscribers) as of September 2022,
India's telecom sector is the second largest in the world. India has a teledensity of 84.86% overall, with a rural
market that is mainly unexplored with a teledensity of 58.01% and an urban market that has a teledensity of
134.62%. A total of 839.18 million people (narrowband + broadband users) had internet access by the end of
January 2023, with 44.25% of those people living in rural areas. Additionally, the average monthly data usage per
wireless data subscriber has climbed by 22,605%, from 61.66 MB in March 2014 to 16.40 GB in June 2022.
Affordable prices, increased accessibility, the introduction of Mobile Number Portability (MNP), expanding 3G
and 4G coverage, changing subscriber consumption patterns, government initiatives to increase India's domestic
telecom manufacturing capacity, and a supportive regulatory environment have all contributed to the industry's
exponential growth over the past few years.
The Government has authorized the sale of IMT/5G spectrum for the nationwide deployment of 5G services in
order to speed up digital connection even more. By the end of July 2022, this auction had been successfully
completed and brought in $18.77 billion. With 6.43% of all FDI inflows, the telecom sector ranks third in terms
of the amount of FDI received. It supports 2.2 million jobs directly and 1.8 million jobs indirectly. The amount of
FDI in the telecom sector between 2014 and 2021 increased by 150%, from $8.32 billion to $20.72 billion. In
Telecom, 100% Foreign Direct Investment (FDI) is currently permitted. Infrastructure, Equipment, Mobile Virtual
Network Operators (MNVO), White Space Spectrum, 5G, Telephone service providers, and Broadband are the
subsectors that make up the telecommunications sector. By 2025, India is predicted to have 920 million unique
mobile customers, including 88 million 5G connections, making it the second-largest smartphone market in the
world. This is according to the GSMA. It is predicted that 5G technology will boost the Indian economy by $450
billion between 2023 and 2040.
In nearly the past ten years, India has added nearly 500 million additional smartphone users. By 2026, there will
be 850 million smartphone users or around 55% of the population. In order to actualize a new variety of options,
business models, and employment potential, the Government of India wants to establish 100 labs for creating
American Journal of Humanities and Social Sciences Research (AJHSSR) 2023
A J H S S R J o u r n a l P a g e | 108
applications using 5G services in engineering universities under the Union Budget 2023. By December 2022, the
DoT hopes to have installed 30 lakh km of fiber optic cable, 55% of mobile towers have been built, and all villages
have 100 percent internet connectivity. From 61 million in March 2014 to 816 million in September 2022,
broadband connections increased by 1238%. By December 2024, DoT hopes to have 70% of towers fiberized,
average internet speeds of 50 Mbps, and a rollout of 50 lakh km of fiber optic cable across all of India.
According to the Network Readiness Index 2022, India moved up six positions to take up position 61.
➢ India ranks second in both "International Internet bandwidth" and "Mobile broadband internet traffic
within the country."
➢ Internet connections increased by 232%, from 25.15 crore in March 2014 to 83.69 crore in June 2022.
➢ From 6.1 crore in March 2014 to 81.62 crore in September 2022, the number of broadband connections
increased by 1238%.
➢ Average revenue realization per subscriber for every gigabyte of cellular data decreased from Rs. 268.97
in December 2014 to Rs. 10.29 in June 2022, a decrease of more than 96.17%.
➢ From 61.66 MB in March 2014, the average monthly data consumption per wireless data subscriber
climbed by 266 times to 16.40 GB in June 2022.
➢ India ranks third in both "Domestic market size" and "Annual investment in telecommunication
services".
By the end of January 2023, 5G services had been deployed throughout all licensed service regions in 238 cities.
India moves up 10 ranks in the global rankings for average mobile speeds, from 79th in December to 69th in
January 2023. From 93.30 crore in March 2014 to 117.02 crore in October 2022, there were 25.42% more
telephone lines overall. In October 2022, there were 114.4 crore mobile connections. Urban telephone connections
increased by 17.06% from 55.52 crores in March 2014 to 64.99 crores in October 2022, while rural telephone
connections increased by 37.69%, almost twice as much as urban connections, from 37.78 crores in March 2014
to 52.02 crores in October 2022. In March 2014, the rural tele-density was 44%; by October 2022, it had increased
to 57.91%.
The total number of telecom customers is shown below in the tables, Pie-Chart and graphs.
Table-1 : Highlights of Telecom Subscription Data as on 30th June 2023
Particulars Wireless Wireline Total
(Wireless + Wireline)
Broadband Subscribers (Million) 826.37 35.10 861.47
Urban Telephone Subscribers (Million) 626.07 27.63 653.70
Net Addition in June 2023 (Million) -0.19 0.46 0.27
Monthly Growth Rate -0.03% 1.68% 0.04%
Rural Telephone Subscribers (Million) 517.51 2.68 520.19
Net Addition in June, 2023 (Million) 0.56 0.49 1.05
Monthly Growth Rate 0.11% 22.53% 0.20%
Total Telephone Subscribers (Million) 1143.58 30.31 1173.89
Net Addition in June, 2023 (Million) 0.37 0.95 1.32
Monthly Growth Rate 0.03% 3.23% 0.11%
Overall Tele-density (%) 82.25% 2.18% 84.43%
Urban Tele-density (%) 127.56% 5.63% 133.19%
Rural Tele-density (%) 57.53% 0.30% 57.83%
Share of Urban Subscribers 54.75% 91.16% 55.69%
Share of Rural Subscribers 45.25% 8.84% 44.31%
Sources: TRAI
The table-1 provides insights into the dynamics of broadband and telephone adoption, growth rates, and
the distribution of subscribers between urban and rural areas.
The wireless segment has a tele-density larger number of subscribers compared to the wireline segment
in both urban and rural areas. Urban areas have higher tele-density than rural areas, with the wireless
segment contributing significantly to this difference. The monthly growth rate of wireless broadband
subscribers is negative, indicating a slight decline. In contrast, the wireline broadband segment is
growing at a healthy rate. The rural wireline segment has an exceptionally high monthly growth rate,
which might be due to infrastructural improvements in rural connectivity. The total number of telephone
subscribers is dominated by the wireless segment. Urban areas have a larger share of subscribers in both
wireless and wireline categories.
American Journal of Humanities and Social Sciences Research (AJHSSR) 2023
A J H S S R J o u r n a l P a g e | 109
Pie-Chart-1
Sources:- https://en.wikipedia.org/wiki/List_of_telecom_companies_in_India
Pie-Chart-1 describes that Bharti Airtel Limited has 37.26 crores (372.6 million) Customers with 32% of the
Market Share. Reliance Jio Infocomm Ltd has 43.63 crore (436.3 million) Customers with 37% of the Market
Share. Mahanagar Telephone Nigam Ltd has 2.15 crore (21.5 million) Customers with 2% of the Market Share.
Vodafone Idea Ltd has 23.09 crore (230.9 million) Customers with 20% of the Market Share. Bharat Sanchar
Nigam Limited (BSNL) has 10.14 crore (101.4 million) Customers with 9% of the Market Share. It has been
identified that Reliance Jio Infocomm Ltd has the largest customer base, with 43.63 crore customers, constituting
37% of the market share. It holds the highest market share among the listed companies. Bharti Airtel Limited
follows closely with 37.26 crore customers and a market share of 32%. It's one of the major players in the market.
Vodafone Idea Ltd has a customer base of 23.09 crore and holds 20% of the market share. It's another significant
player, although slightly smaller than Airtel and Jio in terms of both customers and market share. Bharat Sanchar
Nigam Limited (BSNL) has 10.14 crore customers and a market share of 9%, making it a notable player but with
a smaller presence compared to the top three. Mahanagar Telephone Nigam Ltd has the smallest customer base of
2.15 crore, contributing to a mere 2% of the market share. It appears to be a relatively smaller player in the market.
In short, Reliance Jio and Bharti Airtel are the dominant players with the largest customer bases and higher market
shares. Vodafone Idea and BSNL hold significant positions as well, while Mahanagar Telephone Nigam Ltd seems
to have a relatively smaller market presence.
This quantitative study looked at whether earnings manipulation occurs at a selected Indian telecom firm and
whether there is a connection between profit manipulation and failures at a selected Indian telecom company. The
M-Score model's validity as the best instrument for predicting the demise of selected Indian Telecom firms was
ultimately validated.
H1. Published financial statements of selected Indian Telecom companies are not manipulated prior to their failure
H2. There is no relationship between earnings manipulation and the failure of selected Indian Telecom companies
H3. The M-score model is statistically insignificant in optimal predicting selected Indian Telecom companies'
failure.
The paper used the Beneish M-score model to assess the proposed hypotheses (H1, H, and H3). The M-score
approach is useful for identifying financial statement manipulation in corporate entities. The Z-score model, for
example, focuses on broad corporate financial hardship in contrast to other multivariate analyses like the M-score,
which enables researchers to use particular factors to investigate the link between financial statement
abnormalities and a firm's demise. The M-score model has been attributed to helping users identify potential fraud
situations based on the financial statements of businesses as an integrated method. This is made feasible by the
model's ability to analyze multiple aspects of a company's performance at once. highlighted the fact that
37.26, 32%
43.63, 37%
2.15, 2%
23.09, 20%
10.14, 9%
Market Share of Subscriber Selected Telecom Companies as on
31st March 2023 (in Crore and %)
Bharti Airtel Limited
Reliance Jio Infocomm Ltd
Mahanagar Telephone Nigam Ltd
Vodafone Idea Ltd
Bharat Sanchar Nigam Limited
American Journal of Humanities and Social Sciences Research (AJHSSR) 2023
A J H S S R J o u r n a l P a g e | 110
organizations with a high likelihood of earnings manipulation are more likely to report low returns in the future
compared to those with a low exposure to profit manipulations.
Additionally, a lot of academics and practitioners have praised the Beneish M-score model for helping institutional
investors and regulators quickly spot possible corporate financial statement manipulation. The outcomes of the
M-score model, according to a new study, are a good guide for averting pricey litigation and reputational harm to
many stakeholders, including auditors and financial analysts. In addition to the reasons already indicated, the
research adds to the body of knowledge regarding the fraud triangle.
II. REVIEW OF LITERATURE
Maximizing total returns on investment is the main goal of every profit-driven organization. Corporate
managers work to reassure investors that their assets are secure and safe for this and other reasons. As a result,
businesses typically use a variety of tactics—both moral and occasionally immoral—to accomplish their
objectives. This study concentrated on one of these immoral techniques, specifically financial statement
manipulations, which frequently result in investors receiving returns that are zero or negative.
The study looks at external pressure, industry characteristics, and rationalization as contributing causes of
financial statement fraud. It constructs a hypothesis about the impact of these variables using the Beneish m-score.
Future research might benefit from understanding how pressure, opportunities, and justification all affect
misleading financial statements, according to the findings (Harpan, D., & Kuntadi, C. 2023). The study looks into
how corporate profitability manipulation affects Ghana's microfinance institutions. The researchers discovered a
connection between earnings manipulation and business failures using data from the Bank of Ghana. It was
discovered that the Beneish M-scores model is useful for seeing early warning indications of corporate earnings
management and averting bad outcomes. The conclusions, however, are based on data from the microfinance
sector, and future studies should take qualitative inquiry and data from many industries into consideration
(Adoboe-Mensah, et al. 2023). This study looks at how external pressure, financial targets, and financial stability
affect the prevalence of fabricated financial statements in 30 property and real estate firms that were listed on the
Indonesia Stock Exchange between 2015 and 2017. The findings demonstrate that falsified financial statements
are favorably impacted by both financial targets and financial soundness. Pressure from without has no beneficial
effects (Djatnicka, E. W., et al. 2023). The study looks at the connection between returns and the Beneish-M score,
an index used to judge how well a corporation has manipulated its profitability. The findings demonstrate that the
market penalizes fiscal manipulation because Indian enterprises with an M-score above -1.78 report worse returns
in the following year. According to the research, investors should steer clear of businesses that use the Beneish
M-score (Jain, G., & Bose, A. 2023). In order to identify financial fraud and business failure in US-listed
companies, the study contrasted the f-score and the Beneish M-model. Results showed that the M-score was
superior in spotting anomalies in financial statements (Hou, B., et al. 2023, June). With a focus on the influence
of pressure, opportunity, and rationalization on misleading financial statements, the study examined
manufacturing companies listed on the Indonesia Stock Exchange from 2018 to 2020. Logistic regression analysis
was used with 23 companies and 69 respondents. The findings indicated that, in contrast to other characteristics,
financial stability, and inefficient monitoring have a major impact on financial statement fraud (Rahmani, H. F.,
& Oktalita, L. 2023). The fraud hexagon theory's effects on fraudulent financial reporting in 49 Indonesian
consumer goods companies are investigated in this study. The study discovered that external pressure and auditor
changes had a favorable impact on false reporting, whereas financial targets had a negative impact, based on prior
findings and small studies. Stability, weak oversight, director turnover, haughtiness, and political ties, however,
have no bearing on false reporting (Ginting, D. B., & Daljono, D. 2023). The study looks for characteristics that
lead to earnings management in 284 Indonesian manufacturing organizations using a fraud triangle and a modified
Beneish M-score. The findings indicate a negative correlation between asset growth, receivables to sales, auditor
changes, and debt ratio, although the return on assets has no bearing. The modified Beneish M-score model is
being used for the first time in this study to identify earnings management (Narsa, N. P. D. R. H., et al. 2023).
Using the Beneish M-Score Model, the study investigates the connection between earnings manipulation and
share price across publicly traded companies in Malaysia. With the help of the FTSE Bursa Malaysia Top 100
Index, it examined data from 65 PLCs. The findings suggested that other factors may affect share price since there
was only a weakly negative link and statistically negligible relationship between earning manipulation and share
price. The study is essential for stakeholders looking for the highest profits, investment stability, and ownership
rights protection (Boni, L., Kamaluddin, A., & Kusumaningtias, R. 2023). This study uses a sample of 16
organizations with 10 years of observation to investigate financial manipulation in State-Owned Enterprises
(SOEs). According to the findings, 62 corporations are not manipulators and 98 companies are. The Beneish M-
Score model uses 8 variables to identify manipulation. Financial statement manipulation is impacted by GMI and
TATA. By improving sales and accounts receivable data, which show inefficiencies, SOEs increase permanent
income. Additionally, they show a positive improvement in the ratio of assets to liabilities and cash (Husein, H.,
et al. 2023).
American Journal of Humanities and Social Sciences Research (AJHSSR) 2023
A J H S S R J o u r n a l P a g e | 111
III. RESEARCH METHODOLOGY
This paper uses a quantitative research technique to inquiry based on the Beneish M-score model research used to accomplish
the goal. The Beneish M model makes use of various financial parameters or ratios of a certain selected Indian telecom
company to assess the likelihood that reported earnings were manipulated or not. The methodology adopted in this work is
similar to that of other researchers in that it permits the investigation of the sample variables over a representative interval
without affecting those variables. The data sources and the logic behind using the Beneish M-score model research are covered
in this section.
3.1 Data and its Sources
This paper totally depends on secondary data which are collected from financial reports of selected Indian telecom companies’
official websites through Capitaline for a period of five years which are from 2018 to 2022. This data was first gathered as
primary data on the Indian stock exchange and The Telecom Regulatory Authority of India (TRAI) where selected Indian
telecom companies were listed then the researcher collected from their websites through Capitaline. Indian Stock Exchange
also called the Stock Exchange Board of India (SEBI) has listed all companies that are registered and operated in India and
The Telecom Regulatory Authority of India (TRAI) controls and regulates all telecom companies that are operated in India.
The SEBI and TRAI’s research division is well known for its capacity to gather, examine, and disseminate reliable data, as a
result, it looks to be the most reliable source of information for this research. Almost 8500 telecom companies running their
business in India and the researcher has selected the top five Indian telecom companies. All data was collected by the researcher
through eight financial ratios.
3.2 Independent Variables and Empirical Model
In this section, the independent variables describe how to use variables to calculate the M-score and determine the Beneish M-
score Model. The researcher has used three important sources for selecting endogenous variables. First, the researcher has
focused on and identified key signals which are relied on by previous researchers. Second, there is a common perception about
the poor performance of a company in the future that there is mostly a possibility is manipulating their financial statements or
corporate financial earnings. Third, the researcher has focused on almost all possible financial reports like Balance sheets,
profit and loss accounts, and cash flow statements that are required for calculating ratios or variables. After these, the researcher
has chosen eight explanatory variables, Days' sales in a receivable index (DSRI), Gross margin index (GMI), Asset quality
index (AQI), Sales growth index (SGI), Depreciation index (DEPI), Sales and general and administrative expenses index
(SGAI), Leverage index (LVGI), and Total accruals to total assets (TATA). These variables are normally used as fair
explanatory variables by Beneish 1999 for predicting corporate earnings manipulations. These variables are useful for current
research.
There are summarized endogenous variables or ratios for the mathematical formula in Figure no-3. Each selected Indian
telecom company that was a part of the final sample had an average score that was calculated, separately weighted, and assessed
for manipulation of corporate earnings. Beneish (1999) has recommended that the researchers use data from financial
statements to calculate the M-score to detect possible manipulation of selected Indian telecom companies’ earnings because
the researchers have 76% accuracy in detecting companies’ financial earnings manipulation by the M-score formula. As a
result, the method provides a solid tool for this research. Consequently, the formula for the tried-and-true and widely accepted
Beneish M-score model utilized for this paper is as follows.
M = −4.84 + 0.920*DSRI + 0.528*GMI + 0.404*AQI + 0.892*SGI + 0.115*DEPI –
0.172*SGAI + 4.679*TATA – 0.327*LVGI
Figure-1
Sources: - Beneish et al. (2013) and Adoboe-Mensah et al. (2023)
American Journal of Humanities and Social Sciences Research (AJHSSR) 2023
A J H S S R J o u r n a l P a g e | 112
Where,
M = The following is a succinct explanation of the overall index and the endogenous variables:
3.2.1 DSRI
Days’ Sales in Receivables Index, A sharp rise in the number of days for accounts receivable could indicate
hastened revenue recognition to boost profitability. This financial ratio determines whether or not variations in
sales are according to variations in receivables. This is calculated by dividing a firm’s days’ sales in receivables
in the current year (represented by t) by days’ net receivables in the previous year (t-1). The consistency between
a company's accounts receivable and the associated sales can be assessed using the DSRI. Corporate non-
manipulators have a DSRI mean value of 1.031, while earnings manipulators have a DSRI mean value of 1.465,
according to K. M. B. (2016), MacCarthy (2017), and Nyakarimi (2022). An increase in the index indicates that
more sales are being made on credit as opposed to cash, which means the business is having trouble collecting its
debts. This shows that a significant increase in DSRI indicates a high likelihood of management inflating revenue.
3.2.2 GMI
Gross Margin Index, in this ratio, a deteriorating gross margin sends a negative signal about a firm’s prospects
and creates an incentive to inflate profits. Beneish 1999, Nyakarimi, 2022, and Repousis, 2016 Utilizing this
index, one can determine whether the gross margin—defined as sales less cost of goods sold—has decreased. It
is determined by dividing the current year's gross profit margin (t) by the previous year's gross profit margin (t-
1). GMI greater than 1 indicates a decline in the entity's gross profit. A score of 1.193 and higher indicates a
significant likelihood that the company's gross profit is being manipulated, while a score of 1.041 or lower
indicates that the gross profit of the current accounting period is not being manipulated (Harrington 2005).
3.2.3 AQI
The AQI is the proportion of a company's total assets to all non-current assets (excluding plant, property, and
equipment and comparisons with the ratio of a firm's asset quality in the current year (t) to its asset quality in the
prior year (t-1). (Beneish, 1999; 2012; Repousis, 2016). This index's increase indicates a decline in asset quality.
According to Beneish (1999), an AQI > 1 indicates a propensity to capitalize intangibles or expenses or to delay
costs.
3.2.4 SGI
Sales Growth Index is a high-growth company that may commit financial fraud due to financial pressure and
capital needs and may face increased incentives to manipulate earnings during slowdowns due to large stock price
losses. The growth in sales between financial periods is the subject of this index. It has to do with the proportion
of a company's current-year sales (t) to its sales from the prior year (t-1). SGI's median score of 1.134 indicates
no earnings manipulation, while 1.607 indicates possible manipulation (Beneish, 1999; 2012; Repousis, 2016;
Nyakarimi, 2022).
3.2.5 DEPI
Depreciation is when a company may have increased the projected useful life of assets or implemented a new,
income-increasing approach if its rate of depreciation is declining relative to net fixed assets. This measurement
represents the ratio of a company's depreciation rate from the prior year (t-1) to the current year's rate (t). If a
score of DEPI>1, it means, there is a deliberately lowering depreciation rate of companies' assets (Beneish 1999
and Harrington 2005).
3.2.6 SGAI
Sales, General, and Administrative Expenses A company can feel pressured to inflate earnings if analysts perceive
a disproportionate rise in SG&A relative to sales as a warning indication about the company's future prospects. It
is a ratio of a company's sales, general, and administrative costs for the current accounting year (t) to the value for
the prior year (t-1) (Beneish, 1999; and Repousis, 2016). According to Beneish (1999), it noted that a sales growth
that is excessively greater than 1.001 from one year to the next in the current year is a sign of poor future prospects.
3.2.7 TATA
Total Accruals to Total Assets, Total accruals, calculated as working capital change less depreciation, indicate
managers' discretionary accounting choices to alter earnings, with higher levels indicating higher profit
manipulation. According to (Beneish, 1999, and Adu-Gyamfi, 2020), The entire accruals of a company are
expressed as a proportion of its total assets using this ratio. It is computed by subtracting the income from
continuing activities for the same year (t) from the cash flows from operations for the firm in the current year (t).
The total assets of the company for the year under consideration are then divided by the net result. If there is an
average score of 0.018, it means non-financial manipulation; if an average score of 1.031 or more, it means
deliberately changing the data (Repousis, 2016).
3.2.8 LVGI
Leverage Index where Total debt divided by total assets measures leverage. An incentive to manipulate profits in
order to meet debt covenants is created by an increase in leverage. LVGI is the ratio of the current accounting
period's (t) and the prior period's (t-1) total debt to total asset ratios. Rising leverage is indicated by a firm's LVGI
> 1 (Beneish, 1999, Nwoye et al., 2012, and Repousis, 2016). So, it is a threat to investors for their future return
American Journal of Humanities and Social Sciences Research (AJHSSR) 2023
A J H S S R J o u r n a l P a g e | 113
on Investment that if LEVI>1, it means a company's leverage position has increased (Beneish, 1999, and
Harrington, 2005).
Table-2 : Description of M-score outcome factors
M-Score Results
M>-1.78 The higher possibility of earnings manipulation (Earnings Manipulation)
M<-1.78 The lower possibility of earnings manipulation (Not Earnings Manipulation)
Source: Beneish et al. (2013)
3.3 Estimation and Specification of Model
Table 2 shows the measurement criteria and the results of the variable for the M-score. Where, if the M-score
value is M>-1.78 then it means there is a higher possibility of earning manipulation by corporate or company
management, and if the M-score value is M<-1.72 then it means there is a lower possibility of earning
manipulation by corporate or company management (Beneish et al. 2013).
Figure 1 highlights the individual factors that, taken together, can have an impact on a business's ability to continue
operating. According to Beneish et al., companies that use aggressive and dishonest accounting concepts,
procedures, and standards eventually fail. In order to boost business earnings, corporate managers are urged to
use practical strategies.
IV. DESCRIBE THE RESULT AND FINDINGS
In this section researcher has focused on the analysis of the selected Indian telecom company. The Beneish M-
score is a mathematical model used to detect earnings manipulation in the financial statements of selected Indian
telecom companies. The score is calculated based on various financial ratios and other accounting metrics. Alower
M-score suggests a lower likelihood of earnings manipulation, while a higher M-score indicates a higher
likelihood of manipulation.
Table-3 : Beneish M-score of Selected Indian Telecom Companies
Name of the Companies 2018 2019 2020 2021 2022
Bharti Airtel Limited
-1.0979 -1.6471 -1.7133 -0.9226 -1.2147
Reliance Jio Infocomm Ltd -1.2024 -1.6594 -1.6228 -0.5396 -0.8706
Mahanagar Telephone Nigam Ltd
-1.3966 -1.6226 -1.7468 -1.3247 -0.6497
Vodafone Idea Ltd
-1.3125 -1.1128 -1.8118 -0.8265 -0.8437
Bharat Sanchar Nigam Ltd
-1.7132 -1.2681 -1.4649 -1.1825 -0.8025
Table-3(a)
Describe Earnings Manipulation or Not Earnings Manipulation of the Selected Indian Telecom
Companies
Name of the Companies 2018 2019 2020 2021 2022
Bharti Airtel Limited. Not Earnings
Manipulation
Not Earnings
Manipulation
Not Earnings
Manipulation
Not Earnings
Manipulation
Not Earnings
Manipulation
Reliance Jio Infocomm Ltd. Not Earnings
Manipulation
Not Earnings
Manipulation
Not Earnings
Manipulation
Not Earnings
Manipulation
Not Earnings
Manipulation
Mahanagar Telephone Nigam
Ltd.
Not Earnings
Manipulation
Not Earnings
Manipulation
Not Earnings
Manipulation
Not Earnings
Manipulation
Not Earnings
Manipulation
Vodafone Idea Ltd. Not Earnings
Manipulation
Not Earnings
Manipulation
Earnings
Manipulation
Not Earnings
Manipulation
Not Earnings
Manipulation
Bharat Sanchar Nigam Ltd. Not Earnings
Manipulation
Not Earnings
Manipulation
Not Earnings
Manipulation
Not Earnings
Manipulation
Not Earnings
Manipulation
American Journal of Humanities and Social Sciences Research (AJHSSR) 2023
A J H S S R J o u r n a l P a g e | 114
Looking at the provided data for the years 2018 to 2022, here's an interpretation of the Beneish M-scores for the
selected companies. Table 3 describes mathematical data, and Table 3(a) describes their position according to the
calculated
Table 3 describes the M-scores for Bharti Airtel Limited have fluctuated over the years, ranging from -1.0979 in
2018 to -1.7147 in 2022. These scores generally indicate a relatively low likelihood of earnings manipulation,
with some fluctuations. Reliance Jio Infocomm Ltd also shows fluctuating M-scores, ranging from -1.2024 in
2018 to -0.8706 in 2022. These scores suggest a relatively low likelihood of earnings manipulation, with a slight
decrease in 2022. Mahanagar Telephone Nigam Ltd's M-scores have been consistently low, indicating a lower
likelihood of earnings manipulation. The scores range from -1.3966 in 2018 to -0.6497 in 2022. Vodafone Idea
Ltd's M-scores have varied, with a low of -1.8118 in 2020 and a slight increase to -0.8437 in 2022. These scores
suggest a generally low likelihood of earnings manipulation, although there was a spike in 2020. Bharat Sanchar
Nigam Ltd started with an M-score of -1.7132 in 2018, indicating a low likelihood of earnings manipulation. The
scores improved slightly in the following years, reaching -0.8025 in 2022. So, the above data also describe that
all selected companies generally exhibit low M-scores, indicating a lower likelihood of earnings manipulation
during the specified period. Fluctuations in M-scores for some companies suggest possible changes in their
financial reporting practices or underlying financial health. It's important to note that while M-scores provide
insights, they are not definitive proof of manipulation and should be considered alongside other financial analyses
and due diligence processes.
Table 3(a) describes the M-scores for Bharti Airtel Limited indicating "Not Earnings Manipulation" for all years,
suggesting a low likelihood of earnings manipulation. Reliance Jio Infocomm Ltd, the company also shows "Not
Earnings Manipulation" for all years, indicating a low likelihood of earnings manipulation. Mahanagar Telephone
Nigam Ltd similar to the other companies, Mahanagar Telephone Nigam Ltd has "Not Earnings Manipulation"
for all years, suggesting a low likelihood of earnings manipulation. Vodafone Idea Ltd, this company had an
instance of "Earnings Manipulation" in the year 2020. However, in the other years, it shows "Not Earnings
Manipulation", indicating a generally low likelihood of manipulation except for 2020. Bharat Sanchar Nigam Ltd,
the M-scores for this company also indicate "Not Earnings Manipulation" for all years, suggesting a low likelihood
of earnings manipulation. based on the Beneish M-scores and their interpretations, these selected Indian
companies generally show a low likelihood of earnings manipulation in the specified years, except for Vodafone
Idea Ltd in the year 2020.
Graph- 1
Graph 1 also describes the data of the selected Indian telecom companies that where the chances of either corporate
earnings manipulation or not corporate earnings manipulation in the respective years. Here only one Indian
telecom company namely Voda Idea Ltd is the possibility for earnings manipulation in 2020 and the rest of the
year, all Indian telecom companies have indicated that there is no possibility of corporate earnings manipulation
in the respected ears.
Bharti Airtel
Limited
Reliance Jio
Infocomm Ltd
Mahanagar
Telephone Nigam
Ltd
Vodafone Idea Ltd
Bharat Sanchar
Nigam Ltd
2018 -1.0979 -1.2024 -1.3966 -1.3125 -1.7132
2019 -1.6471 -1.6594 -1.6226 -1.1128 -1.2681
2020 -1.7133 -1.6228 -1.7468 -1.8118 -1.4649
2021 -0.9226 -0.5396 -1.3247 -0.8265 -1.1825
2022 -1.2147 -0.8706 -0.6497 -0.8437 -0.8025
-1.0979 -1.2024
-1.3966 -1.3125
-1.7132
-1.6471 -1.6594 -1.6226
-1.1128
-1.2681
-1.7133 -1.6228
-1.7468 -1.8118
-1.4649
-0.9226
-0.5396
-1.3247
-0.8265
-1.1825
-1.2147
-0.8706
-0.6497
-0.8437 -0.8025
-2
-1.8
-1.6
-1.4
-1.2
-1
-0.8
-0.6
-0.4
-0.2
0
Beneish M-score
2018 2019 2020 2021 2022
American Journal of Humanities and Social Sciences Research (AJHSSR) 2023
A J H S S R J o u r n a l P a g e | 115
V. CONCLUSION
The Indian telecom sector has experienced remarkable growth and development over the years, making it one of
the largest and most dynamic industries globally. The sector has seen significant advancements in technology,
infrastructure, and market penetration, with a substantial increase in the number of subscribers, internet users, and
broadband connections. The government's initiatives, supportive regulatory environment, and the introduction of
5G technology have played pivotal roles in shaping the industry's landscape. The Beneish M-score model analysis
presented in this study provides valuable insights into the financial practices of selected Indian telecom companies.
The results indicate that, for the most part, these companies have maintained a low likelihood of earnings
manipulation, as suggested by consistently low M-scores. The fluctuations observed in some years emphasize the
need for continuous vigilance and comprehensive financial analysis to understand the underlying factors
influencing these variations. It is essential to recognize the importance of such analyses, especially in a sector as
crucial as telecom, where financial stability and transparency are vital for sustainable growth. The findings of this
study contribute to the ongoing discourse on corporate financial practices and serve as a valuable resource for
investors, regulators, and industry stakeholders. As the Indian telecom sector continues to evolve and expand, it
is imperative for companies to uphold ethical financial standards, ensuring transparency and trust among their
stakeholders. Continued research and analysis, along with robust regulatory oversight, will play a significant role
in shaping the future trajectory of this dynamic industry.
REFERENCES
[1]. Adoboe-Mensah, N., Salia, H., & Addo, E. B. (2023). Using the Beneish M-score Model to Detect
Financial Statement Fraud in the Microfinance Industry in Ghana. International Journal of Economics
and Financial Issues, 13(4), 47.
[2]. Adu-Gyamfi, M. (2020), Investigating financial statement fraud in Ghana using Beneish M-Score: Acase
of listed companies on the Ghana stock exchange (GSE). International Finance and Banking, 7(2), 1-54.
[3]. Beneish, M.D. (1999), The detection of earnings manipulation. Financial Analysts Journal, 55(5), 24-
36.
[4]. Beneish, M.D., Lee, C.M., Nichols, C. (2013), Earnings manipulation and expected returns. Financial
Analysts Journal, 69, 57-82.
[5]. Boni, L., Kamaluddin, A., & Kusumaningtias, R. (2023) Detecting Earning Manipulation Using the
Beneish M-Score Model: Evidence from Public Listed Companies in Malaysia.
[6]. Djatnicka, E. W., Purba, J., & Wulandari, D. S. (2023). Fraud Triangle Perspective: Detecting Financial
Statement Fraud Using the Beneish M-Score Model in Property and Real Estate Companies Listed on
the Indonesia Stock Exchange. East Asian Journal of Multidisciplinary Research, 2(7), 3113-3130.
[7]. Ginting, D. B., & Daljono, D. (2023). ANALISIS PENGARUH FRAUD HEXAGON TERHADAP
FRAUDULENT FINANCIAL REPORTING MENGGUNAKAN METODE BENEISH M-SCORE
(Studi Empiris pada Sektor Industri Barang Konsumsi yang Terdaftar di Bursa Efek Indonesia Tahun
2019-2021). Diponegoro Journal of Accounting, 12(3).
[8]. Harrington, C. (2005), Formulas for Detection: Analytical Ratios for Detecting Financial Statement
Fraud. Association of Certified Fraud Examiners. Fraud Magazine. Available from:
http://www.acfe.com/ resources/view.asp?article10= 413 [Last accessed on 2014 Dec 31].
[9]. Harpan, D., & Kuntadi, C. (2023). Analysis the effect of the fraud triangle on fraud report finance use
beneish M-Score model. Gema Wiralodra, 14(2), 940-943.
[10]. Hou, B., Lin, R., Li, X., Liu, Z., & Zheng, J. (2023, June). Using Beneish M-Score and F-Score to Detect
Financial Fraud. In Proceedings of the 6th International Conference on Economic Management and
Green Development (pp. 1383-1400). Singapore: Springer Nature Singapore.
[11]. https://www.easyleadz.com/lists/List-of-Telecom-Companies-in-India
[12]. https://www.investindia.gov.in/sector/telecom#:~:text=The%20Telecom%20industry%20in%20India,(
wireless%20%2B%20wireline%20subscribers).
[13]. https://www.ibef.org/industry/telecommunications
[14]. https://www.ascgroup.in/industries/telecom-industry/
[15]. https://www.trai.gov.in/sites/default/files/Annaul_Report_23022023_0.pdf
[16]. https://en.wikipedia.org/wiki/List_of_telecom_companies_in_India
[17]. Husein, H., Saleh, P. A., Kriaswantini, D., & Bonara, R. S. (2023). Deteksi Manipulasi Laporan
Keuangan Menggunakan Model Beneish M-Score pada BUMN yang Terdaftar di Pasar Modal. JURNAL
AKUNTANSI, 18(1), 1-10.
[18]. Jain, G., & Bose, A. (2023). Are Returns Conditional upon the Beneish M score?. Academy of Marketing
Studies Journal, 27(3).
American Journal of Humanities and Social Sciences Research (AJHSSR) 2023
A J H S S R J o u r n a l P a g e | 116
[19]. MacCarthy, J. (2017), Using Altman Z-score and beneish M-score models to detect financial fraud and
corporate failure: A case study of Enron corporation. International Journal of Finance and Accounting,
6(6), 159-166.
[20]. M-Score, K. M. B. (2016). Detecting financial statement fraud by Malaysian public listed companies:
The reliability of the Beneish M-Score model. Jurnal Pengurusan, 46, 23-32.
[21]. Narsa, N. P. D. R. H., Afifa, L. M. E., & Wardhaningrum, O. A. (2023). Fraud triangle and earnings
management based on the modified M-score: A study on manufacturing company in Indonesia. Heliyon,
9(2).
[22]. Nyakarimi, S. (2022), Probable earning manipulation and fraud in banking sector. Empirical study from
East Africa. Cogent Economics and Finance, 10(1), 1-20.
[23]. Rahmani, H. F., & Oktalita, L. (2023). Variables Related To The Formation Of Financial Statement Fraud
With Beneish M Score In The Triangle Theory Concept Framework. Jurnal AKSI (Akuntansi dan Sistem
Informasi), 8(1).
[24]. Repousis, S. (2016), Using Beneish model to detect corporate financial statement fraud in Greece.
Journal of Financial Crime, 23(4), 1063-1073.

More Related Content

Similar to Detecting Financial Statement Manipulation in Selected Indian Telecom Companies Using Beneish M-Score Model

Telecom sector-in-india
Telecom sector-in-indiaTelecom sector-in-india
Telecom sector-in-indiaKarron Singh
 
Telecom Outlook 2011-12 by Sohag Sarkar
Telecom Outlook 2011-12 by Sohag SarkarTelecom Outlook 2011-12 by Sohag Sarkar
Telecom Outlook 2011-12 by Sohag SarkarSohag Sarkar
 
Understanding internet industry in india
Understanding internet industry in indiaUnderstanding internet industry in india
Understanding internet industry in indiaadverteaze.com
 
Recommondation teleco(manufacturing)
Recommondation teleco(manufacturing)Recommondation teleco(manufacturing)
Recommondation teleco(manufacturing)bsmihd
 
Vodafone idea limited services
Vodafone idea limited servicesVodafone idea limited services
Vodafone idea limited servicesGBCYBER
 
Telecom Industry in India- A Brief Review
Telecom Industry in India- A Brief ReviewTelecom Industry in India- A Brief Review
Telecom Industry in India- A Brief ReviewRashmi Ranjan Moharana
 
Asia - Telecommunication services analysis 2014
Asia - Telecommunication services analysis 2014Asia - Telecommunication services analysis 2014
Asia - Telecommunication services analysis 2014Dao Phuong Nam
 
Broadband 2022: Unlocking a Trillion Dollar Digital Economy
Broadband 2022: Unlocking a Trillion Dollar Digital EconomyBroadband 2022: Unlocking a Trillion Dollar Digital Economy
Broadband 2022: Unlocking a Trillion Dollar Digital EconomyConfederation of Indian Industry
 
Gsma me report_2014_r2_web
Gsma me report_2014_r2_webGsma me report_2014_r2_web
Gsma me report_2014_r2_webSandeep Parashar
 
Telecom group 2 section a
Telecom group 2 section aTelecom group 2 section a
Telecom group 2 section ablackbat999
 
Vodafone value enabled services to business customers.
Vodafone value enabled services to business customers. Vodafone value enabled services to business customers.
Vodafone value enabled services to business customers. Paul Palathingal
 
A STUDY ON FACTORS INFLUENCING BRAND SWITCHING BEHAVIOUR AMONG BSNL CUSTOMERS
A STUDY ON FACTORS INFLUENCING BRAND SWITCHING BEHAVIOUR AMONG BSNL CUSTOMERSA STUDY ON FACTORS INFLUENCING BRAND SWITCHING BEHAVIOUR AMONG BSNL CUSTOMERS
A STUDY ON FACTORS INFLUENCING BRAND SWITCHING BEHAVIOUR AMONG BSNL CUSTOMERSAaron Anyaakuu
 
GSMA Mobile Economy India Report 2013
GSMA Mobile Economy India Report 2013GSMA Mobile Economy India Report 2013
GSMA Mobile Economy India Report 2013Manas Ganguly
 
Project report on Marketing Strategy of Nokia and Samsung by SAHIB KHAN 90120...
Project report on Marketing Strategy of Nokia and Samsung by SAHIB KHAN 90120...Project report on Marketing Strategy of Nokia and Samsung by SAHIB KHAN 90120...
Project report on Marketing Strategy of Nokia and Samsung by SAHIB KHAN 90120...sahibkhan143
 

Similar to Detecting Financial Statement Manipulation in Selected Indian Telecom Companies Using Beneish M-Score Model (20)

Telecom sector-in-india
Telecom sector-in-indiaTelecom sector-in-india
Telecom sector-in-india
 
Telecom sector
Telecom sectorTelecom sector
Telecom sector
 
Telecom industry
Telecom industryTelecom industry
Telecom industry
 
Telecom Outlook 2011-12 by Sohag Sarkar
Telecom Outlook 2011-12 by Sohag SarkarTelecom Outlook 2011-12 by Sohag Sarkar
Telecom Outlook 2011-12 by Sohag Sarkar
 
Understanding internet industry in india
Understanding internet industry in indiaUnderstanding internet industry in india
Understanding internet industry in india
 
Recommondation teleco(manufacturing)
Recommondation teleco(manufacturing)Recommondation teleco(manufacturing)
Recommondation teleco(manufacturing)
 
Vodafone idea limited services
Vodafone idea limited servicesVodafone idea limited services
Vodafone idea limited services
 
Telecom Industry in India- A Brief Review
Telecom Industry in India- A Brief ReviewTelecom Industry in India- A Brief Review
Telecom Industry in India- A Brief Review
 
Tata Docomo Report
Tata Docomo ReportTata Docomo Report
Tata Docomo Report
 
Asia - Telecommunication services analysis 2014
Asia - Telecommunication services analysis 2014Asia - Telecommunication services analysis 2014
Asia - Telecommunication services analysis 2014
 
Broadband 2022: Unlocking a Trillion Dollar Digital Economy
Broadband 2022: Unlocking a Trillion Dollar Digital EconomyBroadband 2022: Unlocking a Trillion Dollar Digital Economy
Broadband 2022: Unlocking a Trillion Dollar Digital Economy
 
Gsma me report_2014_r2_web
Gsma me report_2014_r2_webGsma me report_2014_r2_web
Gsma me report_2014_r2_web
 
The Mobile Economy 2014
The Mobile Economy 2014The Mobile Economy 2014
The Mobile Economy 2014
 
Telecommunication Sectore Report - January 2017
Telecommunication Sectore Report - January 2017Telecommunication Sectore Report - January 2017
Telecommunication Sectore Report - January 2017
 
Telecommunications Sector Report - April 2019
Telecommunications Sector Report - April 2019Telecommunications Sector Report - April 2019
Telecommunications Sector Report - April 2019
 
Telecom group 2 section a
Telecom group 2 section aTelecom group 2 section a
Telecom group 2 section a
 
Vodafone value enabled services to business customers.
Vodafone value enabled services to business customers. Vodafone value enabled services to business customers.
Vodafone value enabled services to business customers.
 
A STUDY ON FACTORS INFLUENCING BRAND SWITCHING BEHAVIOUR AMONG BSNL CUSTOMERS
A STUDY ON FACTORS INFLUENCING BRAND SWITCHING BEHAVIOUR AMONG BSNL CUSTOMERSA STUDY ON FACTORS INFLUENCING BRAND SWITCHING BEHAVIOUR AMONG BSNL CUSTOMERS
A STUDY ON FACTORS INFLUENCING BRAND SWITCHING BEHAVIOUR AMONG BSNL CUSTOMERS
 
GSMA Mobile Economy India Report 2013
GSMA Mobile Economy India Report 2013GSMA Mobile Economy India Report 2013
GSMA Mobile Economy India Report 2013
 
Project report on Marketing Strategy of Nokia and Samsung by SAHIB KHAN 90120...
Project report on Marketing Strategy of Nokia and Samsung by SAHIB KHAN 90120...Project report on Marketing Strategy of Nokia and Samsung by SAHIB KHAN 90120...
Project report on Marketing Strategy of Nokia and Samsung by SAHIB KHAN 90120...
 

More from AJHSSR Journal

Thomas Paine’s Dethronement of Hereditary Succession, For The Reign Of Popula...
Thomas Paine’s Dethronement of Hereditary Succession, For The Reign Of Popula...Thomas Paine’s Dethronement of Hereditary Succession, For The Reign Of Popula...
Thomas Paine’s Dethronement of Hereditary Succession, For The Reign Of Popula...AJHSSR Journal
 
Paglilinang ng mga Kasanayan at Pamamaraan ng Pagtuturo ng Wikang Filipino
Paglilinang ng mga Kasanayan at Pamamaraan ng Pagtuturo ng Wikang FilipinoPaglilinang ng mga Kasanayan at Pamamaraan ng Pagtuturo ng Wikang Filipino
Paglilinang ng mga Kasanayan at Pamamaraan ng Pagtuturo ng Wikang FilipinoAJHSSR Journal
 
Intentional Child and Youth Care Life-Space Practice: A Qualitative Course-Ba...
Intentional Child and Youth Care Life-Space Practice: A Qualitative Course-Ba...Intentional Child and Youth Care Life-Space Practice: A Qualitative Course-Ba...
Intentional Child and Youth Care Life-Space Practice: A Qualitative Course-Ba...AJHSSR Journal
 
COMPARATIVESTUDYBETWENTHERMAL ENGINE PROPULSION AND HYBRID PROPULSION
COMPARATIVESTUDYBETWENTHERMAL ENGINE PROPULSION AND HYBRID PROPULSIONCOMPARATIVESTUDYBETWENTHERMAL ENGINE PROPULSION AND HYBRID PROPULSION
COMPARATIVESTUDYBETWENTHERMAL ENGINE PROPULSION AND HYBRID PROPULSIONAJHSSR Journal
 
THE INFLUENCE OF COMPETENCE ON THE PERFORMANCE OF ALUMNI GRADUATES IN 2020 AN...
THE INFLUENCE OF COMPETENCE ON THE PERFORMANCE OF ALUMNI GRADUATES IN 2020 AN...THE INFLUENCE OF COMPETENCE ON THE PERFORMANCE OF ALUMNI GRADUATES IN 2020 AN...
THE INFLUENCE OF COMPETENCE ON THE PERFORMANCE OF ALUMNI GRADUATES IN 2020 AN...AJHSSR Journal
 
The Influence of Financial Conditions on Taxpayer Compliance with Tax Sociali...
The Influence of Financial Conditions on Taxpayer Compliance with Tax Sociali...The Influence of Financial Conditions on Taxpayer Compliance with Tax Sociali...
The Influence of Financial Conditions on Taxpayer Compliance with Tax Sociali...AJHSSR Journal
 
Impact Of Educational Resources on Students' Academic Performance in Economic...
Impact Of Educational Resources on Students' Academic Performance in Economic...Impact Of Educational Resources on Students' Academic Performance in Economic...
Impact Of Educational Resources on Students' Academic Performance in Economic...AJHSSR Journal
 
MGA SALIK NA NAKAAAPEKTO SA ANTAS NG PAGUNAWA SA PAGBASA NG MGA MAG-AARAL SA ...
MGA SALIK NA NAKAAAPEKTO SA ANTAS NG PAGUNAWA SA PAGBASA NG MGA MAG-AARAL SA ...MGA SALIK NA NAKAAAPEKTO SA ANTAS NG PAGUNAWA SA PAGBASA NG MGA MAG-AARAL SA ...
MGA SALIK NA NAKAAAPEKTO SA ANTAS NG PAGUNAWA SA PAGBASA NG MGA MAG-AARAL SA ...AJHSSR Journal
 
Pagkabalisa sa Pagsasalita Gamit ang Wikang Filipino ng mga mag-aaral sa Pili...
Pagkabalisa sa Pagsasalita Gamit ang Wikang Filipino ng mga mag-aaral sa Pili...Pagkabalisa sa Pagsasalita Gamit ang Wikang Filipino ng mga mag-aaral sa Pili...
Pagkabalisa sa Pagsasalita Gamit ang Wikang Filipino ng mga mag-aaral sa Pili...AJHSSR Journal
 
“Mga Salik na Nakaaapekto sa Pagkatuto ng Mag-aaral sa Asignaturang Filipino”
“Mga Salik na Nakaaapekto sa Pagkatuto ng Mag-aaral sa Asignaturang Filipino”“Mga Salik na Nakaaapekto sa Pagkatuto ng Mag-aaral sa Asignaturang Filipino”
“Mga Salik na Nakaaapekto sa Pagkatuto ng Mag-aaral sa Asignaturang Filipino”AJHSSR Journal
 
What Is This “Home Sweet Home”: A Course-Based Qualitative Exploration of the...
What Is This “Home Sweet Home”: A Course-Based Qualitative Exploration of the...What Is This “Home Sweet Home”: A Course-Based Qualitative Exploration of the...
What Is This “Home Sweet Home”: A Course-Based Qualitative Exploration of the...AJHSSR Journal
 
21st Century Teaching and Learning: Ang Pananaw ng mga PreService Teachers ng...
21st Century Teaching and Learning: Ang Pananaw ng mga PreService Teachers ng...21st Century Teaching and Learning: Ang Pananaw ng mga PreService Teachers ng...
21st Century Teaching and Learning: Ang Pananaw ng mga PreService Teachers ng...AJHSSR Journal
 
Mga Kagamitang Pampagtuturong Ginagamit sa mga Asignaturang Filipino
Mga Kagamitang Pampagtuturong Ginagamit sa mga Asignaturang FilipinoMga Kagamitang Pampagtuturong Ginagamit sa mga Asignaturang Filipino
Mga Kagamitang Pampagtuturong Ginagamit sa mga Asignaturang FilipinoAJHSSR Journal
 
MABUBUTING GAWI SA PAGLINANG NG KASANAYAN SA PAGBASA NG MGA MAG-AARAL SA JUNI...
MABUBUTING GAWI SA PAGLINANG NG KASANAYAN SA PAGBASA NG MGA MAG-AARAL SA JUNI...MABUBUTING GAWI SA PAGLINANG NG KASANAYAN SA PAGBASA NG MGA MAG-AARAL SA JUNI...
MABUBUTING GAWI SA PAGLINANG NG KASANAYAN SA PAGBASA NG MGA MAG-AARAL SA JUNI...AJHSSR Journal
 
Le bulletin municipal, un instrument de communication publique pour le market...
Le bulletin municipal, un instrument de communication publique pour le market...Le bulletin municipal, un instrument de communication publique pour le market...
Le bulletin municipal, un instrument de communication publique pour le market...AJHSSR Journal
 
NORTH LAMPUNG REGIONAL POLICE'S EFFORTS TO ERADICATE COCKFIGHTING
NORTH LAMPUNG REGIONAL POLICE'S EFFORTS TO ERADICATE COCKFIGHTINGNORTH LAMPUNG REGIONAL POLICE'S EFFORTS TO ERADICATE COCKFIGHTING
NORTH LAMPUNG REGIONAL POLICE'S EFFORTS TO ERADICATE COCKFIGHTINGAJHSSR Journal
 
Online Social Shopping Motivation: A Preliminary Study
Online Social Shopping Motivation: A Preliminary StudyOnline Social Shopping Motivation: A Preliminary Study
Online Social Shopping Motivation: A Preliminary StudyAJHSSR Journal
 
SEXUAL ACTS COMMITTED BY CHILDREN SEXUAL ACTS COMMITTED BY CHILDREN
SEXUAL ACTS COMMITTED BY CHILDREN SEXUAL ACTS COMMITTED BY CHILDRENSEXUAL ACTS COMMITTED BY CHILDREN SEXUAL ACTS COMMITTED BY CHILDREN
SEXUAL ACTS COMMITTED BY CHILDREN SEXUAL ACTS COMMITTED BY CHILDRENAJHSSR Journal
 
Mga Batayan sa Pagpili ng Asignaturang Medyor ng mga Magaaral ng Batsilyer ng...
Mga Batayan sa Pagpili ng Asignaturang Medyor ng mga Magaaral ng Batsilyer ng...Mga Batayan sa Pagpili ng Asignaturang Medyor ng mga Magaaral ng Batsilyer ng...
Mga Batayan sa Pagpili ng Asignaturang Medyor ng mga Magaaral ng Batsilyer ng...AJHSSR Journal
 
Vietnamese EFL students’ perception and preferences for teachers’ written fee...
Vietnamese EFL students’ perception and preferences for teachers’ written fee...Vietnamese EFL students’ perception and preferences for teachers’ written fee...
Vietnamese EFL students’ perception and preferences for teachers’ written fee...AJHSSR Journal
 

More from AJHSSR Journal (20)

Thomas Paine’s Dethronement of Hereditary Succession, For The Reign Of Popula...
Thomas Paine’s Dethronement of Hereditary Succession, For The Reign Of Popula...Thomas Paine’s Dethronement of Hereditary Succession, For The Reign Of Popula...
Thomas Paine’s Dethronement of Hereditary Succession, For The Reign Of Popula...
 
Paglilinang ng mga Kasanayan at Pamamaraan ng Pagtuturo ng Wikang Filipino
Paglilinang ng mga Kasanayan at Pamamaraan ng Pagtuturo ng Wikang FilipinoPaglilinang ng mga Kasanayan at Pamamaraan ng Pagtuturo ng Wikang Filipino
Paglilinang ng mga Kasanayan at Pamamaraan ng Pagtuturo ng Wikang Filipino
 
Intentional Child and Youth Care Life-Space Practice: A Qualitative Course-Ba...
Intentional Child and Youth Care Life-Space Practice: A Qualitative Course-Ba...Intentional Child and Youth Care Life-Space Practice: A Qualitative Course-Ba...
Intentional Child and Youth Care Life-Space Practice: A Qualitative Course-Ba...
 
COMPARATIVESTUDYBETWENTHERMAL ENGINE PROPULSION AND HYBRID PROPULSION
COMPARATIVESTUDYBETWENTHERMAL ENGINE PROPULSION AND HYBRID PROPULSIONCOMPARATIVESTUDYBETWENTHERMAL ENGINE PROPULSION AND HYBRID PROPULSION
COMPARATIVESTUDYBETWENTHERMAL ENGINE PROPULSION AND HYBRID PROPULSION
 
THE INFLUENCE OF COMPETENCE ON THE PERFORMANCE OF ALUMNI GRADUATES IN 2020 AN...
THE INFLUENCE OF COMPETENCE ON THE PERFORMANCE OF ALUMNI GRADUATES IN 2020 AN...THE INFLUENCE OF COMPETENCE ON THE PERFORMANCE OF ALUMNI GRADUATES IN 2020 AN...
THE INFLUENCE OF COMPETENCE ON THE PERFORMANCE OF ALUMNI GRADUATES IN 2020 AN...
 
The Influence of Financial Conditions on Taxpayer Compliance with Tax Sociali...
The Influence of Financial Conditions on Taxpayer Compliance with Tax Sociali...The Influence of Financial Conditions on Taxpayer Compliance with Tax Sociali...
The Influence of Financial Conditions on Taxpayer Compliance with Tax Sociali...
 
Impact Of Educational Resources on Students' Academic Performance in Economic...
Impact Of Educational Resources on Students' Academic Performance in Economic...Impact Of Educational Resources on Students' Academic Performance in Economic...
Impact Of Educational Resources on Students' Academic Performance in Economic...
 
MGA SALIK NA NAKAAAPEKTO SA ANTAS NG PAGUNAWA SA PAGBASA NG MGA MAG-AARAL SA ...
MGA SALIK NA NAKAAAPEKTO SA ANTAS NG PAGUNAWA SA PAGBASA NG MGA MAG-AARAL SA ...MGA SALIK NA NAKAAAPEKTO SA ANTAS NG PAGUNAWA SA PAGBASA NG MGA MAG-AARAL SA ...
MGA SALIK NA NAKAAAPEKTO SA ANTAS NG PAGUNAWA SA PAGBASA NG MGA MAG-AARAL SA ...
 
Pagkabalisa sa Pagsasalita Gamit ang Wikang Filipino ng mga mag-aaral sa Pili...
Pagkabalisa sa Pagsasalita Gamit ang Wikang Filipino ng mga mag-aaral sa Pili...Pagkabalisa sa Pagsasalita Gamit ang Wikang Filipino ng mga mag-aaral sa Pili...
Pagkabalisa sa Pagsasalita Gamit ang Wikang Filipino ng mga mag-aaral sa Pili...
 
“Mga Salik na Nakaaapekto sa Pagkatuto ng Mag-aaral sa Asignaturang Filipino”
“Mga Salik na Nakaaapekto sa Pagkatuto ng Mag-aaral sa Asignaturang Filipino”“Mga Salik na Nakaaapekto sa Pagkatuto ng Mag-aaral sa Asignaturang Filipino”
“Mga Salik na Nakaaapekto sa Pagkatuto ng Mag-aaral sa Asignaturang Filipino”
 
What Is This “Home Sweet Home”: A Course-Based Qualitative Exploration of the...
What Is This “Home Sweet Home”: A Course-Based Qualitative Exploration of the...What Is This “Home Sweet Home”: A Course-Based Qualitative Exploration of the...
What Is This “Home Sweet Home”: A Course-Based Qualitative Exploration of the...
 
21st Century Teaching and Learning: Ang Pananaw ng mga PreService Teachers ng...
21st Century Teaching and Learning: Ang Pananaw ng mga PreService Teachers ng...21st Century Teaching and Learning: Ang Pananaw ng mga PreService Teachers ng...
21st Century Teaching and Learning: Ang Pananaw ng mga PreService Teachers ng...
 
Mga Kagamitang Pampagtuturong Ginagamit sa mga Asignaturang Filipino
Mga Kagamitang Pampagtuturong Ginagamit sa mga Asignaturang FilipinoMga Kagamitang Pampagtuturong Ginagamit sa mga Asignaturang Filipino
Mga Kagamitang Pampagtuturong Ginagamit sa mga Asignaturang Filipino
 
MABUBUTING GAWI SA PAGLINANG NG KASANAYAN SA PAGBASA NG MGA MAG-AARAL SA JUNI...
MABUBUTING GAWI SA PAGLINANG NG KASANAYAN SA PAGBASA NG MGA MAG-AARAL SA JUNI...MABUBUTING GAWI SA PAGLINANG NG KASANAYAN SA PAGBASA NG MGA MAG-AARAL SA JUNI...
MABUBUTING GAWI SA PAGLINANG NG KASANAYAN SA PAGBASA NG MGA MAG-AARAL SA JUNI...
 
Le bulletin municipal, un instrument de communication publique pour le market...
Le bulletin municipal, un instrument de communication publique pour le market...Le bulletin municipal, un instrument de communication publique pour le market...
Le bulletin municipal, un instrument de communication publique pour le market...
 
NORTH LAMPUNG REGIONAL POLICE'S EFFORTS TO ERADICATE COCKFIGHTING
NORTH LAMPUNG REGIONAL POLICE'S EFFORTS TO ERADICATE COCKFIGHTINGNORTH LAMPUNG REGIONAL POLICE'S EFFORTS TO ERADICATE COCKFIGHTING
NORTH LAMPUNG REGIONAL POLICE'S EFFORTS TO ERADICATE COCKFIGHTING
 
Online Social Shopping Motivation: A Preliminary Study
Online Social Shopping Motivation: A Preliminary StudyOnline Social Shopping Motivation: A Preliminary Study
Online Social Shopping Motivation: A Preliminary Study
 
SEXUAL ACTS COMMITTED BY CHILDREN SEXUAL ACTS COMMITTED BY CHILDREN
SEXUAL ACTS COMMITTED BY CHILDREN SEXUAL ACTS COMMITTED BY CHILDRENSEXUAL ACTS COMMITTED BY CHILDREN SEXUAL ACTS COMMITTED BY CHILDREN
SEXUAL ACTS COMMITTED BY CHILDREN SEXUAL ACTS COMMITTED BY CHILDREN
 
Mga Batayan sa Pagpili ng Asignaturang Medyor ng mga Magaaral ng Batsilyer ng...
Mga Batayan sa Pagpili ng Asignaturang Medyor ng mga Magaaral ng Batsilyer ng...Mga Batayan sa Pagpili ng Asignaturang Medyor ng mga Magaaral ng Batsilyer ng...
Mga Batayan sa Pagpili ng Asignaturang Medyor ng mga Magaaral ng Batsilyer ng...
 
Vietnamese EFL students’ perception and preferences for teachers’ written fee...
Vietnamese EFL students’ perception and preferences for teachers’ written fee...Vietnamese EFL students’ perception and preferences for teachers’ written fee...
Vietnamese EFL students’ perception and preferences for teachers’ written fee...
 

Recently uploaded

TERSEDIA OBAT PENGGUGUR KANDUNGAN MAKASSAR KLINIK ABORSI MAKASSAR 087776558899
TERSEDIA OBAT PENGGUGUR KANDUNGAN MAKASSAR KLINIK ABORSI MAKASSAR 087776558899TERSEDIA OBAT PENGGUGUR KANDUNGAN MAKASSAR KLINIK ABORSI MAKASSAR 087776558899
TERSEDIA OBAT PENGGUGUR KANDUNGAN MAKASSAR KLINIK ABORSI MAKASSAR 087776558899Obat Cytotec
 
Marketing Plan - Social Media. The Sparks Foundation
Marketing Plan -  Social Media. The Sparks FoundationMarketing Plan -  Social Media. The Sparks Foundation
Marketing Plan - Social Media. The Sparks Foundationsolidgbemi
 
JUAL PILL CYTOTEC PALOPO SULAWESI 087776558899 OBAT PENGGUGUR KANDUNGAN PALOP...
JUAL PILL CYTOTEC PALOPO SULAWESI 087776558899 OBAT PENGGUGUR KANDUNGAN PALOP...JUAL PILL CYTOTEC PALOPO SULAWESI 087776558899 OBAT PENGGUGUR KANDUNGAN PALOP...
JUAL PILL CYTOTEC PALOPO SULAWESI 087776558899 OBAT PENGGUGUR KANDUNGAN PALOP...Cara Menggugurkan Kandungan 087776558899
 
Content strategy : Content empire and cash in
Content strategy : Content empire and cash inContent strategy : Content empire and cash in
Content strategy : Content empire and cash inKreators Lisbon
 
💊💊 OBAT PENGGUGUR KANDUNGAN SEMARANG 087776-558899 ABORSI KLINIK SEMARANG
💊💊 OBAT PENGGUGUR KANDUNGAN SEMARANG 087776-558899 ABORSI KLINIK SEMARANG💊💊 OBAT PENGGUGUR KANDUNGAN SEMARANG 087776-558899 ABORSI KLINIK SEMARANG
💊💊 OBAT PENGGUGUR KANDUNGAN SEMARANG 087776-558899 ABORSI KLINIK SEMARANGCara Menggugurkan Kandungan 087776558899
 
# HAMIL 4 BULAN # CARA MENGGUGURKAN KANDUNGAN USIA 4 BULAN √087776558899√
# HAMIL 4 BULAN # CARA MENGGUGURKAN KANDUNGAN USIA 4 BULAN √087776558899√# HAMIL 4 BULAN # CARA MENGGUGURKAN KANDUNGAN USIA 4 BULAN √087776558899√
# HAMIL 4 BULAN # CARA MENGGUGURKAN KANDUNGAN USIA 4 BULAN √087776558899√Obat Cytotec
 
Jual Obat Aborsi Kudus ( Asli No.1 ) 085657271886 Obat Penggugur Kandungan Cy...
Jual Obat Aborsi Kudus ( Asli No.1 ) 085657271886 Obat Penggugur Kandungan Cy...Jual Obat Aborsi Kudus ( Asli No.1 ) 085657271886 Obat Penggugur Kandungan Cy...
Jual Obat Aborsi Kudus ( Asli No.1 ) 085657271886 Obat Penggugur Kandungan Cy...ZurliaSoop
 
At-Sharjah ☎ +971554789724__**☎ Abortion Pills for sale in Sharjah, Uae
At-Sharjah ☎ +971554789724__**☎ Abortion Pills for sale in Sharjah, UaeAt-Sharjah ☎ +971554789724__**☎ Abortion Pills for sale in Sharjah, Uae
At-Sharjah ☎ +971554789724__**☎ Abortion Pills for sale in Sharjah, Uaemikemrmik
 
Jual obat aborsi Asli Taiwan ( 085657271886 ) Cytote pil telat bulan penggugu...
Jual obat aborsi Asli Taiwan ( 085657271886 ) Cytote pil telat bulan penggugu...Jual obat aborsi Asli Taiwan ( 085657271886 ) Cytote pil telat bulan penggugu...
Jual obat aborsi Asli Taiwan ( 085657271886 ) Cytote pil telat bulan penggugu...Klinik kandungan
 
ONPAGE SEO types presentation, presented by botany science
ONPAGE SEO types presentation, presented by botany scienceONPAGE SEO types presentation, presented by botany science
ONPAGE SEO types presentation, presented by botany sciencezoha951268
 
Buku Prediksi Togel Sydney Malam ini 4d 100 perak MAGNUMTOGEL
Buku Prediksi Togel Sydney Malam ini 4d 100 perak MAGNUMTOGELBuku Prediksi Togel Sydney Malam ini 4d 100 perak MAGNUMTOGEL
Buku Prediksi Togel Sydney Malam ini 4d 100 perak MAGNUMTOGELliangtehdingin748
 
Jual obat aborsi Bekasi ( 085657271886 ) Cytote pil telat bulan penggugur kan...
Jual obat aborsi Bekasi ( 085657271886 ) Cytote pil telat bulan penggugur kan...Jual obat aborsi Bekasi ( 085657271886 ) Cytote pil telat bulan penggugur kan...
Jual obat aborsi Bekasi ( 085657271886 ) Cytote pil telat bulan penggugur kan...ZurliaSoop
 
Sociocosmos empowers you to go trendy on social media with a few clicks..pdf
Sociocosmos empowers you to go trendy on social media with a few clicks..pdfSociocosmos empowers you to go trendy on social media with a few clicks..pdf
Sociocosmos empowers you to go trendy on social media with a few clicks..pdfSocioCosmos
 

Recently uploaded (13)

TERSEDIA OBAT PENGGUGUR KANDUNGAN MAKASSAR KLINIK ABORSI MAKASSAR 087776558899
TERSEDIA OBAT PENGGUGUR KANDUNGAN MAKASSAR KLINIK ABORSI MAKASSAR 087776558899TERSEDIA OBAT PENGGUGUR KANDUNGAN MAKASSAR KLINIK ABORSI MAKASSAR 087776558899
TERSEDIA OBAT PENGGUGUR KANDUNGAN MAKASSAR KLINIK ABORSI MAKASSAR 087776558899
 
Marketing Plan - Social Media. The Sparks Foundation
Marketing Plan -  Social Media. The Sparks FoundationMarketing Plan -  Social Media. The Sparks Foundation
Marketing Plan - Social Media. The Sparks Foundation
 
JUAL PILL CYTOTEC PALOPO SULAWESI 087776558899 OBAT PENGGUGUR KANDUNGAN PALOP...
JUAL PILL CYTOTEC PALOPO SULAWESI 087776558899 OBAT PENGGUGUR KANDUNGAN PALOP...JUAL PILL CYTOTEC PALOPO SULAWESI 087776558899 OBAT PENGGUGUR KANDUNGAN PALOP...
JUAL PILL CYTOTEC PALOPO SULAWESI 087776558899 OBAT PENGGUGUR KANDUNGAN PALOP...
 
Content strategy : Content empire and cash in
Content strategy : Content empire and cash inContent strategy : Content empire and cash in
Content strategy : Content empire and cash in
 
💊💊 OBAT PENGGUGUR KANDUNGAN SEMARANG 087776-558899 ABORSI KLINIK SEMARANG
💊💊 OBAT PENGGUGUR KANDUNGAN SEMARANG 087776-558899 ABORSI KLINIK SEMARANG💊💊 OBAT PENGGUGUR KANDUNGAN SEMARANG 087776-558899 ABORSI KLINIK SEMARANG
💊💊 OBAT PENGGUGUR KANDUNGAN SEMARANG 087776-558899 ABORSI KLINIK SEMARANG
 
# HAMIL 4 BULAN # CARA MENGGUGURKAN KANDUNGAN USIA 4 BULAN √087776558899√
# HAMIL 4 BULAN # CARA MENGGUGURKAN KANDUNGAN USIA 4 BULAN √087776558899√# HAMIL 4 BULAN # CARA MENGGUGURKAN KANDUNGAN USIA 4 BULAN √087776558899√
# HAMIL 4 BULAN # CARA MENGGUGURKAN KANDUNGAN USIA 4 BULAN √087776558899√
 
Jual Obat Aborsi Kudus ( Asli No.1 ) 085657271886 Obat Penggugur Kandungan Cy...
Jual Obat Aborsi Kudus ( Asli No.1 ) 085657271886 Obat Penggugur Kandungan Cy...Jual Obat Aborsi Kudus ( Asli No.1 ) 085657271886 Obat Penggugur Kandungan Cy...
Jual Obat Aborsi Kudus ( Asli No.1 ) 085657271886 Obat Penggugur Kandungan Cy...
 
At-Sharjah ☎ +971554789724__**☎ Abortion Pills for sale in Sharjah, Uae
At-Sharjah ☎ +971554789724__**☎ Abortion Pills for sale in Sharjah, UaeAt-Sharjah ☎ +971554789724__**☎ Abortion Pills for sale in Sharjah, Uae
At-Sharjah ☎ +971554789724__**☎ Abortion Pills for sale in Sharjah, Uae
 
Jual obat aborsi Asli Taiwan ( 085657271886 ) Cytote pil telat bulan penggugu...
Jual obat aborsi Asli Taiwan ( 085657271886 ) Cytote pil telat bulan penggugu...Jual obat aborsi Asli Taiwan ( 085657271886 ) Cytote pil telat bulan penggugu...
Jual obat aborsi Asli Taiwan ( 085657271886 ) Cytote pil telat bulan penggugu...
 
ONPAGE SEO types presentation, presented by botany science
ONPAGE SEO types presentation, presented by botany scienceONPAGE SEO types presentation, presented by botany science
ONPAGE SEO types presentation, presented by botany science
 
Buku Prediksi Togel Sydney Malam ini 4d 100 perak MAGNUMTOGEL
Buku Prediksi Togel Sydney Malam ini 4d 100 perak MAGNUMTOGELBuku Prediksi Togel Sydney Malam ini 4d 100 perak MAGNUMTOGEL
Buku Prediksi Togel Sydney Malam ini 4d 100 perak MAGNUMTOGEL
 
Jual obat aborsi Bekasi ( 085657271886 ) Cytote pil telat bulan penggugur kan...
Jual obat aborsi Bekasi ( 085657271886 ) Cytote pil telat bulan penggugur kan...Jual obat aborsi Bekasi ( 085657271886 ) Cytote pil telat bulan penggugur kan...
Jual obat aborsi Bekasi ( 085657271886 ) Cytote pil telat bulan penggugur kan...
 
Sociocosmos empowers you to go trendy on social media with a few clicks..pdf
Sociocosmos empowers you to go trendy on social media with a few clicks..pdfSociocosmos empowers you to go trendy on social media with a few clicks..pdf
Sociocosmos empowers you to go trendy on social media with a few clicks..pdf
 

Detecting Financial Statement Manipulation in Selected Indian Telecom Companies Using Beneish M-Score Model

  • 1. American Journal of Humanities and Social Sciences Research (AJHSSR) 2023 A J H S S R J o u r n a l P a g e | 107 American Journal of Humanities and Social Sciences Research (AJHSSR) e-ISSN : 2378-703X Volume-07, Issue-10, pp-107-116 www.ajhssr.com Research Paper Open Access Detecting Financial Statement Manipulation in Selected Indian Telecom Companies Using Beneish M-Score Model Arshe Azam1 , Afreen Begum2 1 Research Scholar, Department of Management and Commerce, Maulana Azad National Urdu University Hyderabad, Telangana, India Email: azamarshe0@gmail.com 2 Research Scholar, Department of Management and Commerce, Maulana Azad National Urdu University Hyderabad, Telangana, India Email: afreenbegum94407@gmail.com ABSTRACT : The Indian telecom sector, with 1.17 billion users and the second-largest market globally, is experiencing exponential growth due to factors like affordable prices, accessibility, and government initiatives. The introduction of 5G technology has accelerated this growth, with projections of 920 million mobile users by 2025 and an economic boost of $450 billion between 2023 and 2040. Financial statement manipulation poses a significant challenge in the realm of corporate finance, potentially misleading investors and stakeholders. This study delves into the intricate domain of financial statement analysis, focusing on five Indian telecom companies, a sector pivotal to the nation's economic growth with a period of five years from 2018 to 2022. Employing the renowned Beneish M-Score Model, this research endeavors to detect instances of financial statement manipulation within the chosen telecom entities. This paper also explores a quantitative analysis using the Beneish M-score model was used to investigate earnings manipulation within Indian telecom firms. The study highlights the complexities of financial statement fraud in the telecom sector and the need for vigilance for sustainable growth and investor confidence. KEYWORDS: Financial Statement Manipulation, Beneish M-Score Model, Indian Telecom Companies, Financial Fraud Detection, Earnings Manipulation, Not Earnings Manipulation. I. INTRODUCTION The Indian telecom companies have 1.17 billion users (wireless + wireline subscribers) as of September 2022, India's telecom sector is the second largest in the world. India has a teledensity of 84.86% overall, with a rural market that is mainly unexplored with a teledensity of 58.01% and an urban market that has a teledensity of 134.62%. A total of 839.18 million people (narrowband + broadband users) had internet access by the end of January 2023, with 44.25% of those people living in rural areas. Additionally, the average monthly data usage per wireless data subscriber has climbed by 22,605%, from 61.66 MB in March 2014 to 16.40 GB in June 2022. Affordable prices, increased accessibility, the introduction of Mobile Number Portability (MNP), expanding 3G and 4G coverage, changing subscriber consumption patterns, government initiatives to increase India's domestic telecom manufacturing capacity, and a supportive regulatory environment have all contributed to the industry's exponential growth over the past few years. The Government has authorized the sale of IMT/5G spectrum for the nationwide deployment of 5G services in order to speed up digital connection even more. By the end of July 2022, this auction had been successfully completed and brought in $18.77 billion. With 6.43% of all FDI inflows, the telecom sector ranks third in terms of the amount of FDI received. It supports 2.2 million jobs directly and 1.8 million jobs indirectly. The amount of FDI in the telecom sector between 2014 and 2021 increased by 150%, from $8.32 billion to $20.72 billion. In Telecom, 100% Foreign Direct Investment (FDI) is currently permitted. Infrastructure, Equipment, Mobile Virtual Network Operators (MNVO), White Space Spectrum, 5G, Telephone service providers, and Broadband are the subsectors that make up the telecommunications sector. By 2025, India is predicted to have 920 million unique mobile customers, including 88 million 5G connections, making it the second-largest smartphone market in the world. This is according to the GSMA. It is predicted that 5G technology will boost the Indian economy by $450 billion between 2023 and 2040. In nearly the past ten years, India has added nearly 500 million additional smartphone users. By 2026, there will be 850 million smartphone users or around 55% of the population. In order to actualize a new variety of options, business models, and employment potential, the Government of India wants to establish 100 labs for creating
  • 2. American Journal of Humanities and Social Sciences Research (AJHSSR) 2023 A J H S S R J o u r n a l P a g e | 108 applications using 5G services in engineering universities under the Union Budget 2023. By December 2022, the DoT hopes to have installed 30 lakh km of fiber optic cable, 55% of mobile towers have been built, and all villages have 100 percent internet connectivity. From 61 million in March 2014 to 816 million in September 2022, broadband connections increased by 1238%. By December 2024, DoT hopes to have 70% of towers fiberized, average internet speeds of 50 Mbps, and a rollout of 50 lakh km of fiber optic cable across all of India. According to the Network Readiness Index 2022, India moved up six positions to take up position 61. ➢ India ranks second in both "International Internet bandwidth" and "Mobile broadband internet traffic within the country." ➢ Internet connections increased by 232%, from 25.15 crore in March 2014 to 83.69 crore in June 2022. ➢ From 6.1 crore in March 2014 to 81.62 crore in September 2022, the number of broadband connections increased by 1238%. ➢ Average revenue realization per subscriber for every gigabyte of cellular data decreased from Rs. 268.97 in December 2014 to Rs. 10.29 in June 2022, a decrease of more than 96.17%. ➢ From 61.66 MB in March 2014, the average monthly data consumption per wireless data subscriber climbed by 266 times to 16.40 GB in June 2022. ➢ India ranks third in both "Domestic market size" and "Annual investment in telecommunication services". By the end of January 2023, 5G services had been deployed throughout all licensed service regions in 238 cities. India moves up 10 ranks in the global rankings for average mobile speeds, from 79th in December to 69th in January 2023. From 93.30 crore in March 2014 to 117.02 crore in October 2022, there were 25.42% more telephone lines overall. In October 2022, there were 114.4 crore mobile connections. Urban telephone connections increased by 17.06% from 55.52 crores in March 2014 to 64.99 crores in October 2022, while rural telephone connections increased by 37.69%, almost twice as much as urban connections, from 37.78 crores in March 2014 to 52.02 crores in October 2022. In March 2014, the rural tele-density was 44%; by October 2022, it had increased to 57.91%. The total number of telecom customers is shown below in the tables, Pie-Chart and graphs. Table-1 : Highlights of Telecom Subscription Data as on 30th June 2023 Particulars Wireless Wireline Total (Wireless + Wireline) Broadband Subscribers (Million) 826.37 35.10 861.47 Urban Telephone Subscribers (Million) 626.07 27.63 653.70 Net Addition in June 2023 (Million) -0.19 0.46 0.27 Monthly Growth Rate -0.03% 1.68% 0.04% Rural Telephone Subscribers (Million) 517.51 2.68 520.19 Net Addition in June, 2023 (Million) 0.56 0.49 1.05 Monthly Growth Rate 0.11% 22.53% 0.20% Total Telephone Subscribers (Million) 1143.58 30.31 1173.89 Net Addition in June, 2023 (Million) 0.37 0.95 1.32 Monthly Growth Rate 0.03% 3.23% 0.11% Overall Tele-density (%) 82.25% 2.18% 84.43% Urban Tele-density (%) 127.56% 5.63% 133.19% Rural Tele-density (%) 57.53% 0.30% 57.83% Share of Urban Subscribers 54.75% 91.16% 55.69% Share of Rural Subscribers 45.25% 8.84% 44.31% Sources: TRAI The table-1 provides insights into the dynamics of broadband and telephone adoption, growth rates, and the distribution of subscribers between urban and rural areas. The wireless segment has a tele-density larger number of subscribers compared to the wireline segment in both urban and rural areas. Urban areas have higher tele-density than rural areas, with the wireless segment contributing significantly to this difference. The monthly growth rate of wireless broadband subscribers is negative, indicating a slight decline. In contrast, the wireline broadband segment is growing at a healthy rate. The rural wireline segment has an exceptionally high monthly growth rate, which might be due to infrastructural improvements in rural connectivity. The total number of telephone subscribers is dominated by the wireless segment. Urban areas have a larger share of subscribers in both wireless and wireline categories.
  • 3. American Journal of Humanities and Social Sciences Research (AJHSSR) 2023 A J H S S R J o u r n a l P a g e | 109 Pie-Chart-1 Sources:- https://en.wikipedia.org/wiki/List_of_telecom_companies_in_India Pie-Chart-1 describes that Bharti Airtel Limited has 37.26 crores (372.6 million) Customers with 32% of the Market Share. Reliance Jio Infocomm Ltd has 43.63 crore (436.3 million) Customers with 37% of the Market Share. Mahanagar Telephone Nigam Ltd has 2.15 crore (21.5 million) Customers with 2% of the Market Share. Vodafone Idea Ltd has 23.09 crore (230.9 million) Customers with 20% of the Market Share. Bharat Sanchar Nigam Limited (BSNL) has 10.14 crore (101.4 million) Customers with 9% of the Market Share. It has been identified that Reliance Jio Infocomm Ltd has the largest customer base, with 43.63 crore customers, constituting 37% of the market share. It holds the highest market share among the listed companies. Bharti Airtel Limited follows closely with 37.26 crore customers and a market share of 32%. It's one of the major players in the market. Vodafone Idea Ltd has a customer base of 23.09 crore and holds 20% of the market share. It's another significant player, although slightly smaller than Airtel and Jio in terms of both customers and market share. Bharat Sanchar Nigam Limited (BSNL) has 10.14 crore customers and a market share of 9%, making it a notable player but with a smaller presence compared to the top three. Mahanagar Telephone Nigam Ltd has the smallest customer base of 2.15 crore, contributing to a mere 2% of the market share. It appears to be a relatively smaller player in the market. In short, Reliance Jio and Bharti Airtel are the dominant players with the largest customer bases and higher market shares. Vodafone Idea and BSNL hold significant positions as well, while Mahanagar Telephone Nigam Ltd seems to have a relatively smaller market presence. This quantitative study looked at whether earnings manipulation occurs at a selected Indian telecom firm and whether there is a connection between profit manipulation and failures at a selected Indian telecom company. The M-Score model's validity as the best instrument for predicting the demise of selected Indian Telecom firms was ultimately validated. H1. Published financial statements of selected Indian Telecom companies are not manipulated prior to their failure H2. There is no relationship between earnings manipulation and the failure of selected Indian Telecom companies H3. The M-score model is statistically insignificant in optimal predicting selected Indian Telecom companies' failure. The paper used the Beneish M-score model to assess the proposed hypotheses (H1, H, and H3). The M-score approach is useful for identifying financial statement manipulation in corporate entities. The Z-score model, for example, focuses on broad corporate financial hardship in contrast to other multivariate analyses like the M-score, which enables researchers to use particular factors to investigate the link between financial statement abnormalities and a firm's demise. The M-score model has been attributed to helping users identify potential fraud situations based on the financial statements of businesses as an integrated method. This is made feasible by the model's ability to analyze multiple aspects of a company's performance at once. highlighted the fact that 37.26, 32% 43.63, 37% 2.15, 2% 23.09, 20% 10.14, 9% Market Share of Subscriber Selected Telecom Companies as on 31st March 2023 (in Crore and %) Bharti Airtel Limited Reliance Jio Infocomm Ltd Mahanagar Telephone Nigam Ltd Vodafone Idea Ltd Bharat Sanchar Nigam Limited
  • 4. American Journal of Humanities and Social Sciences Research (AJHSSR) 2023 A J H S S R J o u r n a l P a g e | 110 organizations with a high likelihood of earnings manipulation are more likely to report low returns in the future compared to those with a low exposure to profit manipulations. Additionally, a lot of academics and practitioners have praised the Beneish M-score model for helping institutional investors and regulators quickly spot possible corporate financial statement manipulation. The outcomes of the M-score model, according to a new study, are a good guide for averting pricey litigation and reputational harm to many stakeholders, including auditors and financial analysts. In addition to the reasons already indicated, the research adds to the body of knowledge regarding the fraud triangle. II. REVIEW OF LITERATURE Maximizing total returns on investment is the main goal of every profit-driven organization. Corporate managers work to reassure investors that their assets are secure and safe for this and other reasons. As a result, businesses typically use a variety of tactics—both moral and occasionally immoral—to accomplish their objectives. This study concentrated on one of these immoral techniques, specifically financial statement manipulations, which frequently result in investors receiving returns that are zero or negative. The study looks at external pressure, industry characteristics, and rationalization as contributing causes of financial statement fraud. It constructs a hypothesis about the impact of these variables using the Beneish m-score. Future research might benefit from understanding how pressure, opportunities, and justification all affect misleading financial statements, according to the findings (Harpan, D., & Kuntadi, C. 2023). The study looks into how corporate profitability manipulation affects Ghana's microfinance institutions. The researchers discovered a connection between earnings manipulation and business failures using data from the Bank of Ghana. It was discovered that the Beneish M-scores model is useful for seeing early warning indications of corporate earnings management and averting bad outcomes. The conclusions, however, are based on data from the microfinance sector, and future studies should take qualitative inquiry and data from many industries into consideration (Adoboe-Mensah, et al. 2023). This study looks at how external pressure, financial targets, and financial stability affect the prevalence of fabricated financial statements in 30 property and real estate firms that were listed on the Indonesia Stock Exchange between 2015 and 2017. The findings demonstrate that falsified financial statements are favorably impacted by both financial targets and financial soundness. Pressure from without has no beneficial effects (Djatnicka, E. W., et al. 2023). The study looks at the connection between returns and the Beneish-M score, an index used to judge how well a corporation has manipulated its profitability. The findings demonstrate that the market penalizes fiscal manipulation because Indian enterprises with an M-score above -1.78 report worse returns in the following year. According to the research, investors should steer clear of businesses that use the Beneish M-score (Jain, G., & Bose, A. 2023). In order to identify financial fraud and business failure in US-listed companies, the study contrasted the f-score and the Beneish M-model. Results showed that the M-score was superior in spotting anomalies in financial statements (Hou, B., et al. 2023, June). With a focus on the influence of pressure, opportunity, and rationalization on misleading financial statements, the study examined manufacturing companies listed on the Indonesia Stock Exchange from 2018 to 2020. Logistic regression analysis was used with 23 companies and 69 respondents. The findings indicated that, in contrast to other characteristics, financial stability, and inefficient monitoring have a major impact on financial statement fraud (Rahmani, H. F., & Oktalita, L. 2023). The fraud hexagon theory's effects on fraudulent financial reporting in 49 Indonesian consumer goods companies are investigated in this study. The study discovered that external pressure and auditor changes had a favorable impact on false reporting, whereas financial targets had a negative impact, based on prior findings and small studies. Stability, weak oversight, director turnover, haughtiness, and political ties, however, have no bearing on false reporting (Ginting, D. B., & Daljono, D. 2023). The study looks for characteristics that lead to earnings management in 284 Indonesian manufacturing organizations using a fraud triangle and a modified Beneish M-score. The findings indicate a negative correlation between asset growth, receivables to sales, auditor changes, and debt ratio, although the return on assets has no bearing. The modified Beneish M-score model is being used for the first time in this study to identify earnings management (Narsa, N. P. D. R. H., et al. 2023). Using the Beneish M-Score Model, the study investigates the connection between earnings manipulation and share price across publicly traded companies in Malaysia. With the help of the FTSE Bursa Malaysia Top 100 Index, it examined data from 65 PLCs. The findings suggested that other factors may affect share price since there was only a weakly negative link and statistically negligible relationship between earning manipulation and share price. The study is essential for stakeholders looking for the highest profits, investment stability, and ownership rights protection (Boni, L., Kamaluddin, A., & Kusumaningtias, R. 2023). This study uses a sample of 16 organizations with 10 years of observation to investigate financial manipulation in State-Owned Enterprises (SOEs). According to the findings, 62 corporations are not manipulators and 98 companies are. The Beneish M- Score model uses 8 variables to identify manipulation. Financial statement manipulation is impacted by GMI and TATA. By improving sales and accounts receivable data, which show inefficiencies, SOEs increase permanent income. Additionally, they show a positive improvement in the ratio of assets to liabilities and cash (Husein, H., et al. 2023).
  • 5. American Journal of Humanities and Social Sciences Research (AJHSSR) 2023 A J H S S R J o u r n a l P a g e | 111 III. RESEARCH METHODOLOGY This paper uses a quantitative research technique to inquiry based on the Beneish M-score model research used to accomplish the goal. The Beneish M model makes use of various financial parameters or ratios of a certain selected Indian telecom company to assess the likelihood that reported earnings were manipulated or not. The methodology adopted in this work is similar to that of other researchers in that it permits the investigation of the sample variables over a representative interval without affecting those variables. The data sources and the logic behind using the Beneish M-score model research are covered in this section. 3.1 Data and its Sources This paper totally depends on secondary data which are collected from financial reports of selected Indian telecom companies’ official websites through Capitaline for a period of five years which are from 2018 to 2022. This data was first gathered as primary data on the Indian stock exchange and The Telecom Regulatory Authority of India (TRAI) where selected Indian telecom companies were listed then the researcher collected from their websites through Capitaline. Indian Stock Exchange also called the Stock Exchange Board of India (SEBI) has listed all companies that are registered and operated in India and The Telecom Regulatory Authority of India (TRAI) controls and regulates all telecom companies that are operated in India. The SEBI and TRAI’s research division is well known for its capacity to gather, examine, and disseminate reliable data, as a result, it looks to be the most reliable source of information for this research. Almost 8500 telecom companies running their business in India and the researcher has selected the top five Indian telecom companies. All data was collected by the researcher through eight financial ratios. 3.2 Independent Variables and Empirical Model In this section, the independent variables describe how to use variables to calculate the M-score and determine the Beneish M- score Model. The researcher has used three important sources for selecting endogenous variables. First, the researcher has focused on and identified key signals which are relied on by previous researchers. Second, there is a common perception about the poor performance of a company in the future that there is mostly a possibility is manipulating their financial statements or corporate financial earnings. Third, the researcher has focused on almost all possible financial reports like Balance sheets, profit and loss accounts, and cash flow statements that are required for calculating ratios or variables. After these, the researcher has chosen eight explanatory variables, Days' sales in a receivable index (DSRI), Gross margin index (GMI), Asset quality index (AQI), Sales growth index (SGI), Depreciation index (DEPI), Sales and general and administrative expenses index (SGAI), Leverage index (LVGI), and Total accruals to total assets (TATA). These variables are normally used as fair explanatory variables by Beneish 1999 for predicting corporate earnings manipulations. These variables are useful for current research. There are summarized endogenous variables or ratios for the mathematical formula in Figure no-3. Each selected Indian telecom company that was a part of the final sample had an average score that was calculated, separately weighted, and assessed for manipulation of corporate earnings. Beneish (1999) has recommended that the researchers use data from financial statements to calculate the M-score to detect possible manipulation of selected Indian telecom companies’ earnings because the researchers have 76% accuracy in detecting companies’ financial earnings manipulation by the M-score formula. As a result, the method provides a solid tool for this research. Consequently, the formula for the tried-and-true and widely accepted Beneish M-score model utilized for this paper is as follows. M = −4.84 + 0.920*DSRI + 0.528*GMI + 0.404*AQI + 0.892*SGI + 0.115*DEPI – 0.172*SGAI + 4.679*TATA – 0.327*LVGI Figure-1 Sources: - Beneish et al. (2013) and Adoboe-Mensah et al. (2023)
  • 6. American Journal of Humanities and Social Sciences Research (AJHSSR) 2023 A J H S S R J o u r n a l P a g e | 112 Where, M = The following is a succinct explanation of the overall index and the endogenous variables: 3.2.1 DSRI Days’ Sales in Receivables Index, A sharp rise in the number of days for accounts receivable could indicate hastened revenue recognition to boost profitability. This financial ratio determines whether or not variations in sales are according to variations in receivables. This is calculated by dividing a firm’s days’ sales in receivables in the current year (represented by t) by days’ net receivables in the previous year (t-1). The consistency between a company's accounts receivable and the associated sales can be assessed using the DSRI. Corporate non- manipulators have a DSRI mean value of 1.031, while earnings manipulators have a DSRI mean value of 1.465, according to K. M. B. (2016), MacCarthy (2017), and Nyakarimi (2022). An increase in the index indicates that more sales are being made on credit as opposed to cash, which means the business is having trouble collecting its debts. This shows that a significant increase in DSRI indicates a high likelihood of management inflating revenue. 3.2.2 GMI Gross Margin Index, in this ratio, a deteriorating gross margin sends a negative signal about a firm’s prospects and creates an incentive to inflate profits. Beneish 1999, Nyakarimi, 2022, and Repousis, 2016 Utilizing this index, one can determine whether the gross margin—defined as sales less cost of goods sold—has decreased. It is determined by dividing the current year's gross profit margin (t) by the previous year's gross profit margin (t- 1). GMI greater than 1 indicates a decline in the entity's gross profit. A score of 1.193 and higher indicates a significant likelihood that the company's gross profit is being manipulated, while a score of 1.041 or lower indicates that the gross profit of the current accounting period is not being manipulated (Harrington 2005). 3.2.3 AQI The AQI is the proportion of a company's total assets to all non-current assets (excluding plant, property, and equipment and comparisons with the ratio of a firm's asset quality in the current year (t) to its asset quality in the prior year (t-1). (Beneish, 1999; 2012; Repousis, 2016). This index's increase indicates a decline in asset quality. According to Beneish (1999), an AQI > 1 indicates a propensity to capitalize intangibles or expenses or to delay costs. 3.2.4 SGI Sales Growth Index is a high-growth company that may commit financial fraud due to financial pressure and capital needs and may face increased incentives to manipulate earnings during slowdowns due to large stock price losses. The growth in sales between financial periods is the subject of this index. It has to do with the proportion of a company's current-year sales (t) to its sales from the prior year (t-1). SGI's median score of 1.134 indicates no earnings manipulation, while 1.607 indicates possible manipulation (Beneish, 1999; 2012; Repousis, 2016; Nyakarimi, 2022). 3.2.5 DEPI Depreciation is when a company may have increased the projected useful life of assets or implemented a new, income-increasing approach if its rate of depreciation is declining relative to net fixed assets. This measurement represents the ratio of a company's depreciation rate from the prior year (t-1) to the current year's rate (t). If a score of DEPI>1, it means, there is a deliberately lowering depreciation rate of companies' assets (Beneish 1999 and Harrington 2005). 3.2.6 SGAI Sales, General, and Administrative Expenses A company can feel pressured to inflate earnings if analysts perceive a disproportionate rise in SG&A relative to sales as a warning indication about the company's future prospects. It is a ratio of a company's sales, general, and administrative costs for the current accounting year (t) to the value for the prior year (t-1) (Beneish, 1999; and Repousis, 2016). According to Beneish (1999), it noted that a sales growth that is excessively greater than 1.001 from one year to the next in the current year is a sign of poor future prospects. 3.2.7 TATA Total Accruals to Total Assets, Total accruals, calculated as working capital change less depreciation, indicate managers' discretionary accounting choices to alter earnings, with higher levels indicating higher profit manipulation. According to (Beneish, 1999, and Adu-Gyamfi, 2020), The entire accruals of a company are expressed as a proportion of its total assets using this ratio. It is computed by subtracting the income from continuing activities for the same year (t) from the cash flows from operations for the firm in the current year (t). The total assets of the company for the year under consideration are then divided by the net result. If there is an average score of 0.018, it means non-financial manipulation; if an average score of 1.031 or more, it means deliberately changing the data (Repousis, 2016). 3.2.8 LVGI Leverage Index where Total debt divided by total assets measures leverage. An incentive to manipulate profits in order to meet debt covenants is created by an increase in leverage. LVGI is the ratio of the current accounting period's (t) and the prior period's (t-1) total debt to total asset ratios. Rising leverage is indicated by a firm's LVGI > 1 (Beneish, 1999, Nwoye et al., 2012, and Repousis, 2016). So, it is a threat to investors for their future return
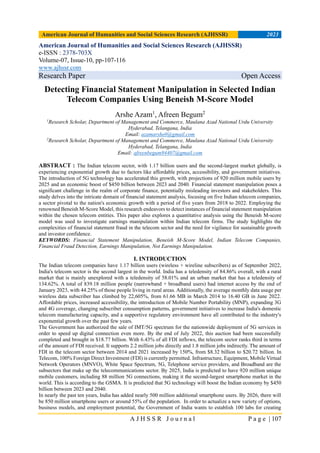
  • 7. American Journal of Humanities and Social Sciences Research (AJHSSR) 2023 A J H S S R J o u r n a l P a g e | 113 on Investment that if LEVI>1, it means a company's leverage position has increased (Beneish, 1999, and Harrington, 2005). Table-2 : Description of M-score outcome factors M-Score Results M>-1.78 The higher possibility of earnings manipulation (Earnings Manipulation) M<-1.78 The lower possibility of earnings manipulation (Not Earnings Manipulation) Source: Beneish et al. (2013) 3.3 Estimation and Specification of Model Table 2 shows the measurement criteria and the results of the variable for the M-score. Where, if the M-score value is M>-1.78 then it means there is a higher possibility of earning manipulation by corporate or company management, and if the M-score value is M<-1.72 then it means there is a lower possibility of earning manipulation by corporate or company management (Beneish et al. 2013). Figure 1 highlights the individual factors that, taken together, can have an impact on a business's ability to continue operating. According to Beneish et al., companies that use aggressive and dishonest accounting concepts, procedures, and standards eventually fail. In order to boost business earnings, corporate managers are urged to use practical strategies. IV. DESCRIBE THE RESULT AND FINDINGS In this section researcher has focused on the analysis of the selected Indian telecom company. The Beneish M- score is a mathematical model used to detect earnings manipulation in the financial statements of selected Indian telecom companies. The score is calculated based on various financial ratios and other accounting metrics. Alower M-score suggests a lower likelihood of earnings manipulation, while a higher M-score indicates a higher likelihood of manipulation. Table-3 : Beneish M-score of Selected Indian Telecom Companies Name of the Companies 2018 2019 2020 2021 2022 Bharti Airtel Limited -1.0979 -1.6471 -1.7133 -0.9226 -1.2147 Reliance Jio Infocomm Ltd -1.2024 -1.6594 -1.6228 -0.5396 -0.8706 Mahanagar Telephone Nigam Ltd -1.3966 -1.6226 -1.7468 -1.3247 -0.6497 Vodafone Idea Ltd -1.3125 -1.1128 -1.8118 -0.8265 -0.8437 Bharat Sanchar Nigam Ltd -1.7132 -1.2681 -1.4649 -1.1825 -0.8025 Table-3(a) Describe Earnings Manipulation or Not Earnings Manipulation of the Selected Indian Telecom Companies Name of the Companies 2018 2019 2020 2021 2022 Bharti Airtel Limited. Not Earnings Manipulation Not Earnings Manipulation Not Earnings Manipulation Not Earnings Manipulation Not Earnings Manipulation Reliance Jio Infocomm Ltd. Not Earnings Manipulation Not Earnings Manipulation Not Earnings Manipulation Not Earnings Manipulation Not Earnings Manipulation Mahanagar Telephone Nigam Ltd. Not Earnings Manipulation Not Earnings Manipulation Not Earnings Manipulation Not Earnings Manipulation Not Earnings Manipulation Vodafone Idea Ltd. Not Earnings Manipulation Not Earnings Manipulation Earnings Manipulation Not Earnings Manipulation Not Earnings Manipulation Bharat Sanchar Nigam Ltd. Not Earnings Manipulation Not Earnings Manipulation Not Earnings Manipulation Not Earnings Manipulation Not Earnings Manipulation
  • 8. American Journal of Humanities and Social Sciences Research (AJHSSR) 2023 A J H S S R J o u r n a l P a g e | 114 Looking at the provided data for the years 2018 to 2022, here's an interpretation of the Beneish M-scores for the selected companies. Table 3 describes mathematical data, and Table 3(a) describes their position according to the calculated Table 3 describes the M-scores for Bharti Airtel Limited have fluctuated over the years, ranging from -1.0979 in 2018 to -1.7147 in 2022. These scores generally indicate a relatively low likelihood of earnings manipulation, with some fluctuations. Reliance Jio Infocomm Ltd also shows fluctuating M-scores, ranging from -1.2024 in 2018 to -0.8706 in 2022. These scores suggest a relatively low likelihood of earnings manipulation, with a slight decrease in 2022. Mahanagar Telephone Nigam Ltd's M-scores have been consistently low, indicating a lower likelihood of earnings manipulation. The scores range from -1.3966 in 2018 to -0.6497 in 2022. Vodafone Idea Ltd's M-scores have varied, with a low of -1.8118 in 2020 and a slight increase to -0.8437 in 2022. These scores suggest a generally low likelihood of earnings manipulation, although there was a spike in 2020. Bharat Sanchar Nigam Ltd started with an M-score of -1.7132 in 2018, indicating a low likelihood of earnings manipulation. The scores improved slightly in the following years, reaching -0.8025 in 2022. So, the above data also describe that all selected companies generally exhibit low M-scores, indicating a lower likelihood of earnings manipulation during the specified period. Fluctuations in M-scores for some companies suggest possible changes in their financial reporting practices or underlying financial health. It's important to note that while M-scores provide insights, they are not definitive proof of manipulation and should be considered alongside other financial analyses and due diligence processes. Table 3(a) describes the M-scores for Bharti Airtel Limited indicating "Not Earnings Manipulation" for all years, suggesting a low likelihood of earnings manipulation. Reliance Jio Infocomm Ltd, the company also shows "Not Earnings Manipulation" for all years, indicating a low likelihood of earnings manipulation. Mahanagar Telephone Nigam Ltd similar to the other companies, Mahanagar Telephone Nigam Ltd has "Not Earnings Manipulation" for all years, suggesting a low likelihood of earnings manipulation. Vodafone Idea Ltd, this company had an instance of "Earnings Manipulation" in the year 2020. However, in the other years, it shows "Not Earnings Manipulation", indicating a generally low likelihood of manipulation except for 2020. Bharat Sanchar Nigam Ltd, the M-scores for this company also indicate "Not Earnings Manipulation" for all years, suggesting a low likelihood of earnings manipulation. based on the Beneish M-scores and their interpretations, these selected Indian companies generally show a low likelihood of earnings manipulation in the specified years, except for Vodafone Idea Ltd in the year 2020. Graph- 1 Graph 1 also describes the data of the selected Indian telecom companies that where the chances of either corporate earnings manipulation or not corporate earnings manipulation in the respective years. Here only one Indian telecom company namely Voda Idea Ltd is the possibility for earnings manipulation in 2020 and the rest of the year, all Indian telecom companies have indicated that there is no possibility of corporate earnings manipulation in the respected ears. Bharti Airtel Limited Reliance Jio Infocomm Ltd Mahanagar Telephone Nigam Ltd Vodafone Idea Ltd Bharat Sanchar Nigam Ltd 2018 -1.0979 -1.2024 -1.3966 -1.3125 -1.7132 2019 -1.6471 -1.6594 -1.6226 -1.1128 -1.2681 2020 -1.7133 -1.6228 -1.7468 -1.8118 -1.4649 2021 -0.9226 -0.5396 -1.3247 -0.8265 -1.1825 2022 -1.2147 -0.8706 -0.6497 -0.8437 -0.8025 -1.0979 -1.2024 -1.3966 -1.3125 -1.7132 -1.6471 -1.6594 -1.6226 -1.1128 -1.2681 -1.7133 -1.6228 -1.7468 -1.8118 -1.4649 -0.9226 -0.5396 -1.3247 -0.8265 -1.1825 -1.2147 -0.8706 -0.6497 -0.8437 -0.8025 -2 -1.8 -1.6 -1.4 -1.2 -1 -0.8 -0.6 -0.4 -0.2 0 Beneish M-score 2018 2019 2020 2021 2022
  • 9. American Journal of Humanities and Social Sciences Research (AJHSSR) 2023 A J H S S R J o u r n a l P a g e | 115 V. CONCLUSION The Indian telecom sector has experienced remarkable growth and development over the years, making it one of the largest and most dynamic industries globally. The sector has seen significant advancements in technology, infrastructure, and market penetration, with a substantial increase in the number of subscribers, internet users, and broadband connections. The government's initiatives, supportive regulatory environment, and the introduction of 5G technology have played pivotal roles in shaping the industry's landscape. The Beneish M-score model analysis presented in this study provides valuable insights into the financial practices of selected Indian telecom companies. The results indicate that, for the most part, these companies have maintained a low likelihood of earnings manipulation, as suggested by consistently low M-scores. The fluctuations observed in some years emphasize the need for continuous vigilance and comprehensive financial analysis to understand the underlying factors influencing these variations. It is essential to recognize the importance of such analyses, especially in a sector as crucial as telecom, where financial stability and transparency are vital for sustainable growth. The findings of this study contribute to the ongoing discourse on corporate financial practices and serve as a valuable resource for investors, regulators, and industry stakeholders. As the Indian telecom sector continues to evolve and expand, it is imperative for companies to uphold ethical financial standards, ensuring transparency and trust among their stakeholders. Continued research and analysis, along with robust regulatory oversight, will play a significant role in shaping the future trajectory of this dynamic industry. REFERENCES [1]. Adoboe-Mensah, N., Salia, H., & Addo, E. B. (2023). Using the Beneish M-score Model to Detect Financial Statement Fraud in the Microfinance Industry in Ghana. International Journal of Economics and Financial Issues, 13(4), 47. [2]. Adu-Gyamfi, M. (2020), Investigating financial statement fraud in Ghana using Beneish M-Score: Acase of listed companies on the Ghana stock exchange (GSE). International Finance and Banking, 7(2), 1-54. [3]. Beneish, M.D. (1999), The detection of earnings manipulation. Financial Analysts Journal, 55(5), 24- 36. [4]. Beneish, M.D., Lee, C.M., Nichols, C. (2013), Earnings manipulation and expected returns. Financial Analysts Journal, 69, 57-82. [5]. Boni, L., Kamaluddin, A., & Kusumaningtias, R. (2023) Detecting Earning Manipulation Using the Beneish M-Score Model: Evidence from Public Listed Companies in Malaysia. [6]. Djatnicka, E. W., Purba, J., & Wulandari, D. S. (2023). Fraud Triangle Perspective: Detecting Financial Statement Fraud Using the Beneish M-Score Model in Property and Real Estate Companies Listed on the Indonesia Stock Exchange. East Asian Journal of Multidisciplinary Research, 2(7), 3113-3130. [7]. Ginting, D. B., & Daljono, D. (2023). ANALISIS PENGARUH FRAUD HEXAGON TERHADAP FRAUDULENT FINANCIAL REPORTING MENGGUNAKAN METODE BENEISH M-SCORE (Studi Empiris pada Sektor Industri Barang Konsumsi yang Terdaftar di Bursa Efek Indonesia Tahun 2019-2021). Diponegoro Journal of Accounting, 12(3). [8]. Harrington, C. (2005), Formulas for Detection: Analytical Ratios for Detecting Financial Statement Fraud. Association of Certified Fraud Examiners. Fraud Magazine. Available from: http://www.acfe.com/ resources/view.asp?article10= 413 [Last accessed on 2014 Dec 31]. [9]. Harpan, D., & Kuntadi, C. (2023). Analysis the effect of the fraud triangle on fraud report finance use beneish M-Score model. Gema Wiralodra, 14(2), 940-943. [10]. Hou, B., Lin, R., Li, X., Liu, Z., & Zheng, J. (2023, June). Using Beneish M-Score and F-Score to Detect Financial Fraud. In Proceedings of the 6th International Conference on Economic Management and Green Development (pp. 1383-1400). Singapore: Springer Nature Singapore. [11]. https://www.easyleadz.com/lists/List-of-Telecom-Companies-in-India [12]. https://www.investindia.gov.in/sector/telecom#:~:text=The%20Telecom%20industry%20in%20India,( wireless%20%2B%20wireline%20subscribers). [13]. https://www.ibef.org/industry/telecommunications [14]. https://www.ascgroup.in/industries/telecom-industry/ [15]. https://www.trai.gov.in/sites/default/files/Annaul_Report_23022023_0.pdf [16]. https://en.wikipedia.org/wiki/List_of_telecom_companies_in_India [17]. Husein, H., Saleh, P. A., Kriaswantini, D., & Bonara, R. S. (2023). Deteksi Manipulasi Laporan Keuangan Menggunakan Model Beneish M-Score pada BUMN yang Terdaftar di Pasar Modal. JURNAL AKUNTANSI, 18(1), 1-10. [18]. Jain, G., & Bose, A. (2023). Are Returns Conditional upon the Beneish M score?. Academy of Marketing Studies Journal, 27(3).
  • 10. American Journal of Humanities and Social Sciences Research (AJHSSR) 2023 A J H S S R J o u r n a l P a g e | 116 [19]. MacCarthy, J. (2017), Using Altman Z-score and beneish M-score models to detect financial fraud and corporate failure: A case study of Enron corporation. International Journal of Finance and Accounting, 6(6), 159-166. [20]. M-Score, K. M. B. (2016). Detecting financial statement fraud by Malaysian public listed companies: The reliability of the Beneish M-Score model. Jurnal Pengurusan, 46, 23-32. [21]. Narsa, N. P. D. R. H., Afifa, L. M. E., & Wardhaningrum, O. A. (2023). Fraud triangle and earnings management based on the modified M-score: A study on manufacturing company in Indonesia. Heliyon, 9(2). [22]. Nyakarimi, S. (2022), Probable earning manipulation and fraud in banking sector. Empirical study from East Africa. Cogent Economics and Finance, 10(1), 1-20. [23]. Rahmani, H. F., & Oktalita, L. (2023). Variables Related To The Formation Of Financial Statement Fraud With Beneish M Score In The Triangle Theory Concept Framework. Jurnal AKSI (Akuntansi dan Sistem Informasi), 8(1). [24]. Repousis, S. (2016), Using Beneish model to detect corporate financial statement fraud in Greece. Journal of Financial Crime, 23(4), 1063-1073.