How poor rural households in four Tanzanian regions manage their finances
•
0 likes•912 views

The survey found that only about 13.3% of households currently use existing financial service providers in their districts. Of these households, 32% use the National Microfinance Bank and 28.1% use savings and credit cooperative societies. Overall access to both savings and loans is low, with just 19% of households having access to credit. High costs, inconvenience, and unsuitable services provided by most financial intermediaries are major barriers to access. The survey concludes that increasing access will require providing financial education to households while also building the capacity of local financial institutions to deliver suitable products and services.

Recommended
Recommended
More Related Content
What's hot
Viewers also liked
Viewers also liked (10)
Similar to How poor rural households in four Tanzanian regions manage their finances
Similar to How poor rural households in four Tanzanian regions manage their finances (20)
Recently uploaded
Recently uploaded (20)
How poor rural households in four Tanzanian regions manage their finances
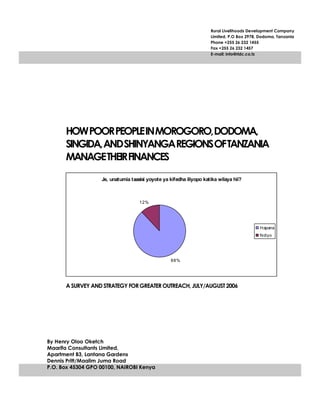
- 1. Je, unatumia taasisi yoyote ya kifedha iliyopo katika wilaya hii? 88% 12% Hapana Ndiyo HOWPOORPEOPLEINMOROGORO,DODOMA, SINGIDA,ANDSHINYANGAREGIONSOFTANZANIA MANAGETHEIRFINANCES A SURVEY ANDSTRATEGY FORGREATEROUTREACH, JULY/AUGUST2006 By Henry Oloo Oketch Maarifa Consultants Limited, Apartment B3, Lantana Gardens Dennis Pritt/Maalim Juma Road P.O. Box 45304 GPO 00100, NAIROBI Kenya Rural Livelihoods Development Company Limited, P.O Box 2978, Dodoma, Tanzania Phone +255 26 232 1455 Fax +255 26 232 1457 E-mail: info@rldc.co.tz
- 2. Page 2 Access to Finance Contentspage Summary of findings _____________________________________________________ 4 Chapter 1 _______________________________________________________________ 8 Background & Introduction ___________________________________________________ 8 1.1 Introduction___________________________________________________________________8 1.2 Survey objectives_____________________________________________________________10 1.3 Definitions and conceptual framework ________________________________________11 1.4 Data Collection and Sampling ________________________________________________13 1.5 Data type and analysis _______________________________________________________15 1.5.1 Household demand survey ________________________________________________15 1.5.2 Supply-side inventory study ________________________________________________17 1.6 Baseline Context of surveyed Areas____________________________________________20 1.6.1 Physical Infrastructure _____________________________________________________20 Morogoro Region ________________________________________________________________21 Dodoma Region_________________________________________________________________22 Singida Region __________________________________________________________________23 Shinyanga Region _______________________________________________________________23 Chapter 2 ______________________________________________________________ 25 General Baseline Results _____________________________________________________ 25 2.1 Residency and Age ________________________________________________________25 2.2 The People and Social capital_______________________________________________25 Chapter 3 ______________________________________________________________ 31 financial Access & Exclusion _________________________________________________ 31 3.1 Percentage with current access_______________________________________________31 3.1.1 Awareness of financial services ____________________________________________31 3.1.2 Financial Literacy _________________________________________________________32 3.1.3 From knowledge to use ___________________________________________________33 3.1.4 Proximity is no Guarantee of use ___________________________________________34 3.2 Patterns of Use of Available Services ___________________________________________36 3.2.1 Types of Accounts Held ___________________________________________________37 3.3 Perception of the intermediaries_______________________________________________38 3.4 Current methods of saving ____________________________________________________41 3.5 Current Access to Loans ______________________________________________________42 3.6 Conclusions __________________________________________________________________45 Chapter 4 ______________________________________________________________ 47 Barriers to Access ___________________________________________________________ 47 4.1 Financial services Infrastructure________________________________________________47 4.2 households’ perspective on barriers ___________________________________________48 4.3 provider’s perspective on Barriers______________________________________________50 4.4 a deeper understanding of Obstacles _________________________________________51 4.5 Opportunities for Greater Access ______________________________________________56 4.5.1 The Institutional side_______________________________________________________56 4.5.2 The consumer side ________________________________________________________57 4.6 Bridging the divide ___________________________________________________________58
- 3. Page 3 Chapter 5 ______________________________________________________________ 59 A Strategy for Greater Access ________________________________________________ 59 5.1 Guiding principles ____________________________________________________________59 5.2 Collaboration with existing providers___________________________________________60 5.3 Possible interventions __________________________________________________________2 5.4 Internal capacity and strategy formulation______________________________________4 5.5 Conclusion____________________________________________________________________5 Appendices_____________________________________________________________ 7 Annex 1.1 ________________________________________________________________________8 Annex 1.2 Main survey questionnaire_______________________________________________1 Annex 1.4 Supply-side survey instrument ____________________________________________1 Appendix 2 Endnotes & References________________________________________________1
- 4. Page 4 Access to Finance Summaryoffindings In almost every part of the world, limited access to finance is a seriously binding constraint to private sector growth. This is especially true of the poor people in Tanzania, many of whom both have the urge and ideas to improve their livelihood but is financially excluded from reliable service. In the case of present RLDC survey, accessibility was defined as the ease with which an individual can get services and facilities if he or she needed or desired to do so and it reflects the ability of that person whether directly or through his/her close associates to reach and use such services affordably. With greater and better access to finance, even poor people can create their own jobs, build decent homes, and educate their children to their capacity, thereby securing their lifetime labor market mobility. Thus, RLDC considers access to appropriate financial services by the poor and low-income families in the four regions where it currently has development activities as one of the critical success factors in creating jobs, improving incomes, and helping the communities manage various social and economic shocks, i.e., three of the company’s main objectives. Hence, results of the baseline survey commissioned in July and August 2006 to measure the poor rural households’ access to financial services in the four regions of Morogoro, Dodoma, Singida, and Shinyanga, as intended by RLDC, provides insight into defining its priorities and strategies for widening and deepening access to financial services in the said target areas. The survey involved 2,568 randomly selected households and 14 local level financial intermediaries. The results of the survey show that: About 13.3 percent of the households presently use at least one of the existing financial service providers within their district. Another 4.1 percent had another member also using the existing intermediaries, thereby increasing the overall percentage of households currently using the existing intermediaries to 17.4 percent of the population. Of the households using the existing intermediaries within their districts, 32 percent rely on National Microfinance Bank (NMB), followed closely by savings and credit cooperative societies (SACCOS); at 28.1 percent. Other intermediaries used are CRDB
- 5. Page 5 Bank (8.1 percent), groups (6.8 percent), and two major financial NGOs (5.7 percent). In terms of services, less than nine percent of the households keep an account with the intermediaries; with 57.4 percent of them depending on various banks for services, 33.4 percent in SACCOS, and a far smaller number (9.2 percent) with either non-bank financial institutions or ROSCAS (Rotating Savings and Credit Associations) groups. The majority of households currently having accounts maintain a savings bank account (88.6 percent); only 8.5 percent have a business or current account (through which some receive salaries and loans), 1.3 percent maintain term deposit accounts, and 1.7 percent group accounts. Although a slightly higher number of the households have access to credit; at 19 percent, this is largely accounted for by informal credits (79.7 percent of all loans granted within 12 months prior to the survey). Both SACCOS (six percent), financial NGOs (2.2 percent), and banks (2.1 percent), provide just about 10 percent of the total credits granted to the poor rural households. This low access to both savings and loans by the poor rural households is caused by a myriad of factors and not just by the absence of many conveniently located financial intermediaries close by the population; which is of course also a major constraint. Basically, the existing financial system is at odds with the requirements of the poor and low income households; for instance, despite the presence of some such institutions within the districts where the households live, a whole 54.2 percent do not know even of their presence. Based on analysis of the situation, financial exclusion of the poor rural households is caused by at least three related factors. Last in the list is the population’s ignorance about the existence of these institutions right within their midst –or alternatively, their ignorance about the benefits of effectively using the services provided by these institutions to improving their livelihood. The second; but just
- 6. Page 6 Access to Finance as likely the first major cause of financial exclusion, however, is high cost of service, inconvenience, and the unsuitability or poor quality of services provided by most financial intermediaries operating in the four regions. In this conclusion, the RLDC survey presents evidence that is very similar to those established by the Bank of Tanzania Survey of 1997§ and the Vice President’s Office study in June 2000. In a process typical of a vicious cycle, this combination of greater distances to nearest available financial institutions, high cost, poor service, and poor information about potential benefits of using various financial services, almost completely discourage formation or use of appropriate and conveniently located financial institutions in the concerned regions. Subsequently, without gaining the necessary confidence of the local people in these institutions, the much hoped for greater access is undermined by their lack of credibility and intermediation capacity. If the analyses of the survey results are correct, the first and primary solution to increasing greater outreach for RLDC would seem to be a two-pronged strategy that works simultaneously. These include providing better, more comprehensive, and more focused financial education to the target population, while at the same time enabling a few of the better focused and more deserving financial intermediaries closest to the people build their institutional capacity and acquire other resources necessary to deliver timely and suitable products and services. The evidence from this baseline survey certainly shows a strong local demand and capacity among the target population for both using financial services effectively—if rightly and correctly informed about their benefits—and contributing towards establishing and further building the capacities of the institutions. So, it is certainly a sound proposition for RLDC to pursue investing in strategic alliances with carefully selected local level financial intermediaries; mostly community-based savings and credit cooperatives, providing detailed financial education on savings,
- 7. Page 7 budgeting, managing credit, and their own responsibilities towards building responsible financial intermediaries to the local people. As there are handsome returns to investing in institutional capacity, neither should RLDC shy away from providing budgetary support to selected partners to undertake specific investments in building financial services infrastructure, developing people’s capacity for strong leadership and service delivery, and developing appropriate management systems, undertaking relevant market research, and even developing new and better products and services. In this area, RLDC has much to learn from CRDB Bank Limited, with which it has already made contacts and initiated valuable discussions. Finally, given its previous successes in mobilizing various communities in the central corridor to undertake many livelihoods- enhancing activities and excellent reputation, RLDC has both the mandate and self-interest in establishing diverse financial services activities that would create the momentum and support towards a greater access to finance for the target population. These might include facilitation of financial literacy training to the public, formation of strategic alliances with financial institutions like the CRDB Bank Limited; which seeks to increase poor households’ greater access to financial services through strategic linkages with local financial intermediaries, funding of technical assistance and appropriate management systems development for deserving intermediaries, and even giving material support in badly needed staff training, communication, and product development challenges. Copyright ©2006 Rural Livelihood Development Company All rights reserved.
- 8. Page 8 Access to Finance Chapter1 BACKGROUND&INTRODUCTION 1.1 INTRODUCTION This report presents the results of a baseline survey carried out in July and August 2006 by the Rural Livelihood Development Company (RLDC). The overall purpose of this combined baseline survey was to measure poor rural households’ access to financial services in the four regions of Morogoro, Dodoma, Singida, and Shinyanga, which are the areas where RLDC currently provides various development activities1. The four regions where the survey was done are also collectively and officially recognized as the ‘Central Corridor’ area, evidently based on their location right at the heartland of mainland Tanzania. It is a corridor that begins with the Dar es Salaam-to-Kigoma railway network (some 1,254 km in length), which connects the 1RLDC is a not-for-profit enterprise based in Dodoma, Tanzania whose purpose is to improve the livelihood of rural communities in the central corridor by helping and supporting the generation of greater income and employment opportunities through various interventions, including: Promotion of skills improvement Promotion and direct provision of business development services Promotion of greater access to financial services promotion greater access to markets Encouraging and enabling the development of market infrastructure Encouraging and enabling the development of a more conducive policy and regulatory environment The organization envisions a time and situation in which poor rural households and communities have open access to all markets relevant to enhancing their livelihood.
- 9. Page 9 country with Bujumbura, Burundi, by boats on Lake Tanganyika, and further on to Rwanda by road. The parallel road route also begins in Dar es Salaam via Dodoma, Singida, Nzega and further on to Lusahunga into Rwanda and Burundi. The study was to provide RLDC with the information it needed to formulate an effective financial strategy, especially one with a focus on facilitating market development for on-farm and off-farm livelihood activities within the corridor. Yet, to intervene effectively in this market development process, RLDC needed to know the demand for financial services, i.e. proportion of the target population that is in need and able to pay for services if such service were made available, but are nonetheless presently excluded. Secondly, because RLDC prefers undertaking a facilitative rather than direct role in development work itself; including the provision of financial services, it needed to know a little more about the institutions or individuals with whom it could collaborate in providing such services in the concerned area of intervention, i.e., their identity, mandates, location, and capacity, etc, so it could correctly choose the right ones.
- 10. Page 10 Access to Finance 1.2 SURVEY OBJECTIVES RLDC considers the baseline survey as an important part of its 10-step process2 towards establishing viable, self-sustaining financial service organizations for achieving greater access to finance, lack of which it currently considers a major constraint to improving livelihoods in the four regions. Although considered a fully- fledged intervention independent of the others by RLDC, the company sees greater access to finance as a cross-cutting input that could make a critical difference in the achievement of its other interventions. Partly because of this consideration—and although presented and discussed separately in two parallel reports of equal depth, the survey also explored the number of households currently engaged in micro- and small-scale enterprise (SMEs) activities in the corridor, thereby specifically looking at their present constraints that if properly harnessed could open up greater opportunities for enhancing livelihoods in RLDC’s area of operation. RLDC, along with many other development organizations of its kind, now recognizes SMEs to have become an increasingly important source of income for many poor Tanzanian families and therefore should neither be neglected nor left un- nurtured. Hence, the need during the survey to explore whether current access to finance by concerned households is an obstacle to the growth potential of these enterprises. Also investigated by the survey, but results similarly presented and 2 These 10 steps starts with (1) demand stimulation (2) processing of requests/applications received for various inputs (3) rapid appraisal of requests and applications (4) project planning and presentation for discussion and approval (5) board approval (6) contracting/engagement (7) implementation (8) monitoring (9) evaluation (10) release of inputs/capitalization.
- 11. Page 11 discussed separately in a parallel report, is the number of households presently accessing relevant business development services (BDS), which are themselves also considered critical to successfully enhancing livelihoods in the corridor by RLDC. Among the BDS explored by the survey included current access to information by type, source and provider and also whether they have received business training, technical support, and linkages to markets, etc. The two separate reports—one on SME constraints and opportunities, and the other on poor households’ access to BDS—are available directly from RLDC on request. 1.3 DEFINITIONS AND CONCEPTUAL FRAMEWORK ** For purposes of the survey, a financial service was defined as any service that enables an individual, household or firm to: Send or receive money, Store and retrieve any surplus income not immediately required for consumption or investment, Receive or make payments for goods and services supplied to or received from a third party, Sell or buy financial assets such as treasury bills, bonds, shares, and insurance, etc Transform future income into current income by giving loans (or by facilitating current consumption against future income), and; Exchange currencies. Amongst the poor rural households studied, these services are provided by a very diverse group, e.g., individuals or specialized institutions (such as commercial banks) and non-bank financial institutions, financial cooperatives, financial NGOs, and informal associations groups. Nonetheless, the survey recognized that each possible provider has own unique attributes that could influence the range, quality, and benefits provided to different segments of the target population. For this reason, the survey sought to establish the share of households and small-scale firms presently included or excluded by different providers. Of these providers, the regulated and supervised group is known for taking particularly nontrivial risks in intermediating third party deposits for a gain. Fortunately, one category of the unregulated and unsupervised providers faced no such risks, as
- 12. Page 12 Access to Finance they deal almost exclusively with their shareholding customers only. Accordingly, the survey treated commercial banks and non-bank financial institutions as a distinct class under the ‘regulated service provider’ category. Yet, among the non- regulated service providers, however, the survey created two sub-categories based on their specialization, level of organization or formality of activities, as well as the underlying motivation for business, which clearly have an influence on their conduct and choices. In this regard, therefore, the survey distinguished between: Specialized, non-regulated providers as a cluster comprising financial NGOs, financial cooperatives, welfare funds, and village banks, which may be small but relatively formalized in approach to service provision, and; Non-specialized, non-regulated providers, comprising Upatu-style rotating savings and credit associations (ROSCAS). Also in the category of non-specialized providers the survey included any institution or person that provides supplier credit. Finally, the survey identified a large group of individuals (precisely 1,711 or 70.1 percent of the households studied) that were providing informal credits, but do not belong with either of the two categories of providers discussed above. Finally, the survey also identified a few profit-motivated moneylenders within the individuals that were giving credits in the corridor, but again do not belong with either of the two categories of providers discussed above. For exploring the extent of access, the survey looked at the different classes of services or products provided and have, thus, distinguished the degree of accessibility by households and firms in the central corridor area. This extent of access is captured graphically by tracing the usage of a particular service or product as a percentage of the eligible population across time and penetration (see following illustration, a Market Map):
- 13. Page 13 1.4 DATA COLLECTION AND SAMPLING Three sets of data were collected using separate instruments: the first and primary questionnaire was an all-open structured set of response items administered face to face to a sample of 2,441 households (Appendices 1) randomly selected from 126 enumeration area clusters throughout the four survey regions (Table 1.1). Region Districts Population (2002 Census) Number of Households (2002 Census) Enumeration Areas Households Urban Rural Total Urban Rural Total Dodoma 5 1,698,996 376,530 3 23 26 87 563 650 Morogoro 6 1,759,809 385,260 7 19 26 173 477 650 Shinyanga 8 2,805,580 445,020 3 23 26 65 585 650 Singida 4 1,090,758 217,572 3 23 26 87 563 650 Total 23 7,355,143 1,424,382 16 88 104 412 2,188 2,600 TABLE 1.1: SURVEY SAMPLE DESIGN These households were randomly selected from rural and urban cluster pools established within the national sampling frame, which is based on the recent 2002 Tanzania Population and Housing Census. The optimal number of households to interview per cluster was determined at 25 based on the minimum units established in the national sampling frame, while the optimal number of enumeration sites was determined at 26, also as determined in the said sampling frame. Figure 1: Graphic Illustration of Market Penetration
- 14. Page 14 Access to Finance As planned, the households selected for interview from each cluster were picked randomly at appropriate intervals representing a fixed proportion of its current population size. Hence, the fact that Shinyanga region had slightly more households did not affect the representation of the total households ultimately interviewed vis-à- vis the other regions or overall sample size. In addition, since the first stage of sampling process required the clustering of all enumeration areas in the national sampling frame into urban and rural categories, this procedure ensured that each household’s probability for selection was proportional to their population size (Table 1.2). District Households Location Total SME Rural Urban 1 Kondoa 162 162 2 Mpwapwa 84 25 109 3 Kongwa 115 115 4 Dodoma rural 96 96 5 Dodoma urban 31 31 6 Dodoma urban 22 69 91 Dodoma region 112 7 Bukombe urban 15 15 8 Bariadi 122 122 9 Maswa 19 19 10 Shinyanga urban 31 19 50 11 Kahama 77 77 12 Bukombe rural 98 98 13 Meatu 20 20 14 Shinyanga rural 79 16 95 15 Kishapu 39 39 16 Iramba 248 248 17 Manyoni rural 94 94 Shinyanga Region 193 18 Kilosa urban 25 25 19 Morogoro rural 113 113 20 Kilombero urban 25 25 21 Morogoro urban 1 75 76 22 Kilosa rural 100 1 101 23 Mvomero 174 174 24 Kilombero urban 26 26 25 Ulanga 50 50 26 Kilombero rural 61 61 Mororogo Region 136 27 Singida rural 176 176 28 Singida urban 26 82 108 29 Manyoni urban 25 25 Singida Region 126 Grand total 2038 403 2441 567
- 15. Page 15 TABLE 1.2: GEOGRAPHICAL DISTRIBUTION OF SAMPLE BY SPATIAL LOCATION The survey obtained all relevant EA maps for sampled clusters from the National Bureau of Statistics. However, all household listings were updated on site during field work to incorporate changes in population size since the 2002 census. Once on site (and with the aid of the EA maps and village scouts), the names of all household heads within the clusters were first listed by the field supervisors (Appendices 6), after which a random sample of 25 were selected and interviewed. While systematically drawing random samples for interview from the household listings, there were a few instances where those randomly selected initially following the appropriate interval did not included enough SME-households to meet the desired 25 interviews per cluster; of which 20% were to be SME-involved. Nonetheless; in such circumstances, the sampling interval was again systematically adjusted to yield the desired number of households for interview (Table 1.2), hence the overall results of this survey as presented here in this report are unbiased and representative of the 1.4 million households in the areas studied. 1.5 DATA TYPE AND ANALYSIS 1.5.1 Household demand survey On the demand side, respondents gave views on 20 different broad issues: from reporting on their age, highest level of education attained, and possession of any occupational skills. They also gave information on the size of their households and composition, participation in development group activities, and their families’ current assets portfolio. Various aspects of their financial wellbeing and current access were also explored (Appendices 2). Of particular interest for the formulation of an effective financial services intervention by RLDC, were respondents baseline information on: Current sources and levels of income and savings (if any). Current means of storing excess income (if any) and their satisfaction with the means chosen. Current stock of debt (if any), by amount, source, and purpose. Knowledge of financial service providers existing within their district, regardless of their legal status, e.g. whether individuals,
- 16. Page 16 Access to Finance groups or institutions and their identity, location, and approximate distance from where the respondents lived. Views on available providers (if any is known within district), products, and their perceived strengths or weaknesses. Immediate and long-term personal plans for improving livelihoods, alongside the underlying motivations for such plans and suggestions on how to resolve hindrances. Ability and willingness to pay for various financial services if these were somehow available; along with preferences for terms and conditions for service. Lastly, since RLDC intended using the survey to establish baseline indicators for measuring its financial services interventions, the following additional information were, hence, also collected: Current access to markets, advisory services, and inputs, e.g., market information through radio, TV, newspapers, or word of mouth, etc. Current use of market information. Listening and reading habits. Ability to pay for information services. Media preferences, etc. Listening While the primary questionnaire explored the overall participation of the entire sample in micro/small-scale enterprises, a detailed secondary questionnaire which was part of it, was administered to 567 of the households that were then involved in SMEs (Appendices 3) and critically examined the following aspects of the enterprises: Type of economic activity Ownership Enterprise start date Sources of start up capital Total current workers in enterprise analyzed by their gender
- 17. Page 17 Total paid workers in the enterprise Total number of workers at start of enterprise; and The major constraints to enterprise growth/expansion currently Due to major oversight; undetected on the first three days of fieldwork, however, the Kiswahili version of the instrument omitted very important items concerning the annual inflow and outflow of enterprise income by source, periods when there is excess income or shortage, and he specific needs or uses to which this income is annually applied. Secondly, for each current source of income, the English version of the questionnaire contained items on how the households were coping with income shocks or emergencies and how these could be reduced or contained towards improving livelihoods through SMEs that were again; regrettably, omitted during translation. Consequently, there are many instances where a direct comparison of the SME insights from this survey and a similar one conducted earlier by Swisscontact East Africa in the Uhuru corridor is not possible. These shortcomings notwithstanding, however, the current survey has produced some interesting facts about the growth potential of SMEs in the areas studied –and particularly the negative consequences of their financial exclusion. 1.5.2 Supply-side inventory study The third survey instrument (Appendices 4) was administered to 14 randomly selected financial intermediaries operating at the lowest level of intermediation in the survey areas. This supply-side instrument collected information critical to RLDC’s understanding of current obstacles faced by the local institutions in creating greater access to finance for concerned population. Thus, on the supply side, several intermediaries—actually numbering 110 –were contacted on phone based on a 2005 Bank of Tanzania Directory of Microfinance Institutions in Tanzania so that RLDC could get to know more about their activities and if they would be interested in cooperating in widening and deepening access to the poor rural households. Those successfully located from this directory were contacted to provide information on the following aspects of their activities: Name and principal place of business (if any), together with all necessary contact addressed not previously published by the Bank of Tanzania, e.g., email, phone, and fax numbers. If organization was also providing services in other regions/describe its geographical focus in greater detail
- 18. Page 18 Access to Finance Legal status and sources of funding for the provision of financial services Target customers eligibility criteria for access Measures taken (if any) by the organization to reach greater numbers of the poor rural households in target areas of operation Service delivery processes and requirements Products and services provided, especially if institution is dealing with poor rural households in particular The size of organization as measured by (a) number of staff, (b) customers/shareholding-members, and (c) total assets/equity base or savings Immediate long-term organizational plans Real and perceived opportunities and current obstacles in expanding services, especially to the poor rural households Size and volume of business presently handled in terms of (a) deposits/savings or shares and (b) outstanding loan portfolio Three-year historical record of growth and expansion of each provider
- 19. Page 19 The assessment of critical success factors that would definitely facilitate the expansion of financial services to the presently underserved or excluded population; and, Indicative areas for possible collaboration with RLDC towards expanding services to the presently excluded/underserved population. Because a very high number of the sampled households were ignorant of the financial institutions existing within their districts, the Bank of Tanzania Directory of Microfinance published in November 2005 was an important reference for sampling intermediaries for interview. However, despite contacting many intermediaries for interview from this directory3; just published in October 2005, no more than 22 were reachable and ready for interview: 14 were interviewed on phone while 17 insisted on face to face interviews. These 14 provided enough information to support 3From the list under various districts in Dodoma, 21 were unreachable or wrong contacts for any appointment to be made for interview. In Shinyanga, 28 were unreachable or had wrong contacts information for any appointment and in Singida, it was 32. Another 12; two in Dodoma, four in Morogoro region, three in Shinyanga, and a similar number in Singida were successfully contacted but declined participation off site. Lastly, five of the intermediaries in the Bank of Tanzania directory declined outright any interview; including Hembeti Rural SACCOS—one of the most commonly featured in the survey with households.
- 20. Page 20 Access to Finance important conclusions, recommendations (Appendices 4) and insight into the current scale of outreach and constraints. 1.6 BASELINE CONTEXT OF SURVEYED AREAS For a better appreciation of the access to finance baseline situation of the four regions surveyed, it is first necessary to highlight the existing social and physical infrastructure, for instance, the availability and distribution of roads and various types of financial intermediaries in the area of survey, which has a bearing on accessibility and cost of service. Moreover, for certain financial services that have become highly information-dependent, lack of access to electricity and telecommunication required by the intermediaries to operate effectively can rule out their provision and, hence accessibility. In this regard, this section of the report presents some basic information about the four study regions that will help highlight the emerging pattern of access to finance as well as potential challenges in trying to improve the situation. Secondly, the mode of production and consumption can often dictate the presence or absence of financial services, hence, access or exclusion of households. Accordingly, an understanding of the people’s current livelihood systems, household composition, and levels of income, all have an influence on their demand for services and were, thus, thoroughly investigated. 1.6.1 Physical Infrastructure The area covered by the survey was vast, measuring approximately 212, 232 square kilometers in size, and involved a population of nearly 8 million people (Table 1.3). Hence, the use of a two-stage random sampling process in identifying the 2,568 households interviewed was important in ensuring that both sample and baseline indicators were robust and representative; as earlier discussed. Region Land area (Sq. km) Population Households Districts Sample sites Sample size Morogoro 70 799 1 759 809 385 260 7 26 670 Dodoma 41 311 1 698 996 376 530 6 26 672 Singida 49 341 1 090 758 217 572 4 26 664 Shinyanga 50 781 2 805 580 445 020 8 26 562 Total 212 232 7 355 143 1 424 382 25 104 2 568 TABLE 1.3: SAMPLE SIZE AND DISTRIBUTION In any case, the baseline survey as a process was an important part of RLDC’s 10- step project cycle, as it seeks to establish viable, self-sustaining financial service that
- 21. Page 21 could provide greater access to finance. Although a fully-fledged intervention and independent of the others, yet an improved access to finance can catalyze many other aspects of RLDC’s interventions. A brief discussion of the survey areas should present a clearer picture of the development challenge faced by RLDC: MOROGORO REGION Morogoro is the largest of the four areas surveyed, with wonderfully fertile soils, beautiful mountains, and a vast area surface, which is nearly twice that of Dodoma or 1.5 times Singida’s total surface area. However, apart from a single trunk road, most of the region has seasonal roads of very poor condition. In addition to this trunk road, there is similarly a single railway line running parallel to the said trunk road and also connecting the region to the same adjacent areas (Figure 2). Figure 2: Central Corridor’s Rail and Road Network
- 22. Page 22 Access to Finance During the survey, there were four banks operating in Morogoro with 14 branches—most of them at district administrative centers. There were also four non- government organizations providing financial services, mostly credit. The four included World Vision International, FINCA Tanzania, PRIDE Tanzania, and SEDA (Small Enterprise Development Agency). Unlike, the banks however, all the NGOs were operating in Morogoro town only and, therefore, had no presence further a field in the districts. Surprising, given its size and rich endowment with good rainfall, beautiful scenery, and fertile soils, Morogoro has relatively few SACCOS, numbering just 45 as at the time, compared to, for instance, Dodoma, which receives much less annual rainfall and has poorer soils. One community development organization (CBO), TASAF, although not mandated or specialized in the provision of financial services, was widely treated as a financial intermediary by the local communities throughout the 104 cluster areas covered by survey. In addition, TASAF seems highly regarded as a financial intermediary. DODOMA REGION The smallest of the four regions covered by the survey, Dodoma, has a total land area of 41,311 square kilometers. Nonetheless, with a population of 376,530 households, it has nearly as many people as Morogoro, which is almost twice its size in area. Much of the region is a plateau, with Bahi swamps found lying at 830 meters above the sea level at the lowest points of region, and the highest point lying at some 2000 meters above the sea level, is in the highlands north of Kondoa district. The whole of Dodoma is similarly linked to Morogoro and Dar es Salaam to the east by a single trunk road and railway line. And despite being the national capital and lying almost at the center of Tanzania mainland, the region has no good road connections to any of the adjacent regions to the west, northwards or south. At the time of survey, there were four banks and eight branches operating in the entire Dodoma region. Other financial institutions operating in the area included two NGOs and a CBO, as well as 89 Savings and Credit Cooperatives; many of them listed in the 2005 Bank of Tanzania Directory of Microfinance Institutions, but were hard to locate on the ground. Unlike the SACCOS, however, both banks and NGOs operating in Dodoma concentrate their services at just three of the major district towns, i.e., Dodoma municipality itself and nearby Mpwapwa and Kondoa district headquarters.
- 23. Page 23 A random sampling and study of three of these 89 SACCOS during the baseline survey shows that, except for a handful, most are moribund. More insight into the capacity of the SACCOS in providing access to finance to poor rural households, alongside their institutional constraints, is presented later in Chapter 3. SINGIDA REGION The entire Singida region with a surface area of 49,341 square kilometers has a mere total road network of 3,238 kilometers and likewise a single railway line running across northwards to Shinyanga and Mwanza regions from Dodoma in the south. Technically, it means that for every 15 square kilometers of land area surface, there is just about a kilometer of road in the entire region (Table 1.4). District Main road Region road District road Rural road Total km Singida rural 21 0 270 0 291 Singida urban 161 295 325 430 1211 Manyoni 343 279 104 123 849 Iramba 85 271 147 384 887 Total 610 845 846 937 3238 TABLE 1.4: EXAMPLE OF INFRASTRUCTURE NETWORK IN SURVEY AREAS This scarcity of roads is most visible if one compares the total length of road available by district and type of road, as in the table above. In addition to poor road infrastructure, Singida region also lacks many financial intermediaries. Although the region had four different banks and six branches, five of all six were located either in Singida municipality itself or in Manyoni. The lone NBC branch in Kiomboi was the only branch operating from a relatively remoter and smaller town. Secondly, all of the only two non-bank financial institutions in the region that were offering services, i.e., TASAF and Community Development Trust Fund of Tanzania, too, were also based in the regional municipal town or Manyoni. In addition, there were 46 SACCOS operating in the region. A random sample of three of these SACCOS studied during the baseline survey also show the majority to be equally moribund as in Dodoma and Morogoro. SHINYANGA REGION The last region studied, which is located at the extreme upper end of the central corridor, is Shinyanga. With an area surface of nearly 51,000 square kilometers, it is second largest amongst the regions of central corridor and the most populated;
- 24. Page 24 Access to Finance having nearly three times more people than Singida, about twice as many people as Dodoma, and almost the same population as Morogoro (which has a much larger area, see Table 1.3 above).
- 25. Page 25 Figure 3: Je Chanzo kipi kikuu kinacho kuingizia kipato? 81% 4% 14% 1% kilimo na ufugaji ajira au vibarua biashara none / msaada au penseni Chapter2 GENERALBASELINERESULTS 2.1 Residency and Age The total age of respondents averaged 45.3 years, while residency tenure at their current location ranged from 19.4 years in Shinyanga to 28.9 years in Singida (Table 7.5). Kwa muda gani umeishi hapa? Means years of residency Age Region N Dodoma 605 24.7 42.5 Morogoro 644 28.4 44.5 Singida 643 28.9 51.9 Shinyanga 534 19.4 41.5 Total 2426 25.6 45.3 TABLE 2.1: AGE AND RESIDENCY TENURE BY DISTRICT 2.2 The People and Social capital In all of the four surveyed areas, agriculture remains the major source of livelihood for nearly 400,000 households, accounting for nearly 81 percent of reported sources (Figure 3). The second main source of livelihood in the areas surveyed is self-employment in micro and small-scale enterprise activities, which accounts for 14 percent of all
- 26. Page 26 Access to Finance Figure 4: Je, kuna biashara yoyote unayofanya kwa sasa? 0.0 20.0 40.0 60.0 80.0 100.0 120.0 buko mbe urban manyo ni urban do do ma urban shingida urban kishapu kilo mbero urban manyo ni rural shinyanga rural meatu maswa shinyanga urban kilo sa urban kilo mbero urban singida rural kahama iramba mo ro go ro urban mpwapwa buko mbe rural do do ma urban ko ngwa ulanga kilo mbero rural bariadi ko ndo a do do ma rural kilo sa rural mvo mero mo ro go ro rural T o tal Ndiyo Hapana reported livelihood systems. Current participation in SMEs among the surveyed households ranged from seven percent in Maswa district to 85 percent of the sample in Iramba, which again underscores importance of small businesses as a source of livelihood in the target area (Figure 4). Apart from the head of household (the main respondent), 12.4 percent of other household members were reportedly also self-employed in SMEs; hence bringing the total current participation of entire sample in SME to nearly a half of surveyed population. Yet another 8.2 percent of the households were previously self-employed in an SME activity, but have since closed for some reason. The mean annual incomes for the entire sample varied greatly by level of education; those with tertiary level of education earned almost six times the annual income earned by households with no education, 5.5 times of those with primary education, 0.6 times of those with secondary education, and 4.7 times of the sample average (Table 8). Education level Mean Median Maximum N No education 491,103 220,000 1,510,000 220 Primary education 534,136 258,000 24,080,000 1247 Secondary education 1,764,194 800,000 11,700,000 79 Tertiary 2,932,462 2,800,000 8,800,000 13 Adult education 3,765,000 4,500,000 8,000,000 5 Total 620,479 260,000 24,080,000 1,564 TABLE 2.2: HOUSEHOLDS ANNUAL INCOME BY EDUCATION Similarly—and surprisingly, those with adult education level of education were earning 6.1 times more the average annual sample income and 1.3 times more the annual incomes earned by those with tertiary level of education.
- 27. Page 27 0 200,000 400,000 600,000 800,000 1,000,000 1,200,000 1,400,000 Meanincome(TZS) rural urban total Location Figure 5: Mean income by Location mean income Figure 6: Current Asset Holdings by Item (Percent of Households) 0.0 0.0 0.0 0.0 0.1 0.1 0.1 0.1 0.3 0.3 0.3 0.3 0.5 0.6 1.0 1.2 1.4 2.9 3.0 4.6 4.6 9.4 9.6 14.0 20.8 24.8 0.0 5.0 10.0 15.0 20.0 25.0 30.0 tractor Other Solar Motor vehicle Poulty Sheep Nyumba This seemingly odd phenomenon, in which adult education graduates were earning more than the ones with tertiary level education, is likely the outcome of a history where the elderly have continued to dominate corporate and public leadership in Tanzania. Among the rural-based households, annual incomes were also very different (Figure 3); with the urban incomes more than triple the rural ones. However—probably because of the shared livelihoods base, i.e., agriculture and SMEs—the gender of male- and female-headed households evidently had little influence on their annual incomes; at Tshs 664,399 for female-headed households and Tshs 603,260 for male-headed ones, there would seem to be some parity of sorts. Yet, the median annual incomes for male-headed households (at Tshs 280,000) were
- 28. Page 28 Access to Finance evidently slightly higher than for the female-headed households (Tshs 225,000). Besides current sources of income, the majority of the households also had accumulated some savings and assets of varying value, ranging from owning land (24.8 percent of mentions), commercially and non-commercially tradable shelter (20.8 percent of mentions), and an equal assortment of livestock (27.2 percent of mentions). The size and composition of surveyed households was also considered an important factor in understanding their access to finance. Generally, the survey shows that most households are very large, averaging 6.4 persons each (Table 2.3), and a sizeable number of the members are relatively young or jobless. TABLE 2.3: SIZE AND COMPOSITION OF SURVEYED HOUSEHOLDS In addition to their level of education, nearly 30 percent of the female-headed and 34% of male-headed households had some valuable occupational skills in various fields (Table 2.4). Secondly, besides the heads of household, almost 14% of other members (13.7 percent) had various occupational skills. Je, una ujuzi wowote wa kiufundi Frequency Percent Hapana 1697 69.5 Ndiyo 744 30.5 Indicator Total Shinyanga Singida Morogoro Dodoma #av. household members 6.4 8.2 6.3 5.3 5.9 #av. under 18 years 3 4 3 2 3 #av. Children out of school 0.2 0.3 0.1 0.1 0.2 #av. Unemployed adults 1 2 0.3 1 2 Av. Annual income 620,584 718,819 366,980 895,677 610,265 Av. Savings amount Tshs at home 44,061 73,758 45,528 36,386 24,812 in account 54,980 40,647 29,243 125,100 19,584
- 29. Page 29 Total 2441 100 TABLE 2.4: POSSESSION OF OCCUPATIONAL SKILLS BY HOUSEHOLDS Carpentry (21.2 percent), masonry (19 percent), and tailoring (15.8 percent) were by far the most common occupational skills amongst the surveyed households (Table 2.5). Occupation N Percent Carpenter/wood worker 181 21.2 Mason 162 19.0 Tailor/tie-dye specialist 135 15.8 Arts and crafts/Photographer 76 8.9 Bicycle repair 60 7.0 Mechanic 46 5.4 Other 50 6.1 Blacksmith/welder 20 2.3 Technician 19 2.2 Electrician 19 2.2 Driver 19 2.2 Brick maker 19 2.2 Hair dresser/barber 18 2.1 Lumber jack 12 1.4 Shoe repair 10 1.2 Plumber 6 0.7 Total 852 100.0 TABLE 2.5: OCCUPATIONAL SKILLS AMONGST POOR HOUSEHOLDS Moreover, an average 19 percent of surveyed households were involved in various development group activities per district, a fact pointing towards good prospects for RLCD in mobilizing the people to improve their access to finance (Table 2.6). It is significant that amongst this group, the access needs for financial services seems the single strongest force for self-help initiatives (at 33% percent) of current self-
- 30. Page 30 Access to Finance help activities, followed by the households’ interest in improving livelihoods generally (44.2 percent). Group activities N Percent 1 Financial associations/groups 161 33 2 Agriculture and Livestock 129 26 3 Joint enterprise/association 88 18 4 Social action 56 11 5 Welfare 34 6.9 6 Other, e.g. village security 15 3.1 7 Craft, arts 8 1.6 Total 491 100 TABLE 2.6: PARTICIPATION IN DEVELOPMENT GROUP ACTIVITIES It is significant that almost 90 percent of the households’ surveyed were already organized for self-help in at least one such group activity, and another 10 percent participating more than one such activity (Figure 7).
- 31. Page 31 1470 218 658 88 0 500 1000 1500 2000 Households Male Female UsingvsNot using Figure 8: Je, kwa sasa unatumia taasisi yoyote ya kifedha iliyopo katika wilayani hii? No Yes Chapter3 FINANCIALACCESS &EXCLUSION A major finding of this survey, though, is that lack of access by the poor rural households may be a choice; and not necessarily due to a lack of intermediaries or their knowledge of their presence. This chapter looks more closely at the current extent of access and present details on other factors that hinder the poor rural households’ access to financial services. 3.1 PERCENTAGE WITH CURRENT ACCESS Of the 2,670 households interviewed during the survey, 12.6% were using at least one of the intermediaries existing within their district, in addition to another 4.1 percent of the other members who were similarly using these intermediaries. Furthermore, both male and female-headed households were similarly inclined to using the intermediaries; with 11.8% of the female-headed households reporting use of at least one intermediary, as compared to 12.9% by the male-headed households (Figure 8). However, just 8.9 percent of all households surveyed had a bank account and about 19 percent a current loan. 3.1.1 Awareness of financial services More than a half of the population surveyed (54.2 percent) did not know of any financial intermediary existing within their district (Table 3.1), yet they have lived here long enough to know at least one or the nearest to their homes (Tables 3.2 to 3.5).
- 32. Page 32 Access to Finance Providers Known Closest Distance kms Overall Household Use (mentions, Percent)(Mentions, Percent) (Mentions, Percent) (Average) (Furthest) 1 SACCOS 29.1 38.9 16 150 28.1 2 NMB 25.8 22.0 32.3 180 32.0 3 Public, TASAF 9.8 9.9 39 110 7.6 4 CRDB 7.3 2.4 22 80 8.1 5 NBC 7.2 4.6 32.5 500 4.1 6 PRIDE TZ 4.6 2.8 15.8 200 2.2 7 Post bank 5.0 2.0 27 85 1.7 8 SEDA/WVI 4.1 1.8 38.8 70 2.6 9 FINCA TZ 3.1 1.9 25.5 150 0.9 10 Public, other 0.9 0.4 39.5 78 0.2 11 Banks, other 1.3 1.2 18 37 1.1 12 NGOs, other 1.6 1.1 0 3.5 13 Group 0.2 0.4 3.2 5 1.1 Undisclosed 6.8 TOTAL 100.0 100.0 25.9 126.5 100.0 TABLE 3.1: AWARENESS, PROXIMITY, AND USE OF INTERMEDIARIES 3.1.2 Financial Literacy The fact that slightly more than a half of surveyed households (54.1 percent) did not know about any existing financial intermediaries within their district –despite having lived there long enough (mean residency of 26 years), suggests several facts: firstly, this could reflect the great distances between where the providers are located and where the rural population lives. Secondly, it might reflect the low-levels of operation at which these intermediaries currently interact with the public, hence their low visibility and near-obscurity. Thirdly, this might reflect hopelessness among the population for ever getting any access to services from sources other than their own self-help initiatives, hence a widespread lack of interest about these institutions. Incidentally, and not surprisingly; by extension from the third argument for little knowledge of intermediaries within the districts surveyed, the most widely known providers in the corridor were member-owned and member-managed SACCOS,
- 33. Page 33 which was mentioned 29.1 percent of the time). Probably because of its relatively extensive network; by December 2006 numbering 118 branches countrywide, NMB was also widely known to surveyed households (25.8 percent of the mentions). Providers Which intermediaries do you know of in your district? Which ones is nearest to your home Distance kms Mentions Percent Mentions Percent Average Furthest SACCOS 654 29.1 439 38.9 16 150 NMB 580 25.8 248 22 32.3 180 Public, TASAF 221 9.8 112 9.9 39 110 CRDB 165 7.3 27 2.4 22 80 NBC 162 7.2 52 4.6 32.5 500 PRIDE TZ 104 4.6 32 2.8 15.8 200 Benki ya Posta 112 5 23 2 27 85 SEDA/WVI 92 4.1 20 1.8 38.8 70 FINCA TZ 69 3.1 21 1.9 25.5 150 Public, other 20 0.9 4 0.4 39.5 78 Benki zinginezo 30 1.3 13 1.2 18 37 CBOs/NGOs, other 37 1.6 12 1.1 0 ROSCAS 5 0.2 4 0.4 3.2 5 TOTAL 2251 100 1128 100 TABLE 3.2: HOUSEHOLD’S KNOWLEDGE OF AVAILABLE SERVICE PROVIDERS AND PROXIMITY Another widely known intermediary in survey areas is the Tanzania Postal Bank (mentioned almost five percent of the time). And, among the financial NGOs, the most widely known ones are PRIDE Tanzania (4.6 percent of mentions), SEDA/WVI (4.1 percent), and FINCA Tanzania (3.1 percent); all combined representing 11.8 percent of the mentions (Table 3.2). Surprisingly, the publicly-funded TASAF, which is really a social-action fund, seems highly visible (mentioned 9.8 percent of the time) and is widely considered as one of the many present financial intermediaries in all surveyed areas. 3.1.3 From knowledge to use Regarding the use and choice of provider, it seems clear from this survey that not knowing where to get a service is the first major hindrance to access. Not surprisingly, the most widely used intermediaries by households in the surveyed areas were, coincidentally, also the most well-known. Altogether as a group, the formal financial institutions were the second most well known intermediaries in surveyed areas after SACCOS. Likewise, as a group, these formal institutions were also the most widely
- 34. Page 34 Access to Finance Figure 9: Which one of the providers in your district are you using currently 0 10 20 30 40 50 60 bank SACCOS Financial NGOs Other used intermediaries by the poor rural households; 52.4% amongst households using various savings instruments (Figure 9), followed by financial cooperatives (30.5%), and lastly NGOs (17.1%). This observation notwithstanding, the survey also showed some significant differences in the types of financial services offered on the one hand and overall depth of access by the households from different providers on the other hand. Typically, the survey show formal financial intermediaries leading in providing largely banking services to the poor households. However, with regard to access to credit, cost, and quality of services to poor rural households, it is the SACCOS leading. 3.1.4 Proximity is no Guarantee of use To be able to get services, about 51.4 percent of the households would have had to walk for at least three hours to reach the nearest intermediary (Table 3.3), while slightly over 40 percent would have had to walk a minimum five hours to the nearest service provider. Je ni umbali gani kwa kilometa? Range (in kms) Range (in hrs walking time) N Percent Cumulative Percent 1 Within 5 1.3 452 39.3 39.3 2 5.01 -10.00 2.5 107 9.3 48.6 3 10.01 - 19.99 4.8 126 10.9 59.5 4 20.00- 24.99 6.3 66 5.7 65.2 5 25.00 - 50.00 12.5 233 20.2 85.5 6 50.01 - 99.99 25.0 123 10.7 96.2 7 beyond 100 25.0 44 3.8 100.0 #answering 1151 100.0 #not answering/do not know of the distance 1290 52.8
- 35. Page 35 TABLE 3.3: TYPICAL DISTANCES TO NEAREST FINANCIAL SERVICE PROVIDER Clearly, the table above shows that lack of intermediaries closer to the households is a hindrance to greater access to finance in areas studied. However, while distance is key influence, it also does not seem to be the only one determining the use or non-use of a specific provider by the households. For instance (Table 3.4), the survey shows many providers that are close enough to the target population, and yet are not necessarily the ones frequented. Je, ni taasisi gani kati ya hizo ipo karibu na wewe? Provider Mentions Percent 1 SACCOS 439 38.9 2 Benki ya NMB 248 22.0 3 Public, TASAF 112 9.9 4 Benki ya NBC 52 4.6 5 Benki ya CRDB 27 2.4 6 Benki ya Posta 23 2.0 7 Zote ziko Karibu 59 5.2 8 Zote ziko Wilayani/mbali 61 5.4 9 PRIDE TZ 33 2.9 10 FINCA TZ 21 1.9 11 SEDA/WVI 20 1.8 12 Other banks 13 1.2 13 Other NGOs 12 1.1 14 Public, other 4 0.4 15 ROSCA/Upatu group 4 0.4 Total 1128 100.0 TABLE 3.4: PROXIMITY OF VARIOUS INTERMEDIARIES TO HOUSEHOLDS In fact, within every range of distance, there were half as many providers that were not being used as there were being used by the population (Table 3.5). For instance, about four percent of the providers that were then used by the population were located beyond 100 kms, which was almost identical to the number unused by the concerned population. Similarly, there were 10 percent more providers closer to the population, but were not being used for one reason or another. Distances in kms USED NOT USED N Percent N Percent beyond 100 12 4.4 32 4.1 51 – 100 32 11.8 100 13 21 – 49 30 11.1 179 23.2 11 to 20 57 21 143 18.5 6 to 10 16 5.9 42 5.4 Within 5 124 45.8 276 35.8 Total 271 100 772 100
- 36. Page 36 Access to Finance Figure 10: How Householdswith Current Accessare using Providers 0 10 20 30 40 50 nahifadhi fedhazangu kupata/kupok eana marajeshoya mikopo kupokea msharaau penseni kupokea msaadaza hudumaza jamii kusafirisha helaaukulipia bilimbalimbali napatafaida za riba/ninatumia kununuahisa Use PercentofHouseholds withAccess TABLE 3.5: DISTANCE VERSUS USE OR NON-USE OF PROVIDER 3.2 PATTERNS OF USE OF AVAILABLE SERVICES In terms of specific services, 91 percent of surveyed households had no banking accounts or receiving account-related services of any kind. Secondly, of the households (12 percent) currently using existing intermediaries within their districts, just nine percent have bank accounts. But among these households, as shown in Figure 10 above, most were using the bank accounts mainly to receive loans and make loan repayments (38.5 percent),
- 37. Page 37 followed by the demand for safe and secure facility for storing personal savings. Yet another 17.9 percent of the households were using their accounts to receive monthly salaries and/or pensions. In addition to the heads of households, 4.1% of the surveyed families also have one or more members holding an account, thereby increasing the number of households with accounts to just 16.7 percent of studied population. This number is very close indeed to the overall percentage of households holding bank accounts nationally, as reported in the 2002 Household Budget Survey. The significance of this point is that there has been no improvement in outreach since then; despite the noticeable increase in number of financial institutions in Tanzania. Furthermore, about four percent of the households currently not having any bank account were previously banked, but have since become excluded for some reasons (explored at length in later sections of this report). Yet it is significant again that one percent of the households maintained bank accounts to earn some decent returns on their deposits, and equally noteworthy is that a similar number maintain bank accounts for making payments or money transfers regularly. In many ways, therefore, the current widespread notion that poor people also have diverse financial needs just like their wealthier counterparts is a fact to consider whenever expanding or improving access to finance for this population. What is perhaps unusual, as previously shown by Figure 10 above, is the relatively high number of the poor rural households (7%) willing to hold bank account once the benefits of doing so, e.g., automatic access to various individual or community-focused development services—such as those offered conditionally by TASAF, are made clear and understood by the households. 3.2.1 Types of Accounts Held The most popular bank account among the surveyed households currently using intermediaries existing in their districts (by 81.4 percent) is the ordinary savings account (Table 3.6), followed by a current account (6.4 percent) or loan accounts (6.8 percent). Kama ndio, je, ni akaunti za aina gani (a)? N Percent 1 Akaunti ya akiba 192 81.4 2 Kuweka na kopa/akaunti ya mikopo 17 7.2 3 Akaunti ya kuweka na kuchukua/akaunti ya biashara 21 8.9 5 Akaunti ya vikundi 4 1.7 6 Akaunti ya muda maalumu 3 1.3 Total 236 100
- 38. Page 38 Access to Finance Figure 12: Katika taasisi za kifedha zinazofahamika wilayani, zipi zina huduma bora? 170 132 39 28 19 21 24 5 11 SACCOS NMB Bank CRDB Bank TASAF NBC Bank Other banks NGOs None Other Mentions TABLE 3.6: ACCOUNTS HELD BY POOR RURAL HOUSEHOLDS With nearly a half of the households (49.1 percent) reporting using their accounts for at least once a month, there is a real demand for these services by the poor rural households. As indicated in Figure 11 below, a very large number of the households (63.4 percent) were banking with NMB, followed by CRDB (12.8 percent) and SACCOS (12.3 percent). 3.3 PERCEPTION OF THE INTERMEDIARIES While a majority of the rural population currently with bank accounts are maintaining these with the more formal providers; as clearly reflected in Figure 11 above, these intermediaries are not necessarily the most liked. In fact, the poor rural households prefer banking with SACCOS (mentioned as the more liked in nearly 38 percent of mentions) due to many factors (explored in Figure 13), followed far behind by NMB (mentioned as the more liked intermediary 29.4 percent of the time) and CRDB (mentioned 8.7 percent of the time). Figure 11: Je, akaunti yako/ zako zipo katika taasisi au benki gani? 0 5 10 15 20 25 30 35 40 saccos nmb tasaf crdb nbc NGOs finca Other banks upatu hapa mtaani Provider PercentageofHouseholdsusing
- 39. Page 39 Figure 14: Mentionsof Poor Service Providers 0 10 20 30 40 50 60 NMB SACCOS FINCA PRIDE SEDA CRDBBank TASAF/other government NBC Otherbank OtherNGOs Adversly Mentioned Provider Percent oftimeadverselymentioned Figure 13: Attractivenessof Current Provider 0 10 20 30 40 50 Loanspeople likeme Safeandsecure savingsfacility Easyaccessto one’ssavings: Good/quick service Cares/contribut esto Reasonable/easy loanterms Low/reasonable entry Reasonably pricedloans Straightforward process-“haina Exceptionally goodcustomer Fastpayment services/modest Closertohome, reliable,flexible, Professionalism /good Clear objectives/no Most attractive attribute PercentofMentions Altogether, the financial NGOs, which as a group; at 42.7 percent of the mentions, are the least liked providers due to poorly regarded products. In all the regions surveyed, the intermediaries offering access to loans on suitable terms were seemingly the most liked the households. Also liked by the poor rural households are the intermediaries able to offer safe and secure storage for one’s savings, which is mentioned nearly 11 percent of the time as a definite strength (Figure 13). The other factors that users consider in their satisfaction with services are ease of access to one’s funds on demand without any undue restriction (mentioned about eight percent of the time), quick service (7.2 percent of mentions), and the level of corporate citizenship demonstrated by a provider (6.7 percent of the mentions).
- 40. Page 40 Access to Finance In this regard, NMB with whom a relatively large number of the households bank with is also the least liked, largely because of its congested banking halls, and bureaucracy (Figure 13), while the NGOs in particular are least liked because of poorly designed products. Among the leading defects of the NGOs’ products (Table 3.7) are what the poor households themselves deem unreasonable terms and conditions (mentioned nearly 28 percent of the times), overly priced services (mentioned nearly 14 percent of the times), and inordinate delays in loan disbursement (mentioned 11 percent of the time). Je, ni kwa nini haina huduma bora? Major defect N Percent 1 Unsuitable terms and conditions 70 28 2 Interest on loans too high, while there too little or no interest at all on deposits 35 14 3 Inefficient and delay disbursement of loans especially 28 11 4 Undependable and unresponsive to customers needs 25 9.8 5 Very high entry requirements 20 7.8 6 Poor service 14 5.5 7 corruption and intrigue 12 4.7 8 Charges are much too high and too many 10 3.9 9 Selectiveness of clientele 8 3.1 10 Secretiveness about rules, procedures, and (even) intent 7 2.7 11 Too aggressive in collecting loans/closing idle bank accounts 6 2.4 12 Has no ATM/access to account restricted to specific branch 6 2.4 13 Too far from home or has no local presence 5 2 14 organization is poorly managed or unsafe for storing savings 4 1.6 15 Does not give loans 3 1.2 16 Unreasonable delays in transmitting/credit accounts 2 0.8
- 41. Page 41 Total 255 100 TABLE 3.7: HOUSEHOLD’S ASSESSMENT OF POOR SERVICE PROVIDERS Due to all these factors combined, most poor rural households resort to many primitive ways of saving, as discussed in the next section. But it was show earlier in the report that just 13.1 percent of the households had bank accounts (about nine percent of these through the head of household and 4.1 percent another member or members of the household). So, how do these many people who are without access to banking services managing their financial affairs? 3.4 CURRENT METHODS OF SAVING The survey looked at this matter and found the majority of poor households currently without bank account resort to storing their precious savings themselves at home (mentioned 35.6 percent of the time) in desperation or ignorance of the risks. However, because these savings are locked in a suitcase somewhere in the house (mentioned 22.7 percent of the times), or hidden under a mattress or buried beneath the floor, these precious resources risk being lost, stolen, or altogether put to unproductive and unplanned uses (Table 3.8). So much local liquidity is locked or kept out of circulation through these primitive instruments though. Kama huna akaunti yoyote ya benki kwa sasa je, unahifadhi vipi fedha zako? Means of saving N Percent 1 Hide in an undisclosed place within home 729 35.6 2 Keep in locked suitcase or wooden box along with clothes 465 22.7 3 Keep inside shirt or trouser pocket or wrapped in a corner of dress 163 8.0 4 Hide under mattress/pillow or bed 113 5.5 5 All spent on immediate needs 100 4.9 6 Hide in the cupboard or bed drawer 86 4.2 7 Dug up within or outside the house 83 4.1 8 Entrust with wife or another trusted person, mostly shop owner 72 3.5 9 Store in form of cereals grain 58 2.8 10 Place in tin, bottle, or inside a water pot 54 2.6 11 Reinvesting in business/farming activity 54 2.6 12 Store in form of cattle 40 2.0 13 Hide under the carpet/table top cloth 12 0.6 14 Hide in other place (cattle shed, inside granary, or holes dug up in the farm) 11 0.5 15 Hide inside the pages of a book 5 0.2 Total 2045 100
- 42. Page 42 Access to Finance Figure 17: Je, kwa sasa, kuna mtu yoyote au taasisi unayoidai ndio 25% hapana 75% TABLE 3.8: MEANS OF SAVING AMONG POOR HOUSEHOLDS WITHOUT CURRENT ACCESS Clearly, with the exception of about five percent of the population studied that lack adequate income for all their basic needs; there is a big segment of the poor rural households with a strong demand for savings. The actual saving varies significantly from household to household, but nearly half of the funds exceed Tshs 100,000, while the mean savings for all households surveyed was Tshs 54,980. The different ways in which the surveyed households currently save their fortunes, instead of the more efficient instruments from formal financial institutions, are next discussed in Chapter 4. 3.5 CURRENT ACCESS TO LOANS Compared to the number of households with bank accounts, there seems to be slightly more families with access to credit, i.e., 19.3 percent (Figure 16) against 13.1 percent. In reality, however, the fact is that much of the lending reported by the households is by informal sources. For instance, nearly one in every four of the surveyed heads of households (24.5%) was as at the time of survey owed or owing some informal credit to another person or several persons (Figure 17). Figure 16: Je, una dani kutoka kwa mtu au taasisi yoyote kwa sasa? ndio 19% hapana 81%
- 43. Page 43 Similarly, nearly one in every five of the poor rural households (19.3 percent) had a current loan. The fact that nearly 90 percent of the rural households have provided credit to at least four people within the last 12 months prior to the survey (Figure 17), and that nearly one third (26.3 percent) reported having a current loan from more than one source (Table 3.9), shows just how widespread informal lending is amongst the population group. Je, ni watu au taasisi ngapi unazozidai? # credits supplied by households N Percent Cumulative Percent 1 279 47.4 47.4 2 127 21.6 69 3 71 12.1 81.1 4 34 5.8 86.9 5 26 4.4 91.3 6 13 2.2 93.5 7 8 1.4 94.9 8 3 0.5 95.4 9 1 0.2 95.6 10 14 2.4 98 > 10 12 2 100 Total 588 100 TABLE 3.9 (A): NUMBER OF CURRENT CREDITS TO POOR RURAL HOUSEHOLDS Je, ni watu au taasisi ngapi zinazokudai? N Percent Cumulative Percent # active loans 1 345 73.6 73.6 2 85 18.1 91.7 3 23 4.9 96.6 4 11 2.3 98.9 > 4 5 1.1 100 Total 469 100
- 44. Page 44 Access to Finance TABLE 3.9 (B): NUMBER OF CURRENT LOANS TO POOR RURAL HOUSEHOLDS The fact that there are as many poor rural households providing as well as receiving informal credit is clearly evident from the current sources of credits to the households (Table 3.10). Source of credit N Percent Family and friends 372 80.2 SACCOS 28 6.0 Not disclosed 19 4.1 NMB Bank 9 1.9 NGOs 15 3.2 Supplier credit 7 1.5 Serikali ya mtaa 7 1.5 Upatu 4 0.9 Other 2 0.4 Employer 1 0.2 Total 464 100 TABLE 3.10: CURRENT SOURCES OF CREDIT TO POOR RURAL HOUSEHOLDS Table 3.10 shows that 80.2 percent of the current loans to poor rural households in surveyed areas are informal, from friends and relatives. It also shows a complete reversal of roles whereby the banks, which were providing more access to banking services to the poor rural households than SACCOS, are now almost the least important in the provision of loans, i.e., the latter providing about six percent of the current loans while the banks well under two percent. It is noteworthy that local governments are also playing an active role in credit provision (accounting for 1.5 percent of the current loans held by the poor rural households), while employers play the least role (providing 0.2 percent). Furthermore, the fact that current loan amounts are generally small; with up to nearly 70 percent of the amounts owing being within Tshs 50,000 (Figure 6), also underscores the predominance of informal sources in lending to poor rural households rather than the more established financial intermediaries. What is perhaps more significant is that a fairly large number of the informal credits (nearly one in every five or 20 percent) are also quite sizeable, above Tshs 100,000), with about as high as 4.4 percent being above Tshs 400,000.
- 45. Page 45 Figure 18: Size Distribution of Informal Credits 23% 30% 30% 13% 4% Tshs below 10,000 Between Tshs 10,000 to Tshs 50,000 Between Tshs 50,000 to Tshs 100,000 Between Tshs 101,000 to Tshs 400,000 Above Tshs 400,000 Figure 19: Obstaclesto Credit 0 5 10 15 20 25 30 35 complicated application process,too highinterest, nottrusted enough lacked collateral/guara ntor loanstargeted tospecific individuals nocash nofeedbackon applicationfrom provider unreasonable terms/condition stoo demanding Obstacle PercentofMentionsby Households In addition to the nearly 20 percent of the households currently with loans as at the time of survey, another 14.3 percent had tried to obtain credit within the last 12 months of survey but failed to obtain any due to many factors (Figure 19). A leading obstacle to loans is what the poor rural households consider to be too demanding terms and conditions, which they find hard to fulfill (27 percent). Other hindrances to access include not knowing the requirements or procedures to follow to get what they want (22 percent), being perceived unfairly as not having the ability to repay (19 percent), and being treated unfairly in assessment and demand for collateral (13 percent). 3.6 CONCLUSIONS This survey has shown low access to finance by the poor rural households in the central corridor where RLDC is involved in development activities. Firstly, the number of households currently with access to existing financial intermediaries in their districts is approximately 170,926 out of the 1.4 million households. In terms of access to bank
- 46. Page 46 Access to Finance accounts and loans, the corresponding number of households in surveyed areas is 128,194 and 270,633, respectively. However, if access to informal credit is excluded from this analysis, the number of poor rural households able to get loans they need on demand is perhaps at par with those currently banked as at the time of survey. In retrospect, there has hardly been much improvement in the access to finance situation for the poor rural households of central corridor; just as it has been in the rest of Tanzania for the last five years (Table 3.11). Overall Access Access status 1999/1992 2000/2001 RLDC Survey 1 Households with bank account 18 6.4 16.7 2 Households with bank loan 1.2 0.6 1.9 3 With an informal savings group 5.1 5.7 31.0 Rural 1 Has account 12.9 3.8 2 Has bank loan 0.5 0.4 3 Has Upatu/informal credits 3.6 4.1 Other urban 1 Has account 35 14.4 2 Has bank loan 2.6 1 3 Has Upatu/informal credits 10 10.3 Dar es Salaam 1 Has account 43.1 18.9 na 2 Has bank loan 6.7 1.1 na 3 Has Upatu/informal credits 12.4 13.1 na TABLE 3.11: COMPARATIVE ACCESS DATA; 1991/1992, 2000/2001, AND 2006 SURVEYS The fact that majority of poor rural households still depend on SACCOS, which are typically undercapitalized, for as much as 30 percent of current access to banking services and up to six percent of total access to credit, clearly indicates a kind of market failure that cannot be self-correcting. In contrast, the regulated financial institutions, which are the better capitalized and have greater organizational capacity and resource base, were all presently serving just slightly more than a half of the households with savings accounts, and well under two percent of current access to credit. Of all the rural financial intermediaries, the financial NGOs were the least liked due to their unpopular product design.
- 47. Page 47 Chapter4 BARRIERS TO ACCESS 4.1 FINANCIAL SERVICES INFRASTRUCTURE Of the four regions studied, Shinyanga had the most number of financial intermediaries (Table 4.1); instead of the usual number, it had all the four major banks (NBC, NMB, CRDB, and Tanzania Postal Bank) operating there –and as many as 82 SACCOS. This is probably due to its having many natural resources, including Diamonds, Gold, and also growing other major cash crops like Tobacco, and Cotton. Shinyanga also has more livestock than any other region of Tanzania. Provider Shinyanga Morogoro Singida Dodoma Total Total 99 81 54 101 335 SACCOS 82 75 46 89 262 NBC 5 7 3 3 18 NMB 4 5 1 3 13 Other 3 1 0 2 6 TASAF 1 1 2 1 5 CRDB 0 1 1 1 3 TPB 0 1 1 1 3 WVI 1 1 0 1 3 FINCA 1 1 0 0 2 PRIDE 1 0 0 0 1 SEDA 1 0 0 0 1 TABLE 4.1: FINANCIAL INSTITUTIONS MENTIONED BY HOUSEHOLDS In fact, Shinyanga is also the only region in the central corridor where nearly all major financial NGOs in Tanzania have a presence; for instance, FINCA Tanzania, PRIDE Tanzania, and SEDA, etc. Moreover, unlike the other regions, the four banks have more branches outside the regional town (and some in even smaller rural towns, e.g., Kiomboi (Table 4.2). Region Outreach Shareholding-member customers Below 100 100-250 251-500 Over 500 Total Dodoma 42 34 17 7 98 Morogoro 39 15 11 10 75 Singida 34 11 4 0 49 Shinyanga 26 10 4 2 42 Total 141 70 36 19 192
- 48. Page 48 Access to Finance TABLE 4.2: SIZE DISTRIBUTION OF SACCOS IN SURVEY AREAS Besides their regional geographical distribution within the corridor, one first unique aspect of the intermediaries is their rather limited outreach each individually. Secondly, many of the intermediaries are also inactive. Thus, while the overall number of intermediaries within the corridor looks numerous, very few are active in all of the areas surveyed. Yet another unique aspect of intermediaries in the four regions is their domination by savings and credit cooperatives, i.e., in absolute number, proximity to the poor rural households, and the overall percentage of population currently using the SACCOS vis-à-vis financial NGOs, banks, and non-bank financial institutions. In all, the SACCOS represent slightly more than 83 percent of all financial intermediaries in the regions (Table 4.1). Nonetheless, as already mentioned, many of the SACCOS are very small (53.4% served less than 100 customers, as of 31 December 2005, while under 10 percent served more than 500 customers each). Yet still another unique aspect of SACCOS in the regions in spite of their impressive numbers is their selective targeting and marketing; majority target either teachers or local government workers. Only a few trade or community-based intermediaries have emerged in the recent past to cater for a more diverse clientele consistent with the diversity of local communities’ livelihoods. In addition to their restriction of common bond definition, majority of the SACCOS also operate strictly within specific districts, thereby limiting access to finance within their own territory. The most severely excluded population from access to finance by existing intermediaries are also the more numerous, e.g., pastoralists, small-scale farmers, and the “wanabiashara”. 4.2 HOUSEHOLDS’ PERSPECTIVE ON BARRIERS Widening and deepening access to the poor rural households is a Herculean task, given the current narrow base of financial services infrastructure and the fact that nearly 97 percent of the households have no bank accounts. However, the greater constraint in expanding access is not just dearth of reliable and capable service providers, but also a huge cultural gap between the providers on the one hand and the target population itself on the other (Figure 20). About 33% of the households explain their reason for currently or never using any of the existing financial institutions within their district as their lack of adequate income. Nonetheless, excluding the 1.1 percent of households who feel financially adequate (and thus do not need any financial services), the number of poor rural
- 49. Page 49 Figure 20: Je, ni sababu gani zinakufanya usitumie taasisi za kifedha zilizopo katika wilaya hii? other (e.g., I fear defaulting, does not have a need, I am too old, etc) 5% products/ services are inappropriate 12% I do not know the benefits or available services 28% difficult conditions/ requirem ents 5% non exists/ is close enough 17% my income is too liitle 33% households currently excluded but only because they do not know enough about the benefits (28 percent), or providers being too far from their homes (17 percent), is huge. Then there are also those among the excluded who simply lack access because they do not have enough confidence in themselves ever being accepted or considered eligible by the existing intermediaries (17 percent). It seems therefore that the first option in improving greater access to finance for this population is, not just increasing the number of service providers available, but first eliminating the following inefficiencies of the existing financial system: Encouraging and supporting existing financial institutions to improve or add products more suitable to the needs of the poor households Educating the poor rural households about the existing financial institutions, various products that exists, and the benefits/potential benefits vis-à-vis costs of using these services Building the capacity of financial institutions within the rural communities or with the potential to extend services to rural communities with the technology and knowledge to serve poor rural households Mobilizing and encouraging the poor rural households to establish their own appropriate or effectively take advantage of the existing financial institutions to meet their financial needs
- 50. Page 50 Access to Finance Increasing and improving the quality of physical infrastructure available within the rural communities Creating new means and enhancing the existing livelihood systems of the poor rural households within the target areas 4.3 PROVIDER’S PERSPECTIVE ON BARRIERS This section is based on interviews with a random sample of 14 financial service providers concerning their own views on the current obstacles to poor rural households’ access to finance. From the providers’ own list of their current constraints (Table 4.2), lack of adequate capitalization (mentioned nearly 44 percent of the time and ranked most frequently in the first three priority list), is the leading obstacle to widening and deepening access to finance for the poor rural households. Obstacle Number (%) of times ranked in order Total times % o tota men Ranked 1 Ranked 2 Ranked 3 Ranked 4 Ranked 5 Ranked 6 Ranked 7 1 Lack of adequate capital 4 6 4 4 0 0 0 18 43.9 2 Lack of adequate communication system/transport problems 3 2 2 0 0 0 7 17.1 3 Low/poor awareness or limited knowledge about financial services, benefits, and institutions 2 0 2 1 0 0 5 12.2 4 Delays in remittance of loan deductions 2 1 0 0 0 0 3 7.3 5 Lack of fulltime staff/internal capacity 1 2 0 0 0 0 0 3 7.3 6 Loan arrears/delinquency 0 1 0 0 0 0 0 1 2.4 7 Limited service/product offerings (undiversified income base) 0 0 0 0 0 1 1 2 4.9 8 Low income base/poor savings by members 0 0 0 0 1 1 2 4.9 Total 12 12 8 4 1 2 2 41 100
- 51. Page 51 TABLE 4.2: CURRENT LEADING OBSTACLES TO GREATER OUTREACH Poor infrastructure and lack of basic communication equipment, including lack of permanent office premises and fulltime staff, is also a major obstacle to expanding access to the poor rural households (mentioned nearly 30 percent of the time). Other obstacles are the low/poor awareness or limited knowledge about financial services, related benefits, and how the financial institutions operate by the households themselves (mentioned 12.2 percent of the time; and ranked as the third overall constraint by providers). Another common and prominent constraint to expanding access to poor households is unjustified and unnecessarily long delays in remittance of monthly loan deductions and savings/share contributions by employers to the SACCOS, a problem mentioned nearly eight percent of the times and which also contributes significantly to the lack of adequate capital among the employee- based SACCOS especially. Understandably, the low-income base and poor savings habits of poor rural households is also perceived by the providers as a major constraint (mentioned nearly five percent of the time). All the constraints mentioned above by service providers are, in fact, almost identical to the ones identified in other surveys (Oketch, 2006; SEEP Network, 2006; and FINMARK, 2006), which also cite physical barriers and economic barriers, as well as perceived or real cultural barriers between the service providers on the one hand and the poor rural households on the other as constraining greater outreach. On the surface, these barriers would seem wide ranging and unrelated, but on closer scrutiny simply fold into a handful of deeply embedded underlying barriers, as discussed in the next section of report. 4.4 A DEEPER UNDERSTANDING OF OBSTACLES To begin with, while low incomes is a reality for many poor rural households (with the annual average from the survey at Tshs 465,563), this fact on its own is certainly not the primary cause of poor savings, low-participation in savings activities, or the general failure of financial intermediation at the local level. In this first regard, Oketch (2006) presents convincing evidence that distance and low incomes are not the primary obstacles either from the provider or consumer perspective. For instance, this recent publication shows the workings of a vicious circle which combines low or lack of confidence in the local financial intermediaries that is itself in turn primarily caused by historical failure of these institutions to provide services on demand (see Table 4.2 above). Indeed, Oketch notes how…
- 52. Page 52 Access to Finance …”the local financial intermediaries technically and financially assisted by CRDB Bank Limited to upgrade their capacity and meet members needs on demand were reaching four times more customers than the non-assisted intermediaries of same age and operating in similar environments”…In financial intermediation, they also attracted 5.2 times more deposits than the non-bank assisted intermediaries and disbursed 14.5 times more loans annually. More remarkably, the bank-assisted intermediaries had 9.5 times more assets than the non-bank assisted intermediaries, which definitely gives them a greater outreach capacity…, p.28. A more complete picture of this argument, also cited from the author, is based on real-life case experiences of 200 once un-employed youth in one of the regions covered by this RLDC survey (Shinyanga). Here, although once without income the youth are transformed into active savers through mobilization, education, and access to start-up capital by the then only local financial intermediary within Bukombe district. He notes exactly, thus: … Ushirombo SACCOS Limited is one of the fastest growing intermediaries in the Shinyanga area and even nationally in Tanzania. The history of this intermediary’s establishment in April 2006 goes back to the split of Kahama District into two districts, namely: Kahama and Bukombe districts in the late 1990s. Following the split of the original district into two, the newly established district emerged without any single financial institution left within its borders. But upon establishment, the intermediary immediately launched two products: a salary payment account into which the employees of a local government authority could receive their monthly salaries-this account could also entitle them to a personal consumer loan. The second loan product, which is of more direct interest for this publication, was one targeting poor young men without any assets of their own whatsoever, and were actually working for low-wages by riding bicycle taxis. Each day the rider would collect and return his/her allocated bicycle to the intermediary alongside a much better minimum daily take of Tshs 1,500 as part payment for the eventual ownership of the asset. With the help of CRDB Bank, the subject of Oketch’s 2006 publication, Ushirombo successfully mobilized the youth into smaller groups of five to access this product, (evidently using the solidarity group logic and process).
- 53. Page 53 Starting with 20 groups of five each, the intermediary provided every one a bicycle with a wholesale loan obtained from the bank. Each day, for six days a week—with the exception of Sundays when they retained all amount earned, each group pays in a minimum of Tshs 5,000 to the intermediary towards the future purchase and ownership of a bicycle. However, if any of the five group members fail to raise the Tshs 1,000 expected of each one, the other members help to raise the amount. If the same person does not raise the sum in three consecutive days, he automatically loses the bicycle allotted, together with any savings he may have accumulated towards its purchase. Each youth is able to payoff the bicycle and in addition accumulate Tshs 80,000 within 90 days. At this point, each youth not only owns an asset previously unavailable, but also would have accumulated enough savings to purchase shares in the intermediary and be able to access finance under the normal terms for shareholding customers... p.24. At once, this case example demonstrates how local financial intermediaries can easily overcome lack of adequate capital by simply crafting more suitable products, being able to provide services on demand, and especially that low-incomes need not be an obstacle to financial intermediation if both the consumer and provider share similar aspirations and decide to collaborate. An important point from this case experience is that even households without regular incomes can gradually build enough confidence to approach the closest providers for service, provided they get financial education about the benefits and encouraged to participate. The SEEP
- 54. Page 54 Access to Finance Network4 argues about why this lack of confidence among the poor rural households is not one to be underestimated: … what sets the organizations that have succeeded in reaching extremely poor households with access to finance apart from “mainstream” microfinance providers is that they offer non-financial services in addition to financial products … including education, skill training, and confidence building … p.3 Even when very poor people are not actively excluded from access to finance by a particular intermediary, they often opt out because of felt intimidation, wrongly believing that the services offered by such a provider is not suited to their needs or for people of their kind …living in absolute poverty for a prolonged time strongly affects people’s dignity and hope for the future, as well as their ability to take initiative and overcome stigma… and being dependent on highly unpredictable livelihood systems such as subsistence farming strongly discourage the very poor people from taking the slightest risks towards improving their current economic and social situation… p.3 In light of SEEP’s observation cited above, some of the households’ views on obstacles to access; for instance, factor 13 and 16 presented in Table 3.7, seems credible enough not to be ignored while designing a strategy for widening and deepening financial services for this target group. Hence, by simply educating the households more on how the various financial institutions actually operate, or about 4 The SEEP NETWORK, 2006, Microfinance and Non-Financial Services for Very Poor People: Digging deeper to find Keys to Success, Preliminary research, Poverty Outreach Working Group, October.
- 55. Page 55 available services and benefits, it is possible to encourage greater access without undertaking major investments. However, since lack of adequate capital is one of the primary constraints to better and more reliable incomes in the four regions covered by the survey, it seems that finding creative means of making access to finance possible to this poor rural population is the first logical step towards building their confidence in these institutions. On a point of fact emerging from the survey, at Tshs 101,239 and Tshs 105, 712 respectively; mean annual savings for both male and female respondents in the rural areas were considerable vis-à-vis Tanzania’s per capita incomes, while the urban female and male respondents had even much higher accumulated savings, at Tshs 410,982 and Tshs 206,140. What this finding underscores is the underlying spirit of thrift that could easily blossom once the right opportunity and encouragement is introduced—as demonstrated in the case of intermediaries being assisted by CRDB Bank. Next we return to examine the scarcity of suitable financial intermediaries in the four survey areas, as in the rest of Tanzania countrywide, as major obstacle to expanding access to the poor rural households. There is no doubt that poor infrastructure and lack of basic facilities and communication system is a factor in this regard. As noted by Oketch (2006): … Poor infrastructure: like many other parts of rural Tanzania, Bukombe district does not have good infrastructure facilities despite the Isaka-Benaco highway passing through the district. Besides the highway, there are no other good roads. Similarly, access to telecommunications facilities is also very problematic; in case of need to make a phone call, and if one has no mobile phone handset, she/he has to go all the way to Geita, some 250 kilometers away to do so, at very high cost. Because of these three constraints, however, residents have had to travel all the way to Kahama, the administrative center of adjacent district where there are bank branches, to access financial services, obviously at a high cost in terms of money, time, and their personal security... p.46. The nature of economic activities: In the district, the vast majority of residents are farmers engaged in cotton, paddy, potatoes, and maize production. For this reason, business cycles are highly seasonal and involve few small and medium-sized firms. This makes the district unattractive to the big financial institutions to establish themselves there.
- 56. Page 56 Access to Finance Lack of power: up to now, Bukombe district is one of the few areas without power, yet the technological advancements make access to power essential to the business. Hence, lack of electricity is one of the hindrances for the financial institutions, especially commercial banks, to open up business in the District. Thus, a last re-examination of the true obstacles to greater outreach of the rural population lies deeply neither with the reputedly high costs of delivering such services nor with the risks of serving this group††. Again, the first evidence that undermines these long-held and highly popular excuses for limited outreach of poor rural households is well argued by SEEP (2006) and Oketch (2006). Firstly, through many emerging microfinance methodologies; like the CRDB wholesale model, the costs of serving very poor rural households can be greatly reduced—as has indeed happened in the last decade (see Table 4.3 below). Even in Africa where poor infrastructure, a widely dispersed population, and bad communication systems or lack of basic facilities had made serving this group prohibitive, there are powerful institutional and technological innovations that increasing push the cost frontiers. 4.5 OPPORTUNITIES FOR GREATER ACCESS 4.5.1 The Institutional side Although distance and poor infrastructure remains a formidable obstacle to greater access to finance for poor rural households in the four central corridor regions targeted by RLDC, many opportunities to improving the situation exists. The first of these chances would seem to rest on the upgrading the capacity and supporting deserving savings and credit cooperative societies to becoming more credible intermediaries in the eyes of the general population. Banks such as CRDB Bank in Tanzania (who have adopted a similar strategy for promoting greater outreach) are demonstrating the kind of transformation and scale achievable by these more numerous but modest institutions if assisted. As illustrated in the experiences of this bank (Oketch, 2006; FAO, 2005), greater numbers of the poor rural households can build the trust and gain their confidence in using these intermediaries, once they are able to deliver services on demand and become adequately accountable. Yet, this is a costly process that requires a committed facilitator (very much like RLDC) to start off. Therefore, in the foreseeable feature, while the physical constraints remain unchanged, it is the chance of transforming these smaller –but conveniently located financial intermediaries that are likely to expand outreach in areas like the ones
- 57. Page 57 targeted by RLDC. Accordingly, a primary conclusion of this survey is that collaborating with these SACCOS that RLDC should adopt and promote. 4.5.2 The consumer side‡‡ On the demand side, there is not only a gap in the supply of services, but also a huge financially excluded population desiring some urgent solution. The first evidence for this conclusion is the large numbers of poor households seeking credit in the last 12 months of survey but failing to get any access. A more direct evidence for this conclusion is, however, the number of households that if given the chance would readily borrow funds to realize one or another of their immediate financial needs; a whole 98 percent of surveyed households. For instance, with the exception of a few, most of the households participating in the RLDC survey has exact ideas of investing funds immediately if these were somehow available (Table 4.4). Application of loan Mentions Percent Expand/modernize farming 934 28.7 Start a new business 741 22.7 Build a house 435 13.3 Expand existing enterprise 406 12.5 Buy cattle 212 6.5 Capital investment 176 5.4 Invest in own/children's education 99 3.0 Purchase land 78 2.4 Meet basic needs 75 2.3 Save 28 0.9 Invest somehow 21 0.6 Purchase Household appliances and furniture 17 0.5 Buy bicycle or motorbike 12 0.4 Hire farm labour 8 0.2 Plant trees 5 0.2 Introduce irrigation farming 5 0.2 Buy iron sheet for roofing 3 0.1 Buy fishnet 2 0.1 Other 2 0.1 Total 3259 100 TABLE 4.4: IMMEDIATE AND LONG TERM HOUSEHOLDS INVESTMENT PLANS But this critically needed access is lacking, thereby crippling innovation, expansion, and growth in rural livelihoods.
- 58. Page 58 Access to Finance As shown in table, it is significant that the first three investment priorities of the households if they had better access to finance would be investing in measures enhancing their current livelihoods; nearly 29 percent to modernize or expand current agricultural activities, about 23 percent to start up new micro/small-scale enterprises in diversifying their current income bases, and a similar number to expand their existing businesses. Another relatively significant number (13.4 percent) of the poor households would build a better family house if they could successfully raise the funds. Altogether, as shown in Table 4.4, well under four percent of the poor rural households are so deprived that if they had a chance of getting borrowed funds would instead first use it to meet their basic needs, or not know how to invest it wisely. TABLE 14: LOAN AMOUNT FOR IMMEDIATE INVESTMENT BY HOUSEHOLDS A closer look at Table 14 also reveals a greater diversity in the credit needs among the rural households; these range from production to consumption and from consumption to leisurely financial requirements. This diversity in financial needs is even clearer by looking at the various amounts of loans that households would have liked to borrow given the chance (Table 14). 4.6 BRIDGING THE DIVIDE The next and last chapter of this report explores the exact measures that RLDC can implement to help in improving the poor rural households’ access to finance. These proposed strategies are premised on RLDC remaining a facilitator, rather than a director provider of services, and also that the target population would be actively involved in building the basic financial services infrastructure itself. Kwa dhumuni hilo uliolitaja; je, ni kiasi gani cha pesa ungehitaji? N 2,273 Mean 2,715,193 Sum 6,171,634,540 Std. Deviation 63,673,586 Median 400,000