Download as PDF, PPTX


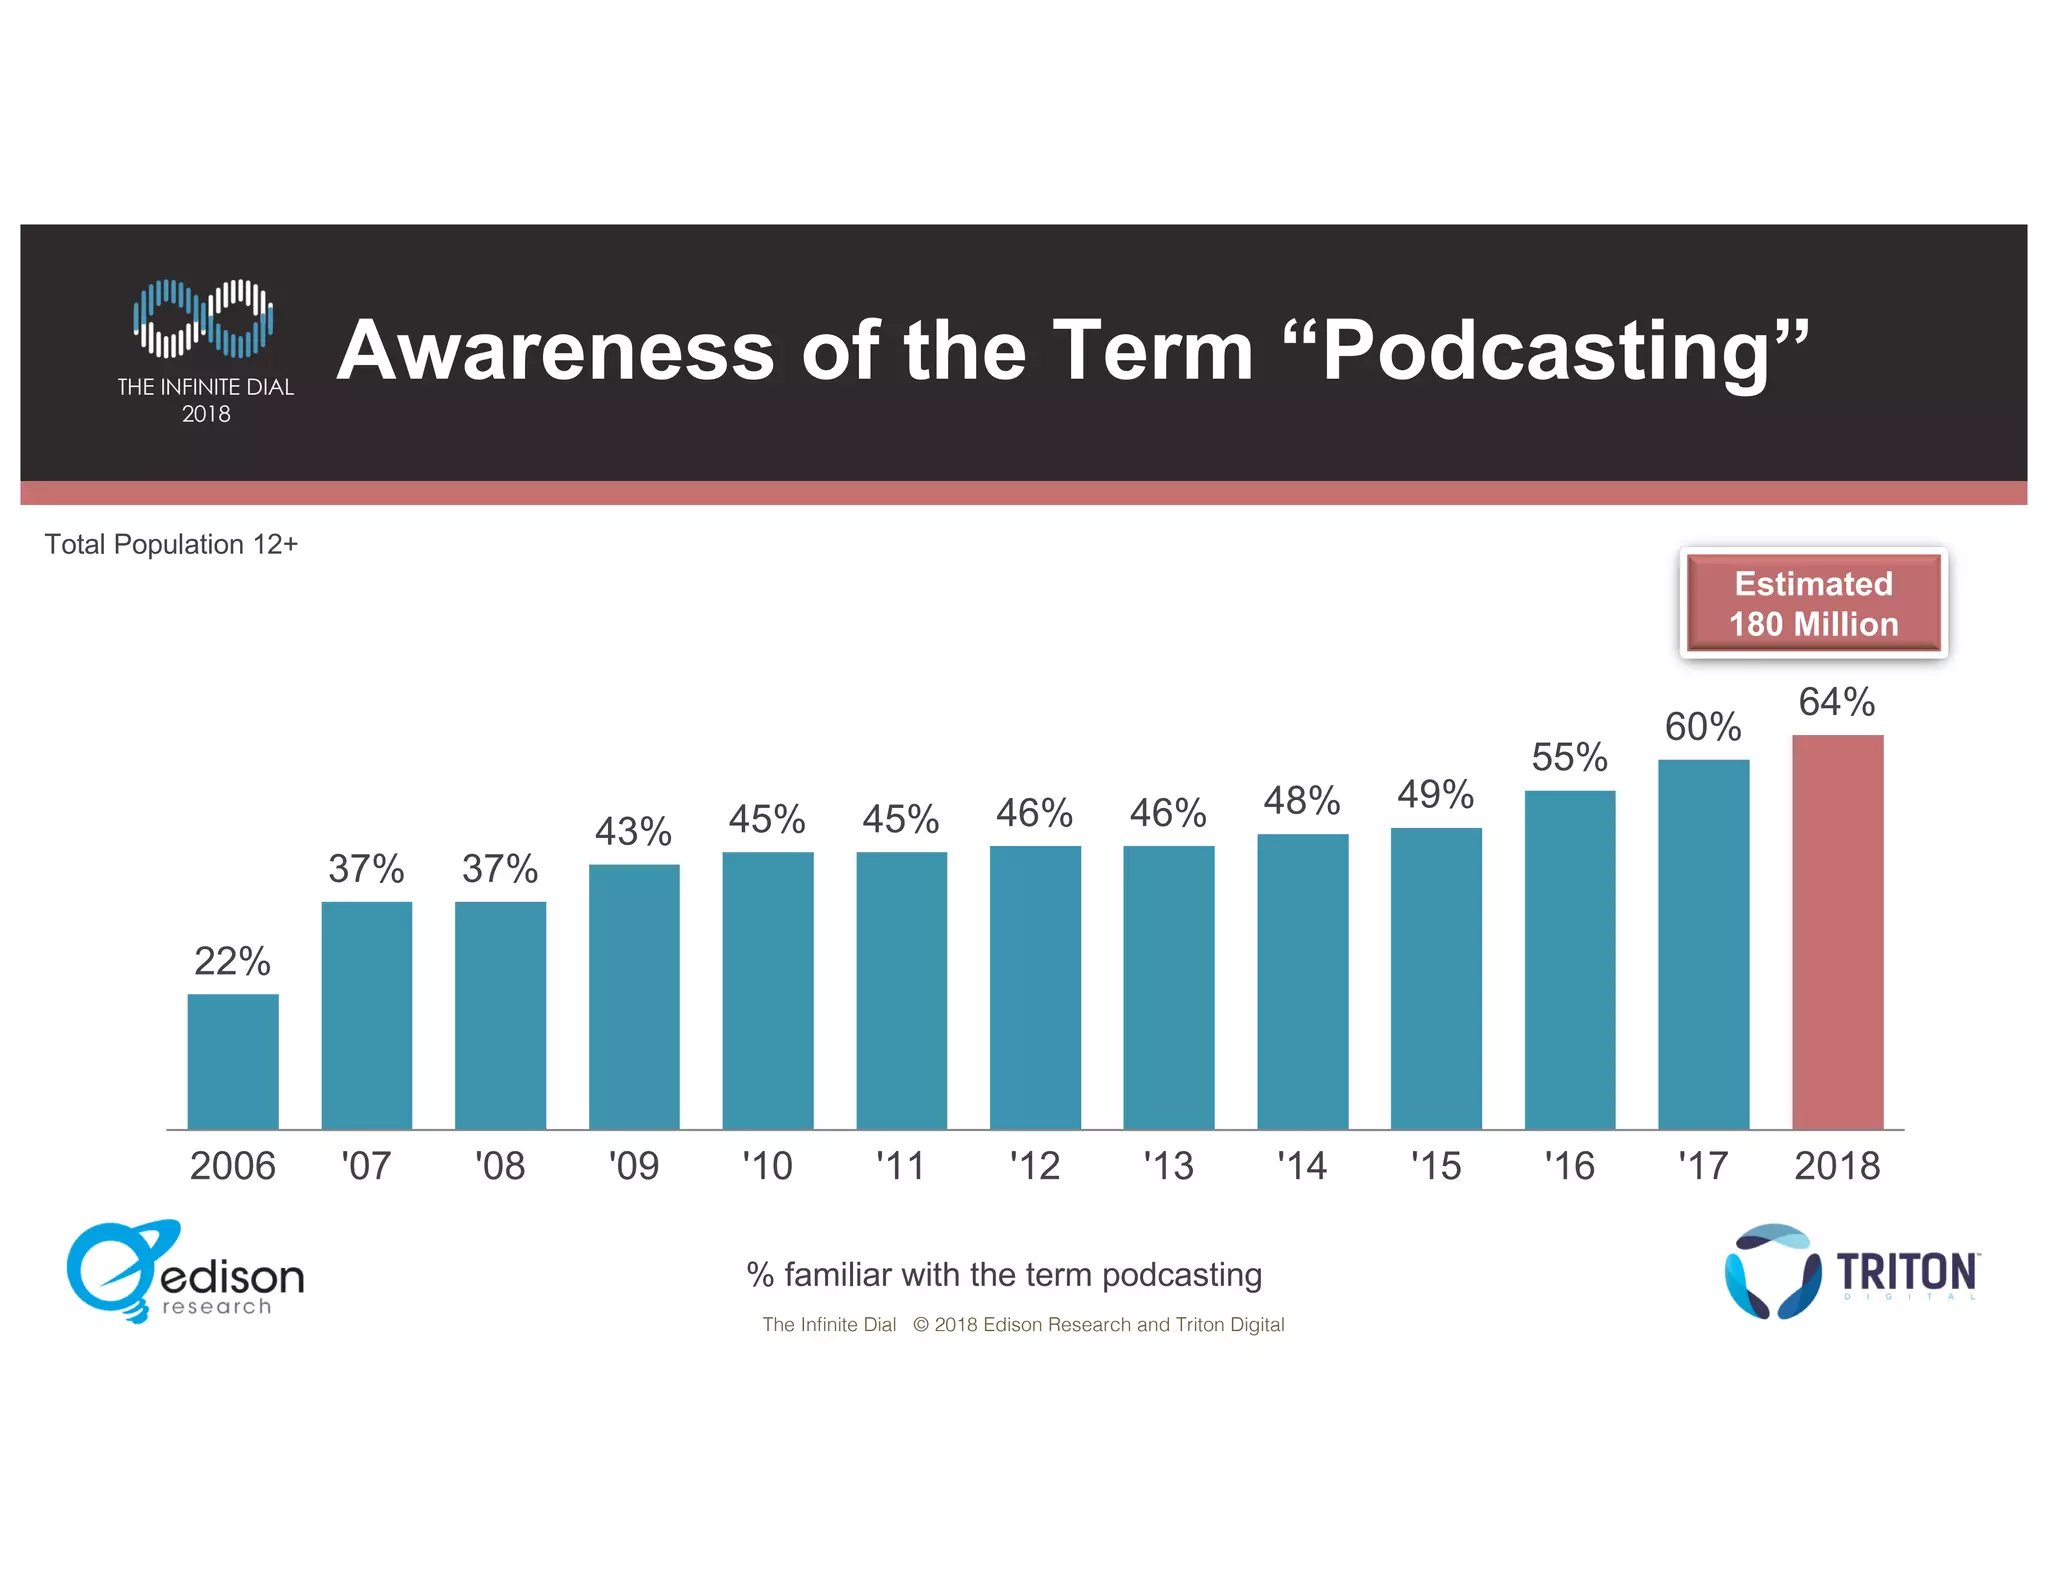


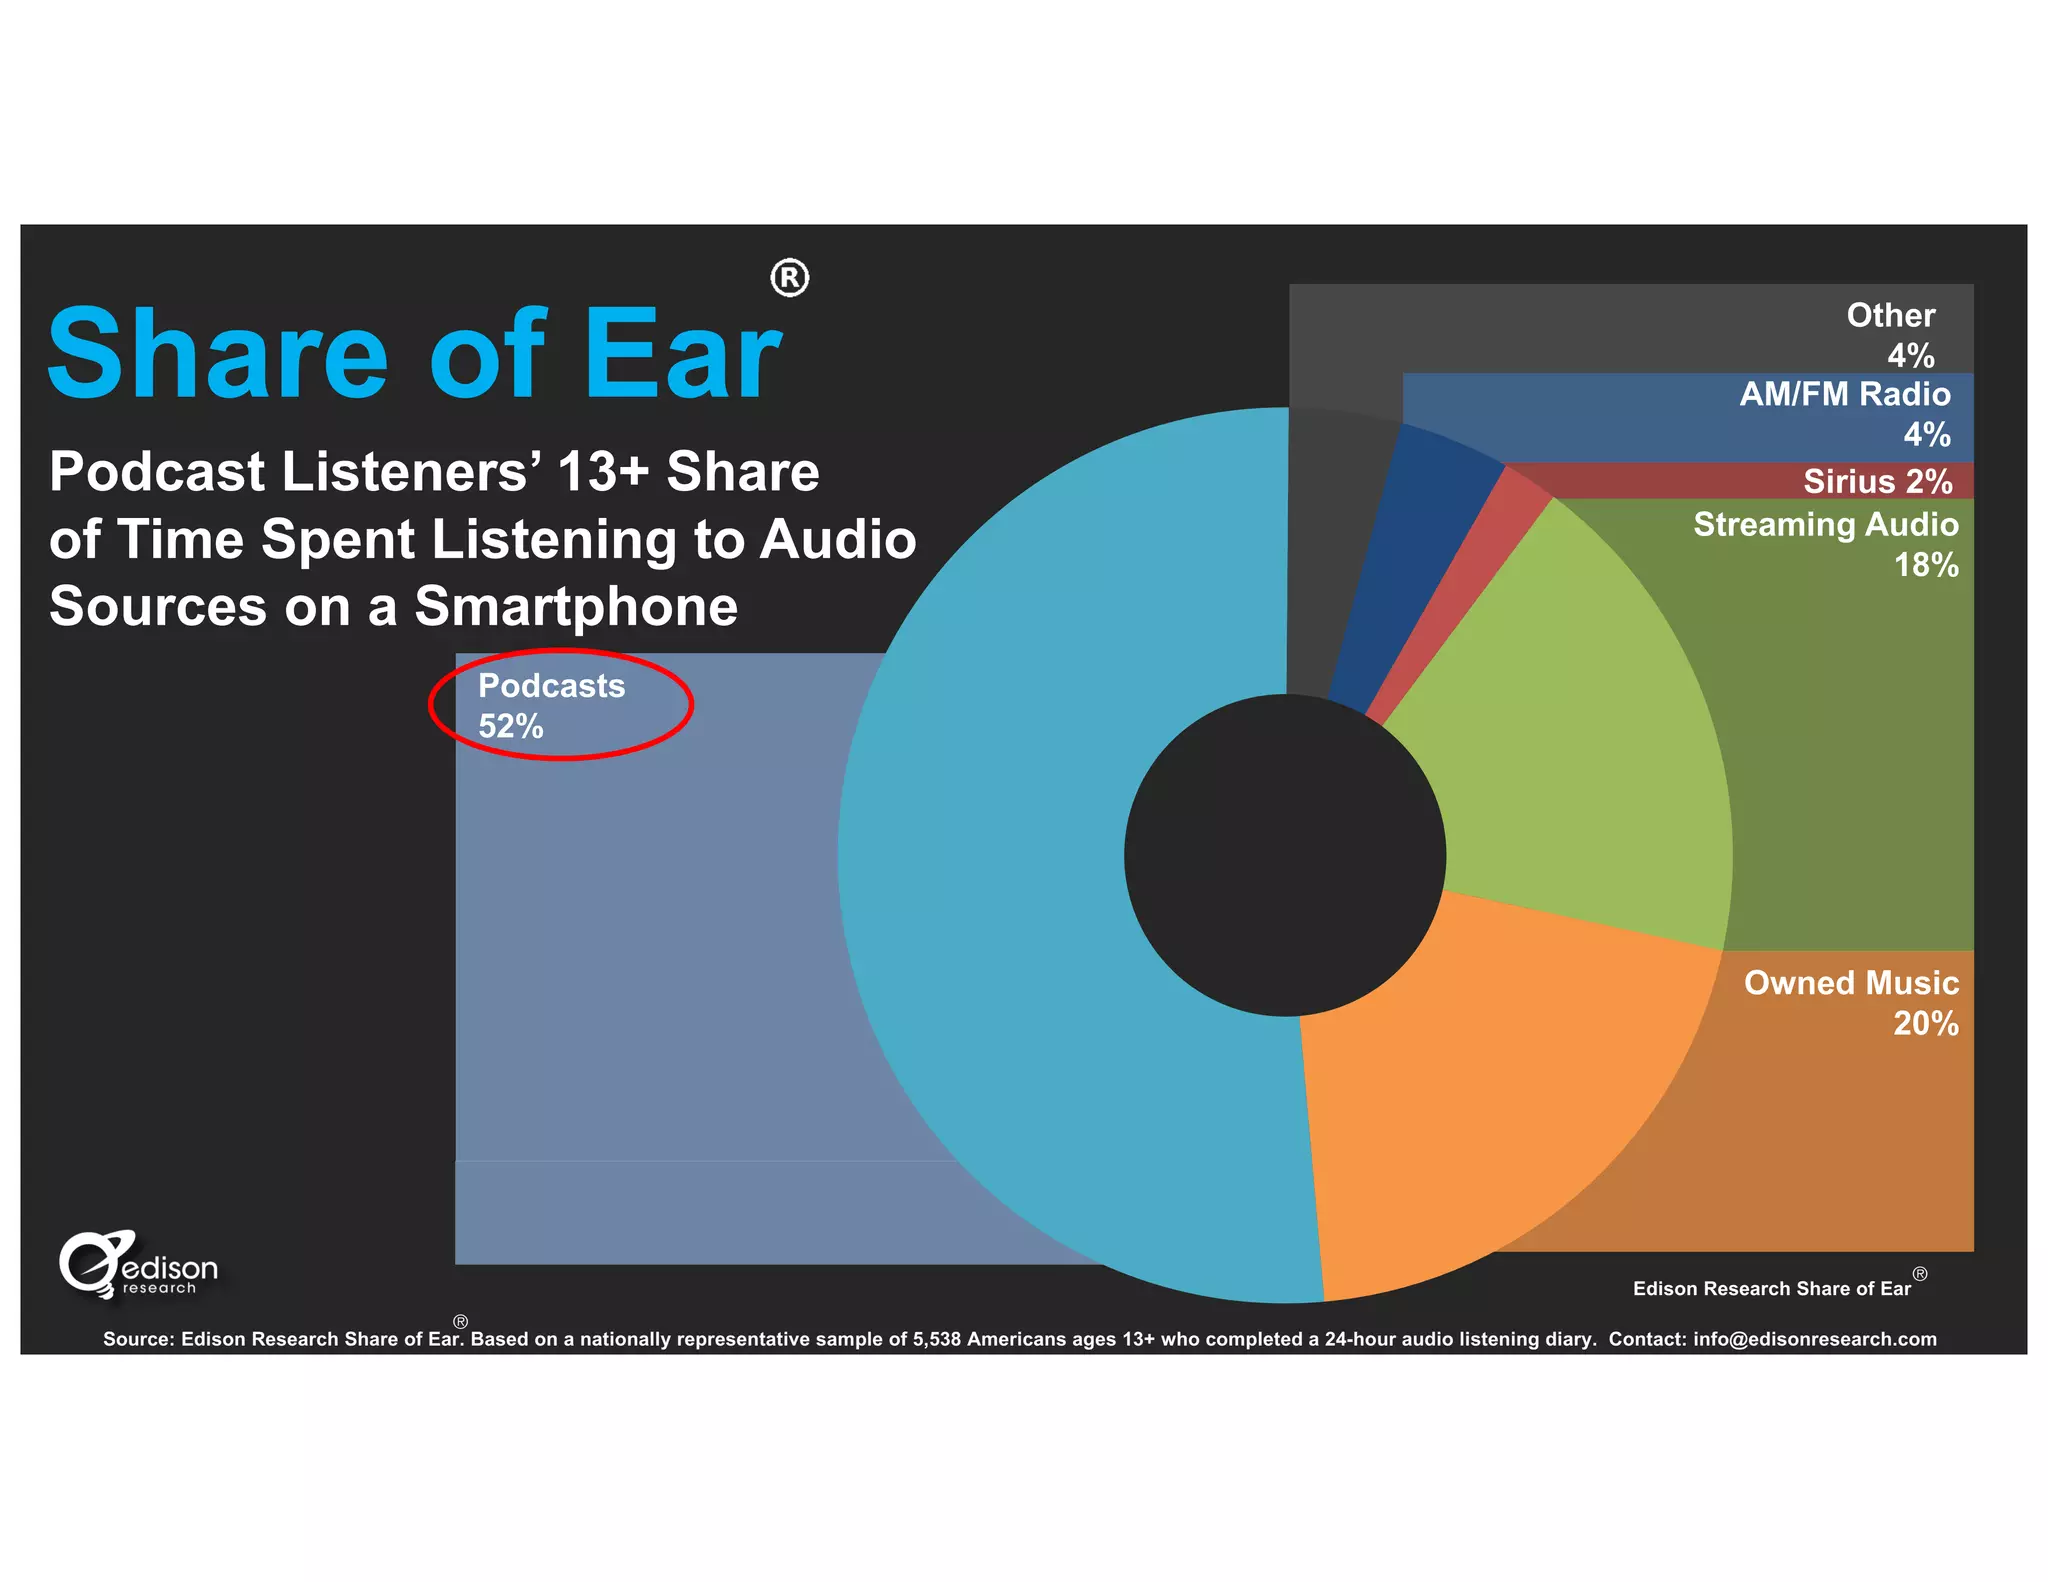


The Infinite Dial 2018 report by Edison Research and Triton Digital presents key findings from a national survey of 2,000 Americans aged 12 and older regarding podcast consumption and audio listening habits. Key statistics include that 40% of individuals are familiar with podcasting, 24% have listened to podcasts, and 11% are weekly podcast listeners. The report also explores demographics, such as age and income distribution of podcast consumers, as well as listening devices and behaviors.


