Nanostructured fe2 o3 platform for the electrochemical sensing of folic acid
1. Analyst
View Article Online
PAPER View Journal | View Issue
Nanostructured a-Fe2O3 platform for the
electrochemical sensing of folic acid†
Cite this: Analyst, 2013, 138, 1779
Thandavarayan Maiyalagan,‡a J. Sundaramurthy,‡bc P. Suresh Kumar,bc
Palanisamy Kannan,*d Marcin Opallo*d and Seeram Ramakrishna*bc
Published on 31 January 2013 on http://pubs.rsc.org | doi:10.1039/C3AN00070B
a-Fe2O3 nanofibers are synthesized by a simple and efficient electrospinning method and the selective
Downloaded by University of Texas Libraries on 22 February 2013
determination of folic acid (FA) is demonstrated in the presence of an important physiological
interferent, ascorbic acid (AA), using the a-Fe2O3 nanofiber modified glassy carbon (GC) electrode at
physiological pH. Bare GC electrode fails to determine the concentration of FA in the presence of a
higher concentration of AA due to the surface fouling caused by the oxidized products of AA and FA.
However, modification with a-Fe2O3 nanofibers not only separates the voltammetric signals of AA and
FA by 420 mV between AA and FA, but also enhances higher oxidation current. The amperometric
current response is linearly dependent on FA concentration in the range of 60–60 000 nM, and the
a-Fe2O3 nanofiber modified electrode displayed an excellent sensitivity for FA detection with an
Received 24th November 2012
Accepted 17th January 2013
experimental detection limit of 60 nM (1.12 Â 10À10 M (S/N ¼ 3)). Furthermore, the a-Fe2O3 nanofiber
modified electrode showed an admirable selectivity towards the determination of FA even in the
DOI: 10.1039/c3an00070b
presence of a 1000-fold excess of AA and other common interferents. This modified electrode has been
www.rsc.org/analyst successfully applied for determination of FA in human blood serum samples.
1 Introduction nanostructures can be used for both efficient transport of elec-
trons and optical excitation, and these two factors make them
In recent years, the synthesis and fabrication of nanomaterials critical to the function and integration of nanoscale devices, and
with tailoring their size, morphology, and porosity have been have been the focus of intensive research for many potential
intensively pursued not only for fundamental scientic interest applications in electronics, photonics, drug delivery, medical
but also for many technological applications.1–3 Nanoparticles diagnostics, and magnetic materials.8–11
(zero-dimensional (0-D)) and nanowires/nanorods (one-dimen- Hematite (a-Fe2O3) is the most stable iron oxide with n-type
sional (1-D)) with controlled size and shape are of key importance semiconducting properties (Eg ¼ 2.2 eV) under ambient condi-
because their electrical, optical, and magnetic properties are tions. It has been intensively investigated because of its wide
strongly dependent on their size and shape.1–3 Currently, one- applications in catalysts, pigments, magnetic materials, gas
dimensional (1-D) nanomaterials such as silicon nanowires sensors, and lithium ion batteries.4,12–15 Fe2O3 was generally
(SiNWs), carbon nanotubes (CNTs), and conducting polymer considered to be biologically and electrochemically inert, and its
nanowires (CP NWs) have opened the possibility to fabricate electrocatalytic functionality has been rarely realized directly in
electrochemical sensors and biosensors.4–7 Their high sensitivity the past,16 whereas Fe2+ ions (instead of Fe3+) play the dominant
and new sensing mechanisms are related to intrinsic properties role in the oxidation reaction.17–19 Meanwhile, Fe2O3 was also
associated with a high surface-to-volume ratio.4–7 Further, 1-D demonstrated to show both reversible reduction and reversible
oxidation of Fe(III) in a basic carbonate buffer solution.17 Never-
a
School of Chemical and Biomedical Engineering, Nanyang Technological University, theless, in contrast with interests focusing on synthetic and
62 Nanyang Drive, Singapore, 637459s catalytic applications of Fe3O4, reports on the electrochemical
b
Centre for Nanobers and Nanotechnology, National University of Singapore, characterization of Fe2O3 nanoparticles are rather rare, and little
Singapore 117576. E-mail: seeram@nus.edu.sg; Fax: +65-6872 5563; Tel: +65-6516
attention has been paid to the detailed study of their sensing
6593
c
Department of Mechanical Engineering, National University of Singapore, Singapore
performance.20–22 In principle, Fe2O3 nanoparticles may effi-
117576 ciently mediate the nal heterogeneous chemical oxidation or
d
Institute of Physical Chemistry, Polish Academy of Sciences, 44/52 ul. Kasprzaka, 01- reduction of the target agent, while the converted iron oxides can
224 Warszawa, Poland. E-mail: ktpkannan@gmail.com; mopallo@ichf.edu.pl; Tel: be continuously and simultaneously recovered by electro-
+48-223 433 375. Fax: +48-223 433 333 chemical oxidation or reduction due to their high surface to
† Electronic supplementary information (ESI) available. See DOI:
volume ratio. From this key point, an electrocatalytic study of
10.1039/c3an00070b
nanostructured Fe2O3 in biocompatible environments may not
‡ Both authors contributed equally to this work.
This journal is ª The Royal Society of Chemistry 2013 Analyst, 2013, 138, 1779–1786 | 1779
2. View Article Online
Analyst Paper
only be of scientic interest, but could also produce real benets (FA), were purchased from Merck chemicals and were used as
such as their substitution for noble metals/enzymes for practical received. All other chemicals used in this investigation were of
enzyme-free biosensor applications. Due to its low cost, good analytical grade. The phosphate buffer solution (PBS; pH ¼ 7.2)
stability, and reversibility, a-Fe2O3 has been proven to be an was prepared using Na2HPO4 and NaH2PO4. Double distilled
important semiconductor nanomaterial for electrochemical water was used to prepare the solutions in this investigation.
sensors.23 However, so far, there have been only a few reports on
bio-sensing properties of 1-D nanostructural a-Fe2O3. Generally, 2.2 Preparation of a-Fe2O3 nanobers
the properties of a biosensor are strongly dependent on its Firstly, 1 g of PVP was dissolved in 10 mL of ethanol solution
surface area. The relatively low surface to volume ratio of and homogeneously stirred at room temperature for 1 h for
conventional bulk a-Fe2O3 materials leads to their poor bio- complete dissolution. Then, 0.4 g of Fe(acac)3 precursor was
sensing properties. Hence, developing 1-D nanostructure a-Fe2O3 added to the PVP solution and continuously stirred for 6 h
with a high surface area is very important for increasing their followed by addition of 1 mL acetic acid. Finally, 5 mL of
applications in sensors.4,14 Recently, as prepared a-Fe2O3 nano- Fe(acac)3–PVP precursor solutions were loaded in a 5 mL plastic
Published on 31 January 2013 on http://pubs.rsc.org | doi:10.1039/C3AN00070B
material has been proven to be a successful electrode material syringe with a hypodermic needle (dia. 27 G). The hypodermic
due to the intrinsic peroxidase-like catalytic activity.24 The needle was then connected to a high-voltage supply capable of
a-Fe2O3 nanowire array modied glucose sensor exhibited an
Downloaded by University of Texas Libraries on 22 February 2013
generating direct current (DC) voltages up to 30 kV. Electro-
excellent biocatalytic performance towards the oxidation of spinning was carried out by applying a power supply of around
glucose with a detection limit of 6 mM (S/N ¼ 3).24 In the present 16.5 kV at the needle in a controlled electrospinning set-up
study, we have synthesized a-Fe2O3 nanober by a simple elec- (Electrospunra, Singapore). Aluminum foil was used as the
trospinning method and used it to improve the bio-sensing counter electrode, and the distance between the needle and the
performance towards the oxidation of FA for the rst time. collector was maintained at 15 cm. The as-spun Fe(acac)3–PVP
Folic acid, known as a widely used water soluble vitamin, is composite nanober mats were placed in an advanced vacuum
reported to be a very signicant component for human health oven at room temperature for 12 h to remove the solvent
which relates to a series of diseases such as gigantocytic anemia, residuals. Finally, the nanobers were calcined at 500 C for 5 h
leucopoenia, mental devolution, heart attack and congenital in air at a heating rate of 5 C minÀ1, and nally a-Fe2O3
malformation.25–28 FA is one of the important coenzymes of the nanobers were obtained and stored carefully.
haematopoietic system that controls the generation of ferro-
haeme.28 The dosage of FA is associated with the treatments of 2.3 Instrumentation
hyperhomocysteinemic coronary artery disease, hypertension,
depression, hypercholesterolemia, mammary tumor, vascular The crystallographic information of the prepared a-Fe2O3
disease and neural tube defects of pregnant women.29–33 The nanobers was studied using the powder X-ray diffraction
important biomolecules such as AA and FA are present in human technique (XRD, Shimadzu XRD-6000, Cu Ka radiation oper-
blood plasma,34,35 urine36,37 and blood serum samples.38,39 Since ating at 30 kV/40 mA). The surface morphologies of the nano-
these biomolecules coexist in human uids, their simultaneous structures were characterized using a eld emission-scanning
determination is essential to secure the human health from the electron microscope (FE-SEM) JEOL JSM-6301F. Transmission
above critical diseases risk. Therefore, the selective and sensitive electron microscopy (TEM), JEM-2010, JEOL USA Inc., was
determination of FA is very important from the clinical and employed to study the surface morphology of a-Fe2O3 nano-
health viewpoints. In this paper, we will show that the a-Fe2O3 bers. The electron beam accelerating voltage of the microscope
nanober modied GC electrode exhibits an excellent electro- was at 200 kV. Electrochemical measurements were performed
catalytic activity towards FA, and a detection limit of 60 nM FA in a conventional two compartment three electrode cell with a
has been achieved using the amperometry method. The a-Fe2O3 mirror polished 3 mm glassy carbon (GC) as the working elec-
nanober array on the GC electrode with a nano-size and coarse trode, Pt wire as the counter electrode and a NaCl saturated
surface provides a platform for FA oxidation by contributing both Ag/AgCl as the reference electrode. The electrochemical
excess electroactive sites and strong adhesion to the GC electrode measurements were carried out with a CHI Model 660C (Austin,
surface, which results in the enhanced sensitivity and long term TX, USA) electrochemical workstation. In cyclic voltammetry,
stability of the a-Fe2O3 electrode. The application of the Fe2O3 the electrochemical oxidations of AA and FA were carried out at
modied electrode has been successfully demonstrated by a scan rate 50 mV sÀ1. Pulse width ¼ 0.06 s, amplitude ¼ 0.05 V,
measuring the concentration of FA in real samples. sample period ¼ 0.02 s and pulse period ¼ 0.20 s were used in
differential pulse voltammetry (DPV). For chronoamperometric
measurements, pulse width ¼ 0.25 s and potential step ¼ 1 mV
2 Experimental section were used. All the electrochemical measurements were carried
2.1 Materials and methods out under a nitrogen atmosphere at room temperature (27 C).
Polyvinylpyrrolidone (PVP; MW ¼ 1 40 000) and iron(III) acety-
lacetonate (Fe(acac)3) were purchased from Sigma-Aldrich 2.4 a-Fe2O3 nanober modied electrodes
and Fluka, Singapore, respectively. Ethanol (HPLC grade) and The a-Fe2O3 nanostructure modied GC electrode was prepared
glacial acetic acid were purchased from Tedia, Singapore and as follows. First, the surface of the glassy carbon electrode
used as received. The biomolecules, uric acid (UA) and folic acid for each experiment was mechanically polished with 600 grit
1780 | Analyst, 2013, 138, 1779–1786 This journal is ª The Royal Society of Chemistry 2013
3. View Article Online
Paper Analyst
sand-paper and 0.050 mm alumina powders, which was then
rinsed with acetone and double distilled water. A 3 mL aliquot of
a-Fe2O3 nanobers (dispersed in water, 5 mg mLÀ1, and pH ¼
7.0) was dropped onto the surface and dried under atmospheric
conditions. In addition, a bulk-Fe2O3 electrode (denoted as
b-Fe2O3 GC electrode, fabricated by the above mentioned
process) was used for comparison.
3 Results and discussion
3.1 Characterization of the as-prepared a-Fe2O3
nanostructure
The morphology of as-electrospun Fe(acac)3–PVP composite
Published on 31 January 2013 on http://pubs.rsc.org | doi:10.1039/C3AN00070B
nanober before and aer calcination was investigated by per-
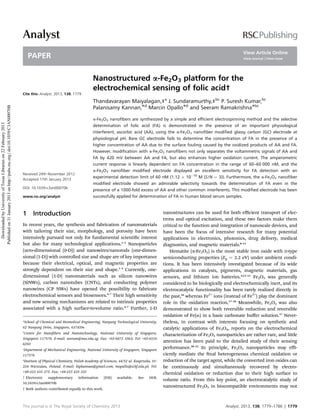
forming FESEM analysis. Fig. 1a shows the formation of a
highly interconnected network of nanobers with an average
Downloaded by University of Texas Libraries on 22 February 2013
Fig. 2 XRD pattern of Fe(acac)3–PVP nanofibers calcined at 500 C for 5 h at a
ber diameter of 288 nm. Fig. 1a (inset) shows the distribution heating rate of 5 C minÀ1 in air.
of bers upon applying a potential of 16.5 kV; the broad
distribution of the bers was due to the dominancy of
may also result in enhanced long-term stability due to a more
Coulombic repulsive forces upon applying such a higher
secure attachment to the electrode surface.
potential. The formation of nanobers was observed aer
Further, the XRD analysis on calcined nanobers has been
calcination of the Fe(acac)3–PVP composite at 500 C for 5 h at a
carried out to conrm the a-Fe2O3 phase formation. Fig. 2
rate of 5 C minÀ1 in air (Fig. 1b). The novel morphology of
shows the XRD pattern of a-Fe2O3 nanobers aer calcination
nanostructures with ellipsoidal shape of a-Fe2O3 nanoparticles
of the Fe(acac)3–PVP composite at 500 C for 5 h in air. All the
uniformly plaited along the ber directions was observed. This
diffraction peaks were well indexed to the rhombohedral
morphology was due to the combined effect of phase separation
hexagonal phase of hematite (a-Fe2O3) (JCPDS: 33-0664). The
(thermodynamic) and electrospinning (electro-hydrody-
strong and narrow-sharp diffraction peaks showed the purity
namic).40 The phase separation of the polymer and the
and high degree of crystallization of synthesized a-Fe2O3
precursor induced the formation of precursor islands, and the
nanobers.
electrospinning coerced the precursors to plait together with
the result of spinning and whirling effects upon applying
potential. During calcining, the polymer PVP present all over 3.2 Electrochemical oxidation of FA
the brous structure was decomposed and yielded nanorod-like We have examined the electrocatalytic activity of a-Fe2O3 GC, b-
structures. The nanobers have a coarse surface due to the Fe2O3 GC and unmodied GC electrodes towards the oxidation of
adsorption and assembly of small crystalline nanoparticles FA. We found that the a-Fe2O3 nanober modied GC electrode
(Fig. 2b; inset), some of which even have a chain-like showed higher electrocatalytic activity towards AA and FA than
morphology. In comparison with the randomly packed particle the b-Fe2O3 GC and unmodied GC electrodes. Fig. 3A shows the
counterpart, such arrayed nanowires provide more ordered cyclic voltammograms (CVs) obtained for 0.25 mM FA at bare and
spatial orientation and improved structural stability. As a result, a-Fe2O3 nanober modied GC electrodes in a 0.20 M phosphate
higher mass transfer and permeation rate, a stable porous
volume and less structural corruption can be expected during
the electrochemical recycling. In addition, the coarse surface
Fig. 3 (A) CVs obtained for 0.25 mM FA at bare and a-Fe2O3 nanofiber modified
GC electrodes after the 1st (a and d), 10th (b and e) and 20th (c and f) cycles in a
Fig. 1 (a) FE-SEM image of as-electrospun Fe(acac)3–PVP composite nanofibers 0.2 M PB solution at a scan rate of 50 mV sÀ1 and (g) CV obtained for the a-Fe2O3
at a power supply of 16.5 kV (inset: histogram of the nanofiber diameter and nanofiber modified GC electrode in the absence of 0.5 mM FA in a 0.2 M PB
distribution) and (b) FE-SEM image of a-Fe2O3 nanofibers after calcining solution. Inset: bulk-Fe2O3 modified GC electrode in the presence of 0.25 mM FA
composites at 500 C for 5 h at a ramp rate of 5 C minÀ1. in 0.2 M PB solution. (B) Anodic peak current vs. square root of scan rates.
This journal is ª The Royal Society of Chemistry 2013 Analyst, 2013, 138, 1779–1786 | 1781
4. View Article Online
Analyst Paper
buffer (PB) solution (pH ¼ 7.2). At the bare GC electrode, an fast electron transfer reaction of FA at the a-Fe2O3 nanober
oxidation peak was observed for FA at 0.95 V in the rst cycle modied GC electrode quantitatively, we have calculated the
(curve a). In the subsequent cycles, the FA oxidation peak was standard heterogeneous rate constant (ks) for FA at a-Fe2O3
shied to more positive potential with decreased peak current. nanobers and bare GC electrodes using the Velasco equation42
Aer 20 cycles, the oxidation peak of FA almost disappeared as given below:
(curve c), indicating that the bare GC electrode was not suitable
for the stable and simultaneous determination of FA. The ks ¼ 1.11Do1/2 (Ep À Ep/2)À1/2n1/2
adsorption of the oxidized product of FA on the electrode surface
is the possible reason for the decreased FA oxidation current and where, ks is the standard heterogeneous rate constant; Do is the
more positive peak shi in the oxidation potential at the bare GC apparent diffusion coefficient; Ep is the oxidation peak poten-
electrode. On the other hand, a well-dened oxidation peak was tial; Ep/2 is the half-wave oxidation peak potential and n is the
observed at 0.81 V for FA at the a-Fe2O3 nanober modied GC scan rate. In order to determine ks, it is necessary to nd the
electrode (curve d), which was a 140 mV less positive potential diffusion coefficient for FA. The apparent diffusion coefficient
Published on 31 January 2013 on http://pubs.rsc.org | doi:10.1039/C3AN00070B
than at the bare GC electrode. It can be seen from Fig. 3A that the (Do) value was determined using a single potential chro-
oxidation potential of FA remained stable even aer 20 repeated noamperometry technique based on the Cottrell slope obtained
by plotting current versus 1/Otime. Chronoamperometry
Downloaded by University of Texas Libraries on 22 February 2013
potential cycles (curve f), indicating that the oxidation of FA was
highly stable at the a-Fe2O3 nanober modied GC electrode. measurements were carried out for FA both at bare and a-Fe2O3
The a-Fe2O3 nanober modied GC electrode did not show any nanober modied GC electrodes aer 20 potential cycles. The
oxidation response in the absence of FA (curve g). These results Do of 1.98 Â 10À6 cm2 sÀ1 was obtained for FA. The estimated ks
indicated that the a-Fe2O3 nanobers are excellent candidates values for the oxidation of FA at bare and a-Fe2O3 nanober
toward the electrochemical oxidation of FA. modied GC electrodes were found to be 1.43 Â 10À5 cm sÀ1
For comparison, we have also modied the electrode with and 2.91 Â 10À4 cm sÀ1, respectively. The obtained higher ks
bulk Fe2O3 (b-Fe2O3 GC) as an electrocatalyst, and we observed value for FA at the a-Fe2O3 nanober modied GC electrode
that the electrochemical oxidation of FA is almost the same as indicated that the oxidation of FA was faster at the a-Fe2O3
the electrochemical response of the bare GC electrode (Fig. 3A; nanober modied GC electrode than at the bare GC electrode.
inset). Unlike bare GC and b-Fe2O3 modied GC electrodes, the Further, we have investigated whether the oxidation of FA at
FA oxidation peak is highly stable at the a-Fe2O3 nanober the a-Fe2O3 nanober modied GC electrode is due to diffusion
modied GC electrode. This indicated that a-Fe2O3 nanobers control or adsorbed species by varying the scan rates. The
effectively prevent the fouling caused by the oxidized products oxidation current of FA was increased while increasing the scan
of FA. The observed oxidation peak for FA in Fig. 3A is due to the rates (Fig. 3B). A good linearity between the anodic peak current
two electron oxidation of FA to dehydrofolic acid,41 as shown in and the square root of the scan rate was obtained within the range
Scheme 1. The oxidation process can be deduced through an from 100 to 1000 mV sÀ1 with a correlation coefficient of 0.995
electrocatalytic mechanism involving the Fe(III)/Fe(II) ion for FA, as shown in the inset of Fig. 3B. This indicated that the
centers, and the catalytic mechanism of the a-Fe2O3 to folic acid electrode reaction process was controlled by the diffusion of FA.
oxidation can be explained by the following scheme; the vol- Further, we have studied the optimization of pH for the
tammetric response of FA at the a-Fe2O3 electrode is due to two present FA sensor. ESI, Fig. S1A,† shows the DPVs obtained for
steps, viz., an electrochemical process followed by a chemical 100 mM FA at the a-Fe2O3 nanober modied GC electrode from
reaction. In the rst step, Fe(II) was electrochemically oxidized pH 5.2–10.2 PB solution. It can be clearly visualized that as the
to Fe(III) (eqn (1)) and in the second step FA was chemically pH value increases, the Epa of FA shis towards negative
oxidized to dehydrofolic acid by Fe(III) (eqn (2)). potential, which conrms that during electrochemical oxida-
tion of FA not only electrons but also protons are involved. The
2Fe(II) / 2Fe(III) + 2eÀ (1) plot of Epa vs. pH shows good linearity in the pH range of 5.2–
10.2. The linear regression equation of Epa/V ($0.032 V) vs. pH
2Fe(III) + folic acid / 2Fe(II) + dehydrofolic acid + H2O (2) was obtained with a correlation coefficient r ¼ 0.990, indicating
that the number of protons and electrons involved is equal.
Fig. S1B† also reveals that the Ipa increases with an increase in
The a-Fe2O3 nanober does not show any oxidation peak in pH up to 7.2, and a further increase of pH results in the decrease
the absence of FA (curve e). Further, in order to understand the of the anodic peak current. Since the present modied electrode
shows a higher current for FA at pH 7.2 and it is also close to the
physiological pH value, we have chosen pH 7.2 for the deter-
mination of FA in this work.
3.3 Selective determination of FA in the presence of AA
Further, we have investigated the determination of FA in the
presence of very high concentrations of AA. It is well known that
Scheme 1 Electrochemical oxidation of FA at the a-Fe2O3 nanofiber modified AA is an important interferent compound which coexists with
GC electrode. FA in our body uids, and further its concentration is always
1782 | Analyst, 2013, 138, 1779–1786 This journal is ª The Royal Society of Chemistry 2013
5. View Article Online
Paper Analyst
higher concentrations of AA is very important. Fig. 4 shows the
DPVs obtained for the increment of 10 mM FA in the presence of
2500 mM AA. The concentration of FA was varied from 10 to
50 mM (curves b–f). A very clear signal was observed for 10 mM FA
in the presence of 2500 mM AA in Fig. 4 (curve b), which revealed
that detection of a very low concentration of FA is possible even
in the presence of 250-fold AA. On increment of 10 mM FA to a
PB solution containing 2500 mM AA, the oxidation current of FA
was increased linearly with a correlation coefficient of 0.9995.
However, the oxidation peak current of AA was almost
unchanged in each addition of FA. These results demonstrated
that the a-Fe2O3 nanober modied GC electrode is more
selective towards FA even in the presence of very high concen-
Published on 31 January 2013 on http://pubs.rsc.org | doi:10.1039/C3AN00070B
trations of AA.
Downloaded by University of Texas Libraries on 22 February 2013
Fig. 4 DPVs obtained for the increment of 10 mM FA to 2500 mM AA in a 0.2 M 3.4 Amperometric determination of FA along with AA
PB solution at the a-Fe2O3 nanofiber modified GC electrode. Pulse width ¼ 0.06 s, The amperometric method was used to examine the sensitivity
amplitude ¼ 0.05 V, sample period ¼ 0.02 s and pulse period ¼ 0.2 s.
of the a-Fe2O3 nanober modied GC electrode towards the
detection of FA individually and also along with AA. Fig. 5A
shows the amperometric i–t curve for FA at the a-Fe2O3 nano-
much higher than that of FA.43 For example, the concentrations ber modied GC electrode in a homogeneously stirred 0.20 M
of AA and FA in human blood serum are 53.8 Æ 36.6 mmol LÀ1, PB solution by applying a potential of 0.90 V. The modied
and 34.4 Æ 10.4 nmol LÀ1, respectively.43–45 Therefore, from a electrode shows the initial current response due to 600 nM FA.
clinical point of view, the determination of FA in the presence of The current response increases and a steady state current is
Fig. 5 (A) Amperometric i–t curve for the determination of FA at the a-Fe2O3 nanofiber modified GC electrode in a 0.2 M PB solution. Each addition increases the
concentration of 60 nM of FA. Eapp ¼ 0.90 V. (B) Calibration plot obtained for conc. of FA vs. amperometric current. (C) (a) 60, (b) 300, (c) 900, (d) 1500, (e) 4500, (f) 9000,
(g) 15 000, (h) 20 000, (i) 30 000, (j) 40 000 and (k) 60 000 mM addition of FA at the a-Fe2O3 nanofiber modified electrode. (D) Amperometric i–t curve response
obtained for the addition of 60 nM FA (a–c) and a mixture of 60 nM each of FA and AA (d–f) using the a-Fe2O3 nanofiber electrode in a 0.2 M PB solution at a regular
interval of 50 s.
This journal is ª The Royal Society of Chemistry 2013 Analyst, 2013, 138, 1779–1786 | 1783
6. View Article Online
Analyst Paper
Table 1 Comparison of different chemically modified electrodes for the deter-
mination of FA with the a-Fe2O3 nanostructure modified electrode
Modied electrodes Detection limit Ref.
Single-walled carbon 1 Â 10À9 M 46
nanotube-ionic liquid
paste electrode
Single-walled carbon nanotube 1 Â 10À9 M 47
lm modied glassy
carbon electrode
Lead lm modied glassy 7 Â 10À10 M 49
carbon electrode
Poly(5-amino-2-mercapto-1,3,4- 2.3 Â 10À10 M 50
thiadiazole) lm modied
Published on 31 January 2013 on http://pubs.rsc.org | doi:10.1039/C3AN00070B
glassy carbon electrode
3-Amino-5-mercapto-1,2,4-triazole 2.5 Â 10À7 M 51 Fig. 6 Amperometric i–t curve for 60 nM addition of FA at the a-Fe2O3 nanofiber
polymerized lm modied modified GC electrode (a–c, g–i), and the addition of 60 mM of Na+, Ca2+, SO42À
Downloaded by University of Texas Libraries on 22 February 2013
glassy carbon electrode (d–f), glucose, urea and oxalate (j–l), in a homogeneously stirred 0.2 M PB
a-Fe2O3 nanostructure modied 1.12 Â 10À10 M This work solution.
glassy carbon electrode
such as Na+, Ca2+, and SO42À, and some physiological interfer-
ents such as glucose, urea and oxalate using the amperometric
attained within 3 s for further addition of 60 nM FA in each step
method (Fig. 6). Furthermore, no change in the amperometric
with a sample interval of 50 s. The dependence of the response
current response was observed for 60 nM FA in the presence of
current with respect to the concentration of FA was linear from
60 mM of MgSO4, CaCl2, NaCl, K2CO3, NaF, ClÀ, FÀ, and NH4Cl,
60 nM to 600 nM at the a-Fe2O3 nanober modied GC elec-
indicating that the present modied electrode is highly selective
trode with a correlation coefficient of 0.9991 (Fig. 5B). The
towards the determination of FA even in the presence of a 1000-
current response for 60 nM FA was found to be 39.2 nA. Further,
fold excess of these interferents.
the amperometric current response was increased linearly with
increasing FA concentration in the range of 60–60 000 nM
(Fig. 5C) with a correlation coefficient of 0.9901, and the a-Fe2O3 3.6 The stability and reproducibility of the a-Fe2O3
nanober modied electrode displayed an excellent sensitivity nanober modied electrode
for FA detection with an experimental detection limit of 60 nM In order to investigate the stability of the a-Fe2O3 nanober
(1.12 Â 10À10 M (S/N ¼ 3)). The linear range and the lowest modied GC electrode, the DPVs for 0.20 mM FA in a 0.20 M PB
detection limit for FA at a-Fe2O3 nanobers were compared with solution were recorded for every 5 min interval. It was found
the recently reported chemically modied electrodes.46–51 Thus, that the oxidation peak current remained the same with a
the present modied electrode shows the lowest detection limit relative standard deviation of 2.1% for 20 repetitive measure-
for FA (60 nM (1.12 Â 10À10 M (S/N ¼ 3)) when compared to the ments, indicating that the electrode has a good reproducibility
reported FA detection limits (see Table 1).46–51 As mentioned and does not undergo surface fouling. Aer voltammetric
above, the normal level of FA in blood serum is 34.4 Æ 10.4 nmol measurements, the electrode was kept in a pH ¼ 7.2 PB solution
LÀ1. Therefore, the a-Fe2O3 nanober modied GC electrode is at room temperature. The current response decreased about
more suitable for the determination of FA in real (blood serum) 1.24% in one week and 5.54% in about two weeks. To ascertain
samples even in the presence of 53.8 Æ 36.6 mmol LÀ1 AA. The the reproducibility of the results, three different GC electrodes
amperometric method was also performed to determine the were modied with the a-Fe2O3 nanobers and their response
concentration of FA along with AA. The amperometric current towards the oxidation of 0.50 mM AA and FA was tested by 20
response for the alternative addition of AA and FA in the repeated measurements. The separation between the voltam-
mixture is shown in Fig. 5D. The a-Fe2O3 nanober modied GC metric peaks of AA–FA was the same at all the four electrodes.
electrode showed the initial current response due to the addi- The peak current obtained in the 20 repeated measurements of
tion of 60 nM AA (Fig. 5D; curves a–c) into a PB solution with a three independent electrodes showed a relative standard devi-
sample interval of 50 s, and the current response was increased. ation of 1.48%, conrming that the results are reproducible.
Further, the addition of a mixture of 60 nM AA and 60 nM FA to The above results showed that the present modied electrode
a stirred solution of 0.2 M PB showed a two-fold enhanced was very much stable and reproducible towards these analytes.
amperometric oxidation current at the same applied potential It is worthy to compare the determination of FA at the a-Fe2O3
(Fig. 5D; curves d–f). The two-fold amperometric oxidation nanober modied GC electrode with other chemically modi-
current obtained was due to the oxidation of both AA and FA. ed electrodes. In the reported papers, the procedures adopted
for the modication of electrode surfaces are very tedious, more
3.5 Anti-interference ability of the a-Fe2O3 nanobers time consuming and further reproducible results cannot be
The anti-interference ability of the a-Fe2O3 nanobers was obtained.47,48,52–54 In the case of a carbon paste electrode, rst
tested towards the detection of FA from various common ions the carbon paste was mixed with the palmitic and stearic acids
1784 | Analyst, 2013, 138, 1779–1786 This journal is ª The Royal Society of Chemistry 2013
7. View Article Online
Paper Analyst
samples, indicating that the adopted method could be effi-
ciently used for the determination of FA in real samples in the
presence of possible interferents.
4 Conclusions
We have demonstrated the synthesis of a-Fe2O3 nanobers by a
simple electrospinning method and their application in vol-
tammetric determination of FA in the presence AA (pH 7.2). The
a-Fe2O3 nanober modied electrode not only separates the
voltammetric signals of AA and FA with a potential difference of
420 mV between AA and FA, but also shows a higher oxidation
Published on 31 January 2013 on http://pubs.rsc.org | doi:10.1039/C3AN00070B
current than the bulk-Fe2O3 and unmodied electrodes. The
amperometric current response is linearly dependent on FA
Fig. 7 DPVs obtained for blood serum (green line) and after the addition of concentration in the range of 60–60 000 nM, and the a-Fe2O3
Downloaded by University of Texas Libraries on 22 February 2013
10 mM commercial FA (blue line) to blood serum at the a-Fe2O3 nanofiber nanober modied GC electrode displayed an excellent sensi-
modified GC electrode in a 0.2 M PB solution. Pulse width ¼ 0.06 s, amplitude ¼ tivity for FA detection with an experimental detection limit of
0.05 V, sample period ¼ 0.02 s and pulse period ¼ 0.2 s.
60 nM (1.12 Â 10À10 M (S/N ¼ 3)). The practical application of
the present modied electrode was successfully demonstrated
by determining the concentration of FA in human blood serum
in the presence of carbon tetrachloride and then dried over- samples. The excellent analytical performance and low cost
night at room temperature.52 Similarly, for the fabrication of a nanomaterials are not only scientically signicant for the
multi-walled carbon nanotube coated Au electrode, the multi- development of effective biosensors, but also could produce real
walled carbon nanotubes (MWNTs) were reuxed in the mixture benets such as energy and cost savings in comparison with
of concentrated H2SO4 and HNO3 for 4–5 h, then washed with other noble metals or enzymes for a wide range of potential
water and dried in vacuum at room temperature.53 When applications in medicine, catalysis, and biosensing.
compared to the reported procedure for the electrode modi-
cations, the procedure for the deposition of a-Fe2O3 nanobers
on the GC electrode in the present study is very easy, less time Acknowledgements
consuming (12 min), highly stable and reproducible.
The authors thank the National University of Singapore and
Nanyang Technological University for providing excellent
3.7 Determination of FA in human blood serum samples research facilities to carry out this work. Palanisamy Kannan
The practical application of the a-Fe2O3 nanober modied GC and Marcin Opallo thank NanOtechnology, Biomaterials and
electrode was tested by measuring the concentration of FA in aLternative Energy Source for the ERA Integration [FP7-
human blood serum samples. The human blood serum samples REGPOT-CT-2011-285949-NOBLESSE] Project from the Euro-
were collected from a local hospital (Muthu clinic and X-rays, pean Union.
Dindigul district, India). The standard addition technique was
used for the determination of FA in serum samples. The DPV of
References
blood serum in a PB solution (pH ¼ 7.2) shows two oxidation
peaks at 0.35 and 0.81 V as shown in Fig. 7, green line, and these 1 J. Kong, N. R. Franklin, C. Zhou, M. G. Chapline, S. Peng,
peaks may be due to the oxidation of AA and FA, respectively. To K. Cho and H. Dai, Science, 2000, 287, 622–625.
conrm the observed oxidation peak at 0.81 V for FA in Fig. 7, 2 P. Poizot, S. Laruelle, S. Grugeon, L. Dupont and
green line, we have added a known concentration of FA into the J. M. Tarascon, Nature, 2000, 407, 496–499.
same blood serum solution, the oxidation current at 0.81 V was 3 D. Yu and V. W.-W. Yam, J. Am. Chem. Soc., 2004, 126, 13200–
further enhanced (Fig. 7; blue line) and recovery results are 13201.
given in Table 2. The enhanced oxidation peak current at 0.81 V 4 G. Neri, A. Bonavita, S. Galvagno, P. Siciliano and S. Capone,
indicated that the peak corresponds to the oxidation of FA. The Sens. Actuators, B, 2002, 82, 40–47.
proposed method shows a better recovery of spiked FA in serum 5 Y. Cui, Q. Wei, H. Park and C. M. Lieber, Science, 2001, 293,
1289–1292.
Table 2 Determination of FA in human blood serum samples 6 K. Ramanathan, M. A. Bangar, M. Yun, W. Chen, N. V. Myung
and A. Mulchandani, J. Am. Chem. Soc., 2004, 127, 496–497.
Human 7 R. J. Chen, S. Bangsaruntip, K. A. Drouvalakis, N. Wong Shi
blood Original Added Found Recovery
Kam, M. Shim, Y. Li, W. Kim, P. J. Utz and H. Dai, Proc.
serum (mM) (mM) (mM) (%)
Natl. Acad. Sci. U. S. A., 2003, 100, 4984–4989.
Sample 1 50.10 10 59.80 99.5 8 Y. Ding, P. X. Gao and Z. L. Wang, J. Am. Chem. Soc., 2004,
Sample 2 25.40 10 35.16 99.3 126, 2066–2072.
This journal is ª The Royal Society of Chemistry 2013 Analyst, 2013, 138, 1779–1786 | 1785
8. View Article Online
Analyst Paper
9 J. Liu, X. Wang, Q. Peng and Y. Li, Adv. Mater., 2005, 17, 764– 33 K. K. Y. Sie, J. Chen, K.-J. Sohn, R. Croxford, L. U. Thompson
767. and Y.-I. Kim, Cancer Lett., 2009, 280, 72–77.
10 X. Wang and Y. Li, J. Am. Chem. Soc., 2002, 124, 2880–2881. 34 A. T. Vasilaki, D. C. McMillan, J. Kinsella, A. Duncan,
11 Z. W. Pan, Z. R. Dai and Z. L. Wang, Science, 2001, 291, 1947– D. S. J. O'Reilly and D. Talwar, Clin. Chim. Acta, 2010, 411,
1949. 1750–1755.
12 C. Feldmann, Adv. Mater., 2001, 13, 1301–1303. 35 P. Torres, P. Galleguillos, E. Lissi and C. L´pez-Alarc´n,
o o
13 W. Weiss, D. Zscherpel and R. Schl¨gl, Catal. Lett., 1998, 52,
o Bioorg. Med. Chem., 2008, 16, 9171–9175.
215–220. 36 S. Y. Ly, H. S. Yoo, J. Y. Ahn and k. h. Nam, Food Chem., 2011,
14 M. Fukazawa, H. Matuzaki and K. Hara, Sens. Actuators, B, 127, 270–274.
1993, 14, 521–522. 37 J. Rodr´ ıguez Flores, G. C. Pe~ alvo, A. E. Mansilla and
n
15 F. Bondioli, A. M. Ferrari, C. Leonelli and T. Manfredini, M. J. R. G´mez, J. Chromatogr., B: Anal. Technol. Biomed.
o
Mater. Res. Bull., 1998, 33, 723–729. Life Sci., 2005, 819, 141–147.
16 S. C. Tsang, V. Caps, I. Paraskevas, D. Chadwick and 38 M. J. Esteve, R. Farr´, A. Frigola and J. M. Garcia-Cantabella,
e
Published on 31 January 2013 on http://pubs.rsc.org | doi:10.1039/C3AN00070B
D. Thompsett, Angew. Chem., Int. Ed., 2004, 43, 5645–5649. J. Chromatogr., B: Biomed. Sci. Appl., 1997, 688, 345–349.
17 L. Gao, J. Zhuang, L. Nie, J. Zhang, Y. Zhang, N. Gu, T. Wang, 39 A. Mu~ oz de la Pe~ a, I. D. Mer´s, A. Jim´nez Gir´n and
n n a e o
Downloaded by University of Texas Libraries on 22 February 2013
J. Feng, D. Yang, S. Perrett and X. Yan, Nat. Nanotechnol., H. C. Goicoechea, Talanta, 2007, 72, 1261–1268.
2007, 2, 577–583. 40 J. Sundaramurthy, P. S. Kumar, M. Kalaivani, V. Thavasi,
18 J. Wang, Chem. Rev., 2007, 108, 814–825. S. G. Mhaisalkar and S. Ramakrishna, RSC Adv., 2012, 2,
19 N. Ding, N. Yan, C. Ren and X. Chen, Anal. Chem., 2010, 82, 8201–8208.
5897–5899. 41 D. Dryhurst, Electrochemistry of Biological Molecules,
20 H.-L. Zhang, X.-Z. Zou, G.-S. Lai, D.-Y. Han and F. Wang, Academic Press, New York, 1977.
Electroanalysis, 2007, 19, 1869–1874. 42 J. G. Velasco, Electroanalysis, 1997, 9, 880–882.
21 G. Zhao, J.-J. Xu and H.-Y. Chen, Electrochem. Commun., 43 C. M. Tallaksen, T. Bøhmer and H. Bell, Am. J. Clin. Nutr.,
2006, 8, 148–154. 1992, 56, 559–564.
22 S.-F. Wang and Y.-M. Tan, Anal. Bioanal. Chem., 2007, 387, 44 A. B. Alper, W. Chen, L. Yau, S. R. Srinivasan, G. S. Berenson
703–708. and L. L. Hamm, Hypertension, 2005, 45, 34–38.
23 X. Cao, N. Wang, X. Lu and L. Guo, J. Electrochem. Soc., 2010, 45 K. S. Woo, P. Chook, Y. I. Lolin, J. E. Sanderson, C. Metreweli
157, K76–K79. and D. S. Celermajer, J. Am. Coll. Cardiol., 1999, 34, 2002–
24 X. Cao and N. Wang, Analyst, 2011, 136, 4241–4246. 2006.
25 D. Sun, H. Wang and K. Wu, Microchim. Acta, 2006, 152, 255– 46 F. Xiao, C. Ruan, L. Liu, R. Yan, F. Zhao and B. Zeng, Sens.
260. Actuators, B, 2008, 134, 895–901.
26 T. G¨nd¨z, E. Kiliç, E. Canel and F. K¨seo˘lu, Anal. Chim.
u u o g 47 C. Wang, C. Li, L. Ting, X. Xu and C. Wang, Microchim. Acta,
Acta, 1993, 282, 489–495. 2006, 152, 233–238.
27 E. Gujska and A. Kuncewicz, Eur. Food Res. Technol., 2005, 48 H.-S. Wang, T.-H. Li, W.-L. Jia and H.-Y. Xu, Biosens.
221, 208–213. Bioelectron., 2006, 22, 664–669.
28 M. O'Neil, S. Budavari, A. Smith, P. Heckelman and 49 M. Korolczuk and K. Tyszczuk, Electroanalysis, 2007, 19,
J. Obenchain, Merck Index, Merck, New York, 1996, p. 715. 1959–1962.
29 P.-T. Lin, B.-J. Lee, H.-H. Chang, C.-H. Cheng, A.-J. Tsai and 50 P. Kalimuthu and S. A. John, Biosens. Bioelectron., 2009, 24,
Y.-C. Huang, Nutr. Res., 2006, 26, 460–466. 3575–3580.
30 M. P. McRae, Journal of Chiropractic Medicine, 2009, 8, 15–24. 51 S. B. Revin and S. A. John, Electrochim. Acta, 2012, 75, 35–41.
31 M. T. Abou-Saleh and A. Coppen, J. Psychosom. Res., 2006, 61, 52 N. A. El-Maali, Biosens. Bioelectron., 1992, 27, 465–473.
285–287. 53 S. Wei, F. Zhao, Z. Xu and B. Zeng, Microchim. Acta, 2006,
32 A. H. Liem, A. J. van Boven, N. J. G. M. Veeger, A. J. Withagen, 152, 285–290.
R. M. Robles de Medina, J. G. P. Tijssen and D. J. van 54 Q. Wan and N. Yang, J. Electroanal. Chem., 2002, 527, 131–
Veldhuisen, Int. J. Cardiol., 2004, 93, 175–179. 136.
1786 | Analyst, 2013, 138, 1779–1786 This journal is ª The Royal Society of Chemistry 2013