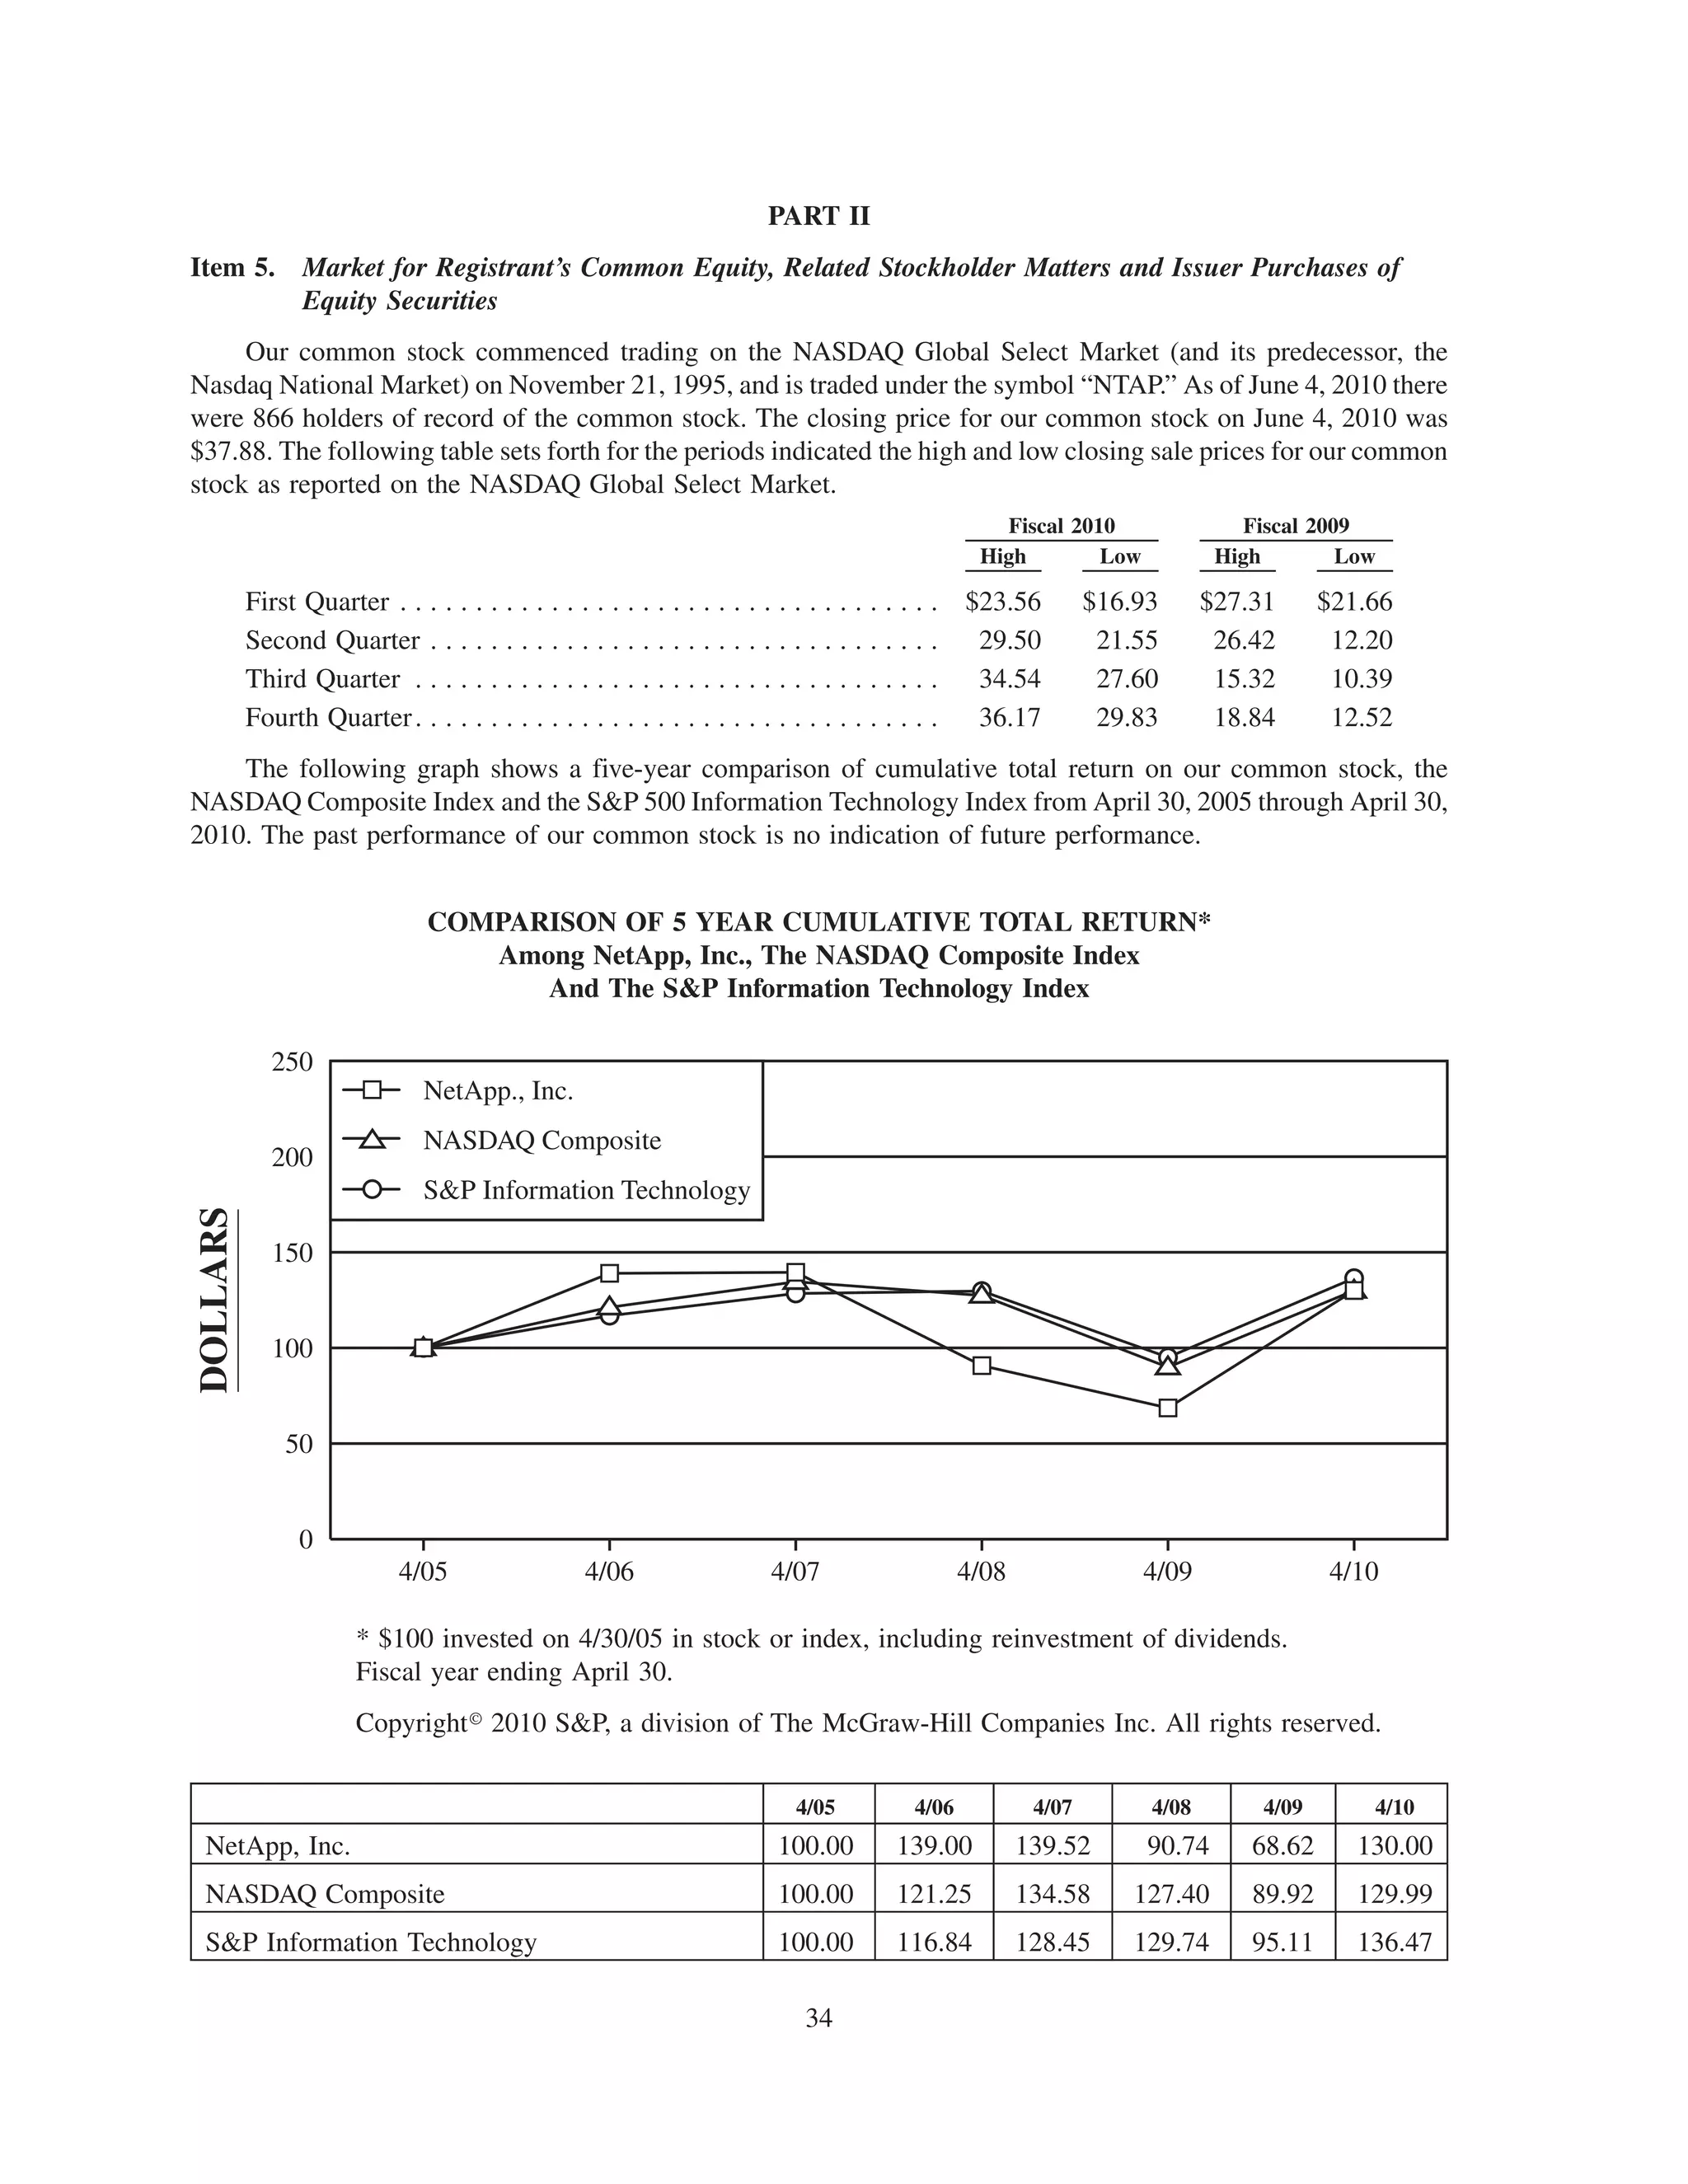
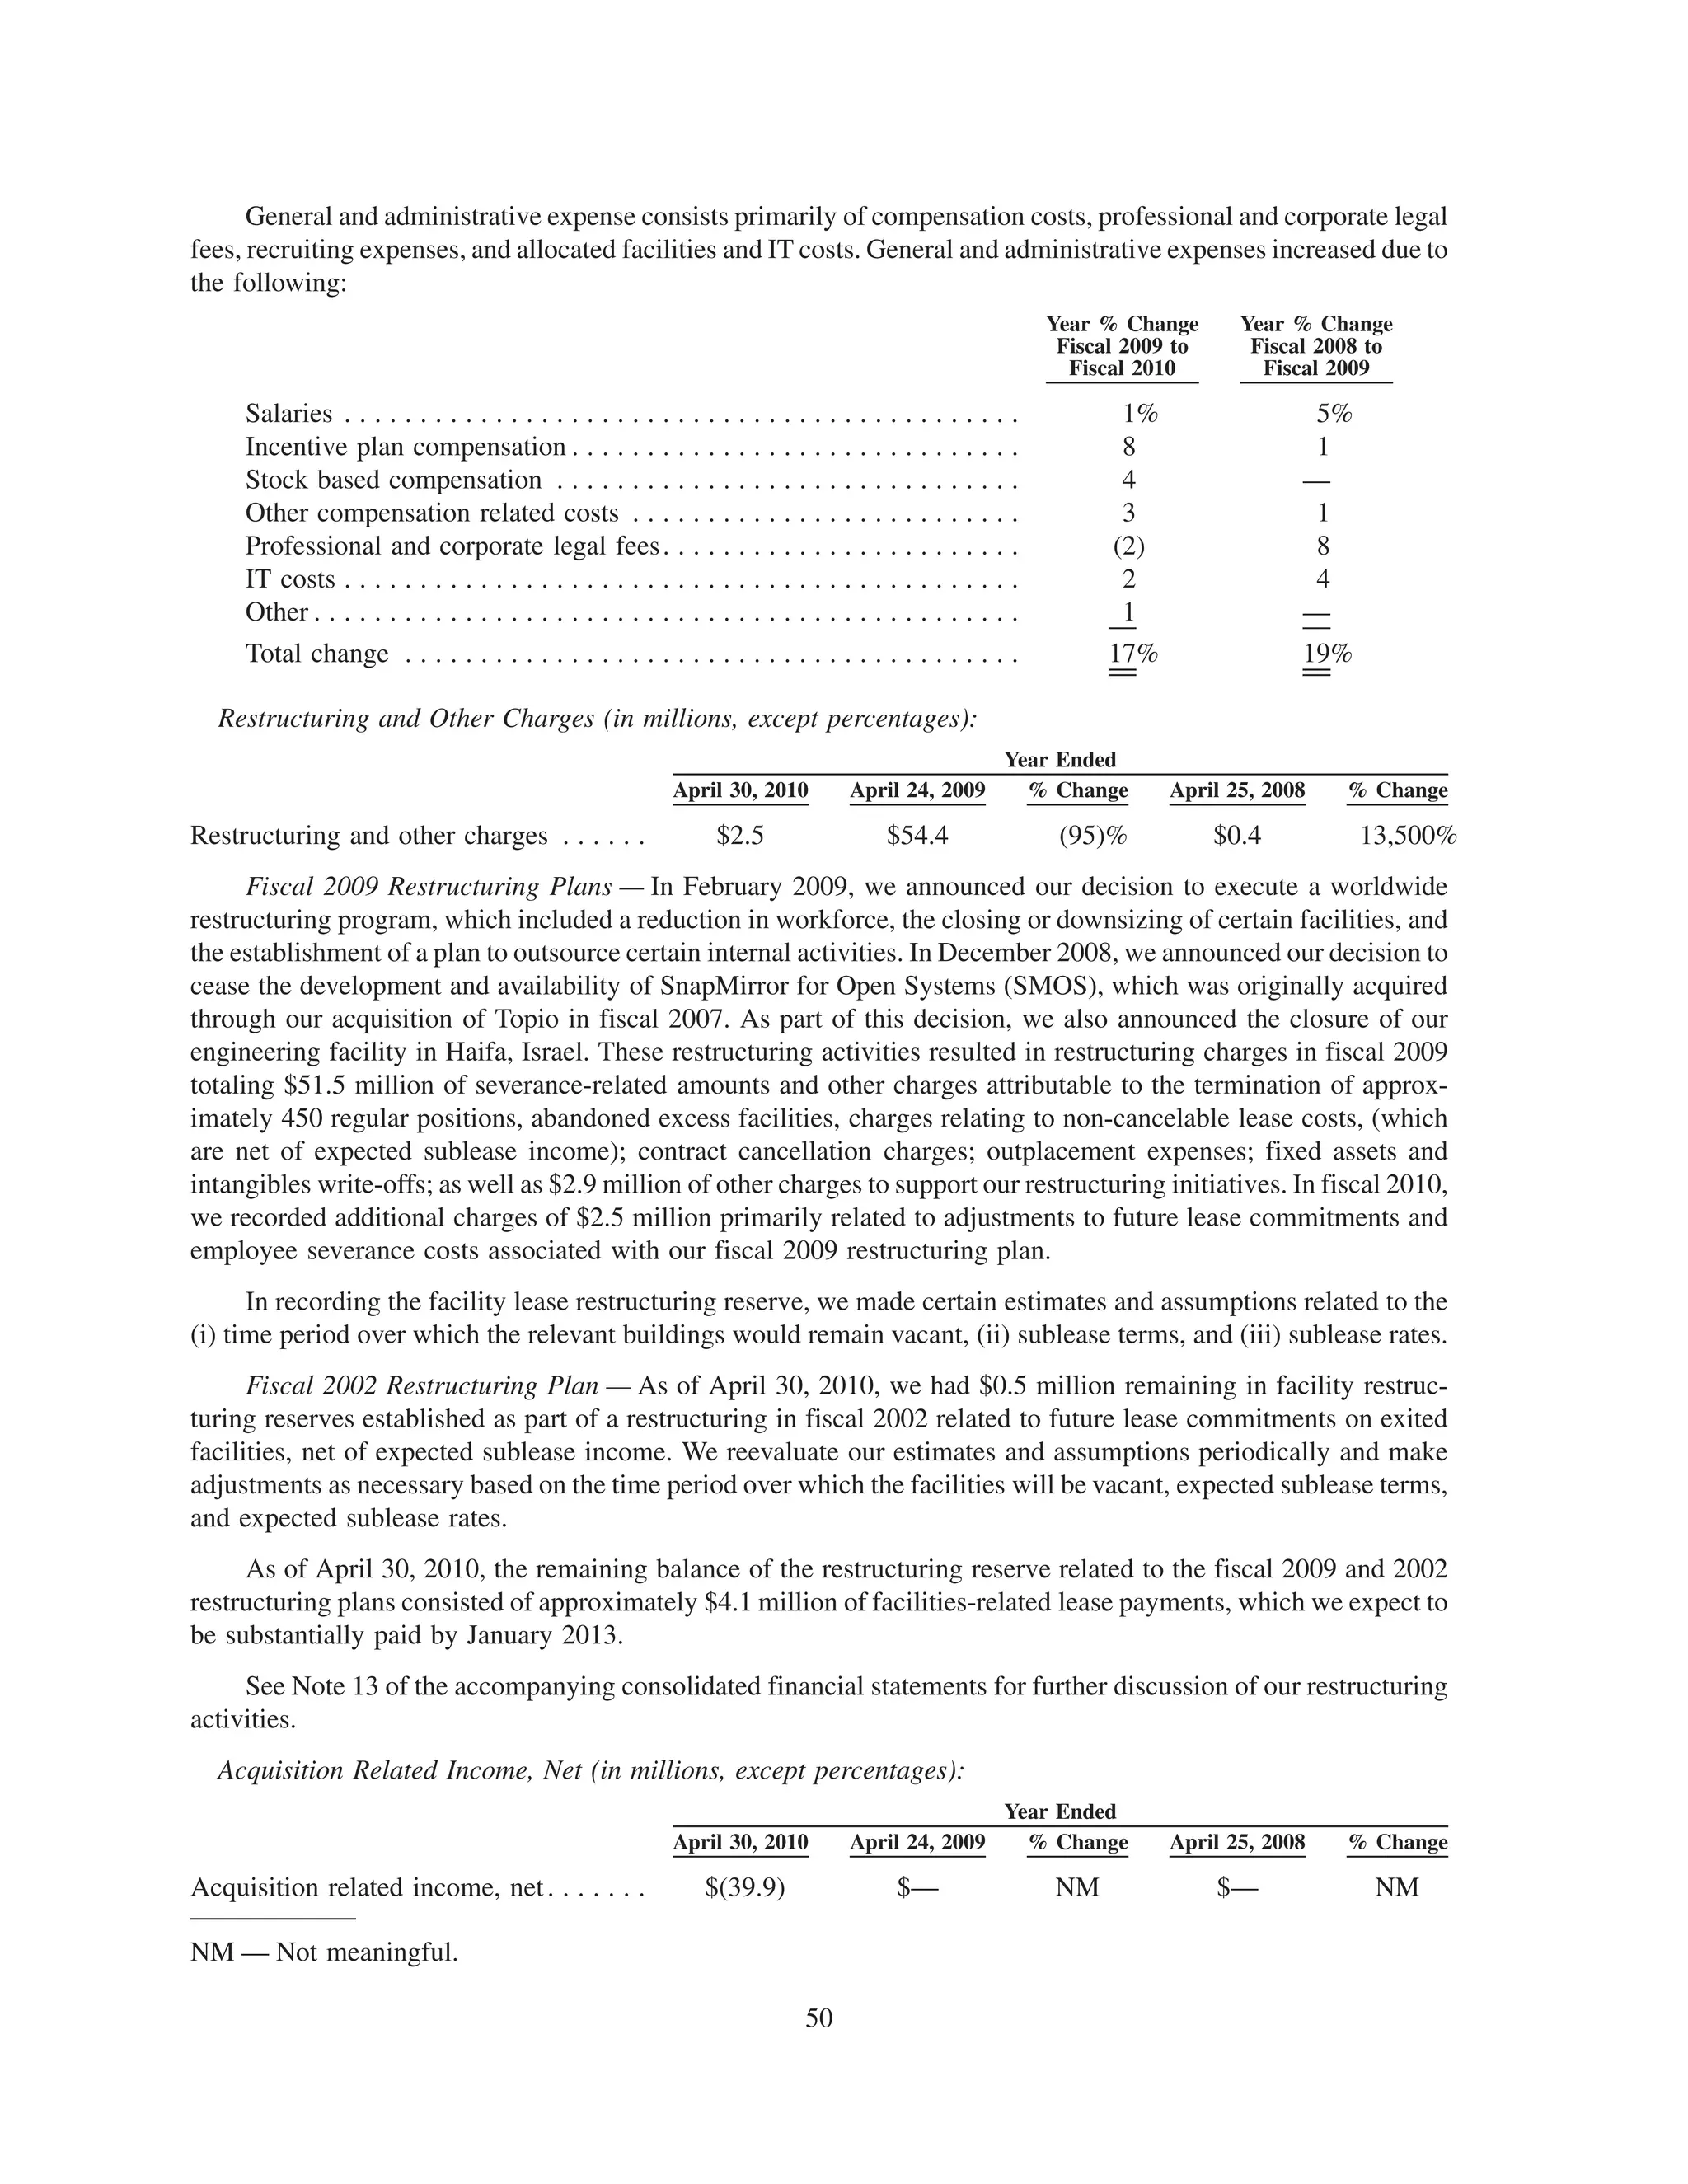
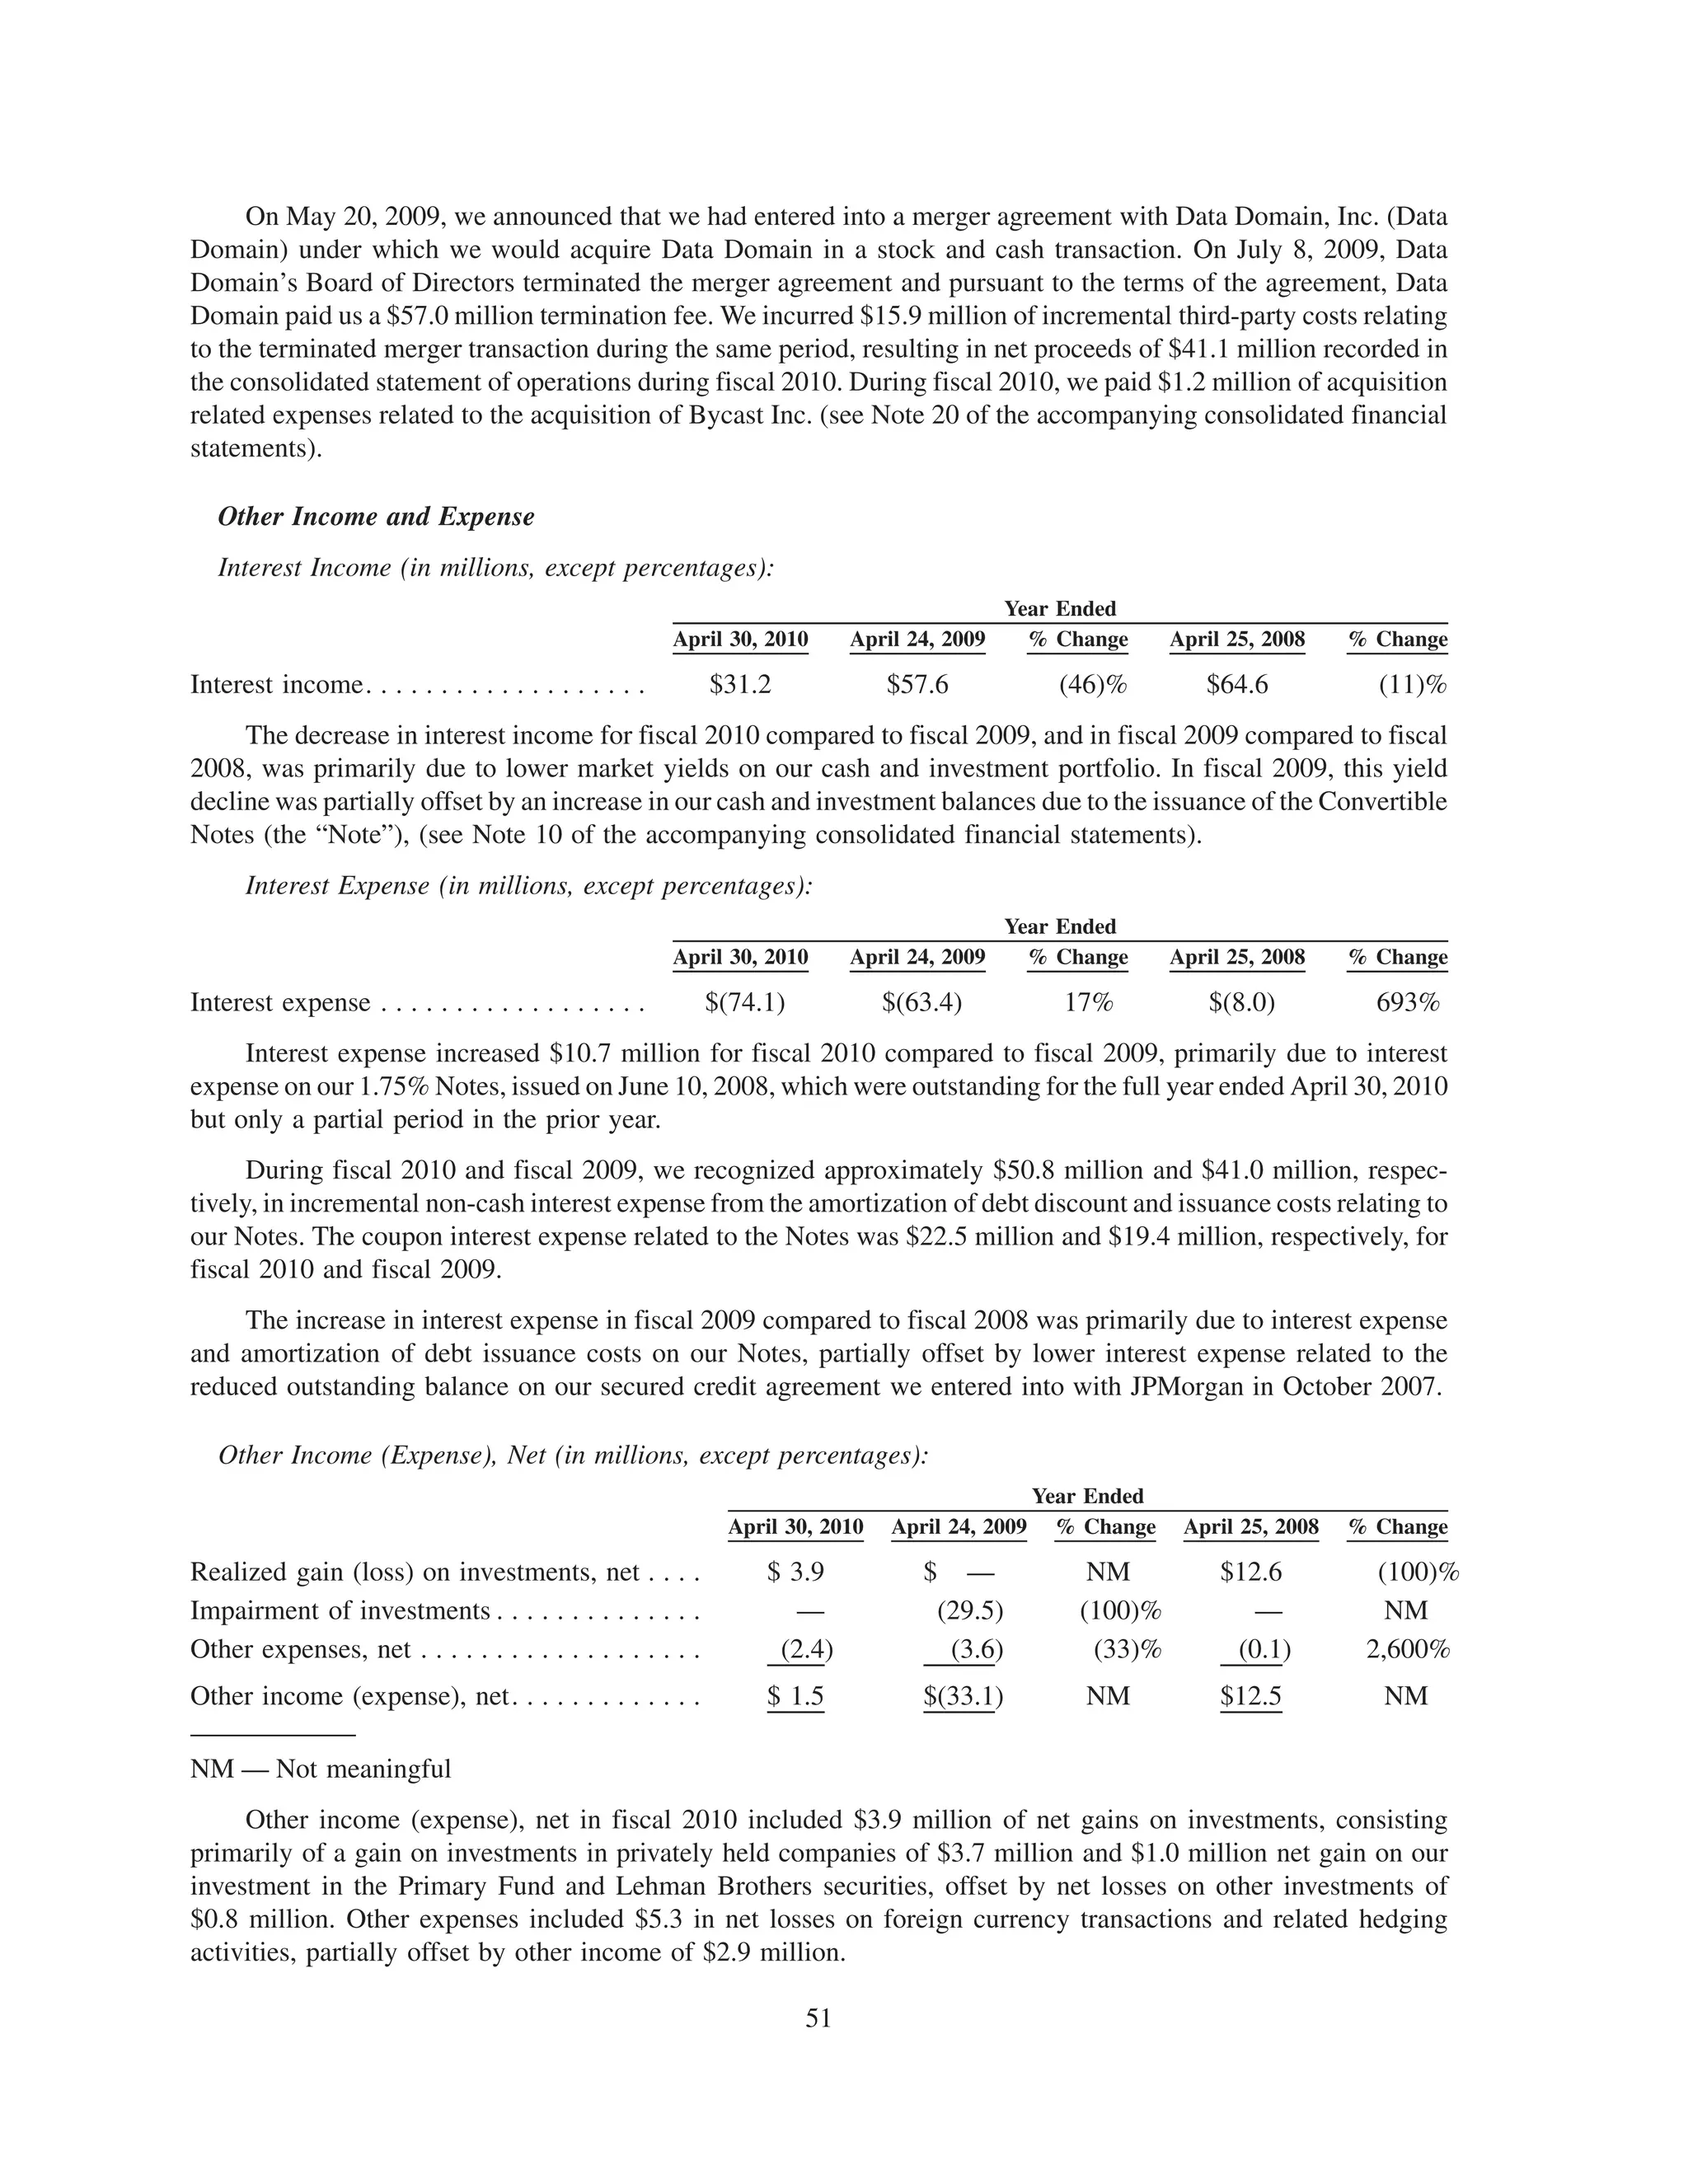
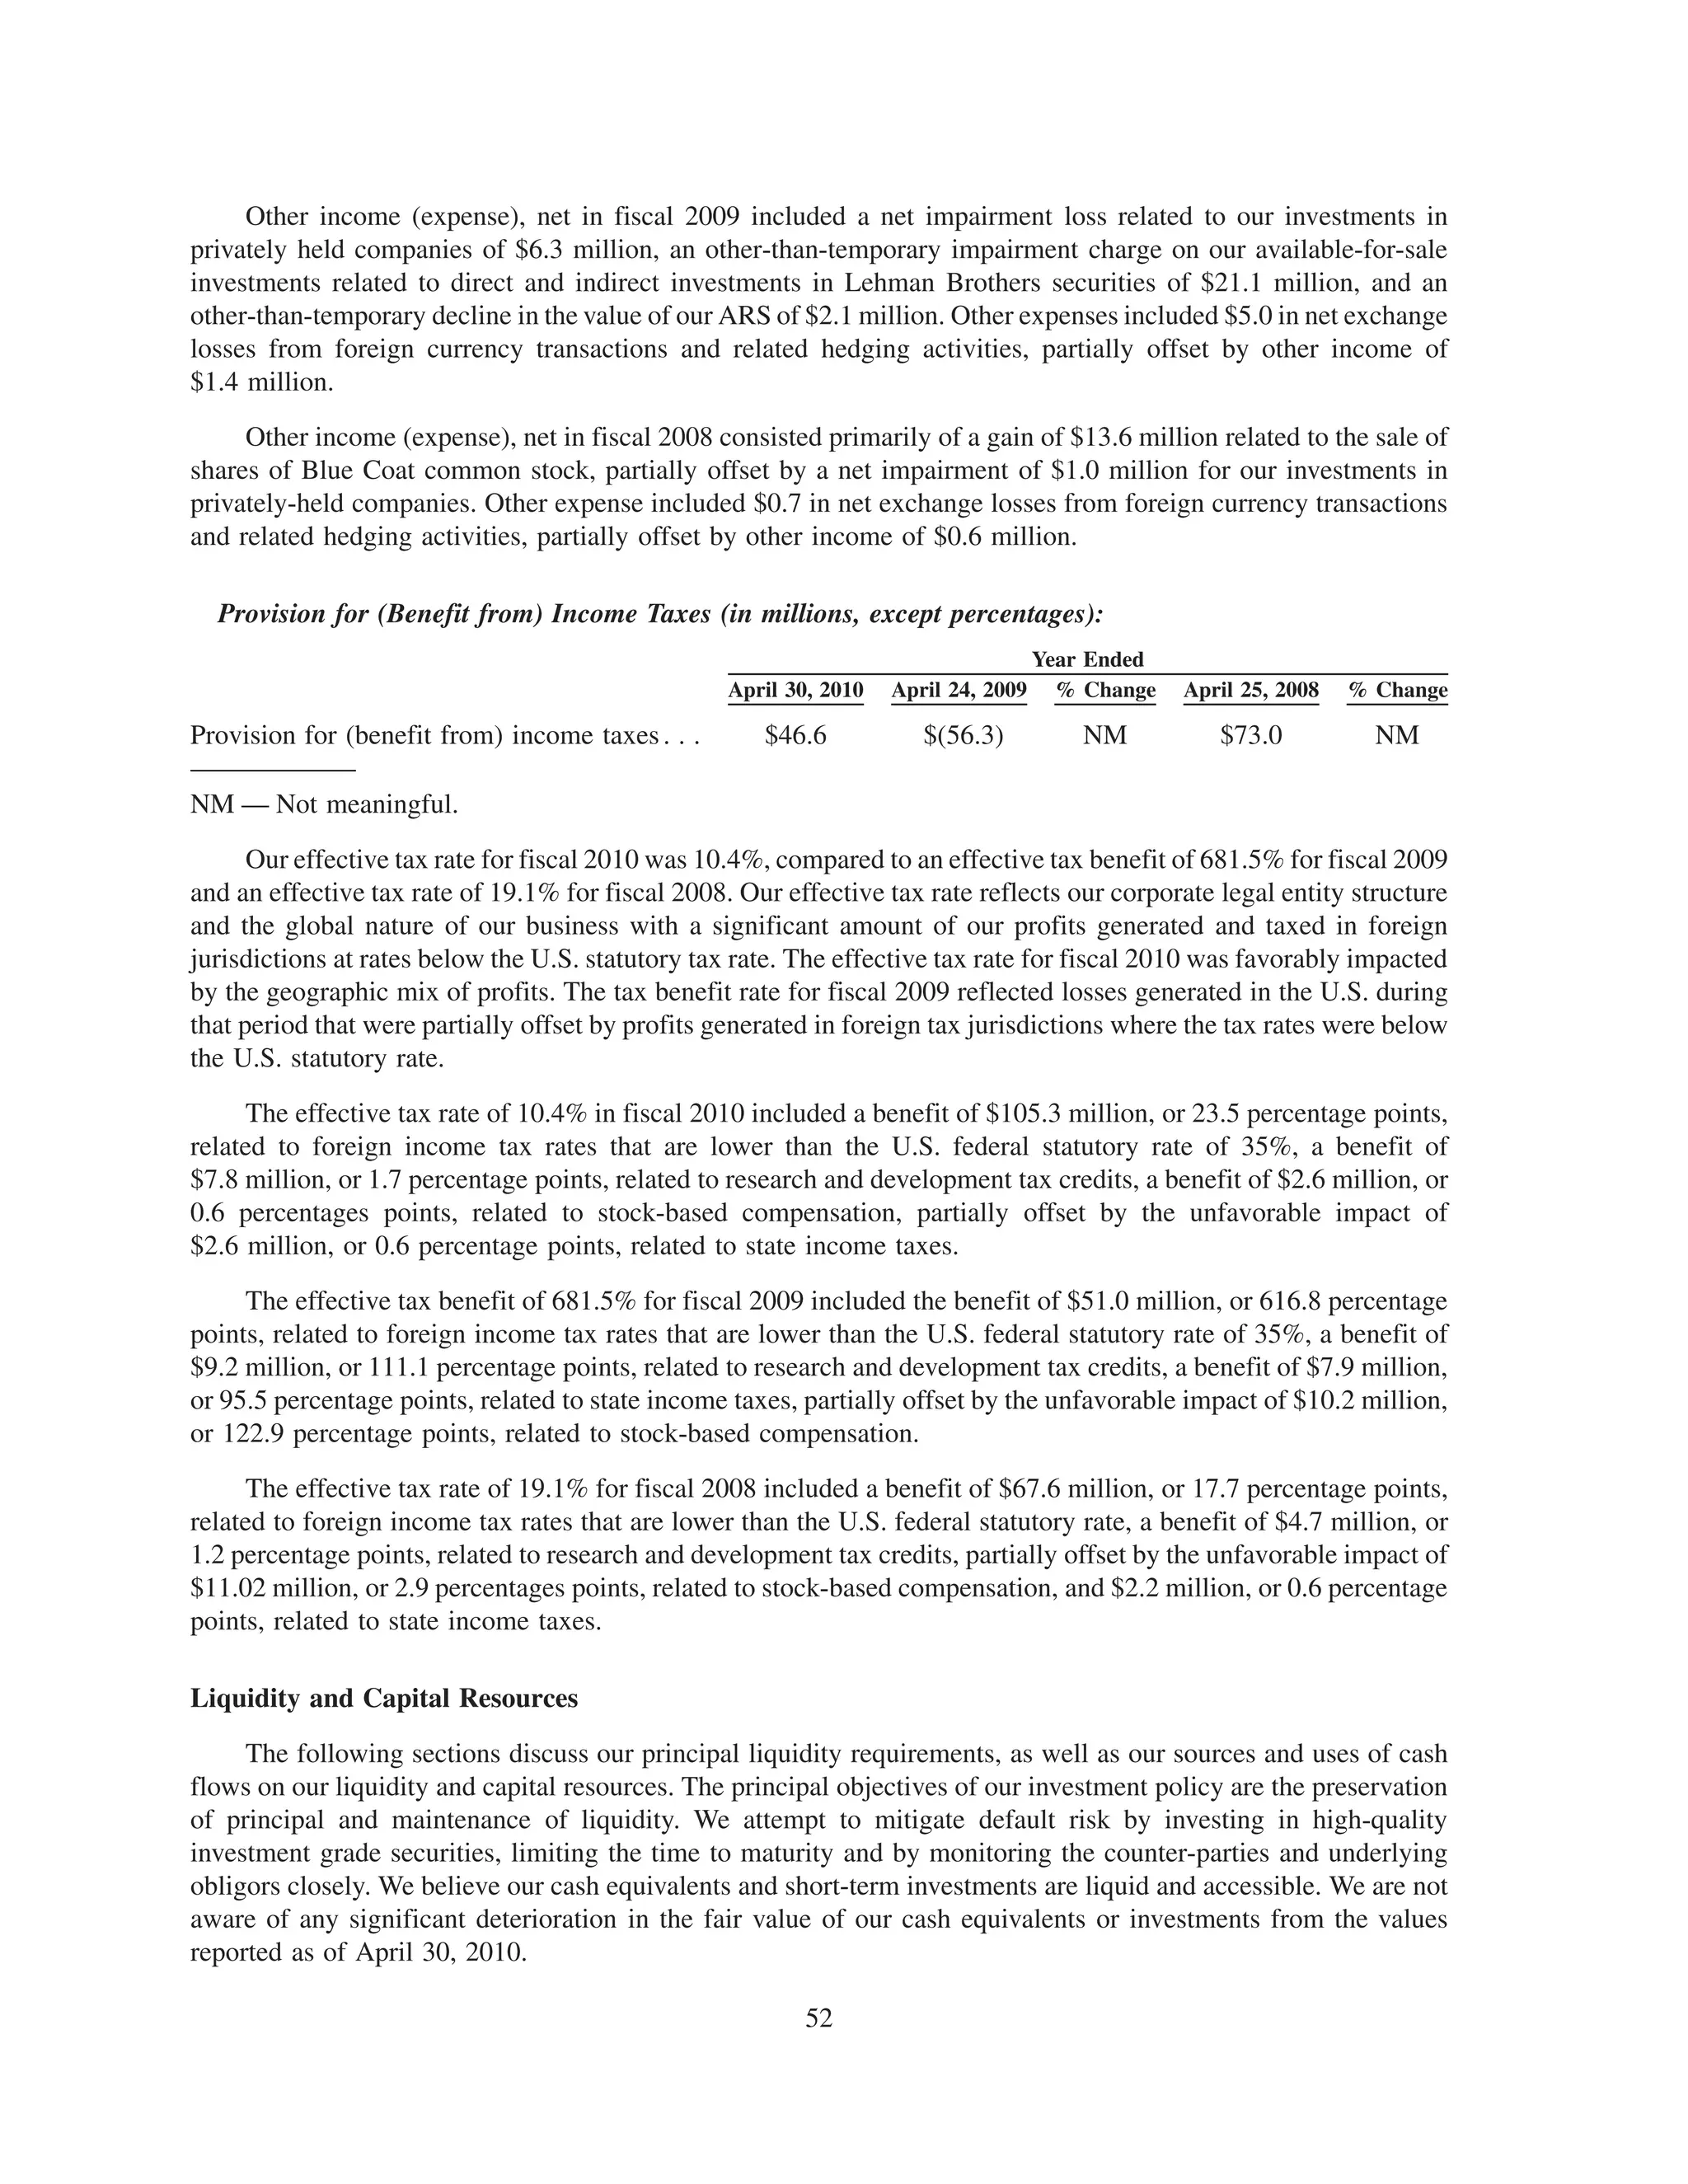
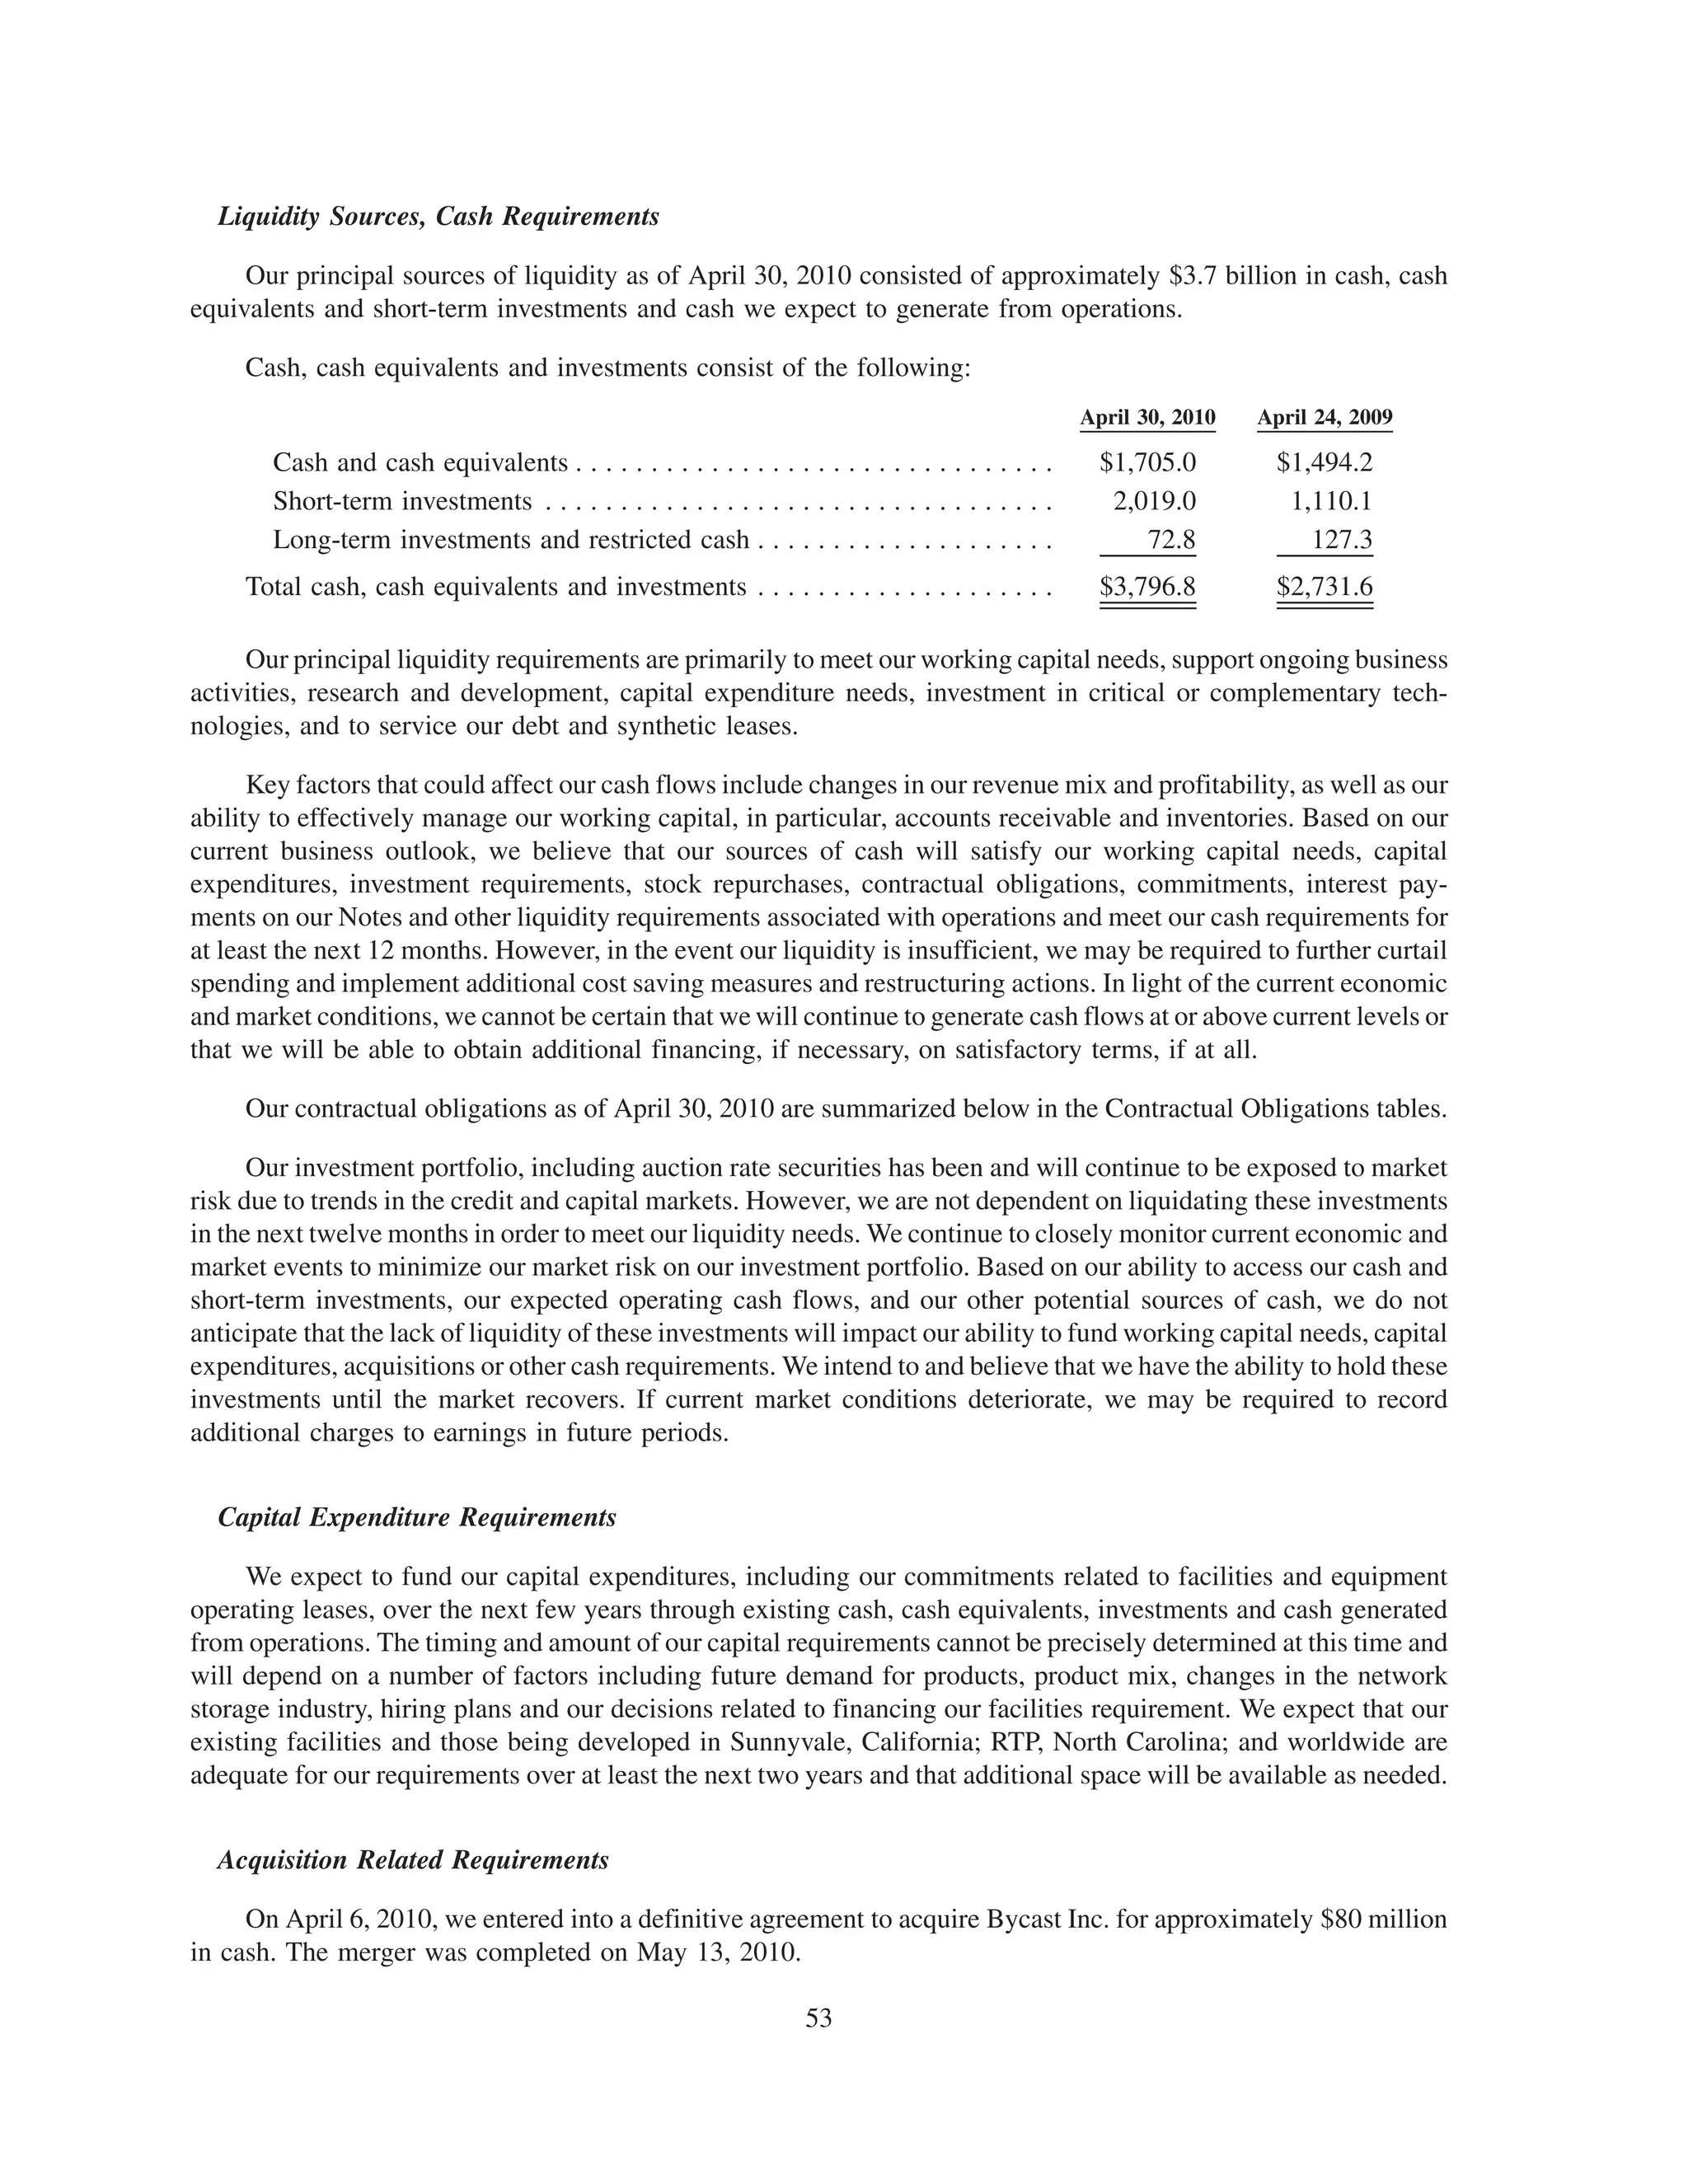
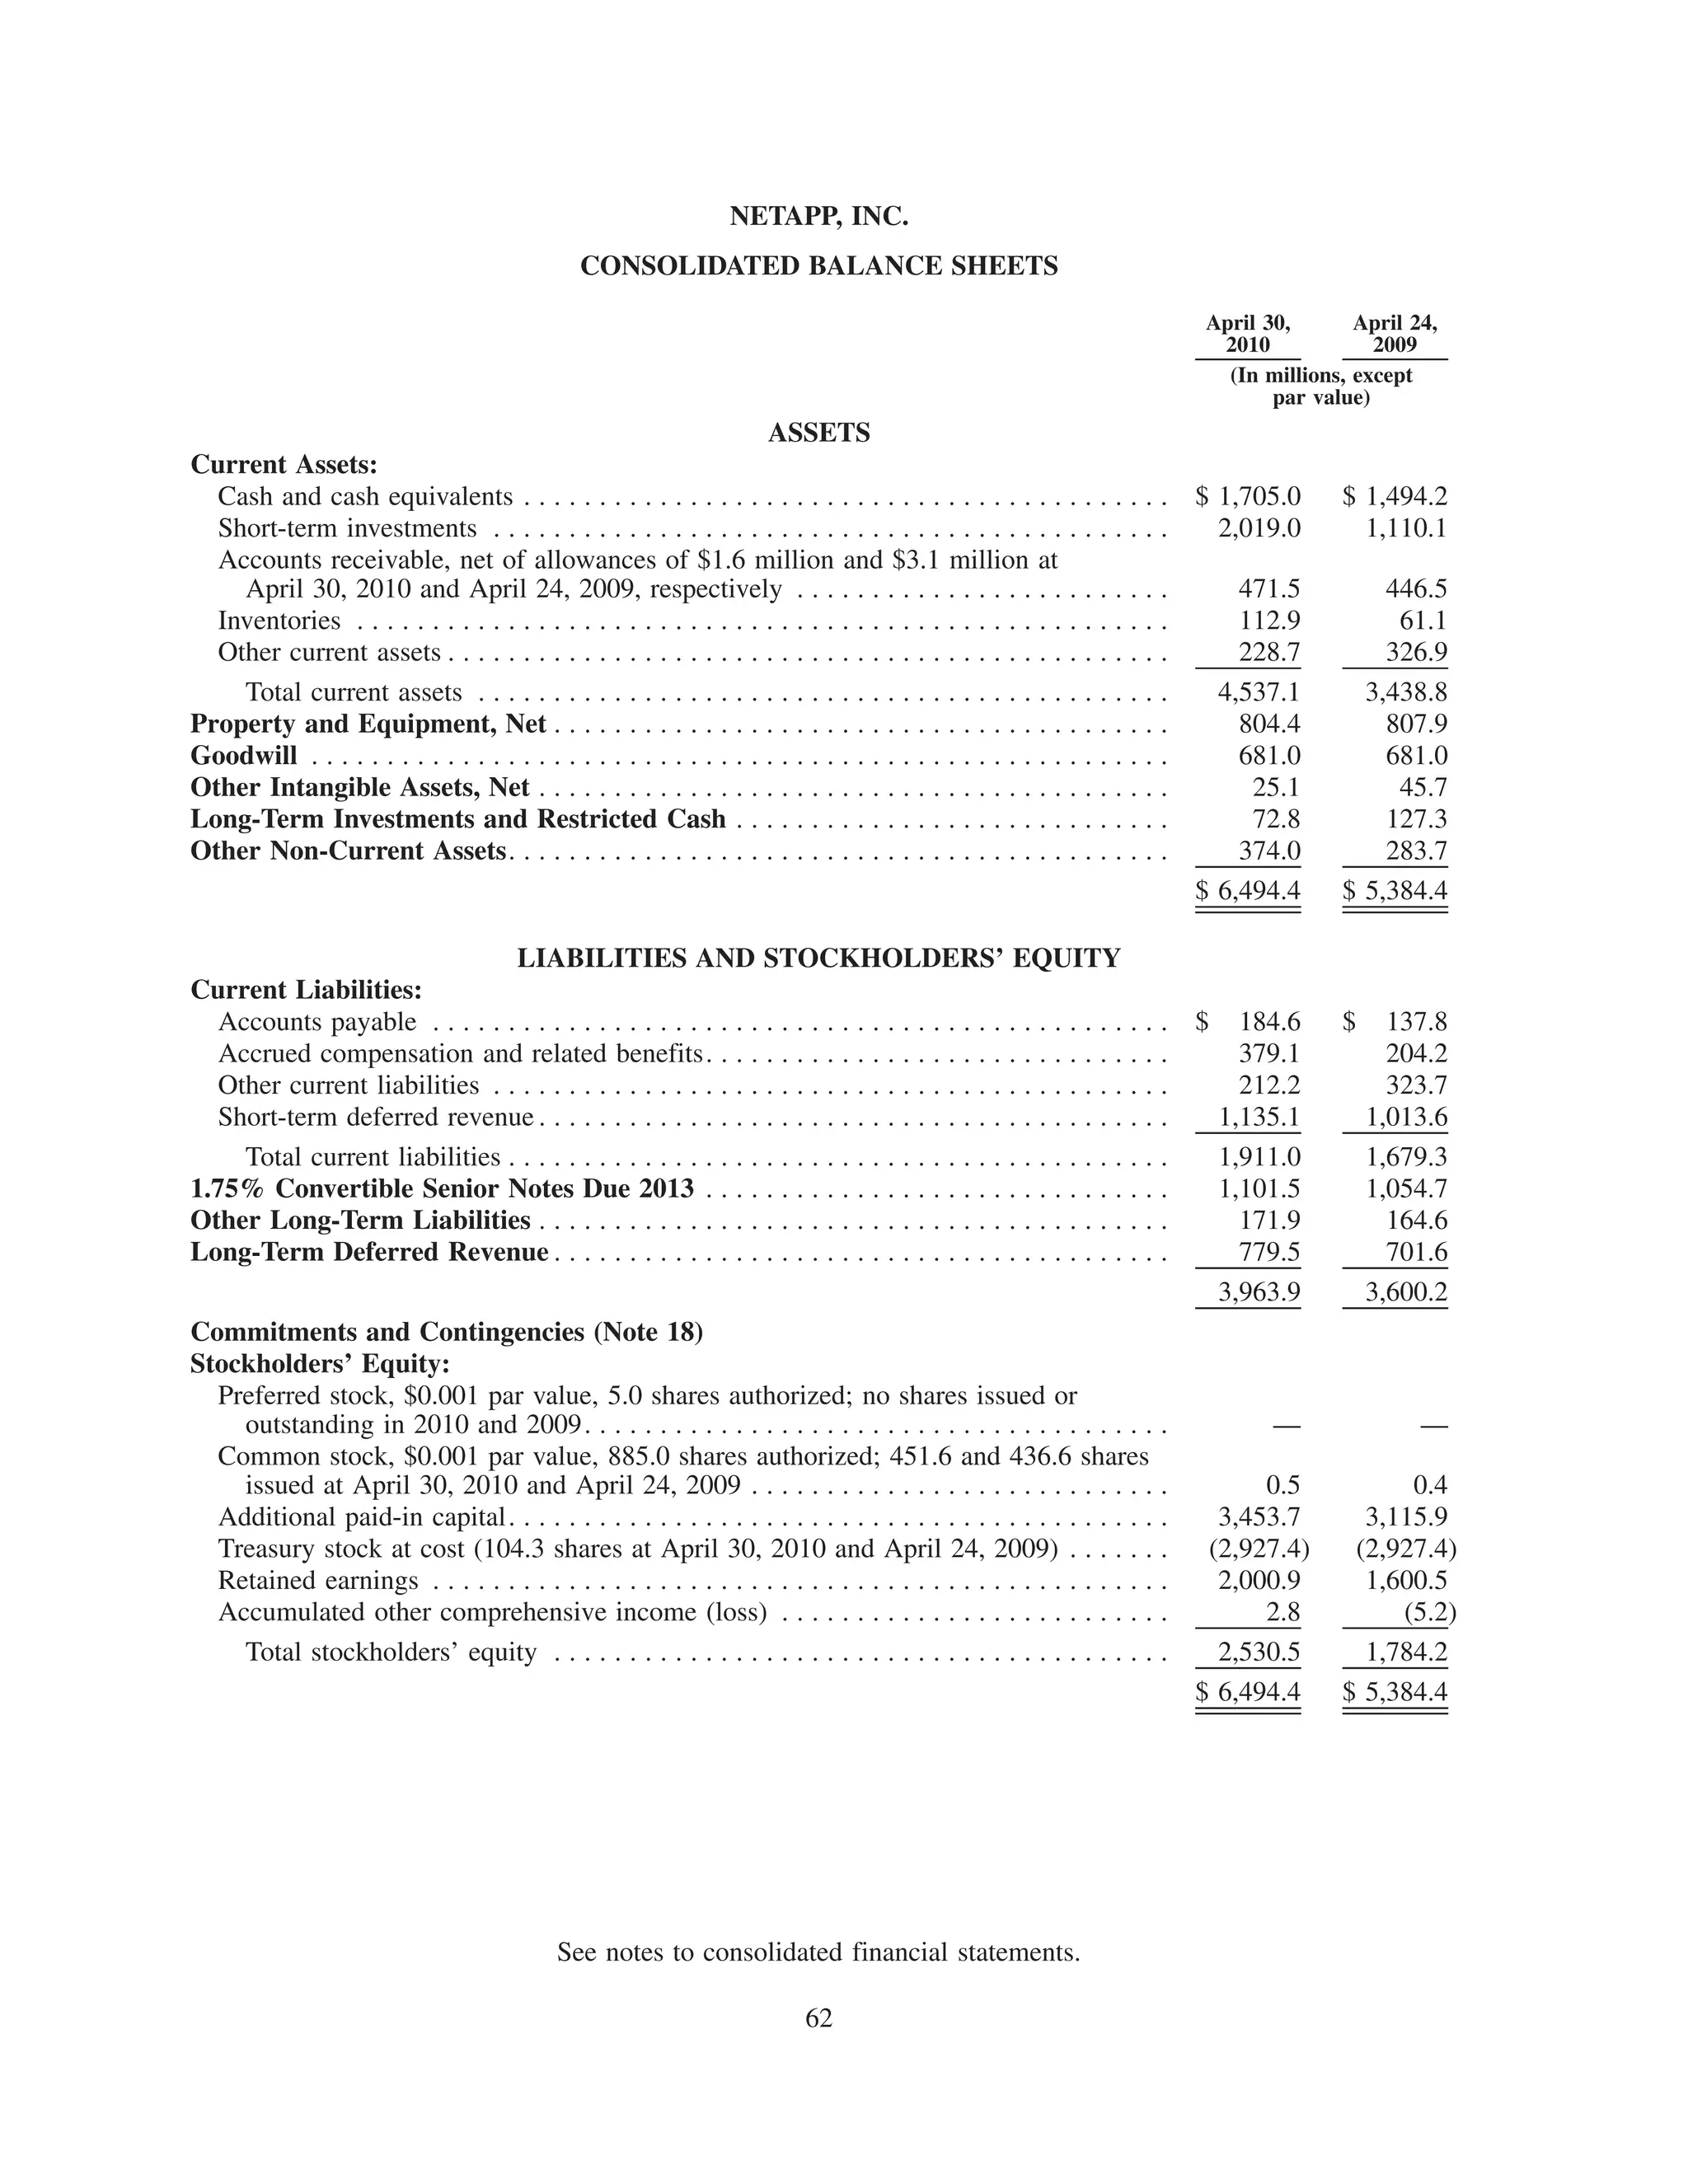
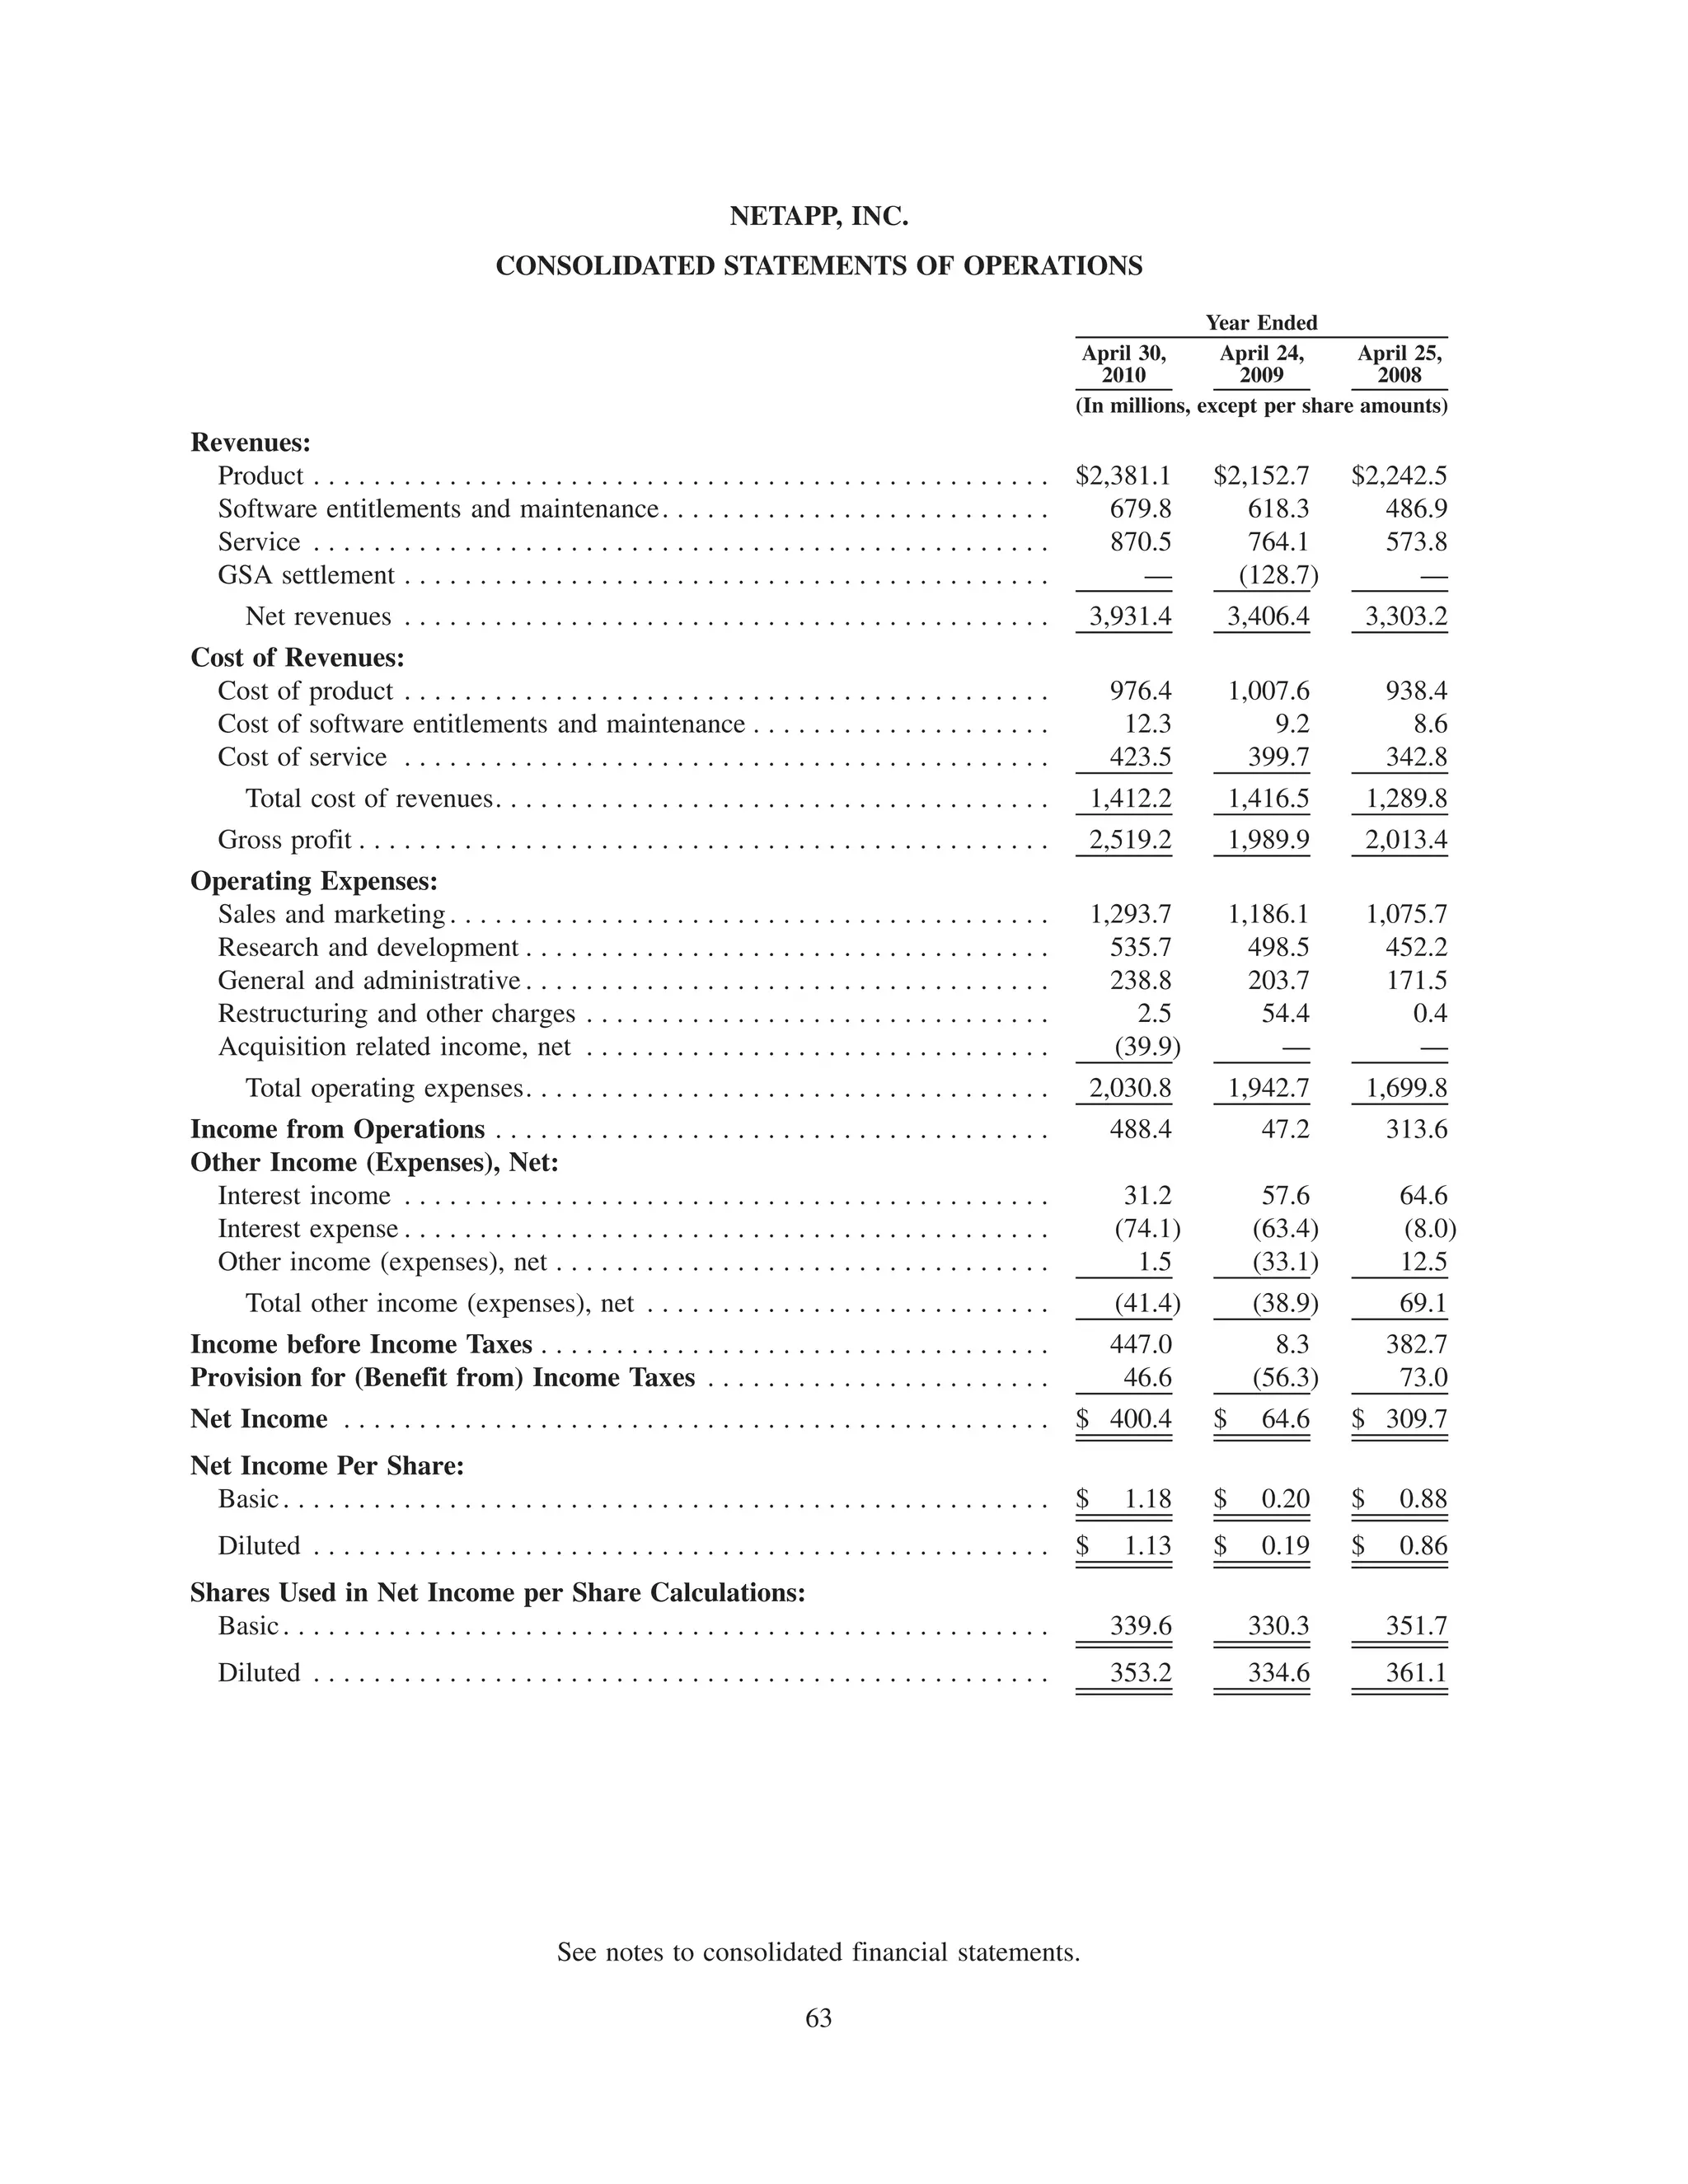
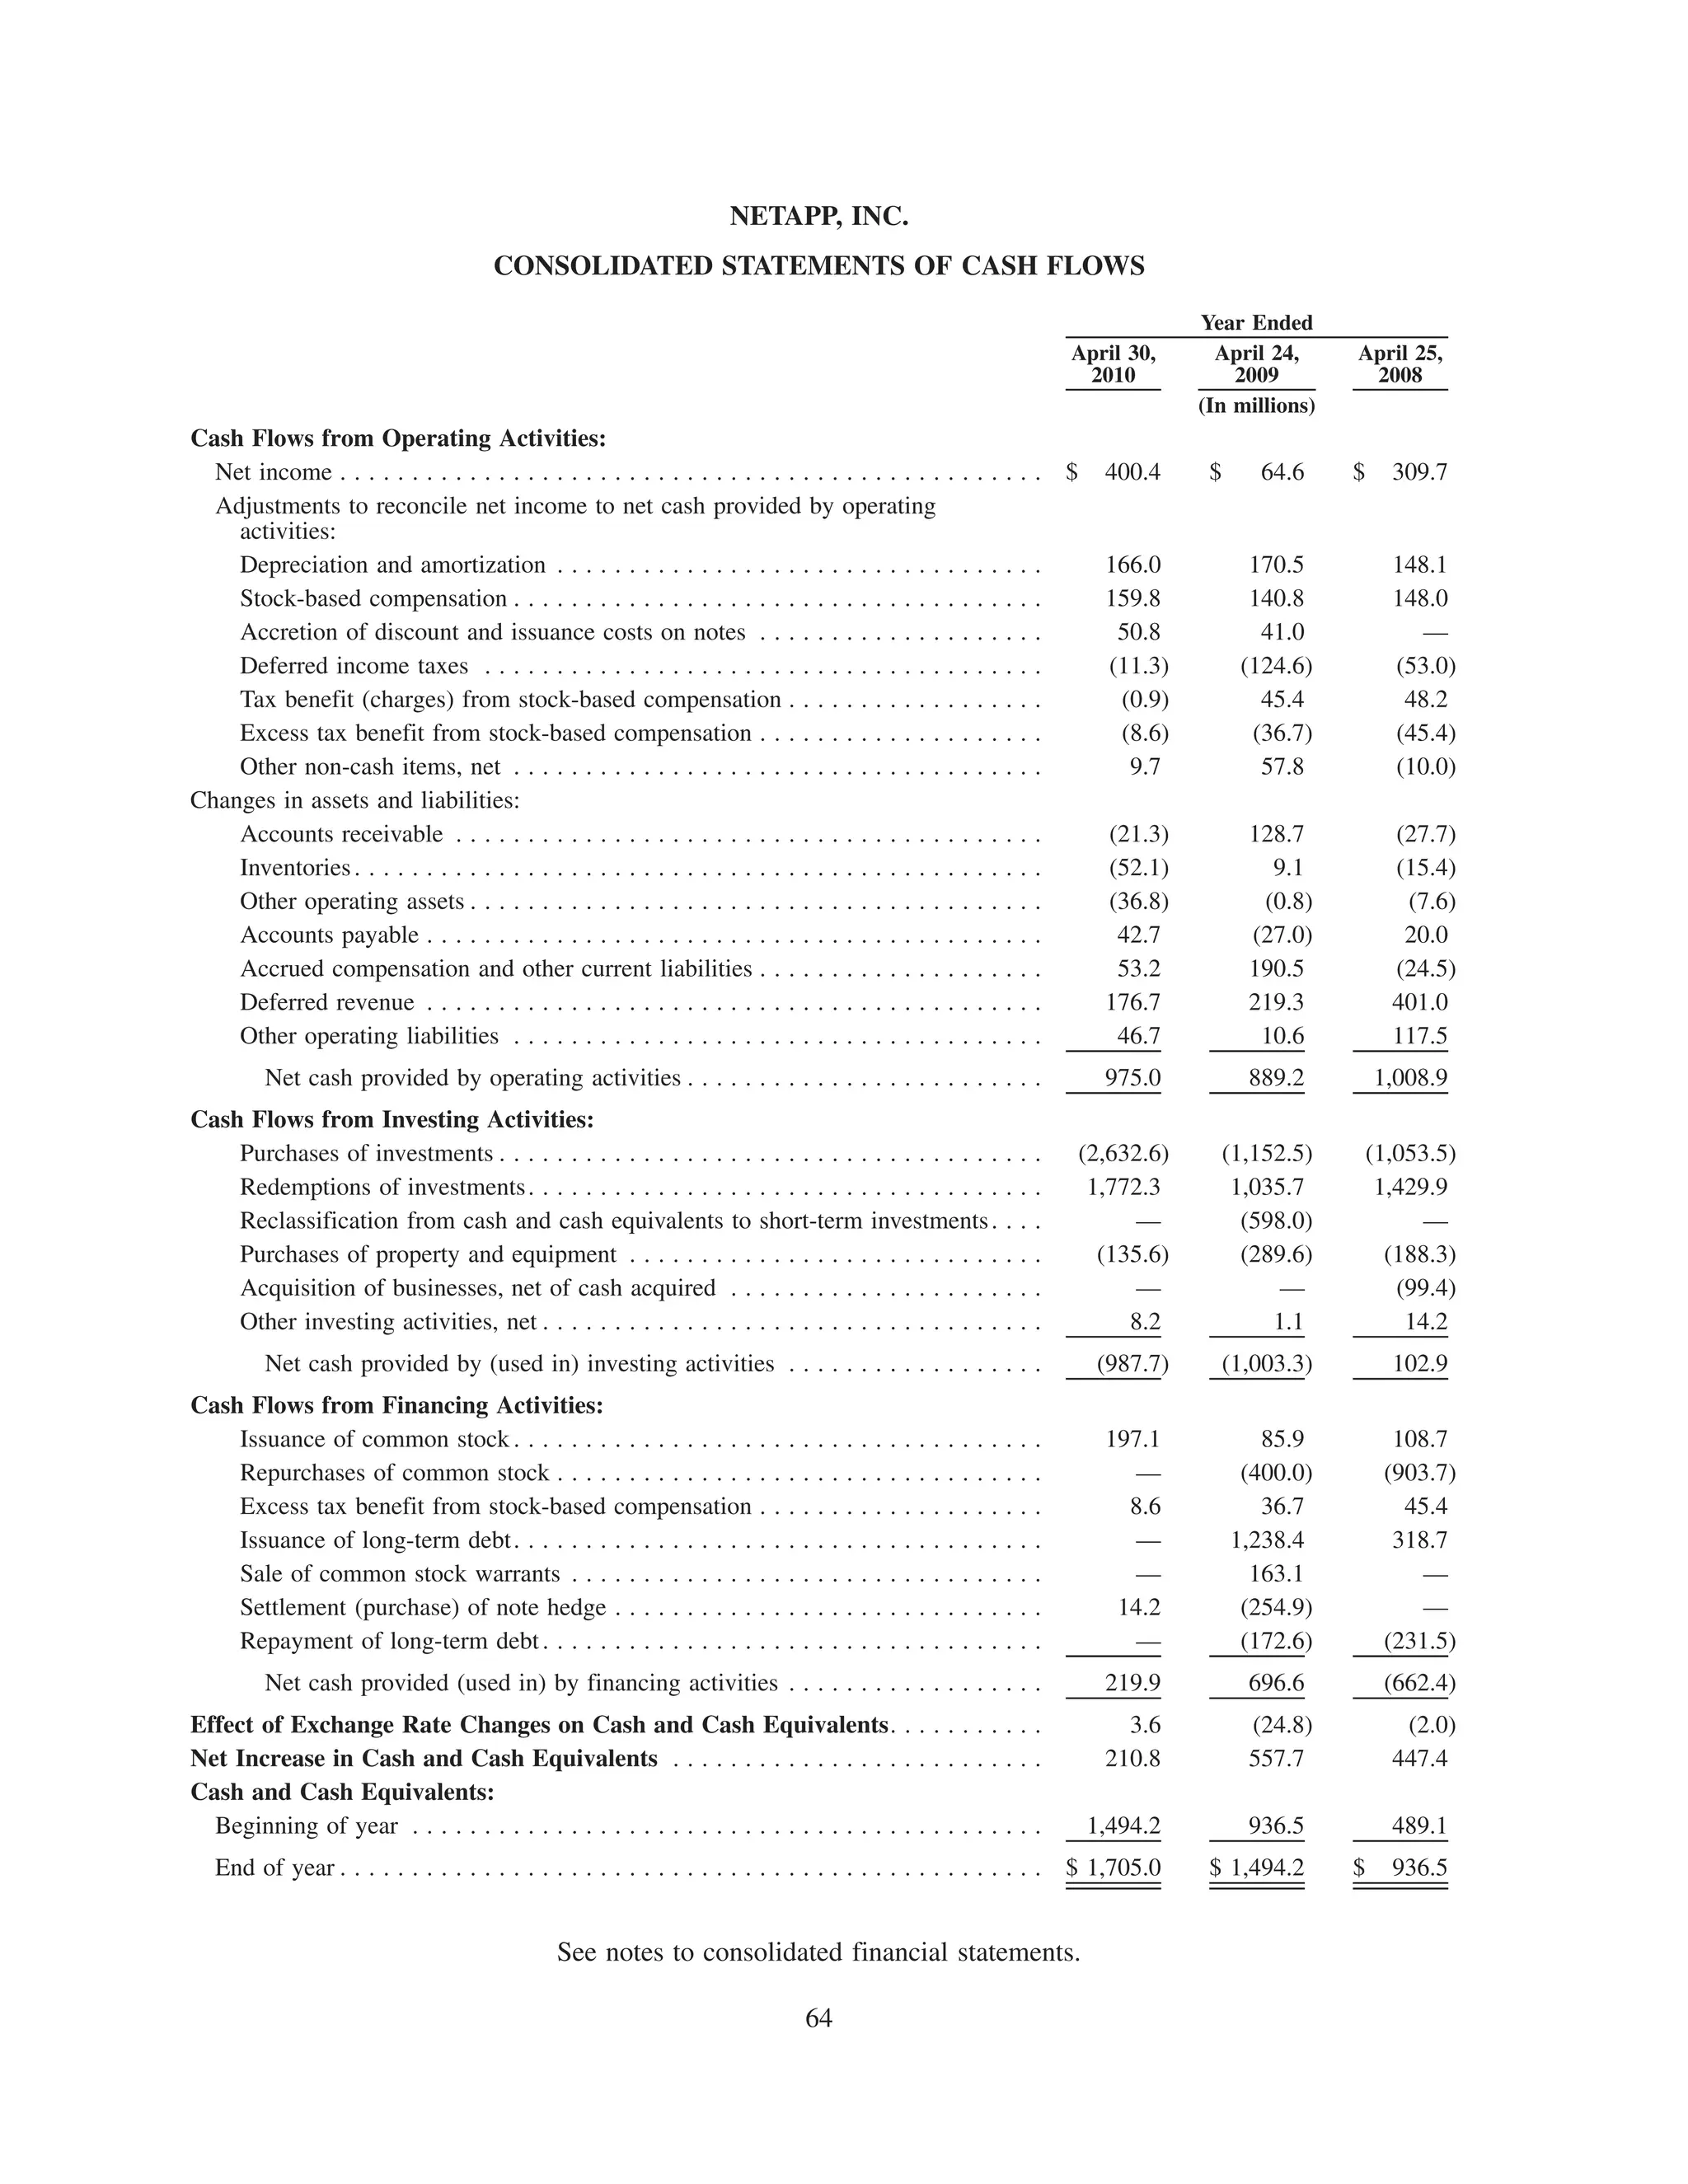
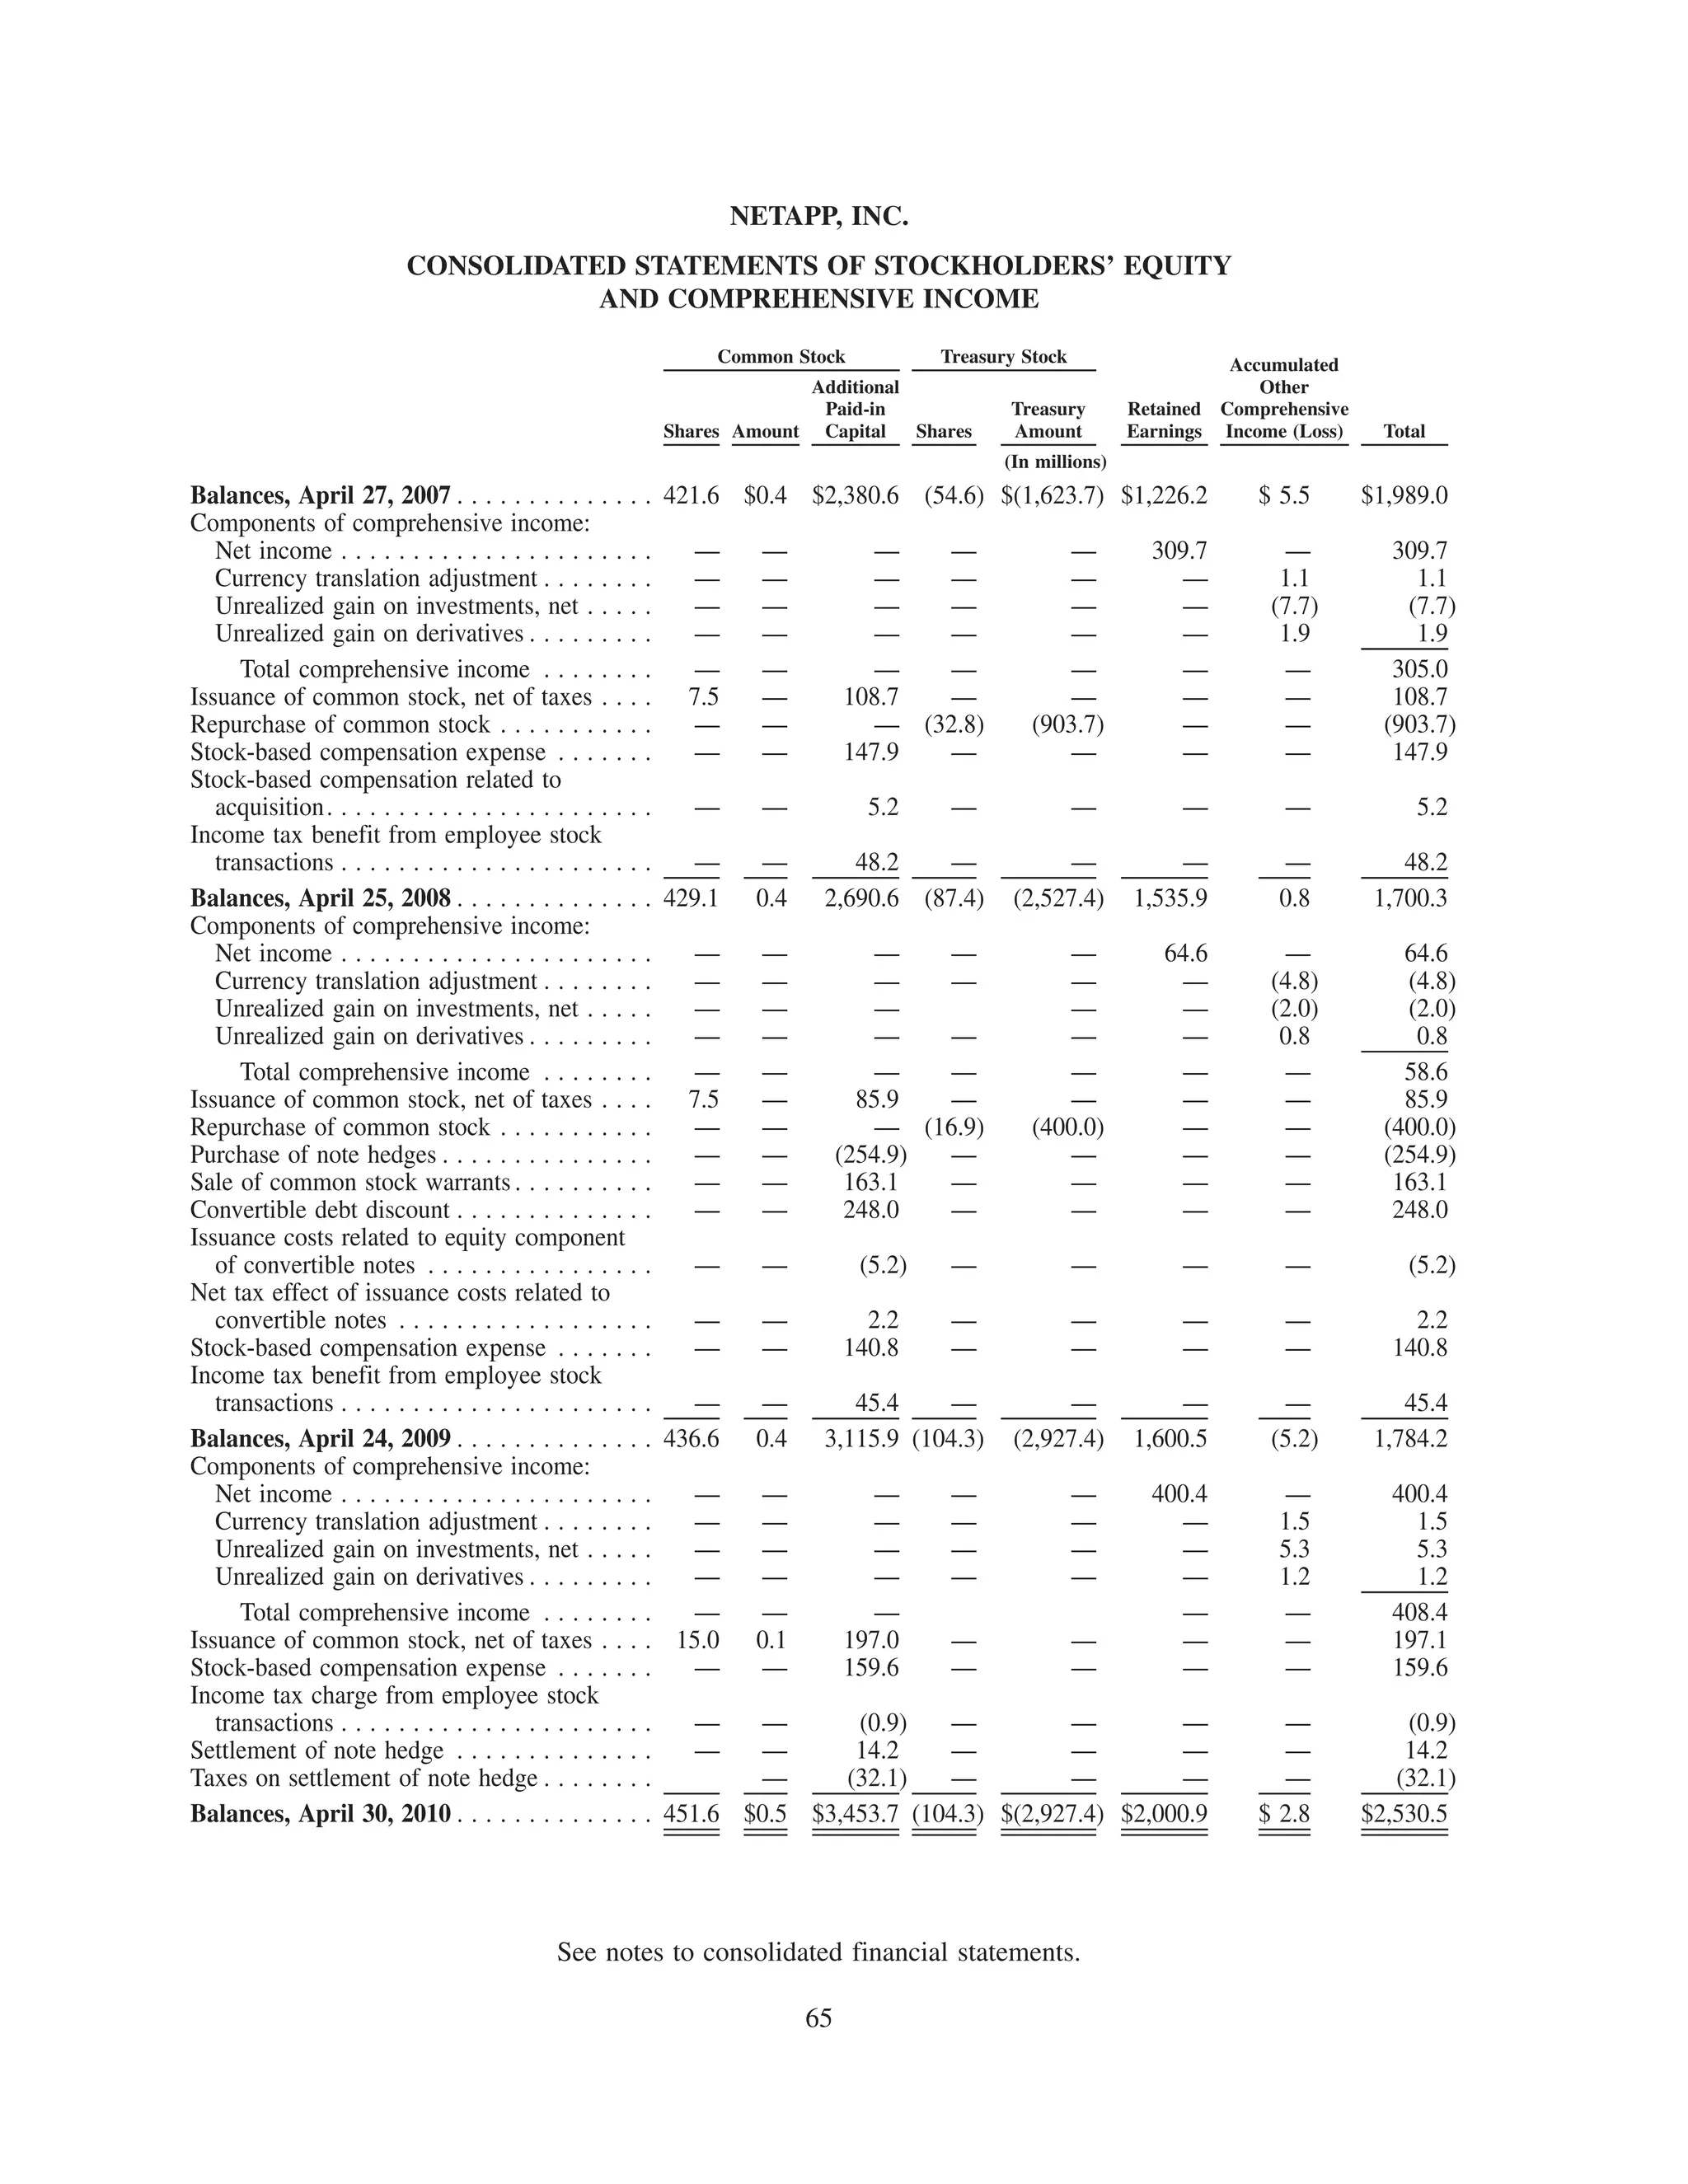
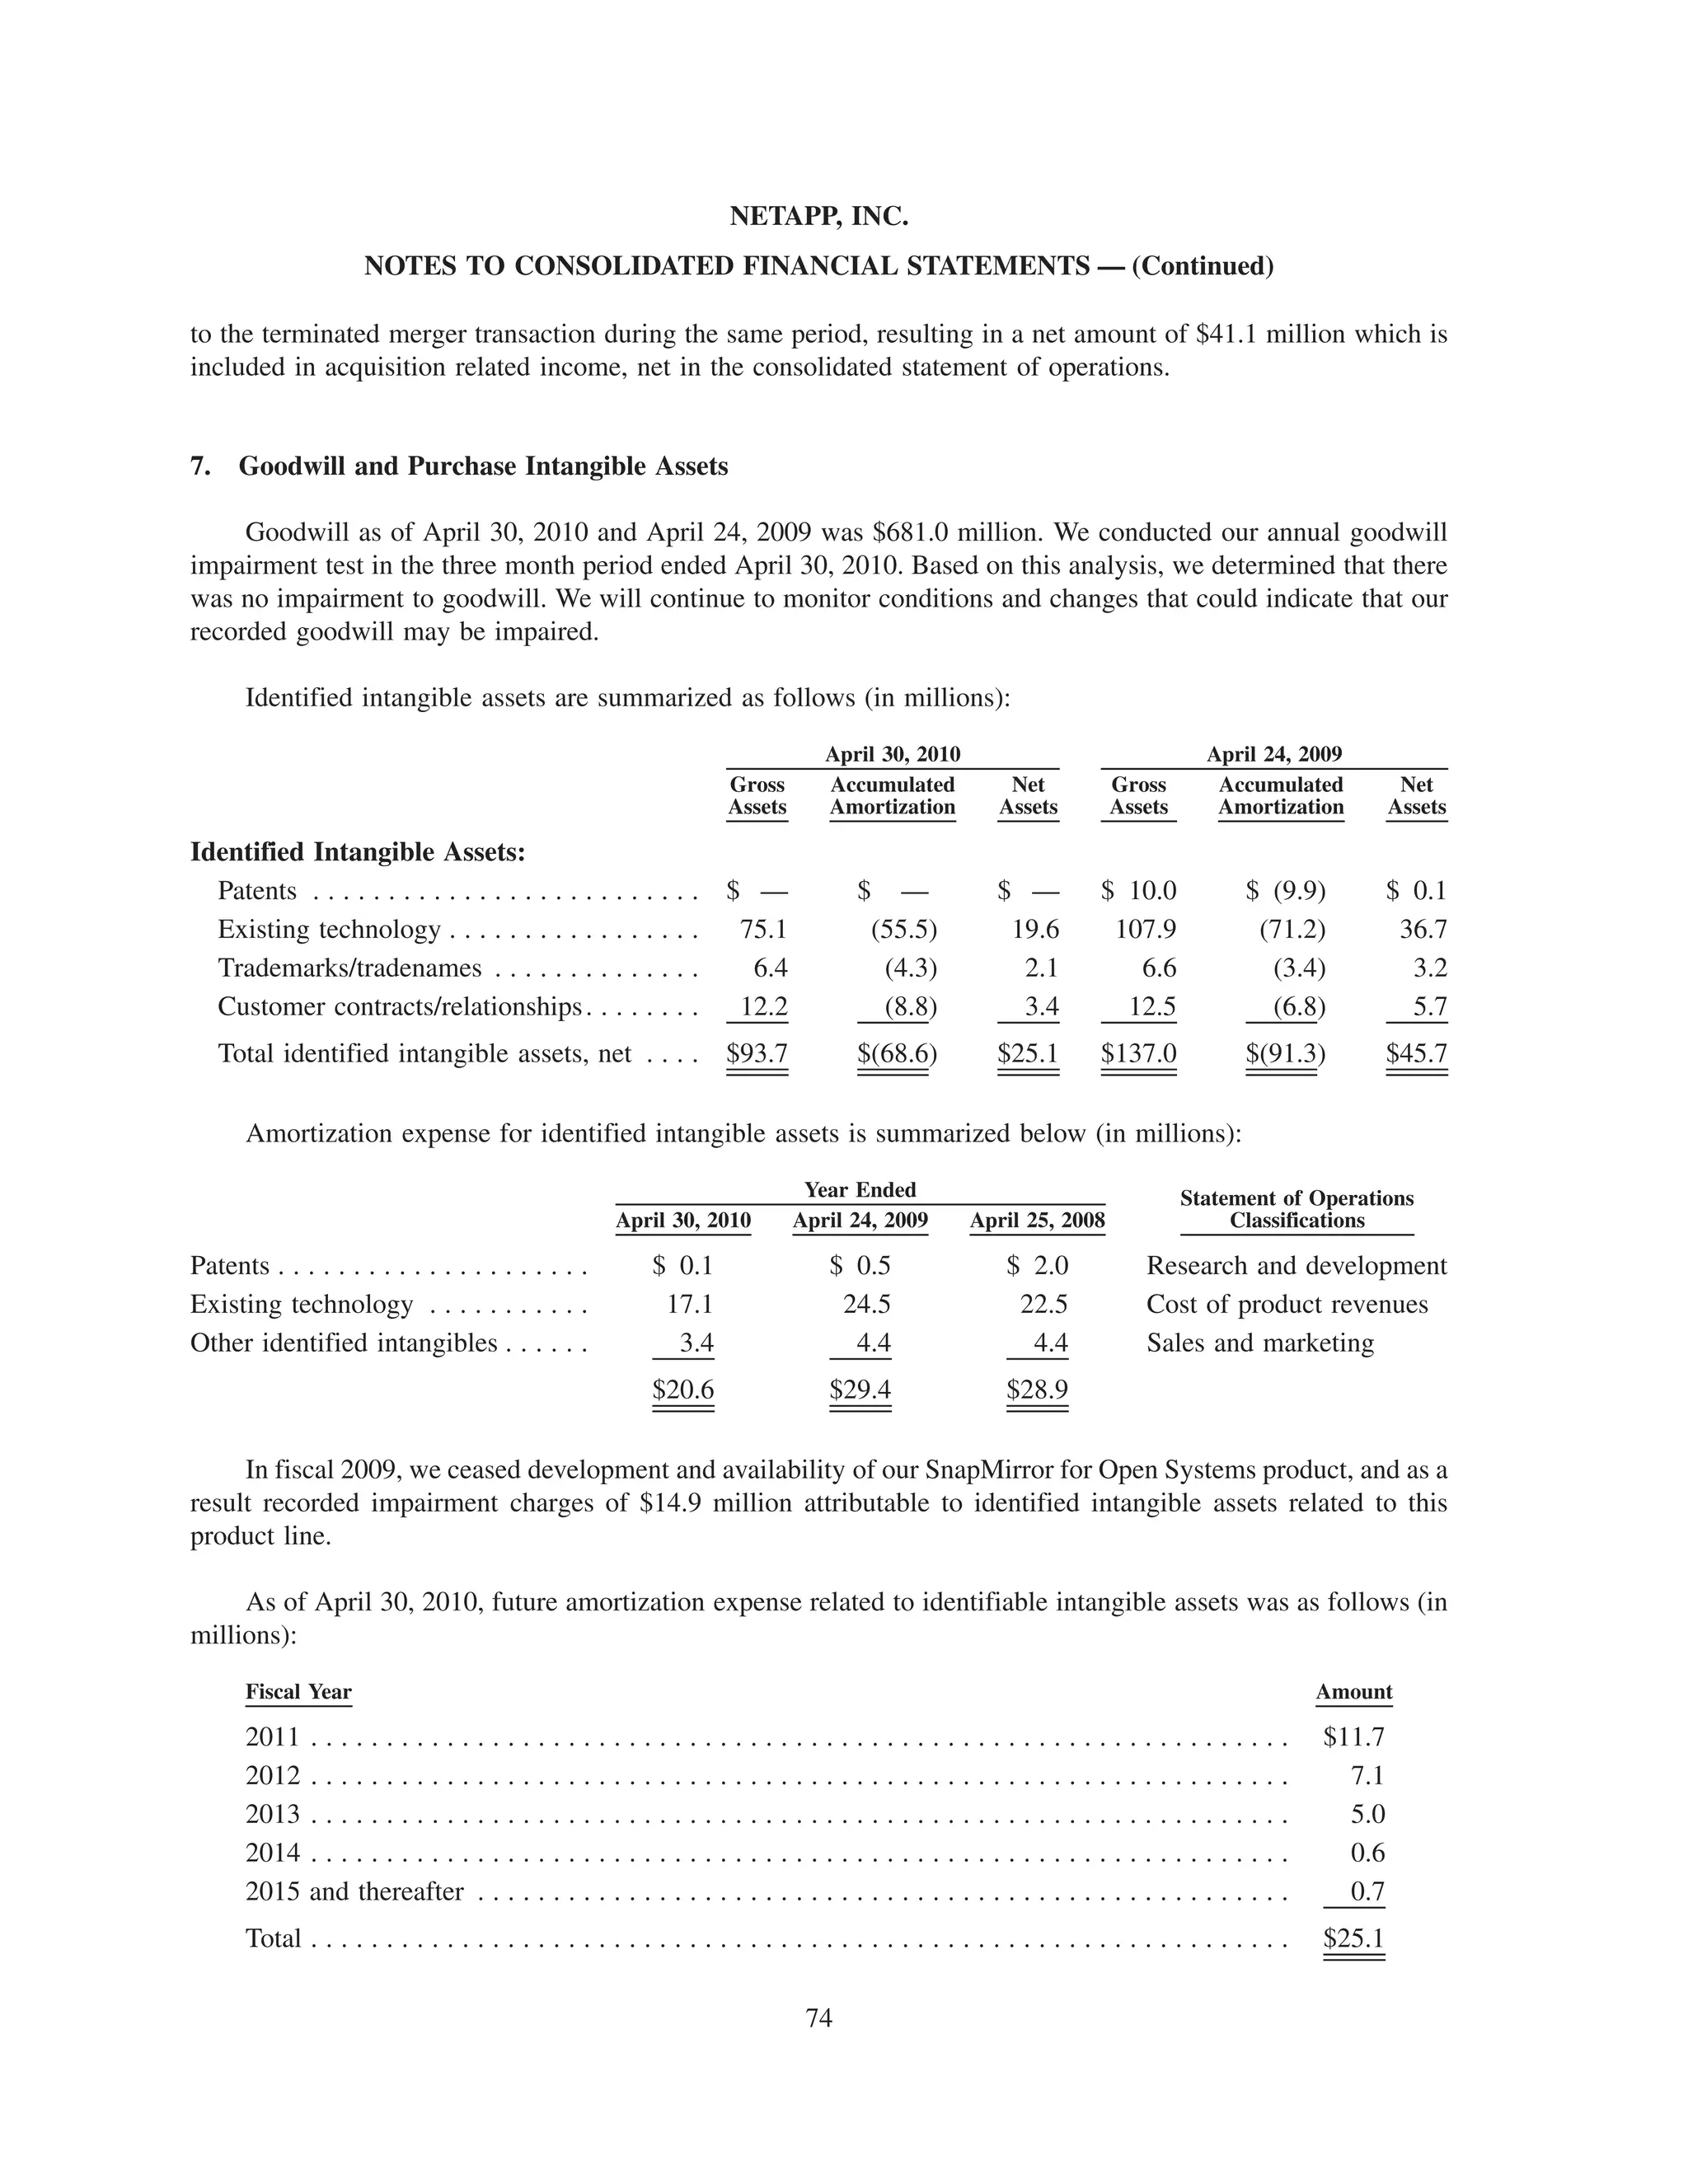
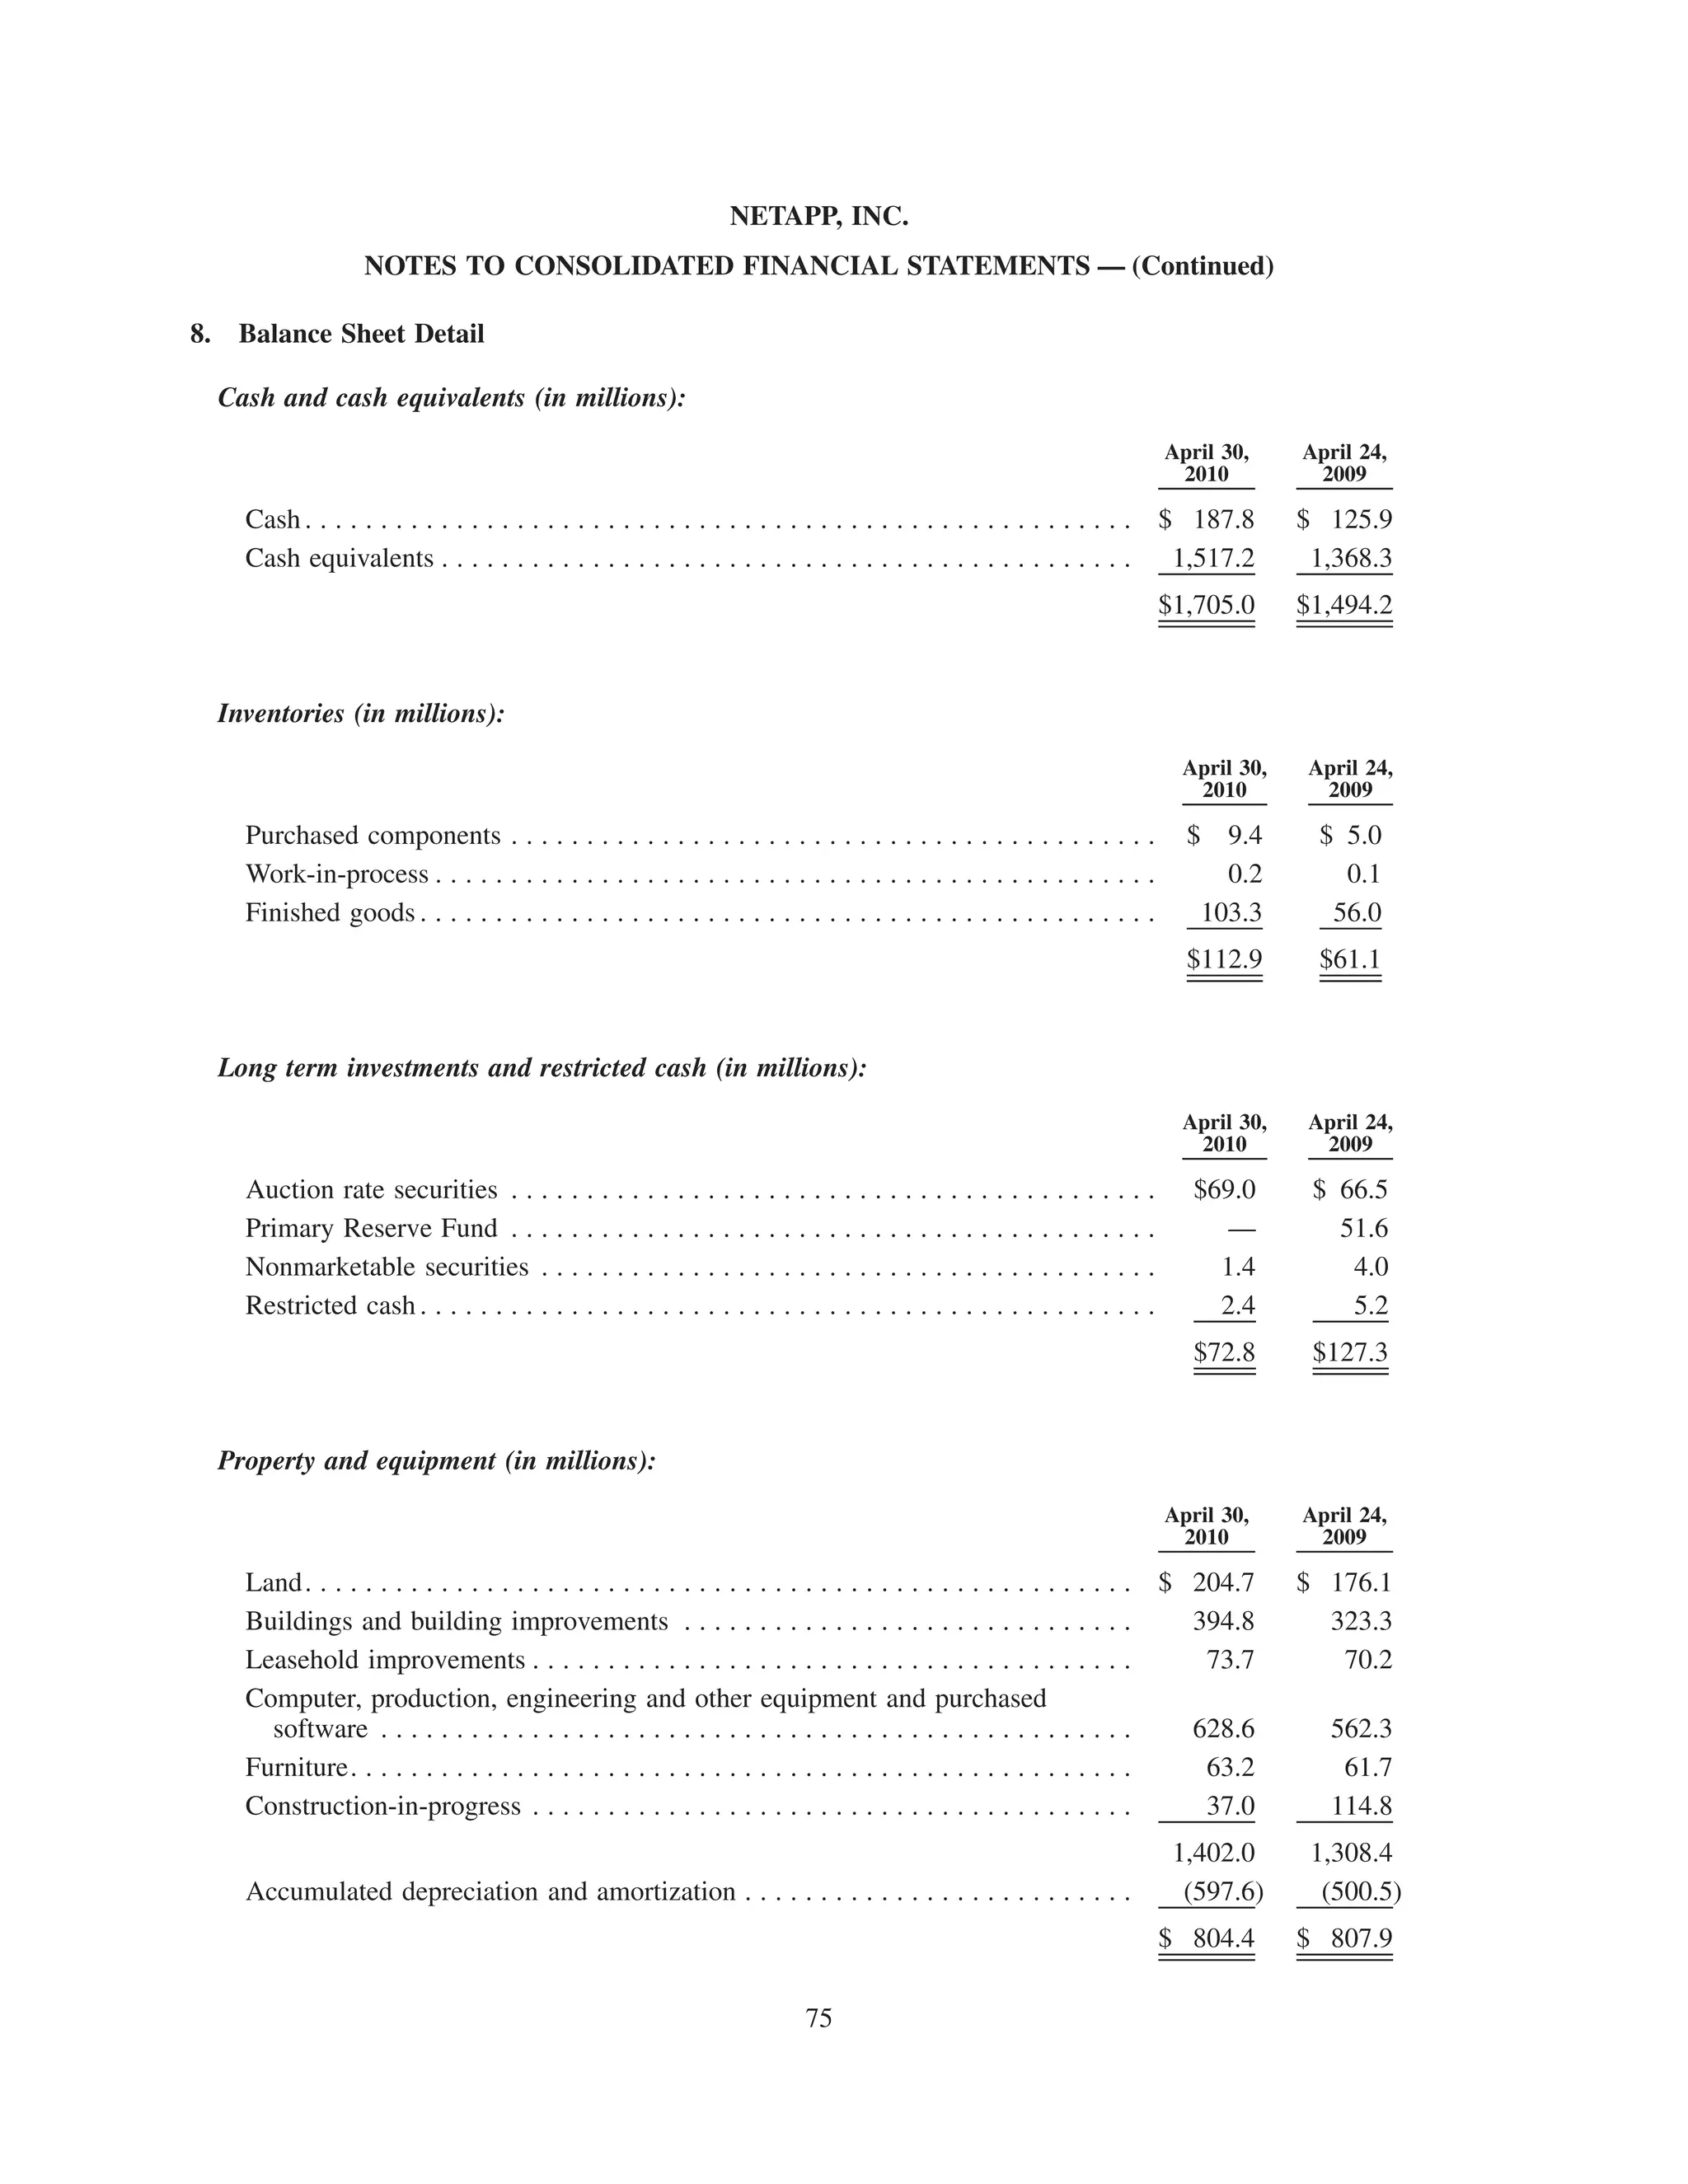
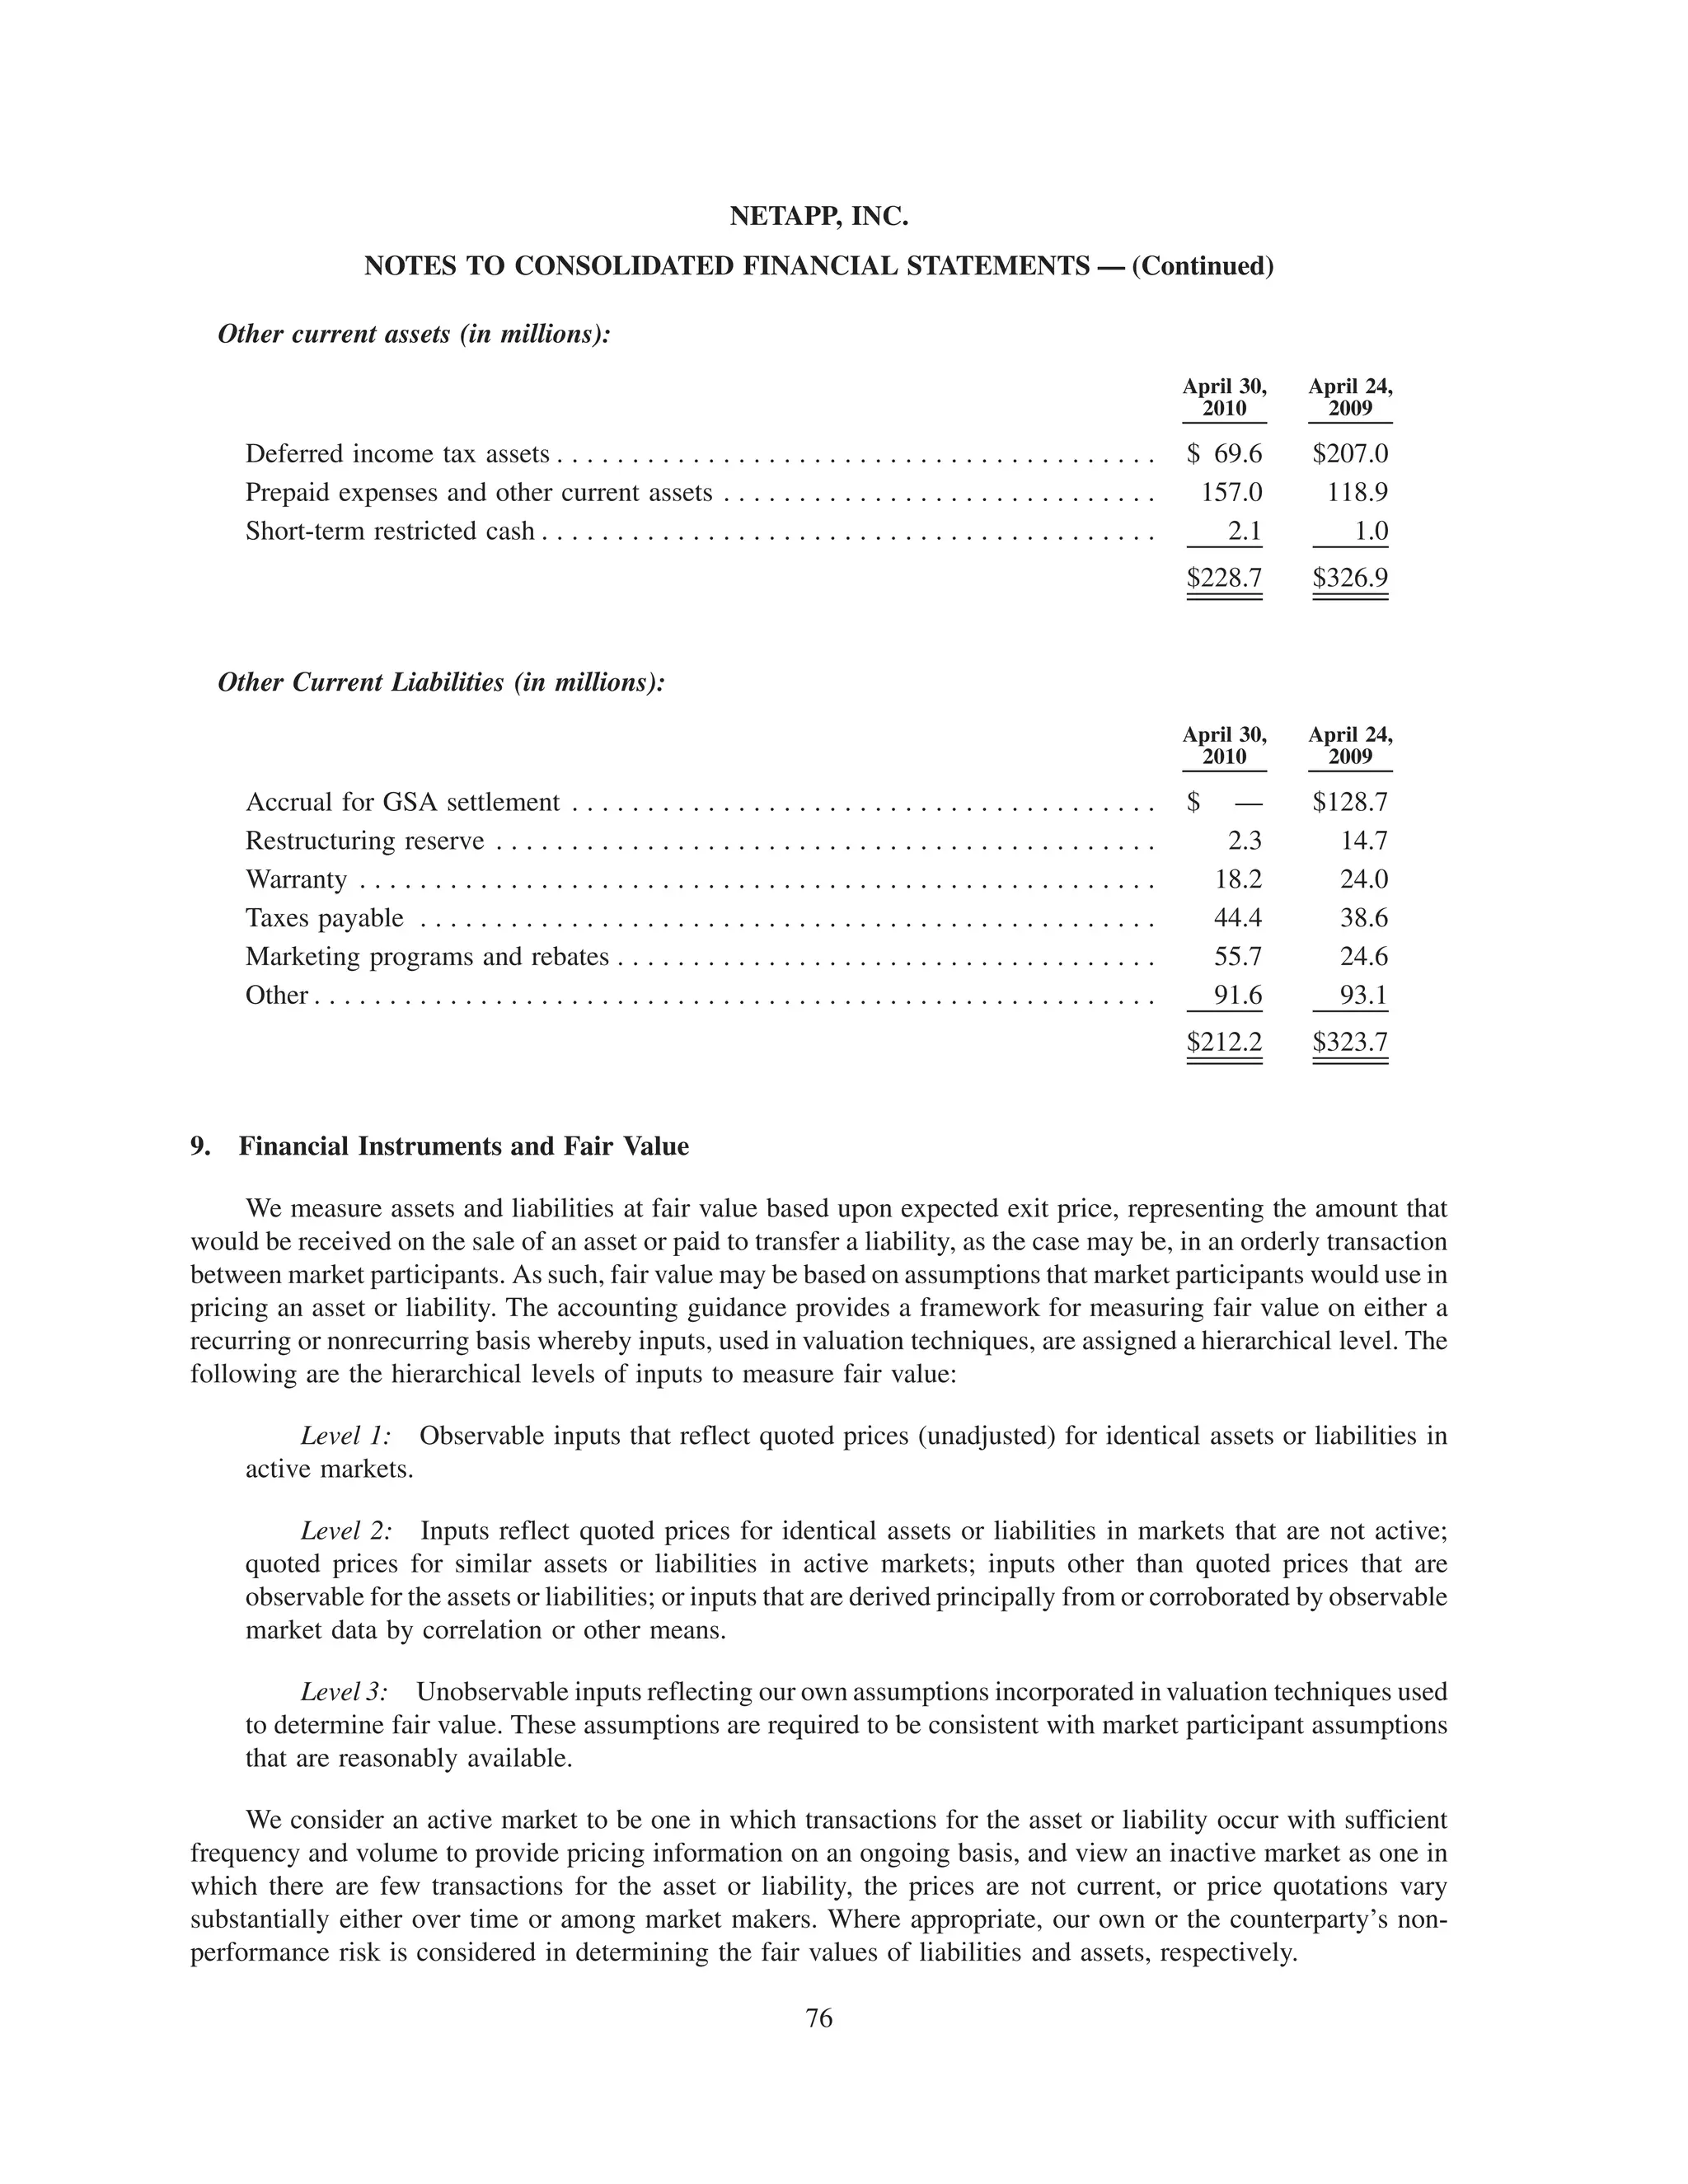
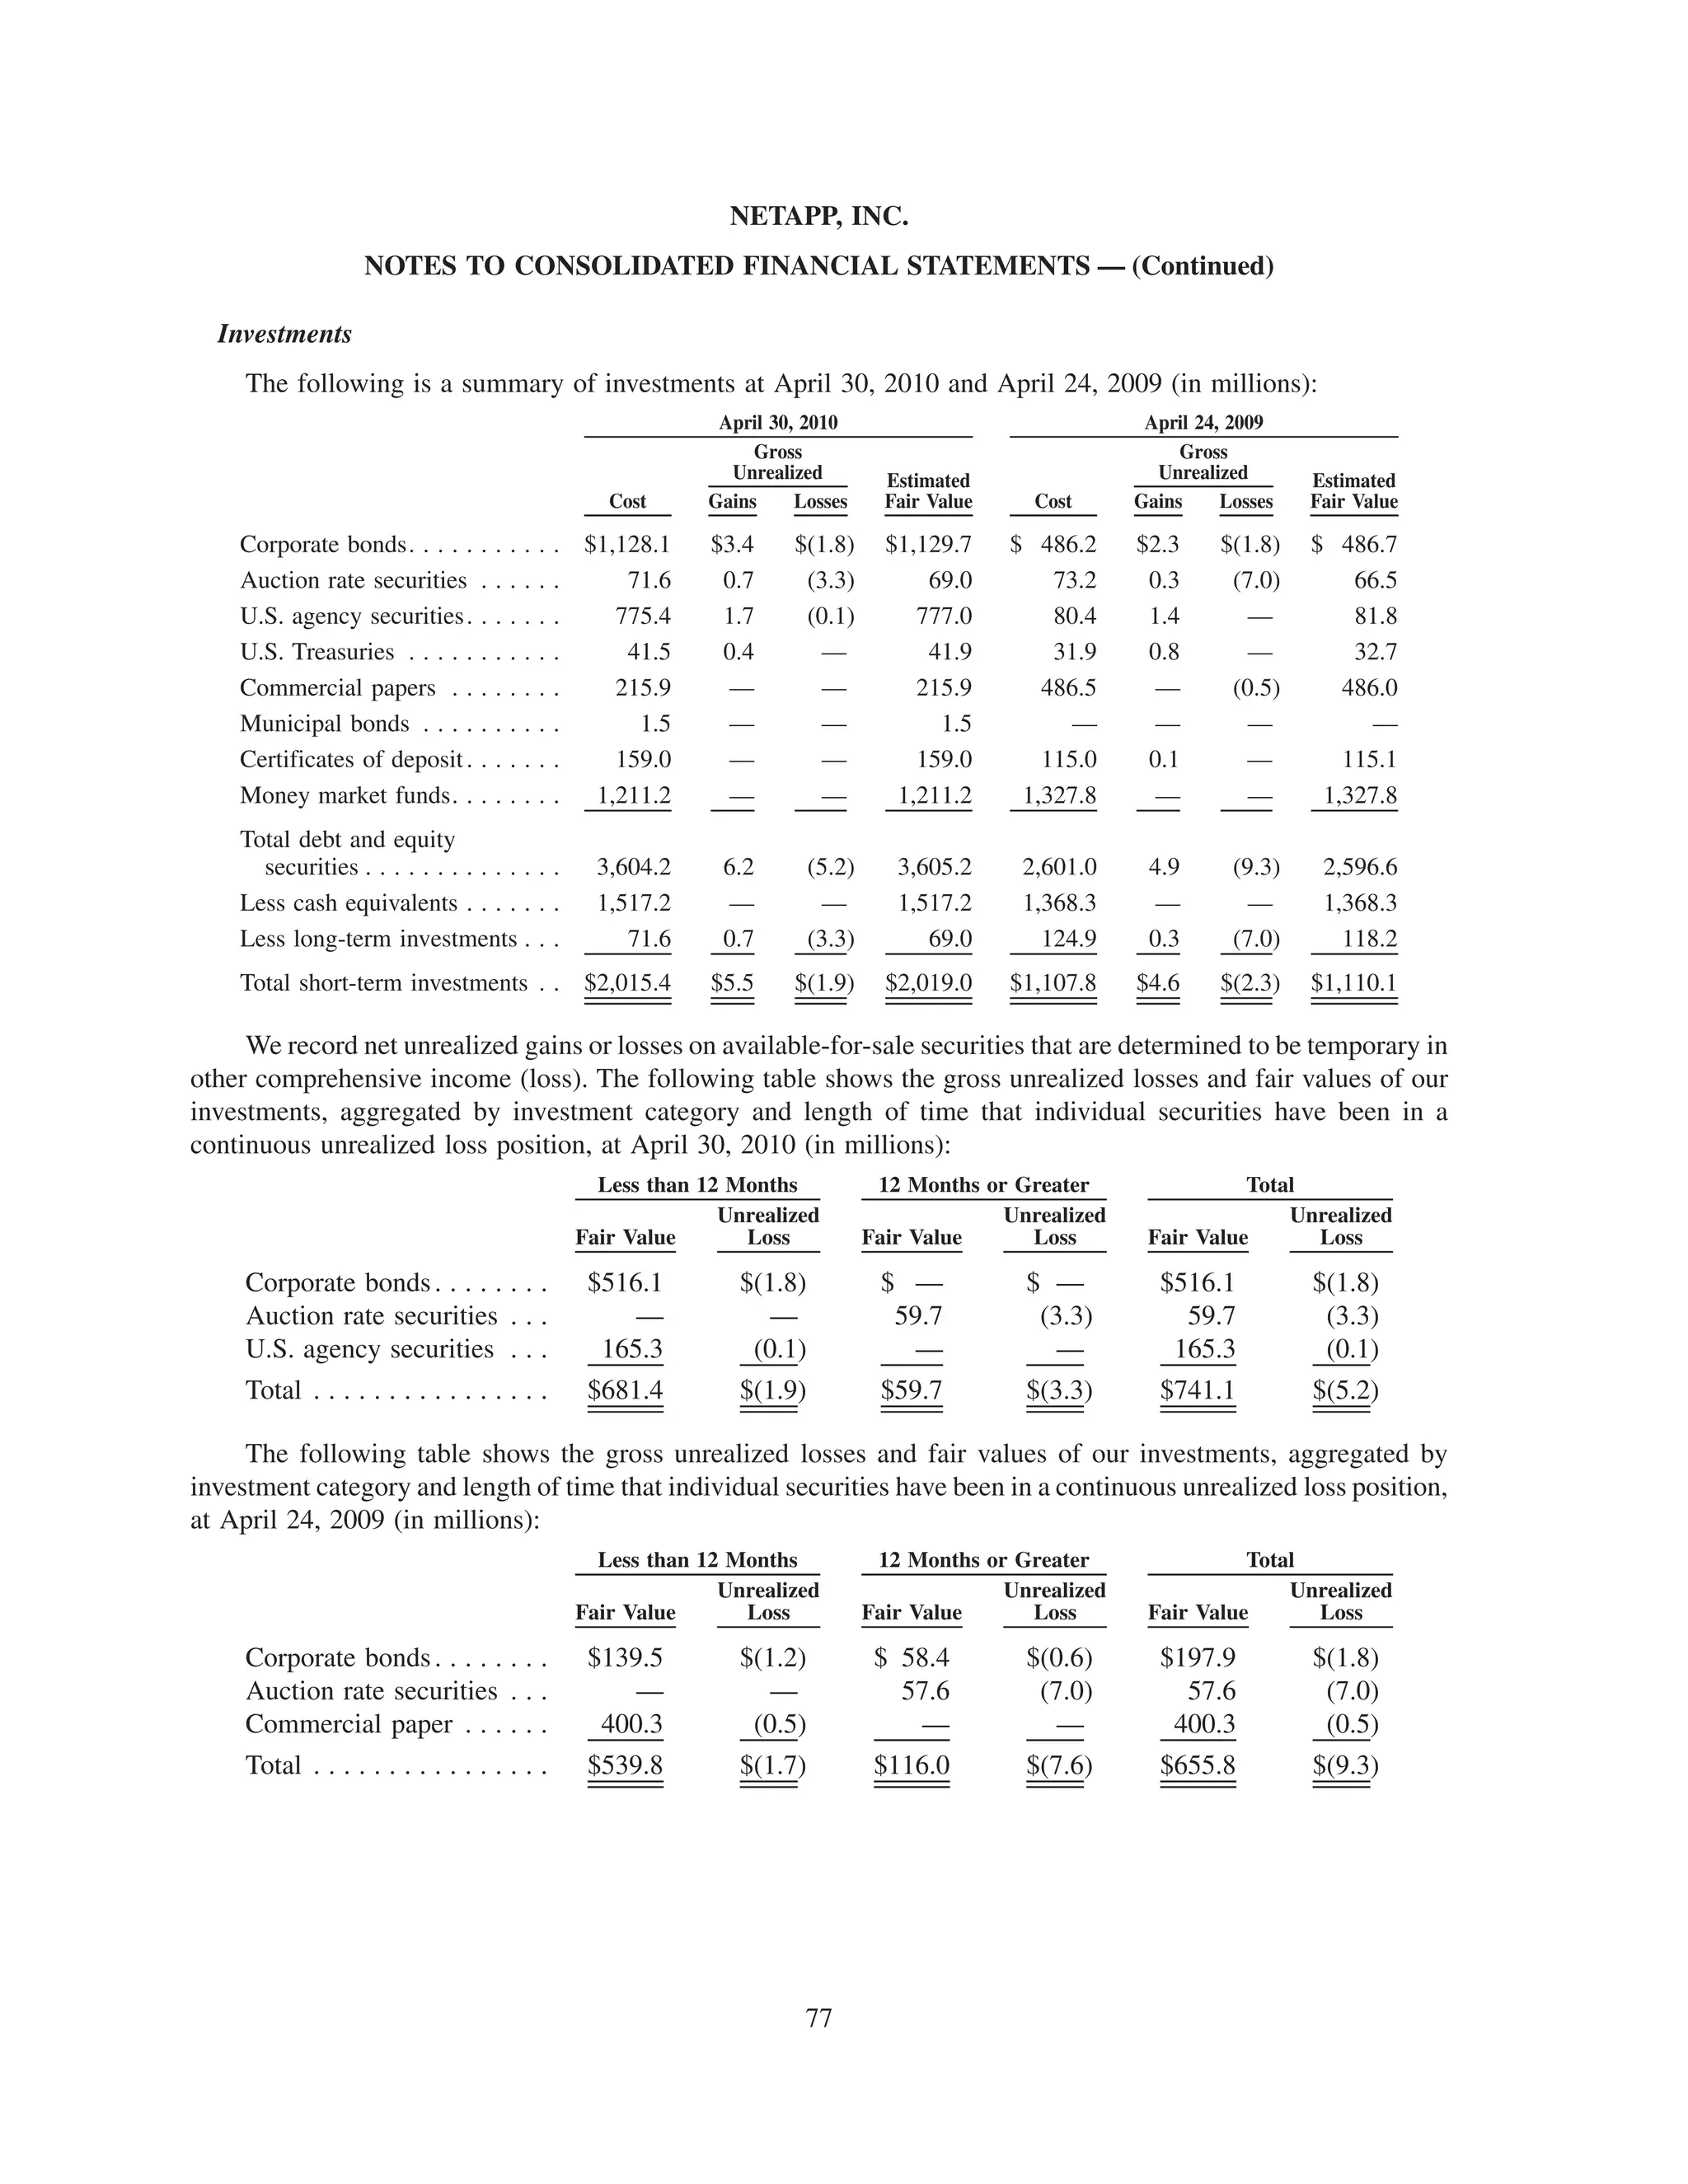
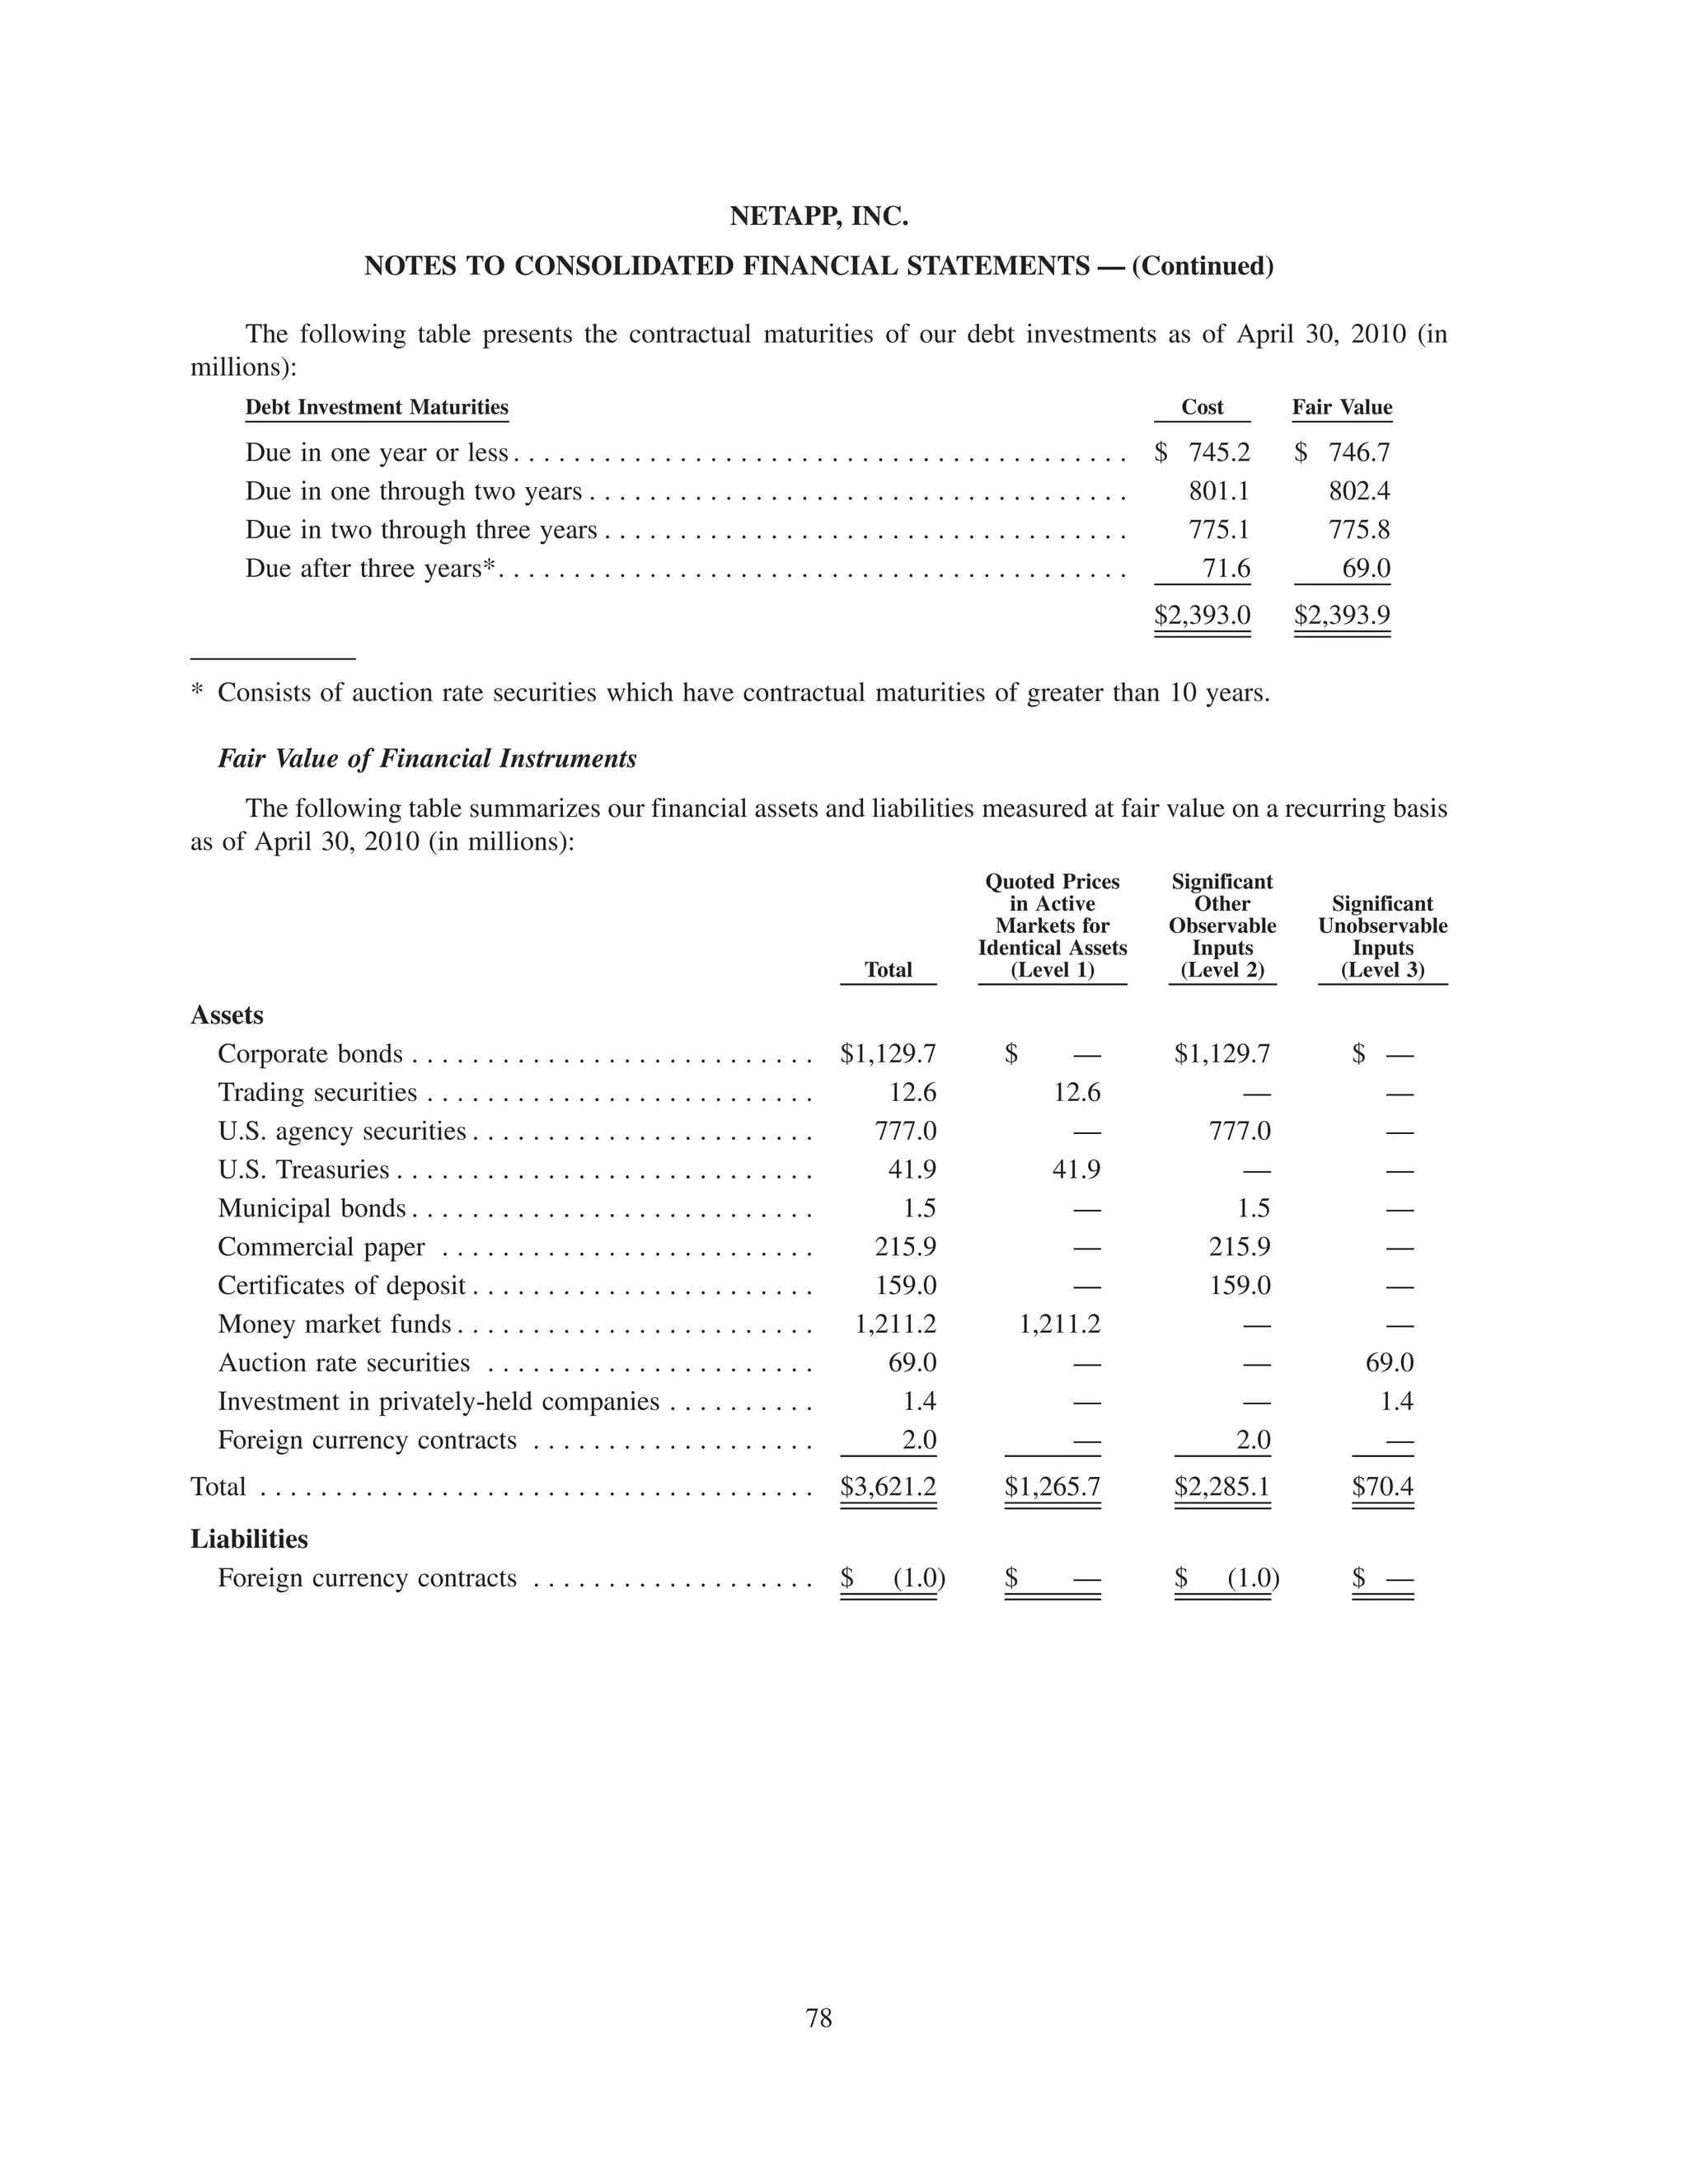
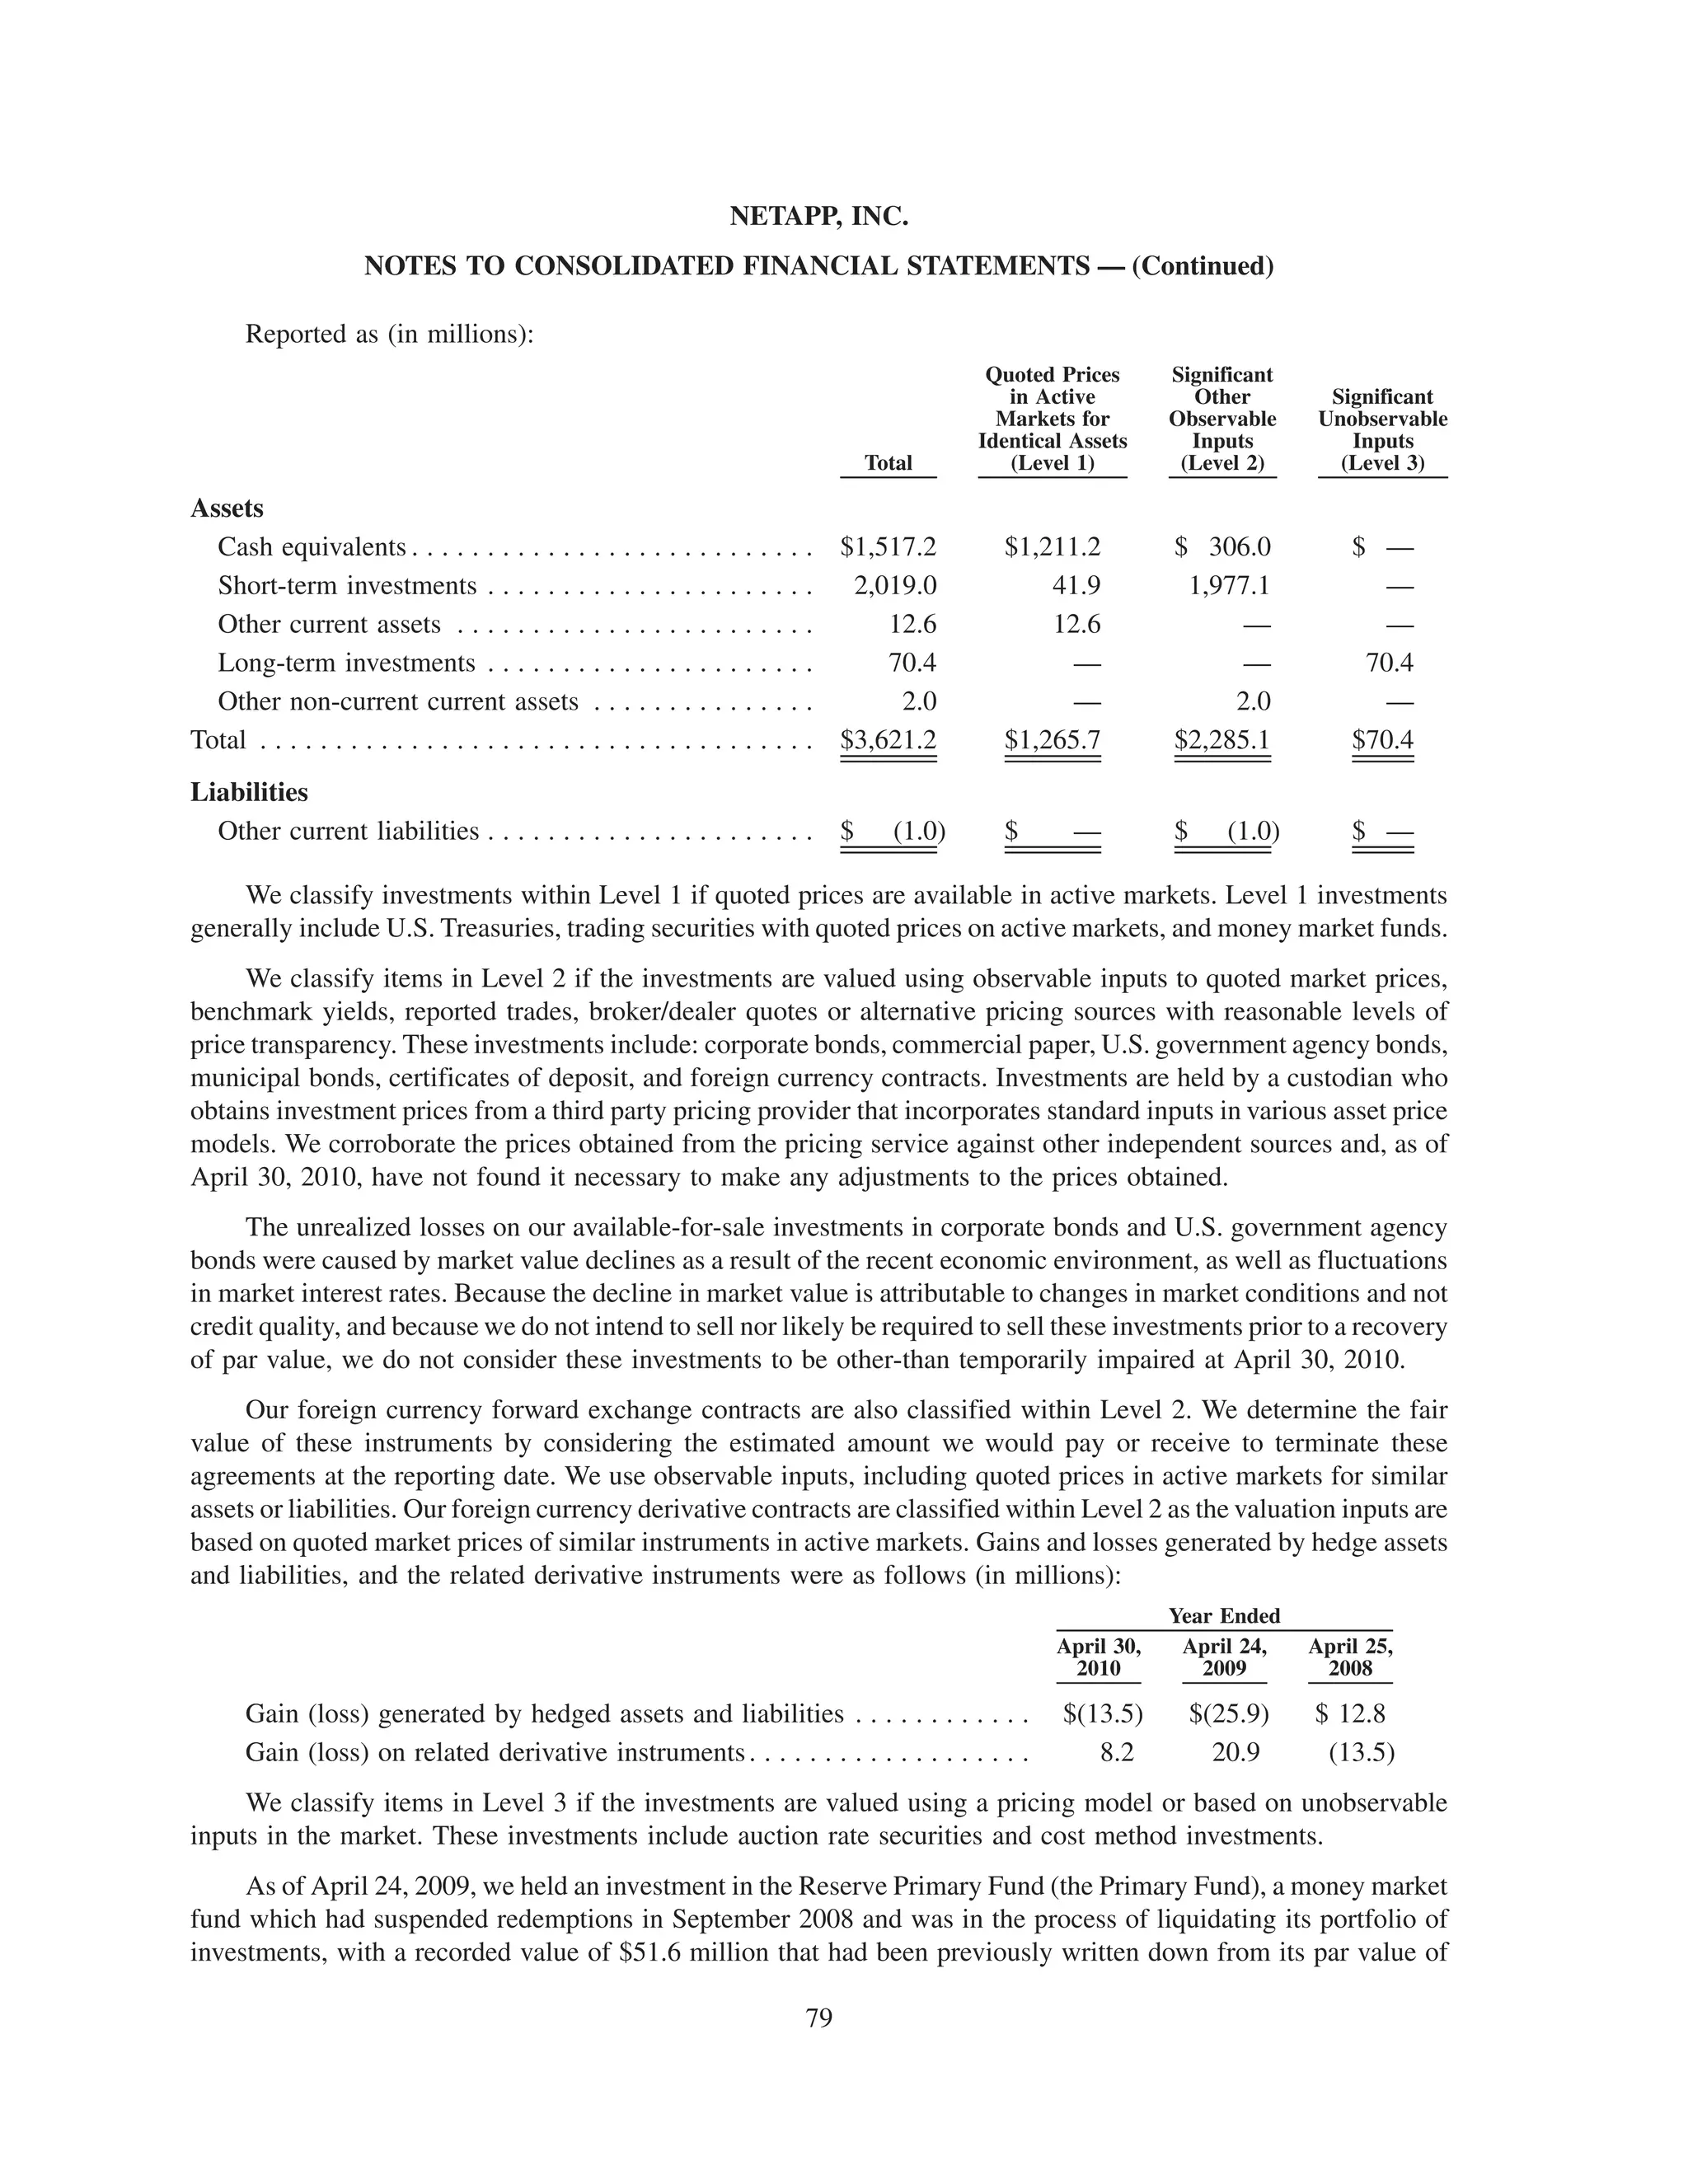
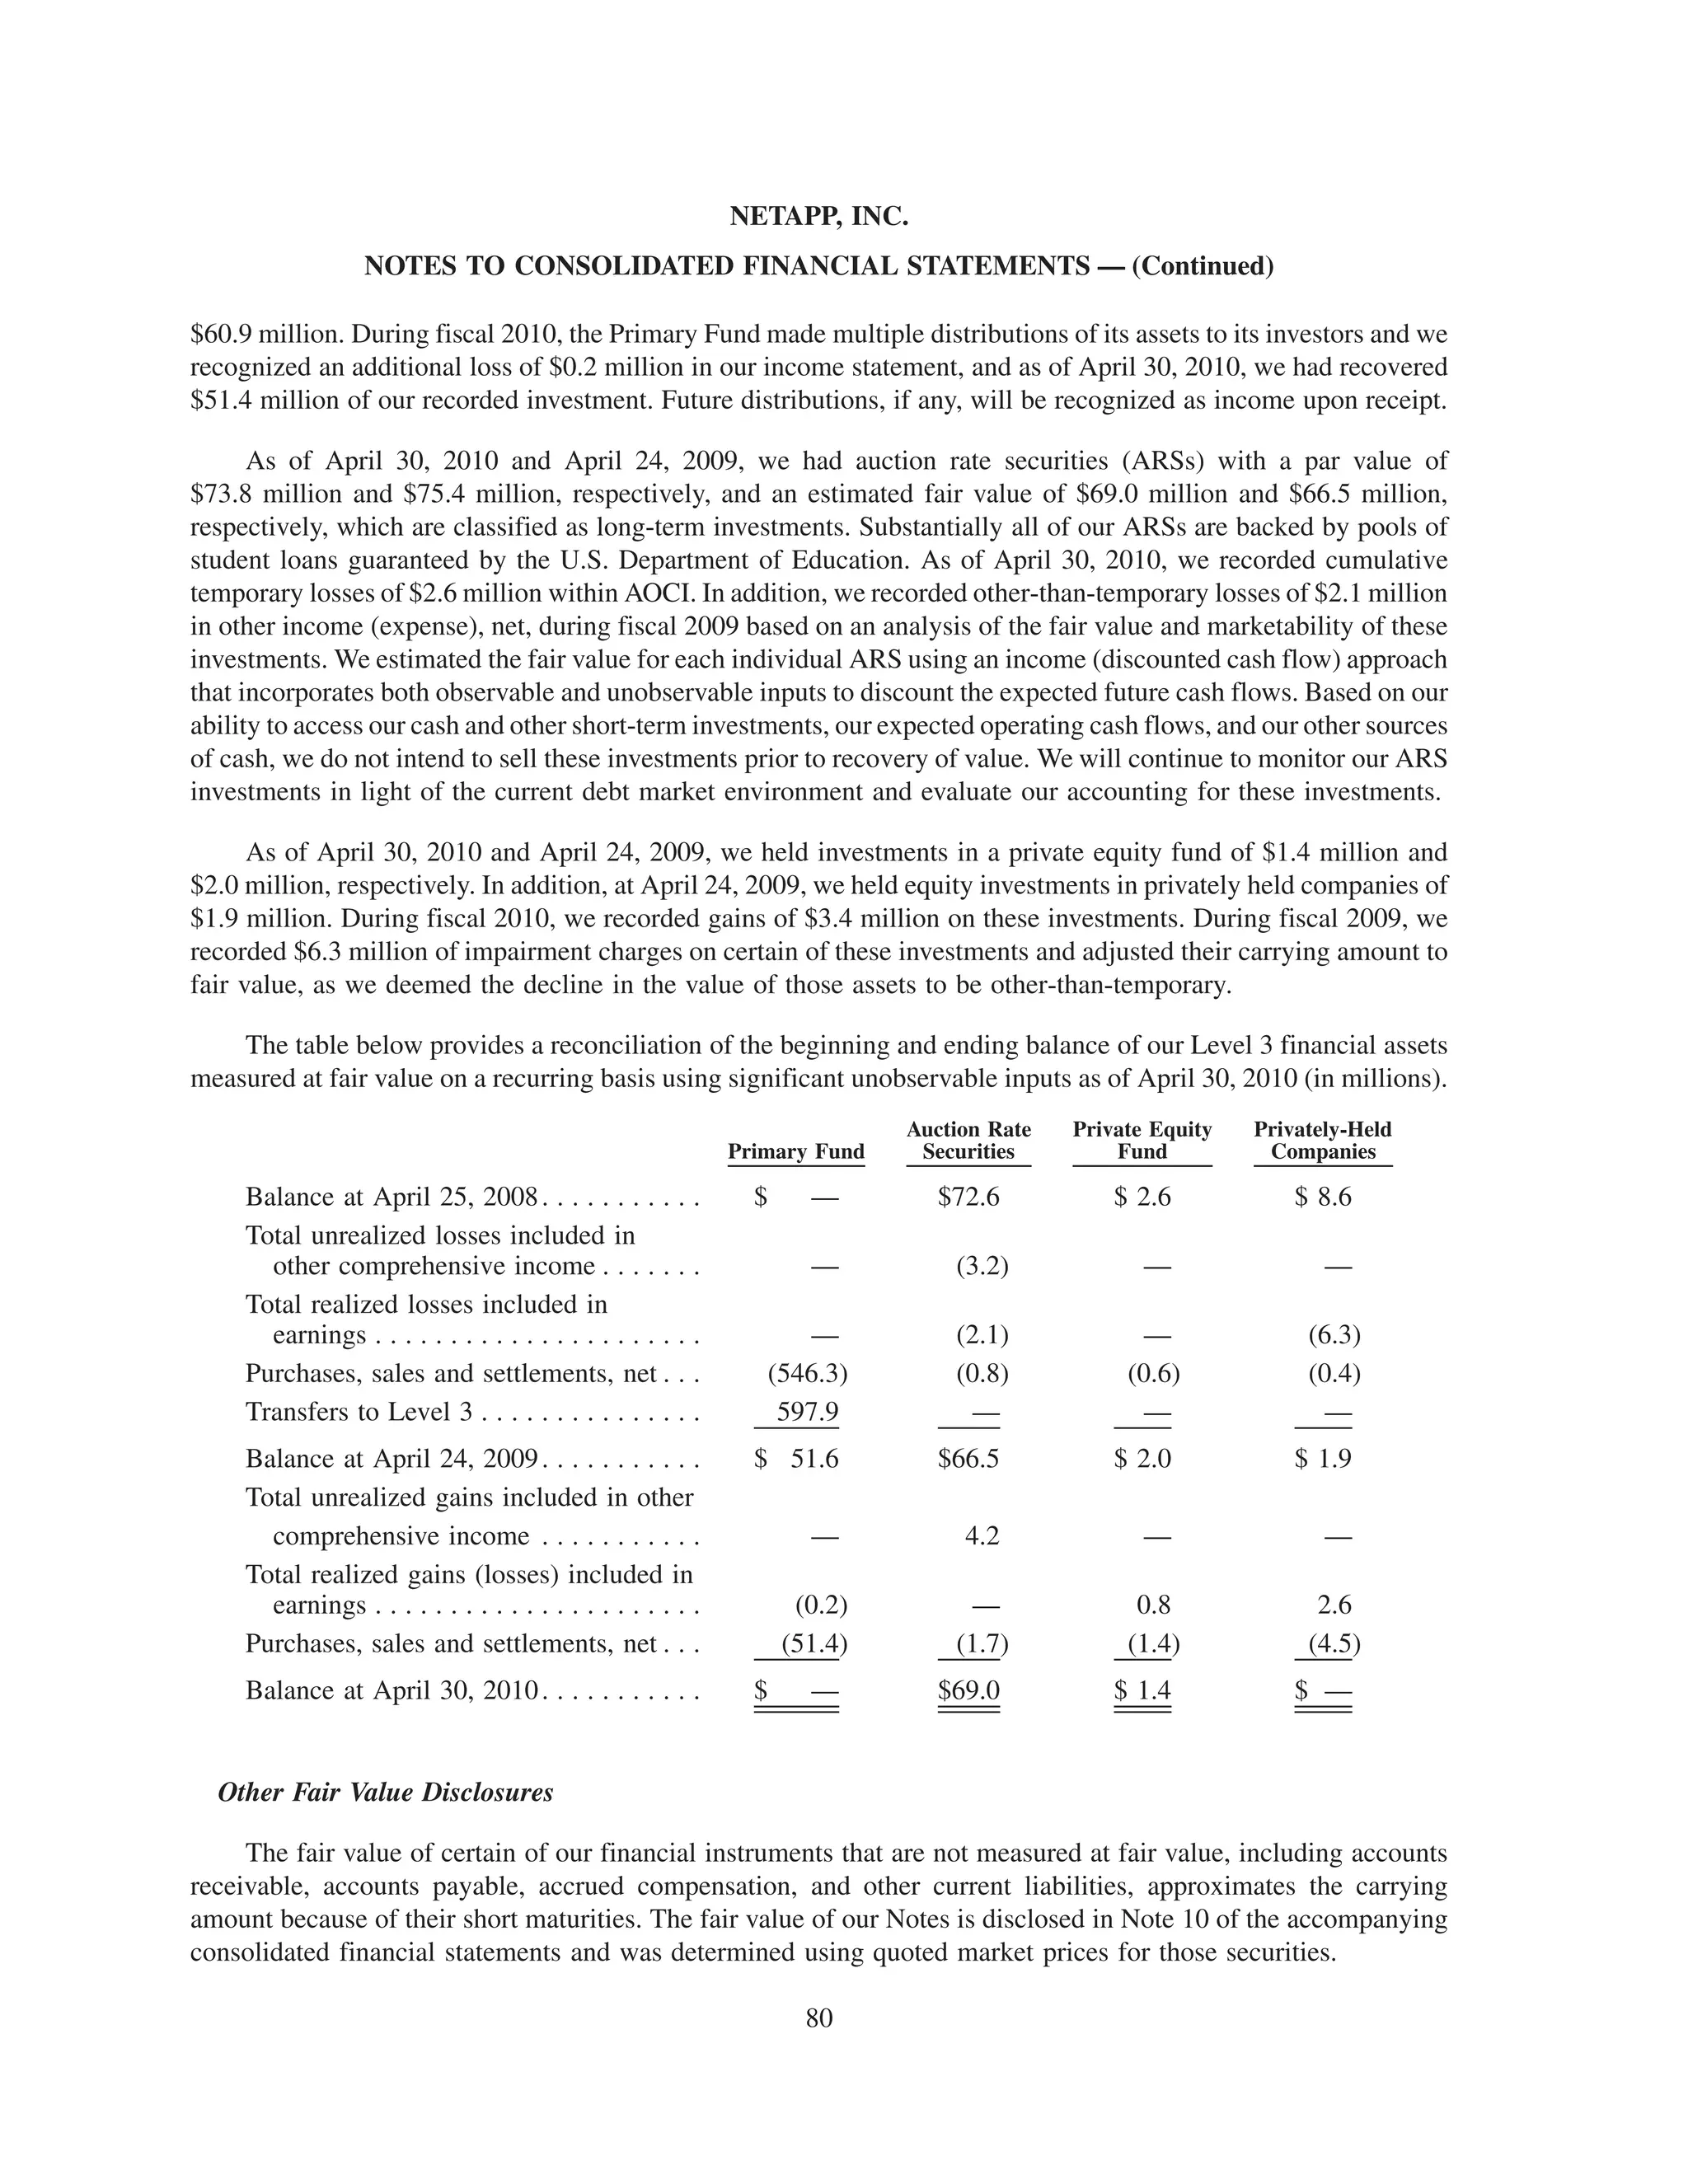
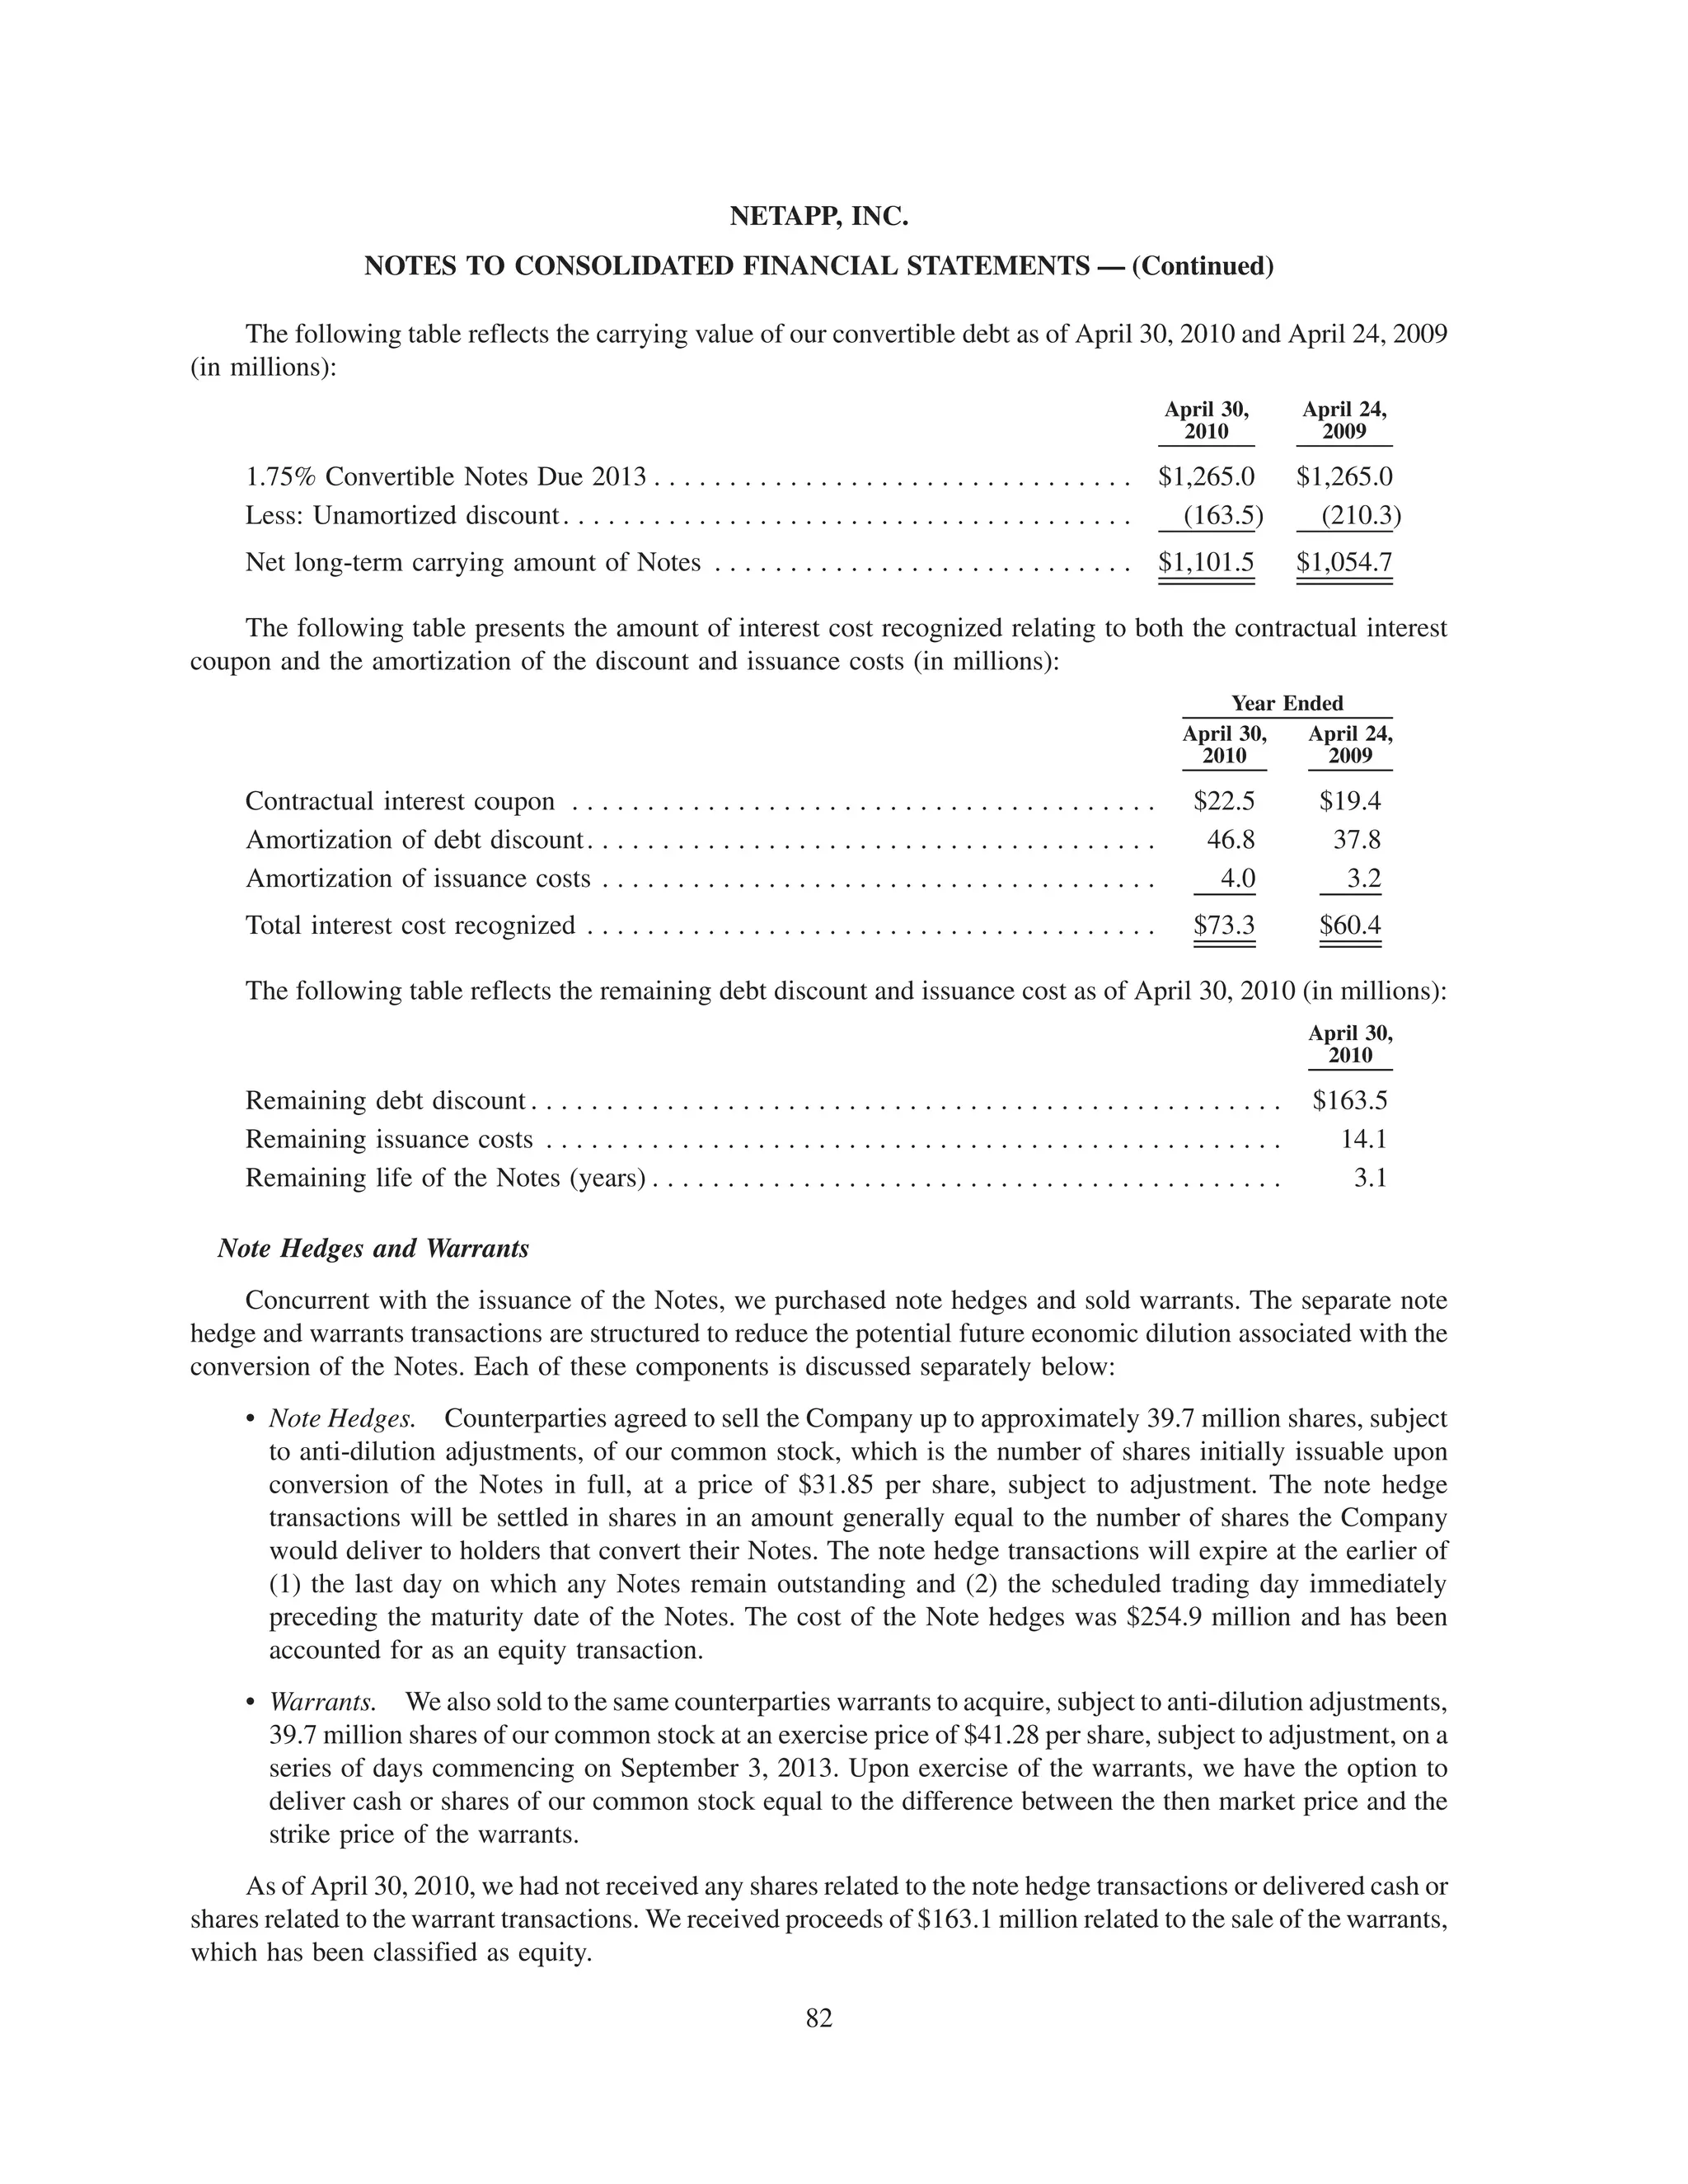
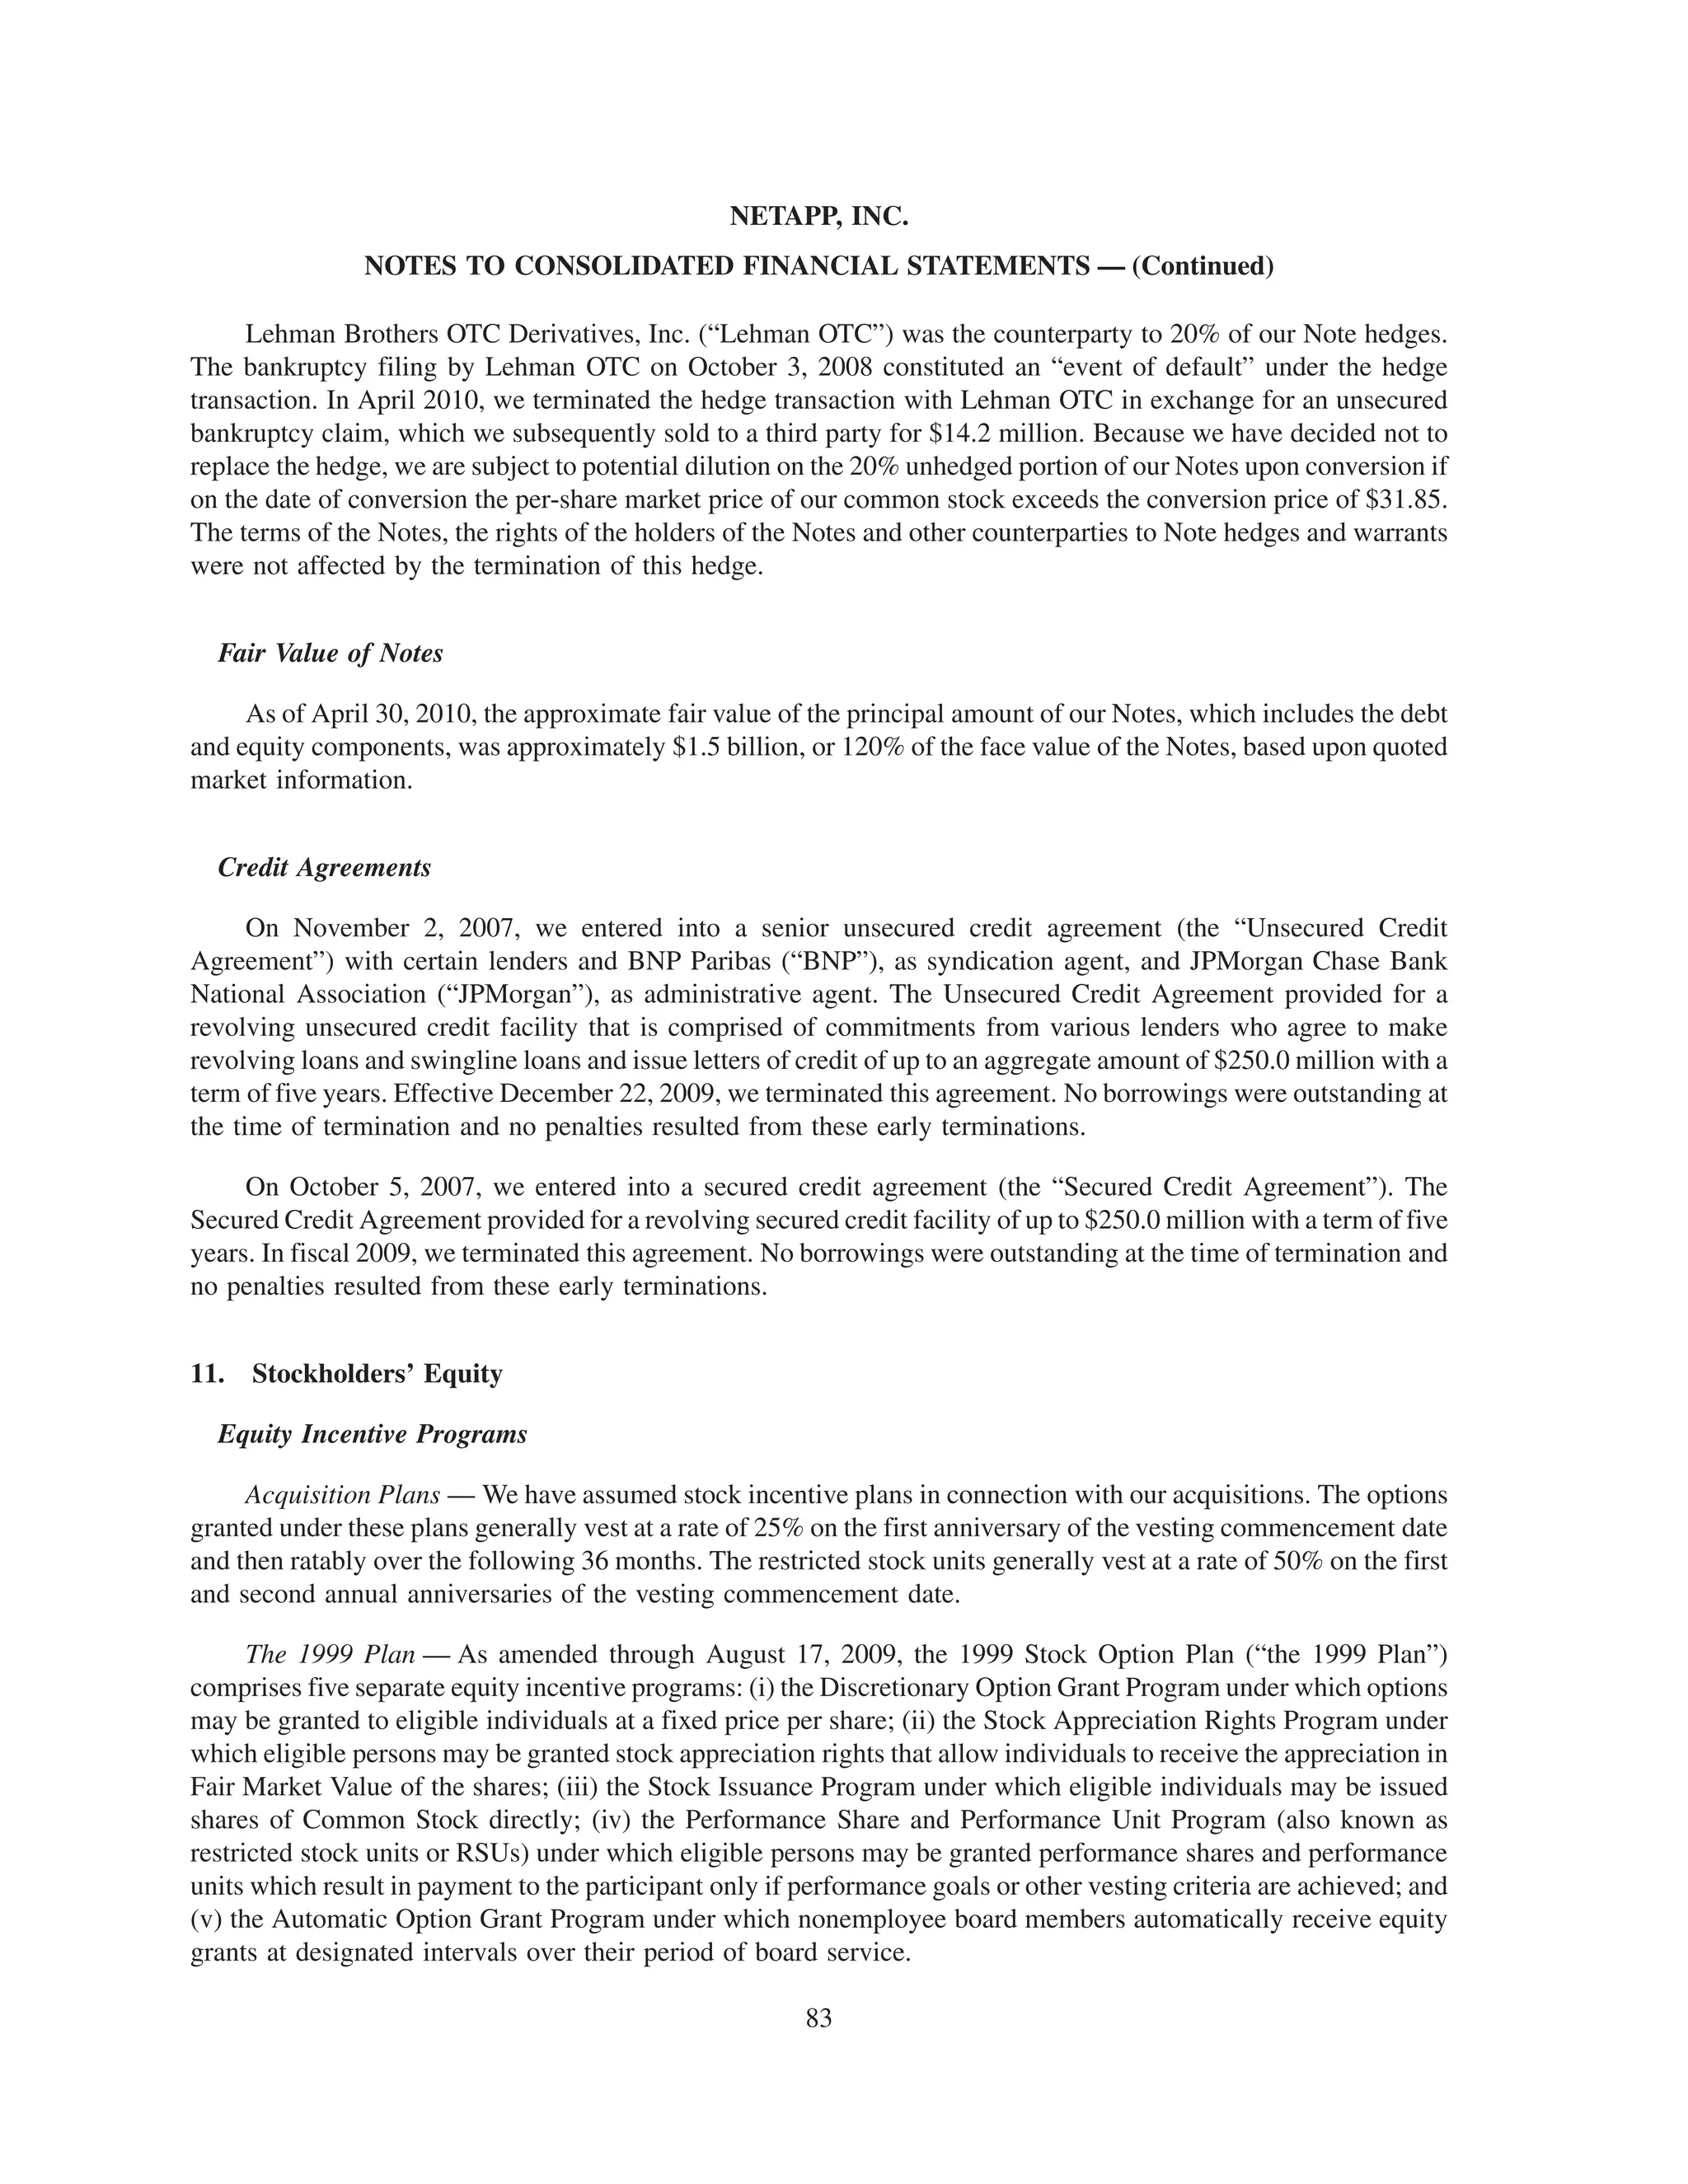
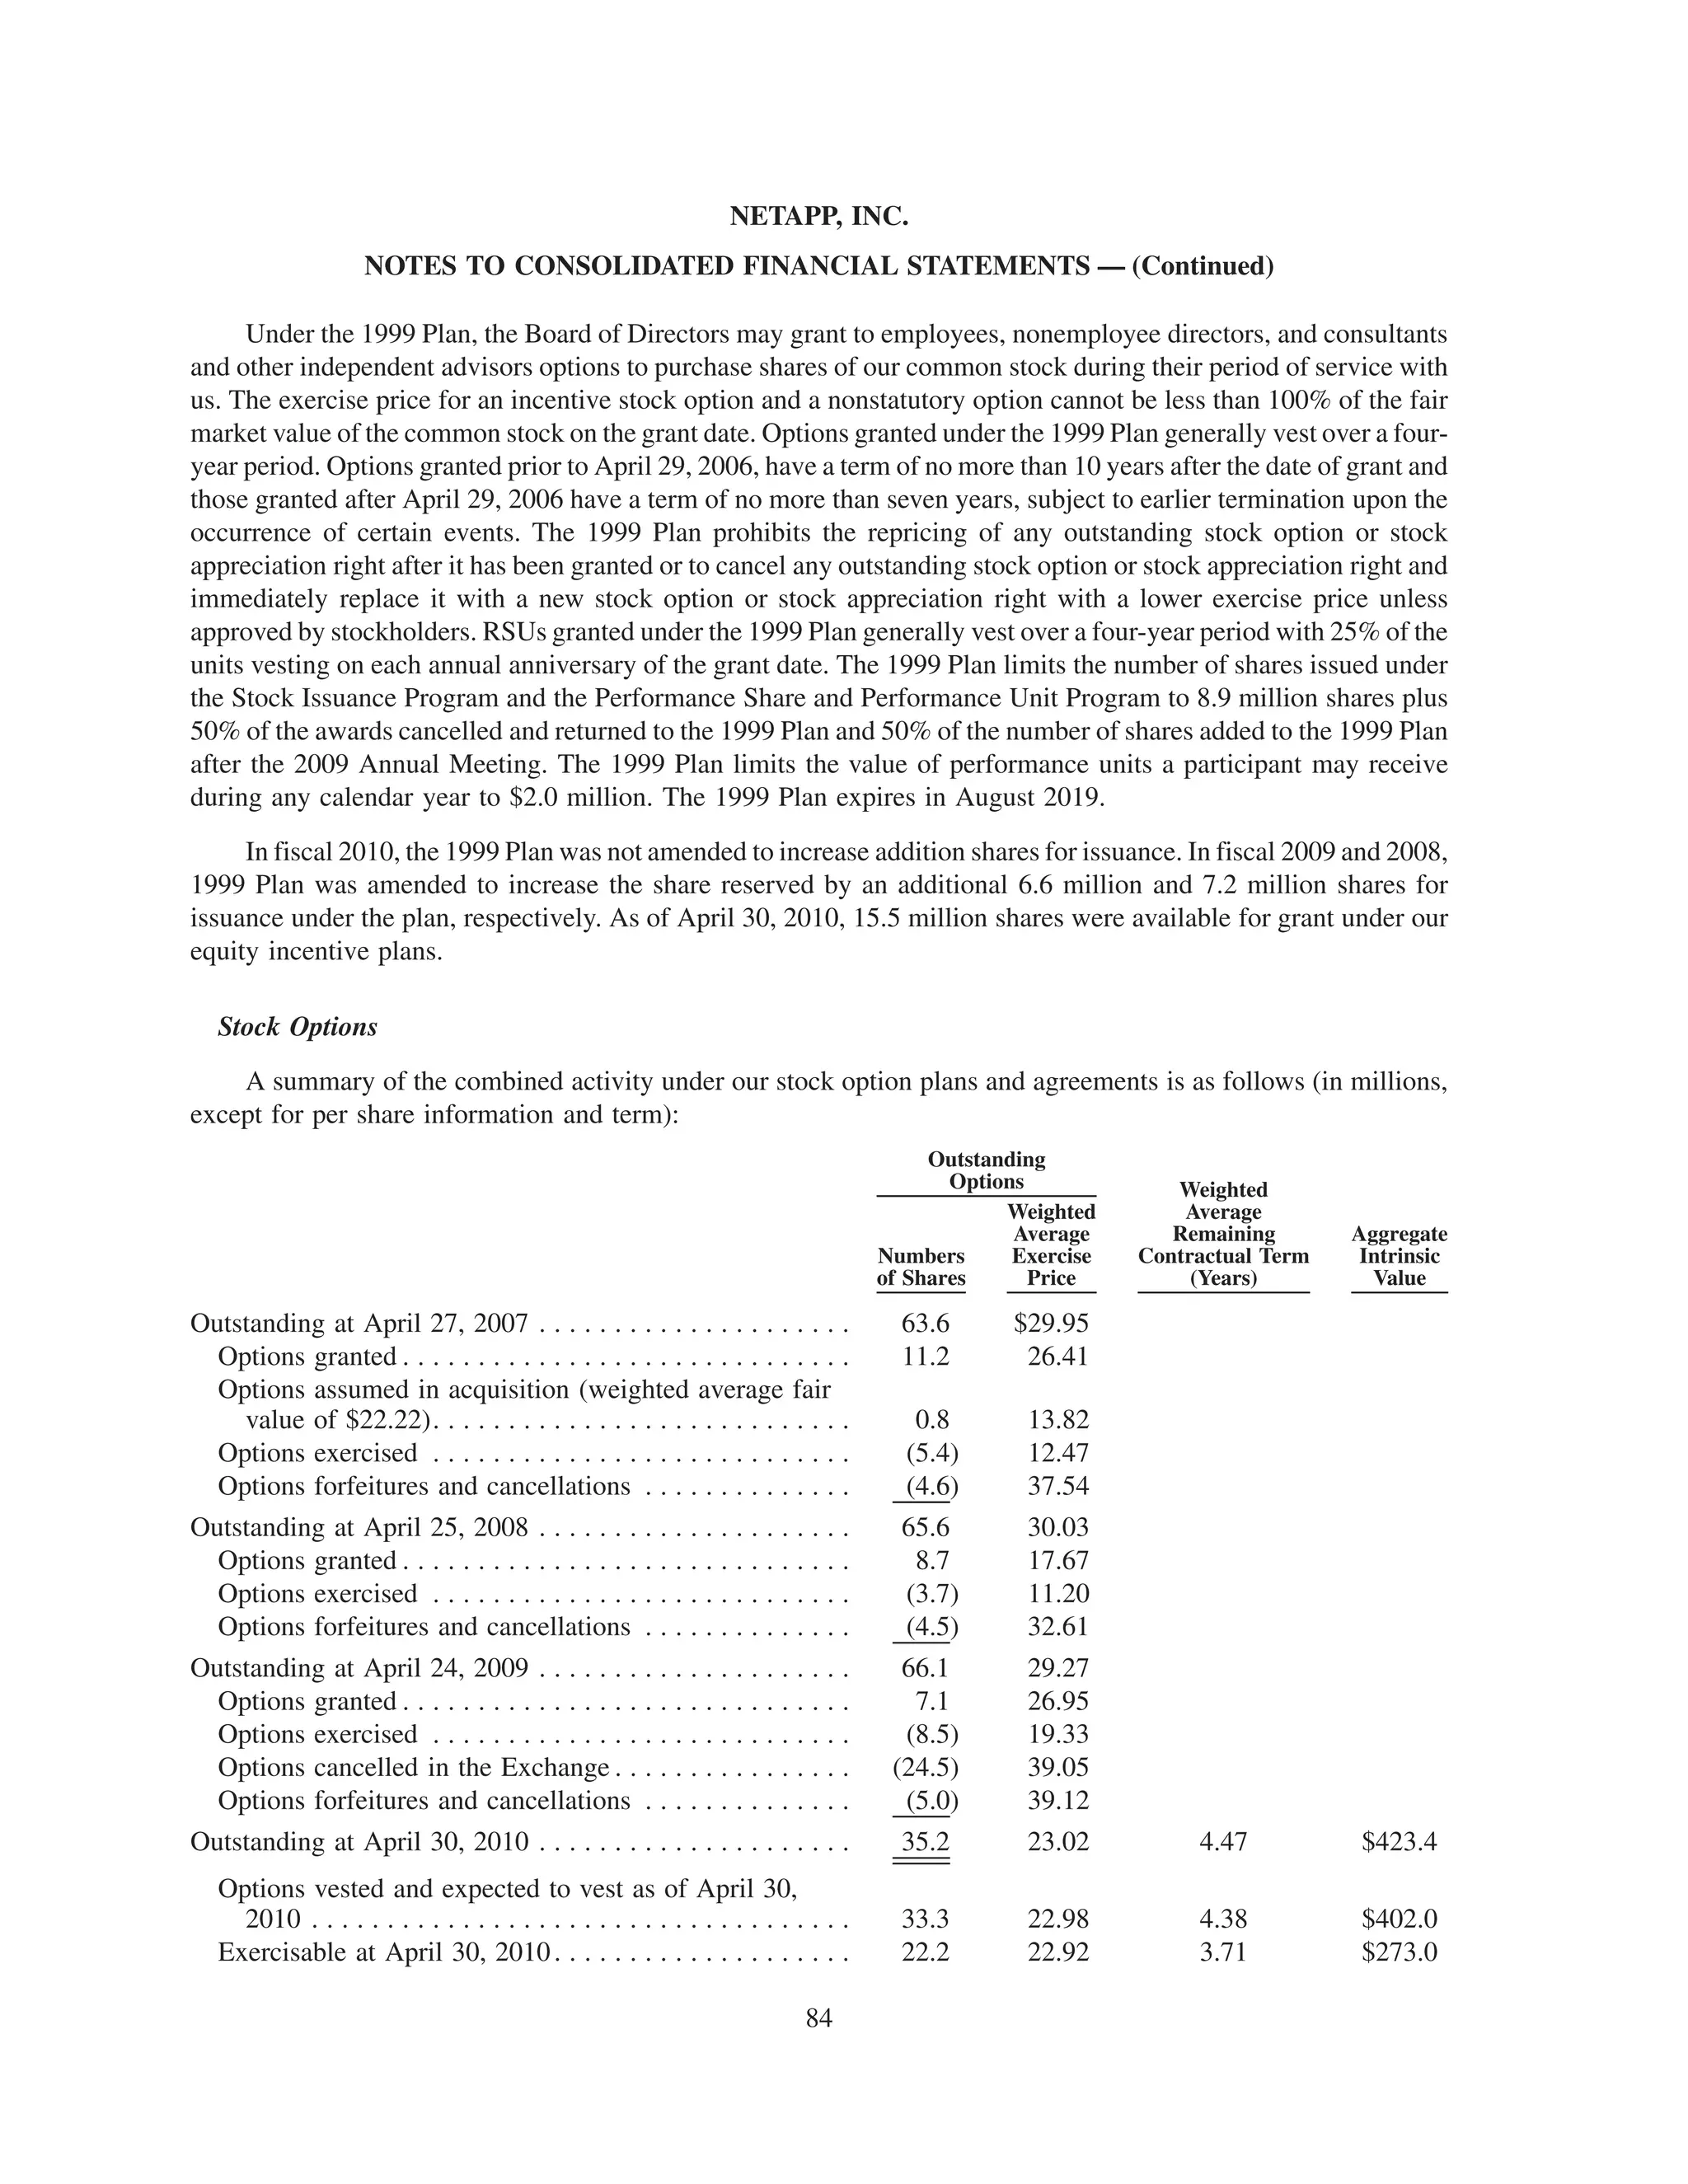
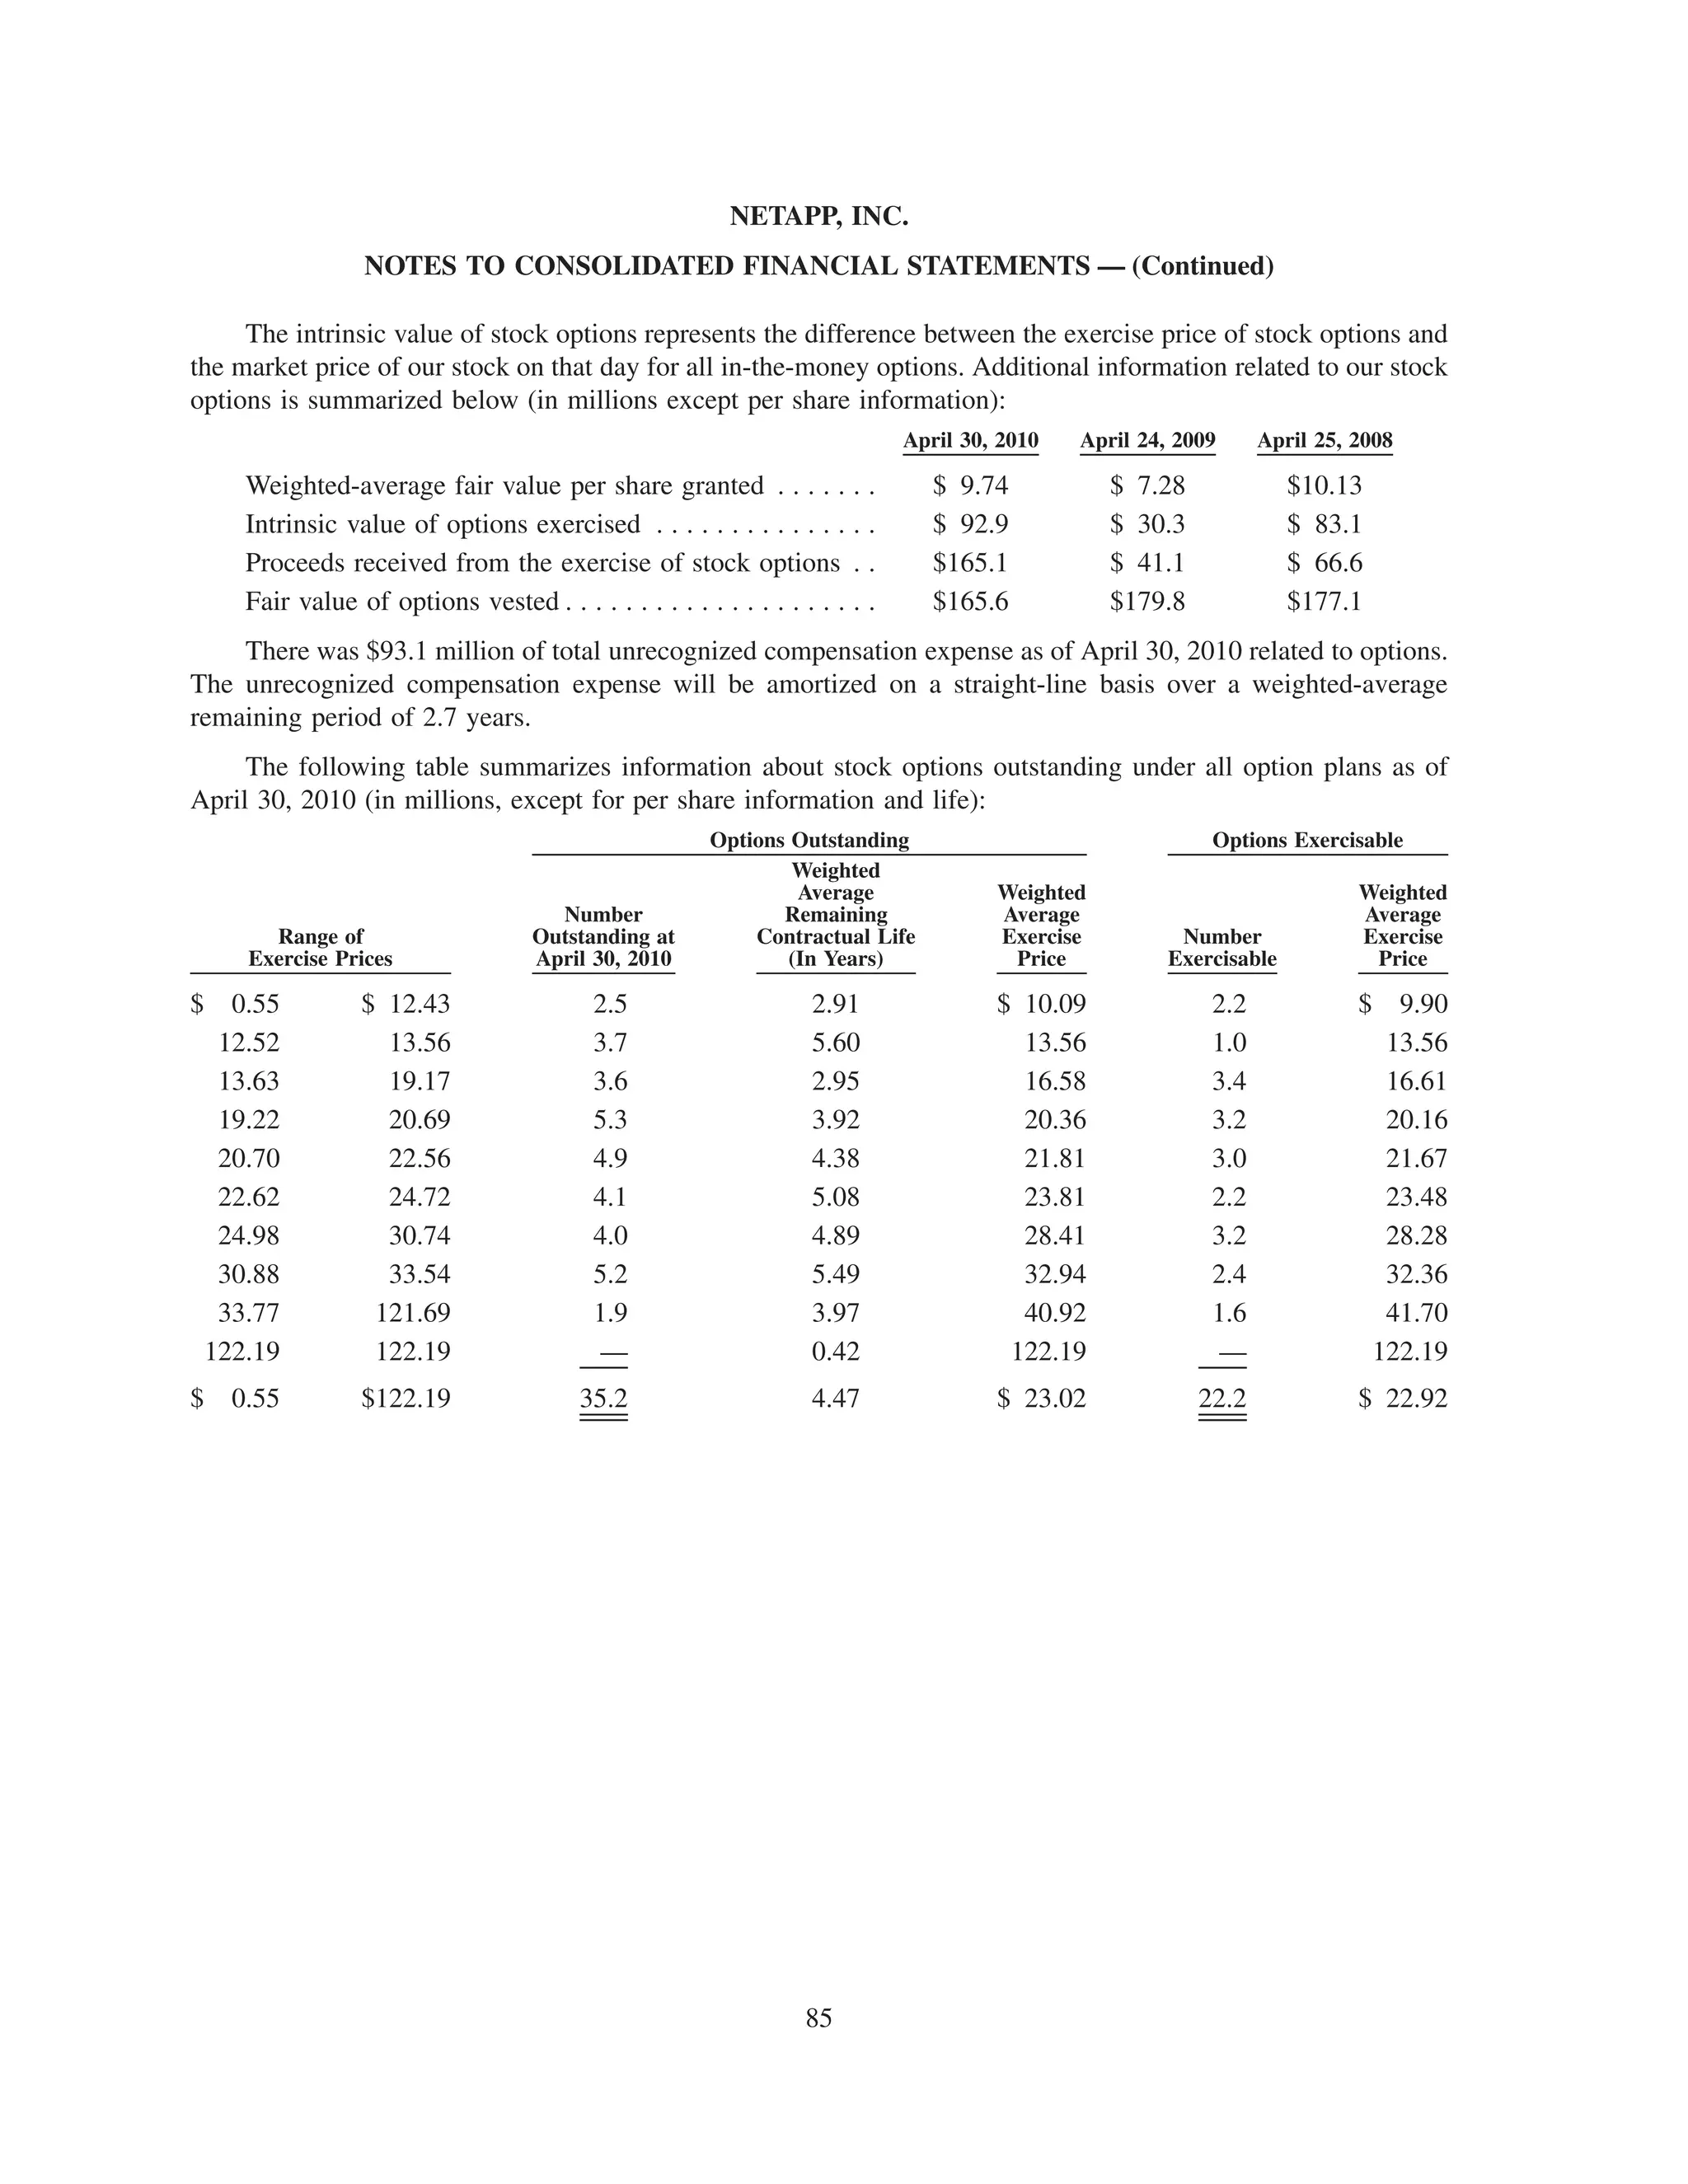
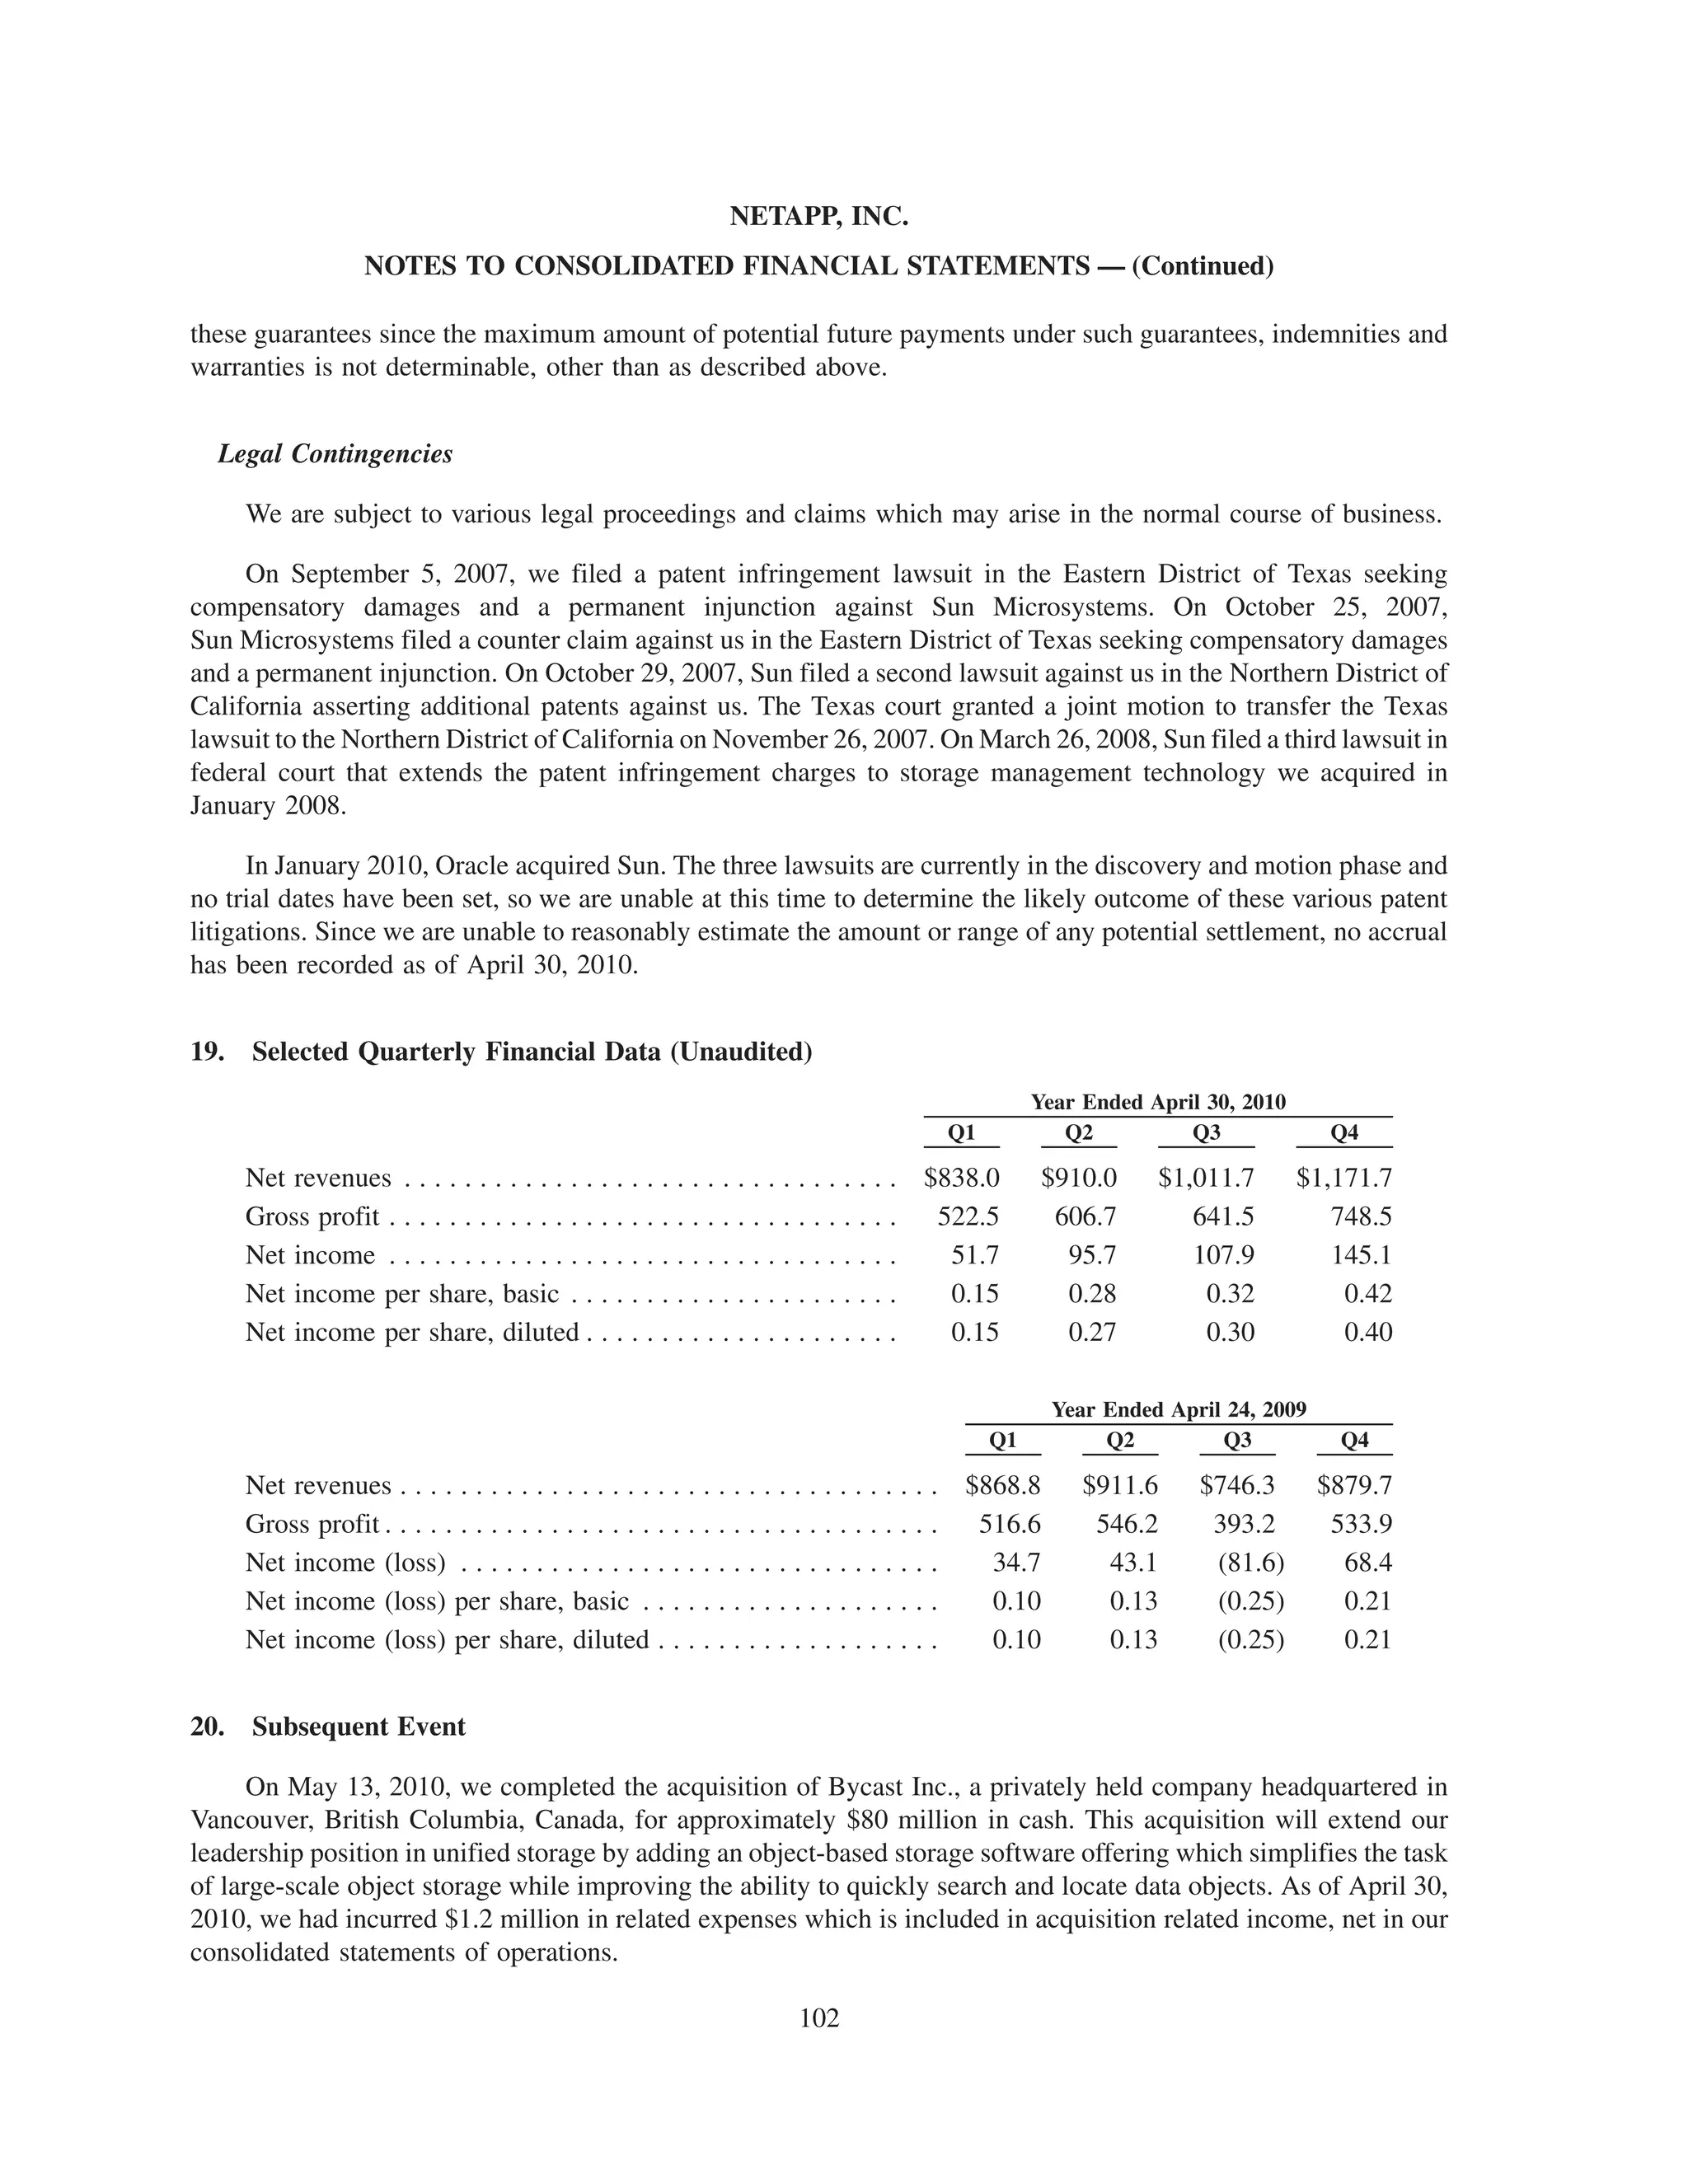
UNITED STATES SECURITIES AND EXCHANGE COMMISSION
                                                            Washington, D.C. 20549


                                                                  Form 10-K
(Mark One)
     ¥       ANNUAL REPORT PURSUANT TO SECTION 13 OR 15(d)
             OF THE SECURITIES EXCHANGE ACT OF 1934
             For the fiscal year ended April 30, 2010
                                                                              or
     n       TRANSITION REPORT PURSUANT TO SECTION 13 OR 15(d)
             OF THE SECURITIES EXCHANGE ACT OF 1934
             For the transition period from                       to
                                                         Commission File Number 0-27130

                                                           NetApp, Inc.
                                                     (Exact name of registrant as specified in its charter)
                               Delaware                                                                           77-0307520
                       (State or other jurisdiction of                                                             (IRS Employer
                      incorporation or organization)                                                             Identification No.)
                                                                495 East Java Drive,
                                                             Sunnyvale, California 94089
                                                  (Address of principal executive offices, including zip code)
                                             Registrant’s telephone number, including area code:
                                                                  (408) 822-6000
                                           Securities registered pursuant to Section 12(b) of the Act:
                          Title of Each Class                                                        Name of Exchange on Which Registered
                Common Stock, $0.001 Par Value                                          The NASDAQ Stock Market LLC
                                         Securities registered pursuant to Section 12(g) of the Act:
                                                                     None
     Indicate by check mark if the registrant is a well-known seasoned issuer, as defined in Rule 405 of the Securities
Act. Yes ¥          No n
     Indicate by check mark if the registrant is not required to file reports pursuant to Section 13 or Section 15(d) of the
Act. Yes n          No ¥
     Indicate by check mark whether the registrant: (1) has filed all reports required to be filed by Section 13 or 15(d) of the Securities
Exchange Act of 1934 during the preceding 12 months (or for such shorter period that the registrant was required to file such reports), and
(2) has been subject to such filing requirements for the past 90 days. Yes ¥            No n
     Indicate by check mark whether the registrant has submitted electronically and posted on its corporate Web site, if any, every
Interactive Data File required to be submitted and posted pursuant to Rule 405 of Regulation S-T (§232.405 of this chapter) during the
preceding 12 months (or for such shorter period that the registrant was required to submit and post such files). Yes n                No n
     Indicate by a check mark if disclosure of delinquent filers pursuant to Item 405 of Regulation S-K is not contained herein, and will
not be contained, to the best of registrant’s knowledge, in definitive proxy or information statements incorporated by reference in Part III
of this Form 10-K or any amendment to this Form 10-K. n
     Indicate by check mark whether the registrant is a large accelerated filer, an accelerated filer, a non-accelerated filer, or a smaller
reporting company. See the definitions of “large accelerated filer,” “accelerated filer” and “smaller reporting company” in Rule 12b-2 of
the Exchange Act. (Check one):
Large accelerated filer ¥ Accelerated filer n                       Non-accelerated filer n                 Smaller reporting company n
                                                         (Do not check if a smaller reporting company)
     Indicate by check mark whether the registrant is a shell company (as defined in Rule 12b-2 of the Exchange
Act). Yes n         No ¥
     The aggregate market value of voting stock held by non-affiliates of the registrant, as of October 30, 2009, the last day of registrant’s
most recently completed second fiscal quarter, was $8,339,377,099 (based on the closing price for shares of the registrant’s common
stock as reported by the NASDAQ Global Select Market for the last business day prior to that date). Shares of common stock held by each
executive officer, director, and holder of 5% or more of the outstanding common stock have been excluded in that such persons may be
deemed to be affiliates. This determination of affiliate status is not necessarily a conclusive determination for other purposes.
     On June 4, 2010, 352,541,867 shares of the registrant’s common stock, $0.001 par value, were outstanding.
                                           DOCUMENTS INCORPORATED BY REFERENCE
     The information called for by Part III of this Form 10-K is hereby incorporated by reference from the definitive Proxy Statement for
our annual meeting of stockholders, which will be filed with the Securities and Exchange Commission not later than 120 days after
April 30, 2010.
TABLE OF CONTENTS

                                                                       PART I
Item   1       Business . . . . . . . . . . . . . . . . . . . . . . . . . . . . . . . . . . . . . . . . . . . . . . . . . . . . . . . . . . . . . . .     3
Item   1A      Risk Factors . . . . . . . . . . . . . . . . . . . . . . . . . . . . . . . . . . . . . . . . . . . . . . . . . . . . . . . . . . . .      11
Item   1B      Unresolved Staff Comments . . . . . . . . . . . . . . . . . . . . . . . . . . . . . . . . . . . . . . . . . . . . . . . .                 32
Item   2       Properties . . . . . . . . . . . . . . . . . . . . . . . . . . . . . . . . . . . . . . . . . . . . . . . . . . . . . . . . . . . . . .    32
Item   3       Legal Proceedings . . . . . . . . . . . . . . . . . . . . . . . . . . . . . . . . . . . . . . . . . . . . . . . . . . . . . . . .         33
Item   4       Submission of Matters to a Vote of Security Holders . . . . . . . . . . . . . . . . . . . . . . . . . . . . . .                           33

                                                           PART II
Item 5  Market for Registrant’s Common Equity, Related Stockholder Matters and Issuer Purchases
        of Equity Securities . . . . . . . . . . . . . . . . . . . . . . . . . . . . . . . . . . . . . . . . . . . . . . . . . . . . . . .                34
Item 6  Selected Financial Data . . . . . . . . . . . . . . . . . . . . . . . . . . . . . . . . . . . . . . . . . . . . . . . . . . . .                   36
Item 7  Management’s Discussion and Analysis of Financial Condition and Results of Operations . . .                                                       36
Item 7A Quantitative and Qualitative Disclosures About Market Risk . . . . . . . . . . . . . . . . . . . . . . . . .                                      58
Item 8  Financial Statements and Supplementary Data . . . . . . . . . . . . . . . . . . . . . . . . . . . . . . . . . . .                                 61
Item 9  Changes in and Disagreements with Accountants on Accounting and Financial Disclosure. . .                                                        103
Item 9A Controls and Procedures . . . . . . . . . . . . . . . . . . . . . . . . . . . . . . . . . . . . . . . . . . . . . . . . . . .                    103
Item 9B Other Information . . . . . . . . . . . . . . . . . . . . . . . . . . . . . . . . . . . . . . . . . . . . . . . . . . . . . . . .                105

                                                            PART III
Item   10      Directors and Executive Officers of the Registrant . . . . . . . . . . . . . . . . . . . . . . . . . . . . . . . .                        105
Item   11      Executive Compensation . . . . . . . . . . . . . . . . . . . . . . . . . . . . . . . . . . . . . . . . . . . . . . . . . . .              105
Item   12      Security Ownership of Certain Beneficial Owners and Management . . . . . . . . . . . . . . . . . . .                                      105
Item   13      Certain Relationships and Related Transactions . . . . . . . . . . . . . . . . . . . . . . . . . . . . . . . . . .                        105
Item   14      Principal Accounting Fees and Services . . . . . . . . . . . . . . . . . . . . . . . . . . . . . . . . . . . . . . . .                    105

                                                                       PART IV
Item 15 Exhibits and Financial Statement Schedules . . . . . . . . . . . . . . . . . . . . . . . . . . . . . . . . . . . . .                             105
Signatures . . . . . . . . . . . . . . . . . . . . . . . . . . . . . . . . . . . . . . . . . . . . . . . . . . . . . . . . . . . . . . . . . . . . . .   106
Schedule II . . . . . . . . . . . . . . . . . . . . . . . . . . . . . . . . . . . . . . . . . . . . . . . . . . . . . . . . . . . . . . . . . . . . .    108


                                                                               2
PART I

Item 1. Business
Forward Looking Statements
     This Annual Report on Form 10-K contains forward-looking statements within the meaning of Section 27A of
the Securities Act of 1933, as amended, and Section 21E of the Securities Exchange Act of 1934, as amended (the
“Exchange Act”), and is subject to the safe harbor provisions set forth in the Exchange Act. Forward-looking
statements usually contain the words “estimate,” “intend,” “plan,” “predict,” “seek,” “may,” “will,” “should,”
“would,” “could,” “anticipate,” “expect,” “believe,” or similar expressions and variations or negatives of these
words. In addition, any statements that refer to expectations, projections, or other characterizations of future events
or circumstances, including any underlying assumptions, are forward-looking statements. All forward-looking
statements, including but not limited to, statements about:
     • our future financial and operating results;
     • our business strategies;
     • management’s plans, beliefs and objectives for future operations, research and development;
     • acquisitions and joint ventures, growth opportunities, investments and legal proceedings;
     • competitive positions;
     • product introductions, development, enhancements and acceptance;
     • economic and industry trends or trend analyses;
     • future cash flows and cash deployment strategies;
     • short-term and long-term cash requirements;
     • our anticipated tax rate;
     • the dilutive effect of our convertible Notes and associated warrants on our earnings per share;
     • the conversion, maturation or repurchase of the Notes,
     • compliance with laws, regulations and debt covenants;
     • the continuation of our stock repurchase program; and
     • the impact of completed acquisitions
are inherently uncertain as they are based on management’s current expectations and assumptions concerning future
events, and they are subject to numerous known and unknown risks and uncertainties. Therefore, our actual results
may differ materially from the forward-looking statements contained herein. Factors that could cause actual results
to differ materially from those described herein include, but are not limited to:
     • acceptance of, and demand for, our products;
     • the amount of orders received in future periods;
     • our ability to ship our products in a timely manner;
     • our ability to achieve anticipated pricing, cost, and gross margins levels;
     • our ability to successfully manage our backlog and increase revenue;
     • our ability to successfully execute on our strategy;
     • our ability to increase our customer base, market share and revenue;
     • our ability to successfully introduce new products;

                                                          3
• our ability to maintain the quality of our hardware, software and services offerings;
     • our ability to adapt to changes in market demand;
     • the general economic environment and the growth of the storage markets;
     • demand for our services and support;
     • our ability to identify and respond to significant market trends and emerging standards;
     • the impact of industry consolidation;
     • our ability to successfully manage our investment in people, process, and systems;
     • our ability to maintain our supplier and contract manufacturer relationships;
     • the ability of our suppliers and contract manufacturers to meet our requirements;
     • the ability of our competitors to introduce new products that compete successfully with our products;
     • our ability to grow direct and indirect sales and to efficiently utilize global service and support;
     • variability in our gross margins;
     • our ability to sustain and/or improve our cash and overall financial position;
     • our cash requirements and terms and availability of financing;
     • valuation and liquidity of our investment portfolio;
     • our ability to finance business acquisitions, construction projects and capital expenditures through cash from
       operations and/or financing;
     • the results of our ongoing litigation, tax audits, government audits and inquiries; and
     • those factors discussed under “Risk Factors” elsewhere in this Annual Report on Form 10-K.
     Readers are cautioned not to place undue reliance on these forward-looking statements, which speak only as of
the date hereof and are based upon information available to us at this time. These statements are not guarantees of
future performance. We disclaim any obligation to update information in any forward-looking statement. Actual
results could vary from our forward looking statements due to foregoing factors as well as other important factors,
including those described in the Risk Factors included on page 11.

Overview
     NetApp, Inc. (NetApp) is a leading provider of storage and data management solutions. We offer solutions for
storing, managing, protecting and archiving business data. Our solutions are designed to lower the cost of managing
and protecting our customers’ data while increasing their agility and competitiveness.
     We offer comprehensive solutions to help customers effectively streamline operations and lower the cost
associated with storing and managing their data. In an era of increasing constraints on information technology (IT)
spending, our storage efficiency innovations allow customers to use smaller, more efficient storage systems in
support of primary and secondary storage applications, helping them manage the issues associated with continuous
data growth. We strive to provide the best experience in the industry with every interaction customers have with our
people, products and services. In addition to our broad range of storage and data management solutions, we provide
global service and support and work to simplify customer environments by utilizing open standards and closely
collaborating and partnering with other industry leaders. We help solve customer business challenges and help
enable them to maximize return on investment through a combination of products, technologies, services, and
partnerships.
     Our products and services are designed to meet the expansive requirements and demanding service levels of
large enterprises and their mission-critical business applications. To better meet these needs, we partner with key
industry leaders, such as Cisco Systems, Inc., IBM Corporation, Microsoft Corporation, SAP Corporation,

                                                         4
Symantec Corporation and VMware, Inc. to develop integrated solutions that optimize the performance of
customers’ applications and their infrastructure. In addition, our products have been designed to satisfy the
demands of high performance computing and technical data center applications, offering solutions used in the
design of semiconductors and automobiles, as well as graphics rendering and seismic exploration.
     We were incorporated in 1992 and shipped the world’s first networked storage appliance a year later. Since
then, we have brought to market many innovations in storage and data management. We have grown to over
8,300 employees with operations in over 130 locations around the world.

NetApp Product Overview
     We offer highly available, scalable and cost-effective storage solutions that incorporate our unified storage
platform and the feature-rich functionality of our data and storage resource management software. We believe that
our solutions help improve enterprise productivity, performance and profitability, while providing investment
protection and enhanced asset utilization. Our enterprise-class storage solutions are complemented by our services
expertise to enable interoperability and optimization in the context of the application and IT infrastructure within
which they are deployed.

  Data ONTAP Software
     Our Fabric-Attached Storage (FAS) and V-Series storage solutions are based on Data ONTAP», a highly
scalable and flexible operating system that uniquely supports any mix of storage area network (SAN), network-
attached storage (NAS) and Internet Small Computer System Interface (iSCSI) environments concurrently. This
unified storage software platform is compatible with UNIX», Linux», Windows» and Web environments.
     The Data ONTAP operating system provides the foundation to build a shared storage infrastructure and an
enterprise-wide data fabric for the full breadth of business applications and data storage and protection require-
ments. Data ONTAP features scalability, secure multi-tenancy and unification across protocols and disks. Data
ONTAP also unifies storage efficiency, data management and data protection delivery. We believe customers can
benefit from these capabilities as they increasingly virtualize application environments. Our deduplication for
primary and secondary storage, thin provisioning, and highly efficient hardware help maximize utilization while
reducing data center footprint and lowering storage-related power and cooling consumption. A few of the
technology features we offer with Data ONTAP include:
     • FlexShare» technology directs how storage system resources are used to deliver an appropriate level of
       service for each application ;
     • FlexCache» technology allows performance acceleration through the creation of read-only cached volumes
       by creating caching volumes on multiple storage controllers; and
     • MultiStore» software allows partitioning of individual physical storage systems into multiple secure and
       separate logical partitions.

  Storage Efficiency
    NetApp’s portfolio of efficiency technologies helps our customers reduce their storage spending and get more
from storage assets they already own. Some of the efficiency technologies we offer include:
     • FlexVol» technology provides thin provisioning through virtual volumes, enabling storage architectures to
       be more efficient and achieve higher utilization using flexible volumes that do not require repartitioning of
       physical storage space;
     • FlexClone» technology enables true data cloning using logical copies that do not require additional physical
       storage space, and allows for instant replication of data volumes and data sets; and
     • Deduplication technology provides the ability to eliminate duplicate data within primary and secondary disk
       storage environments, resulting in greater efficiency and higher utilization of storage capacity.

                                                         5
Storage Management and Application Integration Software
     Our management software family of products provides a broad range of storage and data management tools to
simplify IT administration and enhance flexibility and productivity. We deliver differentiated products and
collaborate with industry open standards and interfaces to deliver this value to customers. We have four suites
of products targeted to different IT administrative roles: Storage Suite, Server Suite, Database Suite and Application
Suite. The software products within these suites are tightly integrated with database and business application
software from partners such as Microsoft, Oracle, SAP and VMware, in order to optimize the performance of those
applications on our storage systems. Our product offering extends into data center automation, which provides the
capability to monitor service levels, manage performance and support change management in complex enterprise
SAN environments. We help customers optimize shared infrastructures by supporting individual application
performance, service level and security needs even while the storage is shared across multiple applications.

  FAS Storage Systems Family
     Our family of modular, scalable, highly available, unified networked storage systems provides access to a full
range of enterprise data for users on a variety of platforms. The FAS 6000, FAS 3000, and the FAS 2000 series of
fabric-attached enterprise storage systems are designed to consolidate UNIX, Windows, NAS, iSCSI, SAN and Web
data in central locations running over standard connection types: Gigabit Ethernet, FC and parallel SCSI (for
backup). Our design optimizes and consolidates high-performance data access for individuals in multi-user
environments as well as for application servers and server clusters with dedicated access. All of our FAS systems
are interoperable and run the highly efficient Data ONTAP operating system.

  V-Series Family
     Our V-Series is a network-based virtualization solution that consolidates storage from different suppliers
behind our data management interface, providing SAN, iSCSI and NAS access to the data stored in heterogeneous
storage arrays. With the V-Series solution, customers are able to: transform existing heterogeneous, multi-vendor
storage systems into a single storage pool; simplify storage provisioning and management with Data ONTAP thin
provisioning; and dramatically lower backup time, space and cost with Data ONTAP SnapshotTM copies. The V-
Series is compatible with the FAS family of storage systems.

  Data Protection Software Products
     We offer a broad range of integrated data protection solutions for enterprise customer environments:
     • Snapshot technology enables near-instantaneous, space efficient online backups of large data sets without
       affecting system performance;
     • SnapRestore» technology uses stored SnapshotTM backups to recover entire file systems or data volumes in
       seconds, regardless of capacity or number of files;
     • SnapVault» and Open Systems SnapVault technologies provide network- and storage-optimized disk-to-disk
       backup solutions;
     • MetroCluster is a unique solution that combines array-based clustering with synchronous mirroring
       designed to deliver continuous availability and zero data loss;
     • SnapMirror» data replication solution provides disaster recovery protection for business-critical data
       matched to the recovery point objectives and recovery time objectives of customer environments.

  Data Retention and Archive Products
     To meet growing regulatory compliance demands faced by most enterprises, we offer a broad suite of products
to help enable data permanence, accessibility and privacy across a variety of different regulations such as the
Sarbanes-Oxley Act, 21 CFR Part 11, SEC Rule 17a-4 and HIPAA. Immutable, cost-effective, resilient and reliable
storage architectures can be created utilizing SnapLock» products.

                                                          6
Flash Cache
     Our NetApp@ Flash Cache modules optimize the performance of random read intensive workloads such as file
services and messaging. These intelligent read caches speed access to user data, reducing latency by a factor of 10 or
more compared to disk drives. Faster response times can translate into higher throughput for random I/O workloads.
NetApp Flash Cache and PAM give users performance that is comparable to that of solid state disks (SSDs) without
the complexity of another storage tier.

  Storage Security Products
     Our DataFort storage security appliance provides a unified platform for data security and key management
across NAS, IP SAN, and tape backup environments. The platform combines wire-speed encryption, access
controls, authentication and automated key management to provide strong security for data at rest, while still
allowing the capability to search compliant data for legal discovery purposes if the need arises. NetApp has
partnered with Brocade Communications Systems, Inc. to provide advanced fabric services for SANs. These high-
speed, highly reliable hardware devices deliver fabric-based encryption services to secure data assets either
selectively or comprehensively.

NetApp Services
     Our customers demand high availability and reliability of their storage infrastructure to ensure the successful,
ongoing operation of their businesses. NetApp’s services are designed with this in mind. We provide professional
services, global support solutions and customer education and training to help customers most effectively manage
their data. The professional services and support solutions we offer help our customers to resolve business
problems, reduce costs, keep businesses up and running continuously, comply with regulations and policies and
improve overall operational results. We utilize a global, integrated model to provide consistent service delivery and
global support during every phase of the customer engagement, including assessment and analysis, planning,
design, installation, implementation, integration, optimization, ongoing support and remote management and
monitoring. Services and support often involve phased rollouts, technology transitions and migrations and other
long-term engagements.

Sales, Principal Markets and Distribution Channels
     We market and sell our products in numerous countries throughout the world and we continue to make
investments in our multi-year branding and awareness campaign to increase visibility of NetApp in the broader IT
segment.
     Our diversified customer base spans a number of customer segments and vertical markets, including energy,
financial services, government, high technology, internet, life sciences and healthcare services, major manufac-
turing, media, entertainment, animation and video postproduction and telecommunications. We focus primarily on
the data management and storage markets, offering an array of solutions from our high-end products designed for
large enterprise customers to entry-level products designed for mid-sized enterprise customers.
     Our solutions are positioned to address the emerging opportunities presented by cloud computing. Our unified
storage architecture, secure multi-tenancy capability, scalable systems, efficiency technologies and data manage-
ment software functionality provide a powerful combination both for enterprises wanting to develop internal private
clouds, and for service providers who want to build IT, Software, Storage and Infrastructure as a Service offerings.
     As of the end of fiscal 2010, our worldwide sales and marketing function consisted of managers, sales
representatives, and technical support personnel. We have field sales offices in more than 45 countries. We employ a
multi-channel distribution strategy, selling products and services to end users and service providers through a direct
sales force and through channel partners, including value-added resellers, system integrators, original equipment
manufacturers (OEMs) and distributors. During fiscal year 2010, sales through our indirect channels represented
69% of our total revenues. Sales to customers Arrow and Avnet, who are distributors, accounted for approximately
14% and 11% of our net revenues, respectively, in fiscal 2010 and for approximately 11% and 10% of our net
revenues, respectively, for fiscal 2009. No individual customer accounted for ten percent or more of our net

                                                          7
revenues during fiscal 2008. Information about our segment disclosures, foreign operations and net sales attrib-
utable to our geographic regions is included in Note 16 of the accompanying consolidated financial statements.

Seasonality
     We have historically experienced a decline in revenues in the first quarter of our fiscal year, as the sales
organization spends time developing new business after higher close rates in the fourth quarter, and because sales to
European customers are historically weaker during the summer months. During the second quarter of our fiscal
year, we have historically experienced increased sales, driven by the government sector, concurrent with the end of
the U.S. federal government’s fiscal year in September, as well as an increase in business from European markets.
We derive a majority of our revenue in any given quarter from orders booked in the same quarter. Bookings and
revenues typically follow intraquarter seasonality patterns weighted toward the back end of the quarter.

Backlog
     We manufacture products based on a combination of specific order requirements and forecasts of our
customers’ demand. Orders are generally placed by customers on an as-needed basis. A substantial portion of our
products are sold on the basis of standard purchase orders that are cancellable prior to shipment without penalty. In
certain circumstances, purchase orders are subject to change with respect to quantity of product or timing of
delivery resulting from changes in customer requirements. Our business is characterized by seasonal and intra-
quarter variability in demand, as well as short lead-times and product delivery schedules. Accordingly, backlog at
any given time may not be a meaningful indicator of future revenue.

Manufacturing and Supply Chain
      We have outsourced manufacturing operations to third parties located in Memphis, Tennessee; Livingston,
Scotland; Schiphol Airport, The Netherlands; Shanghai, China; and Singapore. These operations include materials
procurement, commodity management, component engineering, test engineering, manufacturing engineering,
product assembly, product assurance, quality control, final test, and global logistics. We rely on a limited number of
suppliers for materials, as well as several key subcontractors for the production of certain subassemblies and
finished systems. We multi-source wherever possible to mitigate supply risk. Our strategy has been to develop close
relationships with our suppliers, exchanging critical information and implementing joint quality programs. We also
use contract manufacturers for the production of major subassemblies to improve our manufacturing redundancy.
This manufacturing strategy minimizes capital investments and overhead expenditures and creates flexibility for
rapid expansion.
    We were awarded ISO 9001 certification on May 29, 1997 and continue to be ISO 9001 certified. We were
awarded ISO 14001 certification on December 8, 2004 and continue to be ISO 14001 certified.

Research and Development
     We conduct research and development activities in various locations throughout the world. In fiscal 2010, 2009
and 2008, research and development expenses represented 14%, 15% and 14% of our net revenues, respectively.
These costs relate primarily to personnel and related costs incurred to conduct product development activities.
Although we develop many of our products internally, we may acquire technology through business combinations
or through licensing from third parties when appropriate. We believe that technical leadership is essential to our
success and we expect to continue to commit substantial resources to research and development.

Competition
     We compete with many companies in the markets we serve, including companies that offer a broad spectrum of
IT products and services and others that offer specific storage and data management products or services. In the
storage market, our primary system products and our associated software portfolio compete primarily with storage
system products and data management software from EMC, Hitachi Data Systems, HP, IBM, and Oracle
Corporation, through its acquisition of Sun Microsystems. In addition, Dell, Inc. is a competitor in the storage
marketplace through its business arrangement with EMC, which allows Dell to resell EMC storage hardware and

                                                          8
software products, as well as through Dell’s acquisition of EqualLogic, through which Dell offers low-priced
storage solutions. In the secondary storage market, which includes the disk-to-disk backup, compliance and
business continuity segments, our solutions compete primarily against products from EMC and Oracle Corporation,
through its acquisition of Sun Microsystems.
     We believe that most of these companies compete based on their market presence, products, service or price.
Some of these companies also compete by offering storage and data management products or services together with
other IT products or services, at minimal or no additional cost in order to preserve or gain market share.
     We believe that we have a number of competitive advantages over many of these companies, including product
innovation and the relationships we have with our customers and partners. We believe the advantages of our
products include functionality, scalability, performance, quality and operational efficiency. We believe we have an
advantage in the nature of the relationships we form with our customers and partners worldwide. We strive to deliver
an outstanding experience in every interaction we have with our customers and partners through our product,
service and support offerings that enable us to provide our customers with a full range of expertise before, during
and after their purchase from us or from one of our partners.
     An increase in industry consolidation may result in stronger competitors that are better able to compete as sole-
source vendors for customers. In addition, current and potential competitors have established or may establish
cooperative relationships among themselves or with third parties, including some of our partners. It is possible that
new competitors or alliances among competitors may emerge and rapidly acquire significant market share.

Proprietary Rights
     We currently rely on a combination of copyright and trademark laws, trade secrets, confidentiality procedures,
contractual provisions, and patents to protect our proprietary rights. We seek to protect our software, documen-
tation, and other written materials under trade secret, copyright, and patent laws, which afford only limited
protection. We have registered our NetApp name and logo, Network ApplianceTM name and logo, Data ONTAP,
DataFabric@, FAServer@, FlexVol, FilerView@, NearStore@, SecureShare@, SnapDrive@, SnapLock,
SnapManager@, SnapMirror, SnapRestore, SnapVault, WAFL@, and others as trademarks in the United States.
Other U.S. trademarks and U.S. registered trademarks are registered internationally as well. We will continue to
evaluate the registration of additional trademarks as appropriate. We generally enter into confidentiality agreements
with our employees, resellers, customers, and suppliers. We currently have multiple U.S. and international patent
applications pending and multiple U.S. patents issued.
      In addition, through various licensing arrangements, we receive certain rights to intellectual property of others.
We expect to maintain current licensing arrangements and to secure licensing arrangements in the future, as needed
and to the extent available on reasonable terms and conditions, to support continued development and sales of our
products and services. Some of these licensing arrangements require or may require royalty payments and other
licensing fees. The amount of these payments and fees may depend on various factors, including but not limited to:
the structure of royalty payments, offsetting considerations, if any, and the degree of use of the licensed technology.
     The industry in which we compete is characterized by rapidly changing technology, a large number of patents,
and frequent claims and related litigation regarding patent and other intellectual property rights, and we are exposed
to various risks related to legal proceedings or claims and protection of intellectual property rights. If we are unable
to protect our intellectual property, we may be subject to increased competition that could materially and adversely
affect our operating results.

Environmental Disclosure
     We seek to comply with all applicable statutory and administrative requirements concerning environmental
quality and worker health and safety. We have made, and will continue to make, expenditures for environmental
compliance and protection. Such expenditures have not had, and are not expected to have, a material effect on our
capital expenditures, results of operations or competitive position.
    We are voluntarily assessing our greenhouse gas emissions, and have begun to take action to reduce such
emissions, for example through establishing employee commuter programs and evaluating the energy efficiency of

                                                           9
our buildings. Various laws and regulations have been implemented or are under consideration to mitigate the
effects of climate change caused by greenhouse gas emissions. Environmental laws are complex, change frequently
and have tended to become more stringent over time. It is often difficult to estimate the future impact of
environmental matters. Based on current information and subject to the finalization of the proposed regulations, we
believe that our primary risk related to climate change is the risk of increased energy costs. However, because we are
not an energy intensive business, we do not anticipate being subject to a cap and trade system or any other mitigation
measures that would be material to our operations.
     We are also subject to other federal, state and local regulations regarding workplace safety and protection of
the environment. Various international, federal, state and local provisions regulate the use and discharge of certain
hazardous materials used in the manufacture of our products. Failure to comply with environmental regulations in
the future could cause us to incur substantial costs or subject us to business interruptions. We believe we are
substantially compliant with all applicable environmental laws. All of our products meet the requirements for
WEEE, RoHS and China RoHS compliance. We have maintained an Environmental Management System since
December 2004 as well as our ISO 14001 certification. As part of ISO 14001 requirements, we conduct an annual
review of our operations and we monitor environmental legislation and requirements to help ensure we are taking
necessary measures to remain in compliance with applicable laws.

Working Capital Practices
     Information about our working capital practices is included in Item 7 — “Management’s Discussion and
Analysis of Financial Condition and Results of Operation” under the heading “Liquidity and Capital Resources”
and is incorporated herein by reference.

Employees
     As of April 30, 2010, we had 8,333 employees, of which, 2,346 were in research and development, 3,912 were
in sales and marketing, 1,215 were in services and manufacturing operations, and 860 were in finance and
administration. We have never had a work stoppage and consider relations with our employees to be good.
Competition for technical personnel in the industry in which we compete is intense. We believe that our future
success depends in part on our continued ability to hire, assimilate, and retain qualified personnel. To date, we
believe that we have been successful in recruiting qualified employees, but there is no assurance that we will
continue to be successful in the future.

Executive Officers
     Our executive officers and their ages as of May 25, 2010, are as follows:
     Name                                                    Age                         Position

     Thomas Georgens . . . . . . . . . . . . . . . . .       50    President, Chief Executive Officer, Director
     Manish Goel . . . . . . . . . . . . . . . . . . . . .   45    Executive Vice President, Products
     Steven J. Gomo . . . . . . . . . . . . . . . . . . .    58    Executive Vice President, Finance and Chief
                                                                   Financial Officer
     Andrew Kryder . . . . . . . . . . . . . . . . . . .     57    Senior Vice President, General Counsel, Secretary
     Robert E. Salmon . . . . . . . . . . . . . . . . .      49    Executive Vice President, Field Operations
     Thomas Georgens is the president and chief executive officer of the Company. Previously, Mr. Georgens
served as president and chief operating officer responsible for all product operations and field operations worldwide
from February 2008 to August 2009. Mr. Georgens has also been a member of the Board of Directors at NetApp
since March 2008. Mr. Georgens joined NetApp in October 2005 as executive vice president and general manager of
enterprise storage systems and was named executive vice president of product operations where he served in that
role from January 2007 to February 2008. Before joining NetApp, Mr. Georgens spent nine years at Engenio, a
subsidiary of LSI Corporation, with the last two years as chief executive officer. He has also served in various other
positions, including president of LSI Logic Storage Systems and executive vice president of LSI Corporation. Prior
to LSI Corporation, Mr. Georgens spent 11 years at EMC in a variety of engineering and marketing positions.

                                                                   10
Mr. Georgens holds a B.S. degree and an M.E. degree in Computer and Systems Engineering from Rensselaer
Polytechnic Institute as well as an M.B.A. degree from Babson College.
     Manish Goel was appointed the executive vice president of product operations in June 2009, overseeing all
aspects of technology strategy and product engineering across the Company’s product portfolio. Mr. Goel has held a
variety of leadership roles in corporate development, sales, and business unit general management since he joined
NetApp in 2002. Prior to NetApp, Mr. Goel led corporate and business development activities for Cadence Design
Systems and Copper Mountain Networks. Prior to that, he spent four years as a strategy consultant for McKinsey
and Co. and six years as a systems software engineer. Mr. Goel holds a B.S. in electrical engineering from IIT
Chennai, and an MBA in finance from the Wharton School of Business.
     Steven J. Gomo joined NetApp in August 2002 as senior vice president of finance and chief financial officer.
He was appointed executive vice president of finance and chief financial officer in October 2004. Prior to joining the
Company, he served as chief financial officer for Gemplus International S.A., headquartered in Luxembourg from
November 2000 to April 2002 and as chief financial officer of Silicon Graphics, Inc., from February 1998 to August
2000. Prior to February 1998, he worked at Hewlett-Packard Company for 24 years in various positions, including
financial management, corporate finance, general management, and manufacturing. Mr. Gomo currently serves on
the board of SanDisk Corporation. Mr. Gomo holds an M.B.A. degree from Santa Clara University and a B.S.
degree in business administration from Oregon State University.
     Andrew Kryder is the Senior Vice President, General Counsel, Secretary of the Company. He was promoted to
Senior Vice President Tax and General Counsel in June 2006. Mr. Kryder joined NetApp in August 2000 as Vice
President, Legal and Tax and General Counsel. He has served as the Company’s Secretary since 2001. Prior to
joining NetApp, he served as General Counsel and Vice President, Tax with Quantum Corporation, headquartered
in Santa Clara, California, from November 1990 to August 2000 and was a tax partner and staff accountant with
Ernst & Young from June 1977 to November 1990. Mr. Kryder currently serves on the board of JW house, a
charitable organization. Mr. Kryder received his Juris Doctorate and Masters of Business Administration from
Santa Clara University in 1977 and his B.S. degree in business administration also from Santa Clara University in
1974.
     Robert E. Salmon joined NetApp in January 1994 and was appointed executive vice president, field operations
in December 2005. Mr. Salmon has served as the Company’s executive vice president of worldwide sales since
September 2004. From August 2003 to September 2004, Mr. Salmon served as the Company’s senior vice president
of worldwide sales and from May 2000 to August 2003, Mr. Salmon served as the Company’s vice president of
North American sales. Prior to his tenure at NetApp Mr. Salmon spent nearly ten years with Sun Microsystems and
Data General Corporation. Mr. Salmon graduated from California State University, Chico with a B.S. degree in
computer science.

Additional Information
     Our Internet address is www.netapp.com. We make available through our Internet Web site our annual reports
on Form 10-K, quarterly reports on Form 10-Q, current reports on Form 8-K, and amendments to those reports filed
or furnished pursuant to Section 13(a) of the Securities Exchange Act of 1934, as amended, as soon as reasonably
practicable after we electronically file such material with, or furnish it to, the SEC.
      The SEC maintains an Internet site (www.sec.gov) that contains reports, proxy and information statements, and
other information regarding issuers that file electronically with the SEC. The public also may read and copy these
filings at the SEC’s Public Reference Room at 100 F Street, N.E., Washington, D.C. 20549. Information about this
Public Reference Room is available by calling (800) SEC-0330.

Item 1A. Risk Factors
     The following risk factors and other information included in this Annual Report on Form 10-K should be
carefully considered. The risks and uncertainties described below are not the only ones we face. Additional risks
and uncertainties not presently known to us or that we presently deem less significant may also impair our business
operations. Please see page 3 of this Annual Report on Form 10-K for additional discussion of these

                                                         11
forward-looking statements. If any of the events or circumstances described in the following risk factors actually
occurs, our business, operating results, and financial condition could be materially adversely affected.

  Our operating results may be adversely affected by uncertain economic and market conditions.
     We are subject to the effects of general global economic and market conditions. Challenging economic
conditions worldwide have from time to time contributed to slowdowns in the computer, storage, and networking
industries at large, as well as the information technology (“IT”) market, resulting in:
     • Reduced demand for our products as a result of constraints on IT related spending by our customers;
     • Increased price competition for our products from competitors;
     • Deferment of purchases and orders by customers due to budgetary constraints or changes in current or
       planned utilization of our systems;
     • Risk of excess and obsolete inventories;
     • Risk of supply constraints:
     • Excess facilities costs;
     • Higher overhead costs as a percentage of revenues;
     • Negative impacts from increased financial pressures on customers, distributors and resellers;
     • Negative impacts from increased financial pressures on key suppliers or contract manufacturers; and
     • Potential discontinuance of product lines or businesses and related asset impairments.
     Any of the above mentioned factors could have a material and adverse effect on our business and financial
performance.

  Our quarterly operating results may fluctuate, which could adversely impact our common stock price.
     We believe that period-to-period comparisons of our results of operations are not necessarily meaningful and
should not be relied upon as indicators of future performance. Our operating results have in the past, and will
continue to be, subject to quarterly fluctuations as a result of numerous factors, some of which may contribute to
more pronounced fluctuations during times of economic volatility. These factors include, but are not limited to, the
following:
     • Fluctuations in demand for our products and services, in part due to changes in general economic conditions
       and specific economic conditions in the storage and data management market;
     • A shift in federal government spending patterns;
     • Changes in sales and implementation cycles for our products and reduced visibility into our customers’
       spending plans and associated revenues;
     • The level of price and product competition in our target product markets;
     • The impact of economic uncertainty on our customers’ budgets and IT spending capacity;
     • Our ability to maintain appropriate inventory levels and purchase commitments;
     • Our reliance on a limited number of suppliers, and industry consolidation in our supply base, which could
       subject us to periodic supply-and-demand, price rigidity, and quality issues with our components;
     • The timing of bookings, the cancellation of significant orders and the management of our backlog;
     • Product configuration and mix;
     • The extent to which our customers renew their service and maintenance contracts with us;

                                                        12
• Seasonality, such as our historical seasonal decline in revenues in the first quarter of our fiscal year and
       seasonal increase in revenues in the second quarter of our fiscal year, with the latter due in part to the impact
       of the U.S. federal government’s September 30 fiscal year end on the timing of its orders;
     • Linearity, such as our historical intraquarter bookings and revenue pattern in which a disproportionate
       percentage of each quarter’s total bookings and related revenue occur in the last month of the quarter;
     • Announcements and introductions of, and transitions to, new products by us or our competitors;
     • Deferrals of customer orders in anticipation of new products or product enhancements introduced by us or
       our competitors;
     • Our ability to develop, introduce, and market new products and enhancements in a timely manner;
     • Our levels of expenditure on research and development and sales and marketing programs;
     • Our ability to effectively manage our operating expenses;
     • Adverse movements in foreign currency exchange rates in the countries in which we do business;
     • The dilutive impact of our $1.265 billion of 1.75% convertible senior notes due June 2013 (the “Notes”) and
       related warrants on our earnings per share;
     • Excess or inadequate facilities;
     • Actual events, circumstances, outcomes and amounts differing from judgments, assumptions, and estimates
       used in determining the values of certain assets (including the amounts of valuation allowances), liabilities,
       and other items reflected in our consolidated financial statements;
     • Disruptions resulting from new systems and processes as we continue to enhance and scale our system
       infrastructure; and
     • Future accounting pronouncements and changes in accounting rules, such as the increased use of fair value
       measures, changes in accounting standards related to revenue recognition, and the potential requirement that
       U.S. registrants prepare financial statements in accordance with International Financial Reporting Standards
       (IFRS).
     Due to such factors, operating results for a future period are difficult to predict, and, therefore, prior results are
not necessarily indicative of results to be expected in future periods. Any of the foregoing factors, or any other
factors discussed elsewhere herein, could have a material adverse effect on our business, results of operations, and
financial condition. It is possible that in one or more quarters our results may fall below our forecasts and the
expectations of public market analysts and investors. In such event, the trading price of our common stock would
likely decrease.

  Our revenue for a particular period is difficult to forecast, and a shortfall in revenue may harm our
  business and our operating results.
     Our revenues for a particular period are difficult to forecast, especially in times of economic uncertainty. Our
revenues are also difficult to forecast because the storage and data management market is rapidly evolving, and our
sales cycle varies substantially from customer to customer. New or additional product introductions also increase
the complexities of forecasting revenues.
     We derive a majority of our revenues in any given quarter from orders booked in the same quarter. Bookings
typically follow intraquarter seasonality patterns weighted toward the back end of the quarter. If we do not achieve
bookings in the latter part of a quarter consistent with our quarterly targets, our financial results will be adversely
impacted. Additionally, due to the complexities associated with revenue recognition, we may not accurately
forecast our non-deferred and deferred revenues, which could adversely impact our results of operations.
     We use a “pipeline” system, a common industry practice, to forecast bookings and trends in our business. Sales
personnel monitor the status of potential business and estimate when a customer will make a purchase decision, the
dollar amount of the sale and the products or services to be sold. These estimates are aggregated periodically to

                                                            13
generate a bookings pipeline. Our pipeline estimates may prove to be unreliable either in a particular quarter or over
a longer period of time, in part because the “conversion rate” of the pipeline into revenues varies from customer to
customer, can be difficult to estimate, and requires management judgment, and also because customers’ purchasing
decisions are subject to delay, reduction or cancellation. Small deviations from our forecasted conversion rate may
result in inaccurate plans and budgets and could materially and adversely impact our business or our planned results
of operations.
     Economic uncertainties have caused, and may in the future again cause, consumers, businesses and govern-
ments to defer purchases in response to tighter budgets, credit, decreased cash availability and declining customer
confidence. Accordingly, future demand for our products could differ from our current expectations.

  We have experienced periods of alternating growth and decline in revenues and operating expenses. If we
  are not able to successfully manage these fluctuations, our business, financial condition and results of
  operations could be significantly impacted.
     Changing market conditions and economic uncertainty create a challenging operating environment for our
business. It is critical that we maintain appropriate alignment between our cost structure and our expected growth
and revenues, while at the same time, continue to make strategic investments for future growth.
     Our expense levels are based in part on our expectations as to future revenues, and a significant percentage of
our expenses are fixed. We have a limited ability to quickly or significantly reduce our fixed costs, and if revenue
levels are below our expectations, operating results will be adversely impacted. During periods of uneven growth,
we may incur costs before we realize the anticipated related benefits, which could harm our operating results. We
have made, and will continue to make, significant investments in engineering, sales, service and support, marketing
programs and other functions to support and grow our business. We are likely to recognize the costs associated with
these investments earlier than some of the related anticipated benefits (revenue growth), and the return on these
investments may be lower, or may develop more slowly, than we expect, which could harm our business, operating
results and financial condition.
     Conversely, if we are unable to effectively manage our resources and capacity during periods of increasing
demand for our products, we could also experience an adverse impact to our business, operating results and
financial condition. If the storage and data management market fails to grow, or grows slower than we expect, our
revenues will be adversely affected. Also, even if IT spending increases, our revenues may not grow at the same
pace.

  Our gross margins have varied over time and may continue to vary, and such variation may make it more
  difficult to forecast our earnings.
     Our total gross margins are impacted by the mix of product, software entitlements and maintenance and
services revenues.
     Our product gross margins have been and may continue to be affected by a variety of factors, including:
     • Demand for storage and data management products;
     • Pricing actions, rebates, sales initiatives, discount levels, and price competition;
     • Direct versus indirect and OEM sales;
     • Changes in customer, geographic, or product mix, including mix of configurations within products;
     • The mix of sales to commercial and U.S. government sector end users;
     • The timing and amount of revenue recognized and deferred;
     • New product introductions and enhancements;
     • Licensing and royalty arrangements;

                                                         14
• Excess inventory levels or purchase commitments as a result of changes in demand forecasts or last time buy
       purchases;

     • Possible product and software defects as we transition our products; and

     • The cost of components, contract manufacturing costs, quality, warranty, and freight.

     Changes in software entitlements and maintenance gross margins may result from various factors, such as:

     • The size of the installed base of products under support contracts;

     • The timing of technical support service contract renewals;

     • Demand for and the timing of delivery of upgrades; and

     • The level of spending on our customer support infrastructure.

     Changes in service gross margins may result from various factors, such as:

     • The mix of customers;

     • The size and timing of service contract renewals;

     • Spares stocking requirements to support new product introductions;

     • The volume, cost and use of outside partners to deliver support services on our behalf; and

     • Product quality and serviceability issues.

     Due to such factors, gross margins are subject to variations from period to period and are difficult to predict.


  An increase in competition and industry consolidation could materially and adversely affect our operating
  results.

     The storage and data management markets are intensely competitive and are characterized by rapidly changing
technology. In the storage market, our primary and near-line storage system products and our associated software
portfolio compete primarily with storage system products and data management software from EMC, Hitachi Data
Systems, HP, IBM, and Oracle Corporation, through its acquisition of Sun Microsystems. In addition, Dell, Inc. is a
competitor in the storage marketplace through its business arrangement with EMC, which allows Dell to resell
EMC storage hardware and software products, as well as through Dell’s acquisition of EqualLogic, through which
Dell offers low-priced storage solutions. In the secondary storage market, which includes the disk-to-disk backup,
compliance and business continuity segments, our solutions compete primarily against products from EMC and
Oracle Corporation, through its acquisition of Sun Microsystems.

     There has been a trend toward industry consolidation in our markets for several years. For example, in January
2010, Oracle Corporation, one of our strategic partners, completed its acquisition of Sun Microsystems, one of our
competitors; in addition, in July 2009, EMC, one of our competitors, acquired Data Domain. We expect this trend to
continue as companies attempt to strengthen or hold their market positions in an evolving industry and as companies
become unable to maintain their competitive positions or continue operations. We believe that industry consol-
idation may result in stronger competitors that are better able to compete as sole-source vendors for customers. In
addition, current and potential competitors have established or may establish strategic alliances among themselves
or with third parties, including some of our partners. For example, in November 2009, Cisco and EMC together with
VMware announced a Virtual Computing Environment coalition. It is possible that new competitors or alliances
among competitors may emerge and rapidly acquire significant market share. We may not be able to compete
successfully against current or future competitors. Competitive pressures we face could materially and adversely
affect our business and operating results.

                                                         15
Disruption of or changes in our distribution model could harm our sales.

     If we fail to develop and maintain strong relationships with our distributors, or if our distributors fail to
effectively manage the sale of our products or services on our behalf, our revenues and gross margins could be
adversely affected.

      We market and sell our storage data management solutions directly through our worldwide sales force and
indirectly through channel partners such as value-added resellers, systems integrators, distributors, OEMs and
strategic business partners, and we derive a significant portion of our revenues from these indirect channels. During
fiscal 2010, revenues generated from sales from our indirect channel distribution accounted for 69% of our
revenues. In order for us to maintain or increase our revenues, we must effectively manage our relationships with
channel partners.

    Several factors could result in disruption of or changes in our indirect channel distribution model, which could
materially harm our revenues and gross margins, including the following:

     • Our indirect channel partners may compete directly with other channel partners or with our direct sales
       force. Due to these conflicts, our indirect channel partners could stop or reduce their efforts in marketing our
       products.

     • Our indirect channel partners may demand that we absorb a greater share of the risks that their customers
       may ask them to bear;

     • Our indirect channel partners may have insufficient financial resources and may not be able to withstand
       changes and challenges in business conditions; and

     • Our indirect channel partners’ financial condition or operations may weaken.

      There is no assurance that we will be able to attract new indirect channel partners, retain these indirect channel
partners or that we will be able to secure additional or replacement indirect channel partners in the future, especially
in light of changes in end customer demand patterns and changes in available and competing technologies from
competitors. The loss of one or more of our key indirect channel partners in a given geographic area could harm our
operating results within that area, as qualifying and developing new indirect channel partners typically requires a
significant investment of time and resources before acceptable levels of productivity are met. Our inability to
effectively establish, train, retain and manage our distribution channel could harm our sales.

     In addition, we depend on our indirect channel partners to comply with applicable regulatory requirements in
the jurisdictions in which they operate. Their failure to do so could have a material adverse effect on our revenues
and operating results.


  Our OEM relationship may not continue to generate significant revenues.

     In April 2005, we entered into an OEM agreement with IBM, which enables IBM to sell IBM branded
solutions based on NetApp unified solutions, including NearStore» and V-Series systems, as well as associated
software offerings. While this agreement is an element of our strategy to expand our reach into more customers and
countries, we do not have an exclusive relationship with IBM, and there is no minimum commitment for any given
period of time; therefore, this relationship may not continue to generate significant revenues. In addition, we have
no control over the products that IBM selects to sell, or its release schedule and timing of those products; nor do we
control its pricing.

     In the event that sales through our OEM relationship increase, we may experience distribution channel
conflicts between our direct sales force and the OEM or among our channel partners. If we fail to minimize channel
conflicts, or if our OEM relationship does not continue to generate significant revenues, our operating results and
financial condition could be harmed.

                                                          16
A portion of our revenues is generated by large, recurring purchases from various customers, resellers
  and distributors. A loss, cancellation or delay in purchases by any of these parties has and in the future
  could negatively affect our revenues.
     During fiscal 2010, sales to distributors Arrow and Avnet accounted for approximately 14% and 11%,
respectively of our net revenues. The loss of orders from these, or any of our more significant customers, strategic
partners, distributors or resellers could cause our revenues and profitability to suffer. Our ability to attract new
customers will depend on a variety of factors, including the cost-effectiveness, reliability, scalability and com-
prehensiveness of our product offerings, and our ability to address customer demands.
    We also have an agreement with Fujitsu Technology Solutions (“Fujitsu”), which enables Fujitsu to lease, sell,
market and resell NetApp products to end users and Fujitsu sales partners worldwide and to integrate NetApp
products into Fujitsu bundled offerings, as well as to market NetApp’s support services.
      We generally do not enter into binding purchase commitments with our customers for an extended period of
time, and thus we may not be able to continue to receive large, recurring orders from these customers, resellers or
distributors. For example, our reseller agreements generally do not require minimum purchases and our customers,
resellers and distributors can stop purchasing and marketing our products at any time.
     Unfavorable economic conditions may negatively impact our operations by affecting the solvency of our
customers, resellers and distributors, or the ability of our customers to obtain credit to finance purchases of our
products. If the uncertainty in the economy continues, or conditions deteriorate, and our sales decline, our financial
condition and operating results could be adversely impacted.
     Because our expenses are based on our revenue forecasts, a substantial reduction or delay in sales of our
products to, or unexpected returns from customers and resellers, or the loss of any significant customer or reseller,
could harm our business. We expect that our largest customers in the future could be different from our largest
customers today. End users could stop purchasing and indirect channel partners could stop marketing our products
at any time. The loss of one or more of our key indirect channel partners or the failure to obtain and ship a number of
large orders each quarter could harm our operating results. In addition, a change in the pricing practices of one or
more of our large customers could adversely affect our revenues and gross margins.

  The U.S. government has contributed to our revenue growth and has become an important customer for
  us. Future revenue from the U.S. government is subject to shifts in government spending patterns. A
  decrease in government demand for our products could materially affect our revenues. In addition, our
  business could be adversely affected as a result of future examinations by the U.S. government.
     The U.S. government has become an important customer for the storage and data management market and for us;
however, government demand is unpredictable, and there can be no assurance that we will maintain or grow our revenues
from the U.S. government. Government agencies are subject to budgetary processes and expenditure constraints that
could lead to delays or decreased capital expenditures in IT spending. If the government or individual agencies within the
government reduce or shift their capital spending patterns, our revenues and operating results may be harmed.
     In addition, selling our products to the U.S. government also subjects us to certain regulatory requirements. For
example, in April 2009, we entered into a settlement agreement with the United States of America, acting through the
United States Department of Justice (“DOJ”) and on behalf of the General Services Administration (the “GSA”), under
which we paid the United States $128.0 million, plus interest of $0.7 million, related to a dispute regarding our discount
practices and compliance with the price reduction clause provisions of GSA contracts between August 1997 and
February 2005. The failure to comply with U.S. government regulatory requirements could subject us to fines and other
penalties, which could have a material adverse effect on our revenues, operating results and financial position.

  If we are unable to maintain our existing relationships and develop new relationships with major
  strategic partners, our revenues may be impacted negatively.
    An element of our strategy to increase revenues is to strategically partner with major third-party software and
hardware vendors to integrate our products into their products and also co-market our products with the vendors. We
have significant partner relationships with database, business application, backup management and server

                                                           17
virtualization companies, including Microsoft, Oracle, SAP, Symantec and VMware. In addition, in November 2009,
we announced our intention to expand our relationship with Fujitsu, and in January 2010, we announced an expansion
of our collaboration with Cisco and VMware, including a cooperative support arrangement. A number of these
strategic partners are industry leaders that offer us expanded access to segments of the storage and data management
market. There is intense competition for attractive strategic partners, and even if we can establish relationships with
these or other partners, these partnerships may not generate significant revenues or may not continue to be in effect for
any specific period of time. If these relationships fail to materialize as expected, we could experience lower than
expected revenue growth, suffer delays in product development, or other operational difficulties.

     In addition, some of our partners, including Oracle, Cisco and VMware, are also partnering with other storage
vendors which may increase the availability of competing solutions, harm our ability to continue as the vendor of
choice for those partners and harm our ability to grow our business with those partners.

     We intend to continue to establish and maintain business relationships with technology companies to expand
our marketing reach and accelerate the development of our storage and data management solutions. To the extent
that we are unsuccessful in developing new relationships or maintaining our existing relationships, our future
revenues and operating results could be impacted negatively. In addition, the loss of a strategic partner could have a
material adverse effect on our revenues and operating results.

  Our future financial performance depends on growth in the storage and data management markets. If the
  performance of these markets does not meet the expectations upon which we calculate and forecast our
  revenues, our operating results will be materially and adversely impacted.

      All of our products address the storage and data management markets. Accordingly, our future financial
performance will depend in large part on continued growth in the storage and data management markets and on our
ability to adapt to emerging standards in these markets. The markets for storage and data management have been
recently adversely impacted by the global economic uncertainty, and as a result of continued uncertainty, the
markets may not grow as anticipated or may decline.

      Additionally, emerging standards in these markets may adversely affect the UNIX», Windows» and the World
Wide Web server markets upon which we depend. For example, we provide our open access data retention solutions
to customers within the financial services, healthcare, pharmaceutical and government market segments, industries
that are subject to various evolving governmental regulations with respect to data access, reliability and permanence
(such as Rule 17(a)(4) of the Securities Exchange Act of 1934, as amended) in the United States and in the other
countries in which we operate. If our products do not meet and continue to comply with these evolving
governmental regulations in this regard, customers in these market and geographical segments will not purchase
our products, and we will not be able to expand our product offerings in these market and geographical segments at
the rates which we have forecasted.

  Supply chain issues, including financial problems of contract manufacturers or component suppliers, or
  a shortage of adequate component supply or manufacturing capacity that increases our costs or causes a
  delay in our ability to fulfill orders, could have a material adverse impact on our business and operating
  results, and our failure to estimate customer demand properly may result in excess or obsolete component
  supply, which could adversely affect our gross margins.

     The fact that we do not own or operate our manufacturing facilities and supply chain exposes us to risks,
including reduced control over quality assurance, production costs and product supply, which could have a material
adverse impact on the supply of our products and on our business and operating results. We rely on a limited number
of suppliers for components utilized in the assembly of our products, which has and could subject us to future
periodic supply constraints and price rigidity.

     Financial problems of either contract manufacturers, component suppliers or other parties in our supply chain
and reservation of manufacturing capacity at our contract manufacturers by other companies, inside or outside of
our industry, could either limit supply or increase costs of our products. Qualifying a new contract manufacturer and

                                                           18
commencing volume production is expensive and time-consuming, and disruption or termination of manufacturing
capacity from any contract manufacturer could negatively impact our ability to manufacture and sell our products.
      We intend to regularly introduce new products and product enhancements, which will require us to rapidly
achieve volume production by coordinating with our contract manufacturers and suppliers. A reduction or
interruption in supply; a significant increase in the price of one or more components; a failure to adequately
procure inventory by our contract manufacturers; a failure to appropriately cancel, reschedule, or adjust our
requirements based on our business needs; or a decrease in demand for our products could materially adversely
affect our business, operating results, and financial condition and could materially damage customer relationships.
Furthermore, as a result of binding price or purchase commitments with suppliers, we may be obligated to purchase
components at prices that are higher than those available in the current market. In the event that we become
committed to purchase components at prices in excess of the current market price when the components are actually
used, our gross margins could decrease. As the demand for our products has increased, we have experienced, and
may continue to experience tightening of supply of some components leading to longer lead times and component
supply constraints, which has and in the future could continue to result in the delay of shipments.

  We are exposed to the credit and non-payment risk of our customers, resellers, and distributors, especially
  during times of economic uncertainty and tight credit markets, which could result in material losses.
    Most of our sales to customers are on an open credit basis, with typical payment terms of 30 days. While we
monitor individual customer payment capability in granting such open credit arrangements, and seek to limit such
open credit to amounts we believe are reasonable, we may experience losses due to a customer’s inability to pay.
     Beyond our open credit arrangements, we also have recourse and nonrecourse customer financing leasing
arrangements using third party leasing companies. Under the terms of recourse leases, which are treated as off-
balance sheet arrangements, we remain liable for the aggregate unpaid remaining lease payments to the third party
leasing company in the event of end-user customer default. We also offer financing arrangements whereby the end-
user customer pays a fixed monthly amount plus a variable amount based on actual storage capacity used. These
arrangements subject us to additional risk around revenue recognition and profitability due to the uncertainties
associated with the variable portion of the arrangements. In addition, from time to time we provide guarantees for a
portion of other financing arrangements under which we could be called upon to make payments to our funding
parties in the event of nonpayment by end-user customers.
      We expect demand for customer financing to continue. During periods of economic uncertainty, our exposure
to credit risks from our customers increases. In addition, our exposure to credit risks of our customers may increase
further if our customers and their customers or their lease financing sources are adversely affected by global
economic conditions.
      In the past, there have been bankruptcies by our customers, both who have open credit and who have lease
financing arrangements with us, causing us to incur bad debt charges, and, in the case of financing arrangements, a
loss of revenues. We may be subject to similar losses in future periods. Any future losses could harm our business
and have a material adverse effect on our operating results and financial condition. Additionally, to the extent that
the recent turmoil in the credit markets makes it more difficult for customers to obtain open credit or lease financing,
those customers’ ability to purchase our product could be adversely impacted, which in turn could have a material
adverse impact on our financial condition and operating results.

  The market price for our common stock has fluctuated significantly in the past and will likely continue to
  do so in the future.
     The market price for our common stock has experienced substantial volatility in the past, and several factors
could cause substantial fluctuation in the future. These factors include but are not limited to:
     • Fluctuations in our operating results compared to prior periods and forecasts;
     • Variations between our operating results and either the guidance we have furnished to the public or the
       published expectations of securities analysts;
     • Industry consolidation and the resulting perception of increased competition;

                                                          19
• Economic developments in the storage and data management market as a whole;
     • Fluctuations in the valuation of companies perceived by investors to be comparable to us;
     • Changes in analysts’ recommendations or projections;
     • Changes in our relationships with our suppliers, customers, channel and strategic partners;
     • Announcements of the completion or dissolution of strategic alliances within the industry;
     • Dilutive impacts of our convertible Notes and related warrants;
     • International conflicts and acts of terrorism;
     • Announcements of new products, applications, or product enhancements by us or our competitors;
     • Inquiries by the SEC, NASDAQ, law enforcement, or other regulatory bodies; and
     • General market conditions, including recent global or regional economic uncertainties.
     In addition, the stock market has experienced volatility that has particularly affected the market prices of the
equity securities of many technology companies. Certain macroeconomic factors such as changes in interest rates,
the market climate for the technology sector, and levels of corporate spending on IT, could continue to have an
impact on the trading price of our stock, and the market price of our common stock may fluctuate significantly in the
future.

  Changes in market conditions have led, and in the future could lead, to charges related to the
  discontinuance of certain of our products and asset impairments.
     In response to changes in economic conditions and market demands, we may decide to strategically realign our
resources and consider cost containment measures including restructuring, disposing of, or otherwise discontinuing
certain products. Any decision to limit investment in, dispose of, or otherwise exit products may result in the
recording of charges to earnings, including inventory and technology-related or other intangible asset write-offs,
workforce reduction costs, charges relating to consolidation of excess facilities, cancellation penalties or claims
from third parties who were resellers or users of discontinued products, which would harm our operating results.
Our estimates with respect to the useful life or ultimate recoverability of our carrying basis of assets, including
purchased intangible assets, could change as a result of such assessments and decisions. Additionally, we are
required to perform goodwill impairment tests on an annual basis, and between annual tests in certain circumstances
when impairment indicators exist or if certain events or changes in circumstances have occurred. Future goodwill
impairment tests may result in charges to earnings, which could materially harm our operating results.

  If we are unable to develop and introduce new products and respond to technological change, if our new
  products do not achieve market acceptance, if we fail to manage the interoperability and transition
  between our new and old products, or if we cannot provide the expected level of service and support for
  our new products, our operating results could be materially and adversely affected.
     Our future growth depends upon the successful development and introduction of new hardware and software
products. Due to the complexity of storage subsystems and storage security appliances and the difficulty in gauging
the engineering effort required to produce new products, such products are subject to significant technical risks. In
addition, our new products must respond to technological changes and evolving industry standards. If we are
unable, for technological or other reasons, to develop and introduce new products in a timely manner in response to
changing market conditions or customer requirements, or if such products do not achieve market acceptance, our
operating results could be materially and adversely affected. New or additional product introductions increase the
complexities of forecasting revenues, and subject us to additional financial and operational risks. If they are not
managed effectively, we could experience material risks to our operations, financial condition and business model.
    As new or enhanced products are introduced, we must successfully manage the interoperability and transition
from older products in order to minimize disruption in customers’ ordering patterns, avoid excessive levels of older
product inventories, and ensure that enough supplies of new products can be delivered to meet customers’ demands.

                                                         20
As we enter new or emerging markets, we will likely increase demands on our service and support operations
and may be exposed to additional competition. We may not be able to provide products, service and support to
effectively compete for these market opportunities.


  Risks inherent in our international operations could have a material adverse effect on our business.

     A substantial portion of our revenues are derived from sales outside of the United States. During fiscal 2010,
our international revenues accounted for 50% of our total revenues. A substantial portion of our products are
manufactured outside of the U.S., and we have research and development and service centers overseas. Accord-
ingly, our business and our future operating results could be adversely affected by a variety of factors affecting our
international operations, some of which are beyond our control, including regulatory, political, or economic
conditions in a specific country or region, trade protection measures and other regulatory requirements, government
spending patterns, and acts of terrorism and international conflicts. In addition, we may not be able to maintain or
increase international market demand for our products.

      We face exposure to adverse movements in foreign currency exchange rates as a result of our international
operations. These exposures may change over time as business practices evolve, and they could have a material
adverse impact on our financial results and cash flows. Our international sales are denominated in U.S. dollars and
in foreign currencies. An increase in the value of the U.S. dollar relative to foreign currencies could make our
products more expensive and therefore potentially less competitive in foreign markets. Conversely, lowering our
price in local currency may result in lower U.S.-based revenues. A decrease in the value of the U.S. dollar relative to
foreign currencies could increase operating expenses in foreign markets. Additionally, we have exposures to
emerging market currencies, which can experience extreme volatility. We utilize forward and option contracts to
hedge our foreign currency exposure associated with certain assets and liabilities as well as anticipated foreign
currency cash flows on a short-term basis. All balance sheet hedges are marked to market through earnings every
quarter. The time-value component of our cash flow hedges is recorded in earnings while all other gains and losses
are marked to market through other comprehensive income until forecasted transactions occur, at which time such
realized gains and losses are recognized in earnings. These hedges attempt to reduce, but do not always entirely
eliminate, the impact of currency exchange movements. Factors that could have a negative impact on the
effectiveness of our hedging program include inaccuracies in forecasting, widening interest rate differentials,
and volatility in the foreign exchange market. Our hedging strategies may not be successful and currency exchange
rate fluctuations could have a material adverse effect on our operating results.

      Certain United States Government export restrictions impede our ability to sell to certain end users certain of
our products. The United States, through the Bureau of Industry Security, places restrictions on the export of certain
encryption technology. These restrictions may include: the requirement to have a license to export the technology;
the requirement to have software licenses approved before export is allowed; and outright bans on the licensing of
certain encryption technology to particular end users or to all end users in a particular country. Certain of our
products are subject to various levels of export restrictions. These export restrictions could negatively impact our
business. Our international operations are subject to other risks, including general import/export restrictions,
regulations related to data privacy, and other complex rules and regulations under which we must conduct business
in foreign countries. We are also subject to the potential loss of proprietary information due to piracy, misappro-
priation or laws that may be less protective of our intellectual property rights than U.S. law. Such factors could have
an adverse impact on our business, operating results and financial position.

    Additional risks inherent in our international business activities generally include, among others, longer
accounts receivable payment cycles and difficulties in managing international operations.

     Moreover, in many foreign countries, particularly in those with developing economies, it is common to engage
in business practices that are prohibited by regulations applicable to us, such as the Foreign Corrupt Practices Act.
Although we implement policies and procedures designed to ensure compliance with these laws, our employees,
contractors and agents, as well as those companies to which we outsource certain of our business operations, may
take actions in violation of these policies. Any such violation could subject us to fines and other penalties, which
could have a material adverse effect on our business, financial condition or results of operations.

                                                          21
Changes in our effective tax rate or adverse outcomes resulting from examination of our income tax
  returns could adversely affect our results.
     Our effective tax rate could be adversely affected by several factors, many of which are outside of our control,
including:
     • Earnings being lower than anticipated in countries where we are taxed at lower rates as compared to the
       U.S. statutory tax rate;
     • Material differences between forecasted and actual tax rates as a result of a shift in the mix of pretax profits
       and losses by tax jurisdiction, our ability to use tax credits, or effective tax rates by tax jurisdiction that differ
       from our estimates;
     • Changing tax laws or related interpretations, accounting standards, regulations, and interpretations in
       multiple tax jurisdictions in which we operate, as well as the requirements of certain tax rulings;
     • An increase in expenses not deductible for tax purposes, including certain stock-based compensation
       expense, write-offs of acquired in-process research and development, and impairment of goodwill;
     • The tax effects of purchase accounting for acquisitions and restructuring charges that may cause fluctuations
       between reporting periods;
     • Changes related to our ability to ultimately realize future benefits attributed to our deferred tax assets,
       including those related to other-than-temporary impairments;
     • Tax assessments resulting from income tax audits or any related tax interest or penalties could significantly
       affect our income tax provision for the period in which the settlements take place; and
     • A change in our decision to indefinitely reinvest foreign earnings.
      We receive significant tax benefits from sales to our non-U.S. customers. These benefits are contingent upon
existing tax regulations in the United States and in the countries in which our international operations are located.
Future changes in domestic or international tax regulations could adversely affect our ability to continue to realize
these tax benefits. We have not provided for United States federal and state income taxes or foreign withholding
taxes that may result on future remittances of undistributed earnings of foreign subsidiaries. The Obama admin-
istration has announced several proposals to reform United States tax rules, including proposals that may result in a
reduction or elimination of the deferral of United States income tax on our future unrepatriated earnings. Should
such anti-deferral provisions be enacted, our effective tax rate could be adversely affected.
      We are currently undergoing federal income tax audits in the United States and several foreign tax jurisdictions. The
rights to some of our intellectual property (“IP”) are owned by certain of our foreign subsidiaries, and payments are made
between U.S. and foreign tax jurisdictions relating to the use of this IP in a qualified cost sharing arrangement. In recent
years, several other U.S. companies have had their foreign IP arrangements challenged as part of IRS examinations,
which has resulted in material proposed assessments and/or litigation with respect to those companies.
     During fiscal year 2009, we received Notices of Proposed Adjustments from the IRS in connection with a
federal income tax audit of our fiscal 2003 and 2004 tax returns. We filed a protest with the IRS in response to the
Notices of Proposed Adjustments and subsequently received a rebuttal from the IRS examination team in response
to our protest. We recently were informed by the IRS that this audit will proceed to the IRS Appeals level for further
administrative review. The Notices of Proposed Adjustments in this audit focus primarily on issues of the timing and
the amount of income recognized and deductions taken during the audit years and on the level of cost allocations
made to foreign operations during the audit years.
     The IRS recently commenced the examination of our fiscal 2005 through 2007 federal income tax returns, and in
addition, the California Franchise Tax Board has notified us of their intent to examine our fiscal 2007 and 2008
California tax returns. The scope of the IRS and California Franchise Tax Board examinations are unclear at this time.
     If the ultimate determination of income taxes assessed under the current IRS audits or under audits being conducted
in any of the other tax jurisdictions in which we operate results in an amount in excess of the tax provision we have
recorded or reserved for, our operating results, cash flows and financial condition could be adversely affected.

                                                            22
Our international operations currently benefit from a tax ruling concluded in the Netherlands which expires on
April 30, 2015 and results in a lower level of earnings subject to tax in the Netherlands. If we are unable to negotiate
a similar tax ruling upon expiration of the current ruling, our effective tax rate could increase and our operating
results could be adversely affected. Our effective tax rate could also be adversely affected by different and evolving
interpretations of existing law or regulations, which in turn would negatively impact our operating and financial
results as a whole. Our effective tax rate could also be adversely affected if there is a change in international
operations and how the operations are managed and structured. The price of our common stock could decline to the
extent that our financial results are materially affected by an adverse change in our effective tax rate.

  Our leverage and debt service obligations may adversely affect our financial condition, results of
  operations and our earnings per share.
     As a result of the sale of our Notes, we have a greater amount of long-term debt than we have maintained in the
past. In addition, we have various synthetic lease arrangements related to some of our facilities at our corporate
headquarters in Sunnyvale, California, and, subject to the restrictions in our existing and any future financing
agreements, we may incur additional debt. Our maintenance of higher levels of indebtedness could have adverse
consequences including:
     • Impacting our ability to satisfy our obligations;
     • Increasing the portion of our cash flows from operations may have to be dedicated to interest and principal
       payments and may not be available for operations, working capital, capital expenditures, expansion,
       acquisitions or general corporate or other purposes;
     • Impairing our ability to obtain additional financing in the future;
     • Limiting our flexibility in planning for, or reacting to, changes in our business and industry; and
     • Making us more vulnerable to downturns in our business, our industry or the economy in general.
     Our ability to meet our expenses and debt obligations will depend on our future performance, which will be
affected by financial, business, economic, regulatory and other factors. We will not be able to control many of these
factors, such as economic conditions and governmental regulations. Furthermore, our operations may not generate
sufficient cash flows to enable us to meet our expenses and service our debt. As a result, we may be required to
repatriate funds from our foreign subsidiaries which could result in a significant tax liability to us. If we are unable
to generate sufficient cash flows from operations, or if we are unable to repatriate sufficient or any funds from our
foreign subsidiaries, in order to meet our expenses and debt service obligations, we may need to enter into new
financing arrangements to obtain the necessary funds, or we may be required to raise additional funds through other
means. If we determine it is necessary to seek additional funding for any reason, we may not be able to obtain such
funding or, if funding is available, obtain it on acceptable terms. If we fail to make a payment on our debt, we could
be in default on such debt, and this default could cause us to be in default on our other outstanding indebtedness.

  The note hedges and warrant transactions that we entered into in connection with the sale of the Notes
  may affect the trading price of our common stock.
      In connection with the issuance of the Notes, we entered into privately negotiated convertible note hedge
transactions with certain option counterparties (the “Counterparties”), which are expected to offset the potential
dilution to our common stock upon any conversion of the Notes. At the same time, we also entered into warrant
transactions with the Counterparties pursuant to which we may issue shares of our common stock above a certain
strike price. In connection with these hedging transactions, the Counterparties may have entered into various
over-the-counter derivative transactions with respect to our common stock or purchased shares of our common
stock in secondary market transactions at or following the pricing of the Notes. Such activities may have had the
effect of increasing the price of our common stock. The Counterparties are likely to modify their hedge positions
from time to time prior to conversion or maturity of the Notes by purchasing and selling shares of our common stock
or entering into other derivative transactions. Additionally, these transactions may expose us to counterparty credit
risk for nonperformance. The effect, if any, of any of these transactions and activities on the market price of our
common stock or the Notes will depend, in part, on market conditions and cannot be ascertained at this time, but any

                                                           23
of these activities could adversely affect the value of our common stock. In addition, if our stock price exceeds the
strike price for the warrants, there could be additional dilution to our shareholders, which could adversely affect the
value of our common stock.

     Lehman Brothers OTC Derivatives, Inc. (“Lehman OTC”) was the counterparty to 20% of our Note hedges.
The bankruptcy filing by Lehman OTC on October 3, 2008 constituted an “event of default” under the hedge
transaction. In April 2010, we terminated the hedge transaction with Lehman OTC in exchange for an unsecured
bankruptcy claim, which we subsequently sold to a third party for approximately $14 million. Because we have
decided not to replace the hedge, we are subject to potential dilution on the 20% unhedged portion of our Notes upon
conversion if on the date of conversion the per-share market price of our common stock exceeds the conversion
price of $31.85. The terms of the Notes, the rights of the holders of the Notes and other counterparties to Note
hedges and warrants were not affected by the termination of this hedge.

     The price of our common stock could also be affected by sales of our common stock by investors who view the
Notes as a more attractive means of equity participation in our company and by hedging or arbitrage trading activity
that we expect to develop involving our common stock by holders of the Notes. The hedging or arbitrage could, in
turn, affect the trading price of the Notes and warrants.


  Future issuances of common stock related to our Notes, warrants, stock options, restricted stock units,
  and our Employee Stock Purchase Plan may adversely affect the trading price of our common stock and
  the Notes.

     The conversion of some or all of our outstanding Notes will dilute the ownership interest of existing
stockholders to the extent we deliver common stock upon conversion of the Notes. We will satisfy our obligation
upon conversion by delivering cash for the principal amount of the Notes and shares of common stock, if any, to the
extent the conversion value exceeds the principal amount. Any new issuance of equity securities, including the
issuance of shares upon conversion of the Notes or the exercise of related warrants which are not offset by our Note
hedges, could dilute the interests of our then-existing stockholders, including holders who receive shares upon
conversion of their Notes, and could substantially decrease the trading price of our common stock and the Notes. In
addition, any sales in the public market of any common stock issuable upon such conversion or the exercise of
warrants could adversely affect prevailing market prices of our common stock.

      As of April 30, 2010, we had options to purchase approximately 35 million shares of our common stock
outstanding and a total of approximately 9 million restricted shares and restricted stock units outstanding. If all of
these outstanding options were exercised, and all of the outstanding restricted stock and restricted stock units
vested, the proceeds to the Company would average approximately $18 per share. We also had 15.5 million shares
of our common stock reserved for issuance under our stock plans with respect to equity awards that have not been
granted. The exercise of all of the outstanding options and/or the vesting of all outstanding restricted shares and
restricted stock units would dilute the interests of our then-existing stockholders, and any sales in the public market
of the common stock issuable upon such exercise could adversely affect the trading price of our common stock.

     In addition, we have an Employee Stock Purchase Plan (ESPP) under which employees are entitled to purchase
shares of our common stock at 85% of the fair market value at certain specified dates over a two-year period. As of
April 30, 2010, we had approximately 5.0 million shares of our common stock available for issuance under the
ESPP. The issuance of shares under the ESPP would dilute the interests of our then-existing stockholders, and any
sales in the public market of the common stock issuable upon such exercise could adversely affect the trading price
of our common stock.

     We may issue equity securities in the future for a number of reasons, including to finance our operations related
to business strategy (including in connection with acquisitions, strategic alliances or other transactions), to increase
our capital, to adjust our ratio of debt to equity, to satisfy our obligations upon the exercise of outstanding warrants
or options upon conversion of the Notes, or for other reasons.

                                                          24
We are exposed to fluctuations in the market values of our portfolio investments and in interest rates;
  impairment of our investments could harm our financial results.
     At April 30, 2010, we had $3.8 billion in cash, cash equivalents, available-for-sale securities and restricted
cash and investments. We invest our cash in a variety of financial instruments, consisting principally of investments
in U.S. Treasury securities, commercial paper, U.S. government agency bonds, corporate bonds, auction rate
securities, certificates of deposit, and money market funds. These investments are subject to general credit,
liquidity, market and interest rate risks, which have been exacerbated by unusual events such as the financial and
credit crisis, and bankruptcy filings in the United States which have affected various sectors of the financial markets
and led to global credit and liquidity issues. These securities are generally classified as “available-for-sale” and,
consequently, are recorded on our consolidated balance sheets at fair value with unrealized gains or losses reported
as a component of accumulated other comprehensive income (loss), net of tax.
      Investments in both fixed rate and floating rate interest earning instruments carry a degree of interest rate risk.
Fixed rate debt securities may have their market value adversely impacted due to a rise in interest rates, while
floating rate securities may produce less income than expected if interest rates fall. Due in part to these factors, our
future investment income may fall short of expectations due to changes in interest rates. Currently, we do not use
derivative financial instruments in our investment portfolio. We may suffer losses if forced to sell securities that
have experienced a decline in market value because of changes in interest rates. Currently, we do not use financial
derivatives to hedge our interest rate exposure.
      The fair value of our investments may change significantly due to events and conditions in the credit and
capital markets. For instance, as a result of the bankruptcy filing of Lehman Brothers, which occurred during fiscal
2009, we recorded an other-than-temporary impairment charge of $11.8 million on our corporate bonds related to
investments in Lehman Brothers securities and approximately $9.3 million on our investments in the Primary Fund
that held Lehman Brothers investments. Any investment securities that we hold or the issues of such securities could
be subject to review for possible downgrade. Any downgrade in these credit ratings may result in an additional
decline in the estimated fair value of our investments. Changes in the various assumptions used to value these
securities and any increase in the markets’ perceived risk associated with such investments may also result in a
decline in estimated fair value. If such investments suffer market price declines, as we experienced with some of our
investments during fiscal 2009, we may recognize in earnings the decline in the fair value of our investments below
their cost basis when the decline is judged to be other-than-temporary.
     On occasion, we make strategic investments in other companies, including private equity funds, which may
decline in value and/or not meet desired objectives. The success of these investments depends on various factors
over which we may have limited or no control. As of April 30, 2010, we had an investment with the carrying value of
$1.4 million in a private equity fund. The risks to our strategic investment portfolio may be exacerbated by
unfavorable financial market and macroeconomic conditions and, as a result, the value of the investment portfolio
could be negatively impacted and lead to impairment charges.
      In the event of adverse conditions in the credit and capital markets, our investment portfolio may be impacted
and we could determine that some or all of our investments have experienced an other-than-temporary decline in
fair value, requiring further impairments, which could adversely impact our financial position and operating results.

  A significant portion of our cash and cash equivalents balances are held overseas. If we are not able to
  generate sufficient cash domestically in order to fund our U.S. operations and strategic opportunities, and
  to service our debt, we may incur a significant tax liability in order to repatriate the overseas cash
  balances, or we may need to raise additional capital in the future.
     A portion of our earnings which is generated from our international operations is held and invested by certain
of our foreign subsidiaries. These amounts are not freely available for dividend repatriation to the United States
without triggering significant adverse tax consequences, which could adversely affect our financial results. As a
result, if the cash generated by our domestic operations is not sufficient to fund our domestic operations, our broader
corporate initiatives such as stock repurchases, acquisitions, and other strategic opportunities, and to service our
outstanding indebtedness, we may need to raise additional funds through public or private debt or equity financings,
or we may need to obtain new credit facilities to the extent we choose not to repatriate our overseas cash. Such

                                                           25
additional financing may not be available on terms favorable to us, or at all, and any new equity financings or
offerings would dilute our current stockholders’ ownership. Furthermore, lenders, particularly in light of the current
challenges in the credit markets, may not agree to extend us new, additional or continuing credit. If adequate funds
are not available, or are not available on acceptable terms, we may be forced to repatriate our foreign cash and incur
a significant tax expense or we may not be able to take advantage of strategic opportunities, develop new products,
respond to competitive pressures or repay our outstanding indebtedness. In any such case, our business, operating
results or financial condition could be adversely impacted.

  Our synthetic leases are off-balance sheet arrangements that could negatively affect our financial
  condition and operating results. We have invested substantial resources in new facilities and physical
  infrastructure, which will increase our fixed costs. Our operating results could be harmed if our business
  does not grow proportionately to our increase in fixed costs.
     We have various synthetic lease arrangements with BNP Paribas Leasing Corporation as lessor (“BBPPLC”)
for our headquarters office buildings and land in Sunnyvale, California. These synthetic leases qualify for operating
lease accounting treatment under the accounting guidance for leases and are not considered variable interest entities
under applicable accounting guidance. Therefore, we do not include the properties or the associated debt on our
condensed consolidated balance sheet. However, if circumstances were to change regarding our or BNPPLC’s
ownership of the properties, or in BNPPLC’s overall portfolio, we could be required to consolidate the entity, the
leased facilities and the associated debt.
     Our future minimum lease payments under these synthetic leases limit our flexibility in planning for, or
reacting to, changes in our business by restricting the funds available for use in addressing such changes. If we are
unable to grow our business and revenues proportionately to our increase in fixed costs, our operating results will be
harmed. If we elect not to purchase the properties at the end of the lease term, we have guaranteed a minimum
residual value to BNPPLC. If the fair value of the properties declines below that guaranteed minimum residual
value, our residual value guarantee would require us to pay the difference to BNPPLC. As of April 30, 2010, the
estimated fair value of the properties was approximately $36.9 million below the guaranteed minimum residual
value, which we will accrue over the remaining term of the respective leases. Any further decline in the fair value of
the properties could adversely impact our cash flows, financial condition and operating results.
     As a result of excess capacity in our Sunnyvale facilities, certain of our facilities subject to synthetic lease
arrangements have been subleased or are vacant. These subleases will expire through 2012 and we may not be able
to generate sufficient sublease income to cover the carrying costs of these facilities. In addition, we may experience
changes in our operations in the future that could result in additional excess capacity and vacant facilities. We will
continue to be responsible for all carrying costs of these facilities under operating leases until such time as we can
sublease these facilities or terminate the applicable leases based on the contractual terms of the operating lease
agreements, and these costs may have an adverse effect on our business, operating results and financial condition.

  We have credit exposure to our hedging counterparties.
      In order to minimize volatility in earnings associated with fluctuations in the value of foreign currency relative
to the U.S. Dollar, we utilize forward and option contracts to hedge our exposure to foreign currencies. As a result of
entering into these hedging contracts with major financial institutions, we may be subject to counterparty
nonperformance risk. Should there be a counterparty default, we could be exposed to the net losses on the hedged
arrangements or be unable to recover anticipated net gains from the transactions.

  We are subject to restrictive and financial covenants in our synthetic lease arrangements. The restrictive
  covenants may restrict our ability to operate our business.
     Our ongoing extension of credit under our synthetic lease arrangements are subject to continued compliance
with financial covenants. If we do not comply with these restrictive and financial covenants or otherwise default
under the arrangements, we may be required to repay any outstanding amounts or repurchase the properties which
are subject to the synthetic lease arrangements. If we lose access to the synthetic lease arrangements, we may not be
able to obtain alternative financing on acceptable terms, which could limit our operating flexibility.

                                                          26
The agreements governing our synthetic lease arrangements contain restrictive covenants that limit our ability
to operate our business, including restrictions on our ability to:

     • Incur indebtedness;

     • Incur indebtedness at the subsidiary level;

     • Grant liens;

     • Sell all or substantially all our assets:

     • Enter into certain mergers;

     • Change our business;

     • Enter into swap agreements;

     • Enter into transactions with our affiliates; and

     • Enter into certain restrictive agreements.

     As a result of these restrictive covenants, our ability to respond to changes in business and economic conditions
and to obtain additional financing, if needed, may be restricted. We may also be prevented from engaging in
transactions that might otherwise be beneficial to us, such as strategic acquisitions or joint ventures.

      Our failure to comply with the restrictive and financial covenants could result in a default under our synthetic
lease arrangements, which would give the counterparties thereto the ability to exercise certain rights, including the
right to accelerate the amounts owed thereunder and to terminate the arrangement. In addition, our failure to comply
with these covenants and the acceleration of amounts owed under synthetic lease arrangements could result in a
default under the Notes, which could permit the holders to accelerate the Notes. If all of our debt is accelerated, we
may not have sufficient funds available to repay such debt.

  Funds associated with certain of our auction rate securities may not be accessible for more than
  12 months and our auction rate securities may experience further other-than-temporary declines in value,
  which would adversely affect our earnings.

     Auction rate securities (ARSs) held by us are securities with long-term nominal maturities, which, in
accordance with investment policy guidelines, had credit ratings of AAA and Aaa at time of purchase. Interest
rates for ARS are reset through a “Dutch auction” each month, which prior to February 2008 had provided a liquid
market for these securities.

      All of our ARSs are backed by pools of student loans guaranteed by the U.S. Department of Education, and we
believe the credit quality of these securities is high based on this guarantee. However, liquidity issues in the global
credit markets resulted in the failure of auctions for certain of our ARS investments, with a par value of
$73.8 million. For each failed auction, the interest rate resets to a maximum rate defined for each security, and
the ARS continue to pay interest in accordance with their terms, although the principal associated with the ARS will
not be accessible until there is a successful auction or such time as other markets for ARS investments develop or the
final maturity of the individual securities.

     As of April 30, 2010, we determined there was a total decline in the fair value of our ARS investments of
approximately $4.7 million, of which we have recorded cumulative temporary impairment charges of $2.6 million,
and $2.1 million was recognized as an other-than-temporary impairment charge. In addition, we have classified all
of our auction rate securities as long-term assets in our consolidated balance sheets at April 30, 2010 as our ability to
liquidate such securities in the next 12 months is uncertain. Although we currently have the ability and intent to hold
these ARS investments until recovery in market value or until maturity, if current market conditions deteriorate
further, or the anticipated recovery in market liquidity does not occur, we may be required to record additional
impairment charges in future quarters.

                                                           27
We may need to undertake cost-reduction initiatives and restructuring initiatives in the future.
     We have previously recognized restructuring charges related to initiatives to realign our business strategies and
resize our business in response to economic and market conditions, including those announced in February 2009
and December 2008. We may undertake future cost-reduction initiatives and restructuring plans that may adversely
impact our operations and we may not realize all of the anticipated benefits of our prior or any future restructurings.

  Our acquisitions may not provide the anticipated benefits and may disrupt our existing business.
     As part of our strategy, we are continuously evaluating opportunities to buy other businesses or technologies
that would complement our current products, expand the breadth of our markets, or enhance our technical
capabilities. The success of our acquisitions is impacted by a number of factors, and may be subject to the following
risks:
     • The inability to successfully integrate the operations, technologies, products and personnel of the acquired
       companies;
     • The diversion of management’s attention from normal daily operations of the business;
     • The loss of key employees;
     • Substantial transaction costs and accounting charges; and
     • Exposure to litigation related to acquisitions.
     Any future acquisitions may also result in risks to our existing business, including:
     • Dilution of our current stockholders’ percentage ownership to the extent we issue new equity;
     • Assumption of additional liabilities;
     • Incurrence of additional debt or a decline in available cash;
     • Adverse effects to our financial statements, such as the need to make large and immediate write-offs or the
       incurrence of restructuring and other related expenses;
     • Liability for intellectual property infringement and other litigation claims, which we may or may not be
       aware of at the time of acquisition; and
     • Creation of goodwill or other intangible assets that could result in significant future amortization expense or
       impairment charges.
     The failure to achieve the anticipated benefits of an acquisition may also result in impairment charges for
goodwill or acquired intangibles. For example, in fiscal 2009, we announced our decision to cease the development
and availability of our SMOS product, which was originally acquired through our acquisition of Topio, Inc. in fiscal
2007, resulting in the impairment of acquired intangibles related to such acquisition. Additional or realized risks of
this nature could have a material adverse effect on our business, financial condition and results of operations.
     The occurrence of any of the above risks could seriously harm our business.

  If we are unable to establish fair value for any undelivered element of a sales arrangement, all or a
  portion of the revenues relating to the arrangement could be deferred to future periods.
     In the course of our sales efforts, we often enter into multiple element arrangements that include our systems
and one or more of the following undelivered software-related elements: software entitlements and maintenance,
premium hardware maintenance, and storage review services. If we are required to change the pricing of our
software-related elements through discounting, or otherwise introduce variability in the pricing of such elements,
we may be unable to maintain Vendor Specific Objective Evidence of fair value of the undelivered elements of the
arrangement, and would therefore be required to delay the recognition of all or a portion of the related arrangement.
A delay in the recognition of revenues may cause fluctuations in our financial results and may adversely affect our
operating margins.

                                                          28
We are continually seeking ways to make our cost structure and business processes more efficient,
  including moving activities from higher-cost to lower-cost owned locations, as well as outsourcing certain
  business process functions. Problems with the execution of these activities could have an adverse effect
  on our business or results of operations.
     We continuously seek to make our cost structure and business processes more efficient. We are focused on
increasing workforce flexibility and scalability, and improving overall competitiveness by leveraging our global
capabilities, as well as external talent and skills worldwide. For example, certain engineering activities and projects
that were formerly performed in the U.S. have been moved to lower cost international locations and we rely on
partners or third party service providers for the provision of certain business process functions and activities in IT,
human resources and accounting.
     The challenges involved with these initiatives include executing business functions in accordance with local
laws and other obligations while maintaining adequate standards, controls and procedures. We are also subject to
increased business continuity risks as we increase our reliance on such parties. For example, we may no longer be
able to exercise control over some aspects of the future development, support or maintenance of outsourced
operations and processes, including the management and internal controls associated with those outsourced
business operations and processes, which could adversely affect our business. If we are unable to effectively utilize
or integrate and interoperate with external resources or if our partners or third party service providers experience
business difficulties or are unable to provide business services as anticipated, we may need to seek alternative
service providers or resume providing these business processes internally, which could be costly and time-
consuming and have a material adverse effect on our operating results. In addition, we may not achieve the expected
benefits of our business process improvement initiatives.

  We are subject to risks related to the provision of employee health care benefits.
     We use a combination of insurance and self-insurance for workers’ compensation coverage and health care
plans. We record expenses under these plans based on estimates of the number and costs of expected claims,
administrative costs and stop-loss premiums. These estimates are then adjusted each year to reflect actual costs
incurred. Actual costs under these plans are subject to variability depending primarily upon participant enrollment
and demographics, the actual number and costs of claims made and whether and how much the stop-loss insurance
we purchase covers the cost of these claims. In the event that our cost estimates differ from actual costs, we could
incur additional unplanned health care costs which could adversely impact our financial condition.
      In March 2010, comprehensive health care reform legislation under the Patient Protection and Affordable Care
Act (HR 3590) and the Health Care Education and Affordability Reconciliation Act (HR 4872) (collectively, the
“Acts”) was passed and signed into law. Among other things, the health reform legislation includes guaranteed
coverage requirements, eliminates pre-existing condition exclusions and annual and lifetime maximum limits,
restricts the extent to which policies can be rescinded, and imposes new and significant taxes on health insurers and
health care benefits. Provisions of the health reform legislation become effective at various dates over the next
several years. The Department of Health and Human Services, the National Association of Insurance Commis-
sioners, the Department of Labor and the Treasury Department have yet to issue necessary enabling regulations and
guidance with respect to the health care reform legislation.
     Due to the breadth and complexity of the health reform legislation, the lack of implementing regulations and
interpretive guidance, and the phased-in nature of the implementation, it is difficult to predict the overall impact of
the health reform legislation on our business over the coming years. Possible adverse affects of the health reform
legislation include reduced revenues, increased costs, exposure to expanded liability and requirements for us to
revise the ways in which we conduct business or risk of loss of business. In addition, our results of operations,
financial position, and cash flows could be materially adversely affected.

  We depend on attracting and retaining qualified personnel. If we are unable to attract and retain such
  personnel, our operating results could be materially and adversely impacted.
     Our continued success depends, in part, on our ability to identify, attract, motivate and retain qualified
personnel. Because our future success is dependent on our ability to continue to enhance and introduce new

                                                          29
products, we are particularly dependent on our ability to identify, attract, motivate and retain qualified engineers
with the requisite education, background and industry experience. Competition for qualified employees, partic-
ularly in Silicon Valley, can be intense. The loss of the services of a significant number of our employees,
particularly our engineers, salespeople and key managers, could be disruptive to our development efforts or business
relationships and could materially and adversely affect our operating results.
     Additionally, a component of our strategy to hire and retain personnel consists of long-term compensation in
the form of equity-based grants. We face increased risk of the inability to continue to offer equity if we are unable to
obtain shareholder approval in light of increased shareholder activism and heightened focus on corporate
compensation practices. Such inability could adversely impact our ability to continue to attract and retain
employees.

  Our business could be materially and adversely affected as a result of a natural disaster, terrorist acts or
  other catastrophic events.
     We depend on the ability of our personnel, raw materials, equipment and products to move reasonably
unimpeded around the world. Any political, military, terrorism, global trade, world health or other issue that hinders
this movement or restricts the import or export of materials could lead to significant business disruptions.
Furthermore, any strike, economic failure or other material disruption caused by fire, floods, hurricanes, volcanoes,
power loss, power shortages, environmental disasters, telecommunications failures, break-ins and similar events
could also adversely affect our ability to conduct business. If such disruptions result in cancellations of customer
orders or contribute to a general decrease in economic activity or corporate spending on information technology, or
directly impact our marketing, manufacturing, financial and logistics functions, our results of operations and
financial condition could be materially adversely affected. In addition, our headquarters are located in Northern
California, an area susceptible to earthquakes. If any significant disaster were to occur, our ability to operate our
business could be impaired.

  Undetected software errors, hardware errors, or failures found in new products may result in loss of or
  delay in market acceptance of our products, which could increase our costs and reduce our revenues.
  Product quality problems could lead to reduced revenues, gross margins and operating results.
    Our products may contain undetected software errors, hardware errors or failures when first introduced or as
new versions are released. Despite testing by us and by current and potential customers, errors may not be found in
new products until after commencement of commercial shipments, resulting in loss of or delay in market
acceptance, which could materially and adversely affect our operating results.
     In addition, if we fail to remedy a product defect, we may experience a failure of a product line, temporary or
permanent withdrawal from a product or market, damage to our reputation, inventory costs or product reengineering
expenses, and these occurrences could have a material impact on our revenues, gross margins and operating results.
We may be subject to losses that may result from or are alleged to result from defects in our products, which could
subject us to claims for damages, including consequential damages.

  We are exposed to various risks related to legal proceedings or claims and protection of intellectual
  property rights, which could adversely affect our operating results.
     We are a party to lawsuits in the normal course of our business, including our ongoing litigation with Sun
Microsystems which was recently acquired by Oracle Corporation. Litigation can be expensive, lengthy and
disruptive to normal business operations. Moreover, the results of complex legal proceedings are difficult to predict.
An unfavorable resolution of a particular lawsuit could have a material adverse effect on our business, operating
results, or financial condition.
     If we are unable to protect our intellectual property, we may be subject to increased competition that could
materially and adversely affect our operating results. Our success depends significantly upon our proprietary
technology. We rely on a combination of copyright and trademark laws, trade secrets, confidentiality procedures,
contractual provisions, and patents to protect our proprietary rights. We seek to protect our software, documentation
and other written materials under trade secret, copyright and patent laws, which afford only limited protection.

                                                          30
Some of our U.S. trademarks are registered internationally as well. We will continue to evaluate the registration of
additional trademarks as appropriate. We generally enter into confidentiality agreements with our employees and
with our resellers, strategic partners and customers. We currently have multiple U.S. and international patent
applications pending and multiple U.S. patents issued. The pending applications may not be approved, and our
existing and future patents may be challenged. If such challenges are brought, the patents may be invalidated. We
may not be able to develop proprietary products or technologies that are patentable, or where any issued patent will
provide us with any competitive advantages or will not be challenged by third parties. Further, the patents of others
may materially and adversely affect our ability to do business. In addition, a failure to obtain and defend our
trademark registrations may impede our marketing and branding efforts and competitive position.

     Litigation may be necessary to protect our proprietary technology. Any such litigation may be time-consuming
and costly. Despite our efforts to protect our proprietary rights, unauthorized parties may attempt to copy aspects of
our products or obtain and use information that we regard as proprietary. In addition, the laws of some foreign
countries do not protect proprietary rights to as great an extent as do the laws of the United States. Our means of
protecting our proprietary rights may not be adequate or our competitors may independently develop similar
technology, duplicate our products, or design around patents issued to us or other intellectual property rights of ours.

     We are subject to intellectual property infringement claims. We may, from time to time, receive claims that we
are infringing third parties’ intellectual property rights. Third parties may in the future, claim infringement by us
with respect to current or future products, patents, trademarks or other proprietary rights. We expect that companies
in the network storage and data management market will increasingly be subject to infringement claims as the
number of products and competitors in our industry segment grows and the functionality of products in different
industry segments overlaps. Any such claims could be time consuming, result in costly litigation, cause product
shipment delays, require us to redesign our products or enter into royalty or licensing agreements, any of which
could materially and adversely affect our operating results. Such royalty or licensing agreements, if required, may
not be available on terms acceptable to us or at all.

  Our business could be materially adversely affected by changes in regulations or standards regarding
  energy efficiency of our products and climate change issues.

     We continually seek ways to increase the energy efficiency of our products. Recent analyses have estimated the
amount of global carbon emissions that are due to information technology products. As a result, governmental and
non-governmental organizations have turned their attention to development of regulations and standards to drive
technological improvements and reduce such amount of carbon emissions. There is a risk that the development of
these standards will not fully address the complexity of the technology developed by the IT industry or will favor
certain technological approaches. Depending on the regulations or standards that are ultimately adopted, com-
pliance could adversely affect our business, financial condition or operating results.

     Climate change issues, energy usage and emissions controls may result in new environmental legislation and
regulations, at any or all of the international, federal and state levels, that may unfavorably impact us, our suppliers,
and our customers in how we conduct our business including the design, development, and manufacturing of our
products. This could cause us to incur additional direct costs in complying with any new environmental regulations,
as well as increased indirect costs resulting from our customers, suppliers or both incurring additional compliance
costs that get passed on to us. These costs may adversely impact our operations and financial condition.

     Our business and results of operations could be adversely impacted as a consequence of regulations or business
trends such as:

     • Decreased demand for storage products that produce significant greenhouse gases

     • Increased demand for storage products that produce lower emissions and are more energy efficient, and
       increased competition to develop such products; and

     • Reputational risk based on negative public perception of publicly reported data on our greenhouse gas
       emissions.

                                                           31
Our business is subject to increasingly complex corporate governance, public disclosure, accounting and
  tax requirements that have increased both our costs and the risk of noncompliance.

     Because our common stock is publicly traded, we are subject to certain rules and regulations of federal, state
and financial market exchange entities charged with the protection of investors and the oversight of companies
whose securities are publicly traded. These entities, including the Public Company Accounting Oversight Board,
the SEC, and NASDAQ, have implemented requirements and regulations and continue developing additional
regulations and requirements in response to corporate scandals and laws enacted by Congress, most notably the
Sarbanes-Oxley Act of 2002. Our efforts to comply with these regulations have resulted in, and are likely to
continue resulting in, increased general and administrative expenses and diversion of management time and
attention from revenue-generating activities to compliance activities.

     We completed our evaluation of our internal controls over financial reporting for the fiscal year ended April 30,
2010 as required by Section 404 of the Sarbanes-Oxley Act of 2002. Although our assessment, testing and
evaluation resulted in our conclusion that as of April 30, 2010, our internal controls over financial reporting were
effective, we cannot predict the outcome of our testing in future periods. If our internal controls are ineffective in
future periods, our business and reputation could be harmed. We may incur additional expenses and commitment of
management’s time in connection with further evaluations, both of which could materially increase our operating
expenses and accordingly reduce our operating results.

     Because new and modified laws, regulations, and standards are subject to varying interpretations in many cases
due to their lack of specificity, their application in practice may evolve over time as new guidance is provided by
regulatory and governing bodies. This evolution may result in continuing uncertainty regarding compliance matters
and additional costs necessitated by ongoing revisions to our disclosure and governance practices.

  Changes in financial accounting standards may cause adverse unexpected fluctuations and affect our
  reported results of operations.

     A change in accounting standards or practices and varying interpretations of existing accounting pronounce-
ments, such as changes to standards related to revenue recognition standards recently adopted by the FASB, the
increased use of fair value measure, and the potential requirement that U.S. registrants prepare financial statements
in accordance with International Financial Reporting Standards (“IFRS”), could have a significant effect on our
reported financial results or the way we conduct our business.

Item 1B. Unresolved Staff Comments

     None.

Item 2. Properties

      We own approximately 0.9 million square feet of facilities at our Sunnyvale, California headquarters, of which
we occupy approximately 0.8 million square feet. In addition, we have commitments related to various lease
arrangements with BNP Paribas LLC (“BNP”) for approximately 0.6 million square feet of additional facilities, of
which we occupy approximately 0.3 million square feet (as further described below under “Contractual Obliga-
tions” in Item 7 and Note 18 of the accompanying consolidated financial statements under Item 8). Our headquarters
site supports corporate general administration, sales and marketing, research and development, global services, and
operations.

     We own approximately 0.6 million square feet of facilities in Research Triangle Park (RTP), North Carolina, of
which we occupy approximately 0.5 million square feet. This site supports sales and marketing, research and
development, and global services.

      We lease and occupy approximately 0.3 million square feet of facilities in Bangalore, India. We also own
fifteen acres of land in Bangalore, India to be developed for future use. This site supports sales and marketing,
research and development, and global services.

                                                         32
We lease other sales offices and research and development facilities throughout the U.S. and internationally.
We expect that our existing facilities and those being developed worldwide are suitable and adequate for our
requirements over at least the next two years and that additional space will be available as needed.
     See additional discussion regarding properties in Note 18 of the accompanying consolidated financial
statements under Item 8. and Item 7. Management’s Discussion and Analysis of Financial Condition and Results
of Operations — Liquidity and Capital Resources.

Item 3. Legal Proceedings
     On September 5, 2007, we filed a patent infringement lawsuit in the Eastern District of Texas seeking
compensatory damages and a permanent injunction against Sun Microsystems. On October 25, 2007, Sun Micro-
systems filed a counter claim against us in the Eastern District of Texas seeking compensatory damages and a
permanent injunction. On October 29, 2007, Sun filed a second lawsuit against us in the Northern District of
California asserting additional patents against us. The Texas court granted a joint motion to transfer the Texas
lawsuit to the Northern District of California on November 26, 2007. On March 26, 2008, Sun filed a third lawsuit in
federal court that extends the patent infringement charges to storage management technology we acquired in
January 2008. In January 2010, Oracle acquired Sun. The three lawsuits are currently in the discovery and motion
phase and no trial dates have been set, so we are unable at this time to determine the likely outcome of these various
patent litigations. Since we are unable to reasonably estimate the amount or range of any potential settlement, no
accrual has been recorded as of April 30, 2010.

Item 4. Reserved


                                                         33
PART II
Item 5. Market for Registrant’s Common Equity, Related Stockholder Matters and Issuer Purchases of
        Equity Securities
     Our common stock commenced trading on the NASDAQ Global Select Market (and its predecessor, the
Nasdaq National Market) on November 21, 1995, and is traded under the symbol “NTAP.” As of June 4, 2010 there
were 866 holders of record of the common stock. The closing price for our common stock on June 4, 2010 was
$37.88. The following table sets forth for the periods indicated the high and low closing sale prices for our common
stock as reported on the NASDAQ Global Select Market.
                                                                               Fiscal 2010                Fiscal 2009
                                                                             High        Low            High        Low

          First Quarter . . .   .................................           $23.56         $16.93      $27.31      $21.66
          Second Quarter .      .................................            29.50          21.55       26.42       12.20
          Third Quarter . .     .................................            34.54          27.60       15.32       10.39
          Fourth Quarter . .    .................................            36.17          29.83       18.84       12.52
    The following graph shows a five-year comparison of cumulative total return on our common stock, the
NASDAQ Composite Index and the S&P 500 Information Technology Index from April 30, 2005 through April 30,
2010. The past performance of our common stock is no indication of future performance.


                            COMPARISON OF 5 YEAR CUMULATIVE TOTAL RETURN*
                               Among NetApp, Inc., The NASDAQ Composite Index
                                  And The S&P Information Technology Index

            250
                           NetApp., Inc.
                           NASDAQ Composite
            200
                           S&P Information Technology
DOLLARS


            150


            100


             50


               0
                         4/05              4/06         4/07                4/08               4/09                4/10

                    * $100 invested on 4/30/05 in stock or index, including reinvestment of dividends.
                    Fiscal year ending April 30.
                    Copyright· 2010 S&P, a division of The McGraw-Hill Companies Inc. All rights reserved.


                                                          4/05       4/06           4/07        4/08        4/09       4/10
 NetApp, Inc.                                            100.00    139.00          139.52       90.74      68.62      130.00
 NASDAQ Composite                                        100.00    121.25          134.58      127.40      89.92      129.99
 S&P Information Technology                              100.00    116.84          128.45      129.74      95.11      136.47

                                                           34
We believe that a number of factors may cause the market price of our common stock to fluctuate significantly.
See “Item 1A. Business — Risk Factors.”

Dividend Policy
      We have never paid cash dividends on our capital stock. We currently anticipate retaining all available funds, if
any, to finance internal growth and product development as well as other possible management initiatives, including
stock repurchases and acquisitions. Payment of dividends in the future will depend upon our earnings and financial
condition and such other factors as the Board of Directors may consider or deem appropriate at the time.

Securities Authorized for Issuance under Equity Compensation Plans
     Information regarding securities authorized for issuance under equity compensation plans is incorporated by
reference to our Proxy Statement for the 2010 Annual Meeting of Stockholders.

Unregistered Securities Sold in Fiscal 2010
     We did not sell any unregistered securities during fiscal 2010.

Issuer Purchases of Equity Securities
     On May 13, 2003, we announced that our Board of Directors had authorized a stock repurchase program. As of
April 30, 2010, our Board of Directors had authorized the repurchase of up to $4,023.6 million of common stock
under this program. We did not repurchase any common stock during the three month period ended April 30, 2010.
As of April 30, 2010, we had repurchased 104.3 million shares of our common stock at a weighted-average price of
$28.06 per share for an aggregate purchase price of $2,927.4 million since inception of the stock repurchase
program, and the remaining authorized amount for stock repurchases under this program was $1,096.3 million with
no termination date.


                                                          35
Item 6. Selected Financial Data

     The following selected consolidated financial data set forth below was derived from our historical audited
consolidated financial statements and should be read in conjunction with, “Management’s Discussion and Analysis
of Financial Condition and Results of Operations” and “Financial Statements and Supplementary Data,” and other
financial data included elsewhere in this Annual Report on Form 10-K. Our historical results of operations are not
necessarily indicative of results of operations to be expected for any future period.

                                                                                       Fiscal Year Ended
                                                                April 30,    April 24,      April 25,     April 27,     April 28,
                                                                 2010          2009           2008          2007         2006
                                                                            (In millions, except per-share amounts)
     Net revenues(1) . . . . . . . . . . . . . . . . . . . $3,931.4         $3,406.4       $3,303.2       $2,804.3      $2,066.5
     Total cost of revenue . . . . . . . . . . . . . . .    1,412.2          1,416.5        1,289.8        1,099.8         810.0
     Gross profit . . . . . . . . . . . . . . . . . . . . . .   2,519.2         1,989.9        2,013.4        1,704.5    1,256.5
     Total operating expenses . . . . . . . . . . . . .         2,030.8         1,942.7        1,699.8        1,403.3      948.2
     Income from operations . . . . . . . . . . . . .              488.4          47.2          313.6          301.2        308.3
     Net income(1) . . . . . . . . . . . . . . . . . . . . $ 400.4          $     64.6     $ 309.7        $ 297.7       $ 266.5
     Net income per share, basic . . . . . . . . . . $              1.18    $     0.20     $     0.88     $     0.80    $    0.72
     Net income per share, diluted . . . . . . . . . $              1.13    $     0.19     $     0.86     $     0.77    $    0.69
     Shares used in basic net income per
       share calculation . . . . . . . . . . . . . . . . .         339.6         330.3          351.7          371.2        371.1
     Shares used in diluted net income per
       share calculation . . . . . . . . . . . . . . . . .         353.2         334.6          361.1          388.5        388.4


                                                                April 30,   April 24,       April 25,     April 27,     April 28,
                                                                 2010        2009             2008         2007          2006
                                                                                          (In millions)
     Cash, cash equivalents and short-term
       investments . . . . . . . . . . . . . . . . . . . . . $3,724.0       $2,604.3       $1,164.4       $1,308.8      $1,322.9
     Working capital . . . . . . . . . . . . . . . . . . .    2,626.1        1,759.5          653.3        1,053.3       1,116.0
     Total assets . . . . . . . . . . . . . . . . . . . . . . 6,494.4        5,384.4        4,071.0        3,658.5       3,261.0
     Short-term debt . . . . . . . . . . . . . . . . . . .         —              —              —            85.1         166.2
     Long-term debt and other . . . . . . . . . . . .         1,273.4        1,219.3          318.7            9.5         138.2
     Total stockholders’ equity . . . . . . . . . . . .       2,530.5        1,784.2        1,700.3        1,989.0       1,923.5

(1) Net revenues and net income for fiscal 2009 included a GSA settlement of $128.7 million. Net income for fiscal
    2006 included an income tax provision of $22.5 million related to the American Jobs Creation Act and the
    repatriation of foreign subsidiary earnings back to the United States of America.


Item 7. Management’s Discussion and Analysis of Financial Condition and Results of Operations

     The following discussion of our financial condition and results of operations should be read together with the
financial statements and the related notes set forth under “Item 8. Financial Statements and Supplementary Data”.
The following discussion also contains trend information and other forward looking statements that involve a
number of risks and uncertainties. The Risk Factors set forth in “Item 1. Business” are hereby incorporated into the
discussion by reference.

                                                                     36
Overview
     Revenues for fiscal 2010 were $3.9 billion, up $0.5 billion, or 15%, from fiscal 2009. Improved revenue
performance in fiscal 2010 was the result of improvements in product, software entitlements and maintenance and
service revenues. Revenues in fiscal 2009 were negatively impacted by a $128.7 million settlement with the General
Services Administration (GSA). The dispute regarded our discounting practices and compliance with the price
reduction provisions of GSA contracts between August 1997 and February 2005.
     Gross profit margins increased during fiscal 2010 due largely to reductions in product materials cost, partially
offset by a decrease in the overall average selling prices of our products, as well as an increase in our SEM and
services revenues mix relative to product revenues. In addition, our gross profit margin in fiscal 2009 was negatively
impacted by the GSA settlement.
      During fiscal 2010, sales and marketing, research and development, and general and administrative expenses
totaled $2.1 billion, up 10% from fiscal 2009 and reflected the impact of an increase in incentive compensation and
commissions expense related to our stronger sales and operating profit performance, as well as having 53 weeks in
fiscal 2010 compared to 52 weeks in fiscal 2009.
     During fiscal 2010, we entered into a merger agreement with Data Domain, Inc., which was subsequently
terminated on July 8, 2009. In accordance with the agreement, we received a $57.0 million termination fee, which,
when netted against $15.9 million of incremental third-party costs we incurred relating to the terminated merger
transaction, resulted in net proceeds of $41.1 million.

Critical Accounting Estimates and Policies
     Our discussion and analysis of financial condition and results of operations are based upon our consolidated
financial statements, which have been prepared in accordance with accounting principles generally accepted in the
United States of America. The preparation of such statements requires us to make estimates and assumptions that
affect the reported amounts of revenues and expenses during the reporting period and the reported amounts of assets
and liabilities as of the date of the financial statements. Our estimates are based on historical experience and other
assumptions that we consider to be appropriate in the circumstances. However, actual future results may vary from
our estimates.
     We believe that the following accounting policies are significantly affected by critical accounting estimates
and that they are both highly important to the portrayal of our financial condition and results and require difficult
management judgments and assumptions about matters that are inherently uncertain. Note 2 of the accompanying
consolidated financial statements describes the significant accounting policies used in the preparation of the
consolidated financial statements. Certain of these significant accounting policies are considered to be critical
accounting policies.
     We believe the accounting policies described below are the ones that most frequently require us to make
estimates and judgments and therefore are critical to the understanding of our results of operations.

  Revenue Recognition, Reserves and Allowances
    We apply the provisions of the accounting guidance for software revenue recognition to our product sales, both
hardware and software, because our software is essential to the performance of our hardware. We recognize revenue
when:
     • Persuasive evidence of an arrangement exists: It is our customary practice to have a purchase order and/or
       contract prior to recognizing revenue on an arrangement from our end users, customers, value-added
       resellers, or distributors.
     • Delivery has occurred: Our product is physically delivered to our customers, generally with standard
       transfer terms such as FOB origin. We typically do not allow for restocking rights with any of our value-
       added resellers or distributors. Products shipped with acceptance criteria or return rights are not recognized
       as revenue until all criteria are achieved. If undelivered products or services exist that are essential to the
       functionality of the delivered product in an arrangement, delivery is not considered to have occurred.

                                                         37
• The fee is fixed or determinable: Arrangements with payment terms extending beyond our standard terms,
       conditions and practices are not considered to be fixed or determinable. Revenue from such arrangements is
       recognized at the earlier of customer payment or when the fees become due and payable. We typically do not
       allow for price-protection rights with any of our value-added resellers or distributors.

     • Collection is probable: If there is considerable doubt surrounding the credit worthiness of a customer at
       the outset of an arrangement, the associated revenue is deferred and recognized upon cash receipt.

      Our multiple element arrangements include our systems and one or more of the following undelivered
software-related elements: software entitlements and maintenance, premium hardware maintenance and storage
review services. Our software entitlements and maintenance entitle our customers to receive unspecified product
upgrades and enhancements on a when-and-if-available basis, bug fixes, and patch releases. Premium hardware
maintenance services include contracts for technical support and minimum response times. Revenues from software
entitlements and maintenance, premium hardware maintenance services and storage review services are recognized
ratably over the contractual term, generally from one to three years. We also offer extended service contracts (which
extend our standard parts warranty and may include premium hardware maintenance) at the end of the warranty
term; revenues from these contracts are recognized ratably over the contract term. We typically sell professional
services separately from any of our other revenue elements, either on a time and materials basis or for fixed price
standard projects; we recognize revenue for these services as they are performed. Revenue from hardware
installation services is recognized in the period the services are delivered. For arrangements with multiple
elements, we recognize as revenue the difference between the total arrangement price and the greater of fair
value or stated price for any undelivered elements (“the residual method”).

     For our undelivered software-related elements, we determine fair value of these undelivered elements based on
vendor-specific objective evidence (“VSOE”) of fair value, which for us consists of the prices charged when these
services are sold separately. To determine the fair value of these elements, we analyze both the selling prices when
elements are sold separately as well as the concentrations of those prices. We believe those concentrations have
been sufficient to enable us to establish VSOE of fair value for the undelivered elements. If VSOE cannot be
obtained to establish fair value of the undelivered elements, it is required that revenue from the entire arrangement
be initially deferred and recognized ratably over the period these elements are delivered.

      For purposes of presentation in the statement of operations, once fair value has been determined for our
undelivered bundled elements, we allocate revenue first to software entitlements and maintenance, based on VSOE
of its fair value, with the remainder allocated to other service revenues.

     We record reductions to revenue for estimated sales returns at the time of shipment. Sales returns are estimated
based on historical sales returns, current trends, and our expectations regarding future experience. We monitor and
analyze the accuracy of sales returns estimates by reviewing actual returns and adjust them for future expectations to
determine the adequacy of our current and future reserve needs. Our reserve levels have been sufficient to cover
actual returns and have not required material changes in subsequent periods. While we currently have no
expectations for significant changes to these reserves, if actual future returns and allowances differ from past
experience, additional allowances may be required.

     We also maintain a separate allowance for doubtful accounts for estimated losses based on our assessment of
the collectibility of specific customer accounts and the aging of the accounts receivable. We analyze accounts
receivable and historical bad debts, customer concentrations, customer solvency, current economic and geographic
trends, and changes in customer payment terms and practices when evaluating the adequacy of our current and
future allowance. In circumstances where we are aware of a specific customer’s inability to meet its financial
obligations to us, a specific allowance for bad debt is estimated and recorded, which reduces the recognized
receivable to the estimated amount we believe will ultimately be collected. We monitor and analyze the accuracy of
our allowance for doubtful accounts estimate by reviewing past collectibility and adjusting it for future expectations
to determine the adequacy of our current and future allowance. Our reserve levels have generally been sufficient to
cover credit losses. Our allowance for doubtful accounts as of April 30, 2010 was $1.6 million, compared to
$3.1 million as of April 24, 2009. If the financial condition of our customers were to deteriorate, resulting in an
impairment of their ability to make payments, additional allowances may be required.

                                                         38
Inventory Valuation and Purchase Order Accruals
     Inventories are stated at the lower of cost or market (which approximates actual cost on a first-in, first-out
basis). We perform an excess and obsolete analysis of our inventory based upon assumptions about future demand
and market conditions. We adjust the inventory value based on estimated excess and obsolete inventories
determined primarily by future demand forecasts. Although we strive for accuracy in our forecasts of future
product demand, any significant unanticipated changes in demand or technological developments could have a
significant impact on the value of our inventory commitments and on our reported results. If actual market
conditions are less favorable than those projected, additional write-downs and other charges against earnings may
be required. If actual market conditions are more favorable, we may realize higher gross profits in the period when
the written-down inventory is sold. Historically, our inventory reserves have been sufficient to cover any excess and
obsolete exposure and have not required material adjustments in subsequent periods.
     In the normal course of business we make commitments to our third party contract manufacturers to manage
lead times and meet product forecasts, and to other parties to purchase various key components used in the
manufacture of our products. We establish accruals for estimated losses on purchased components for which we
believe it is probable that they will not be utilized in future operations. To the extent that such forecasts are not
achieved, our commitments and associated accruals may change.
     We are subject to a variety of federal, state, local, and foreign environmental regulations relating to the use,
storage, discharge, and disposal of hazardous chemicals used in the manufacture of our products, which may require
design changes or recycling of products we manufacture. We will continue to monitor our compliance with these
regulations, which may require us to incur higher costs, and adversely impact our operating results.

  Valuation of Goodwill and Intangibles
      Purchased intangible assets are amortized over their useful lives unless these lives are determined to be
indefinite. In-process research and development is capitalized at fair value and classified as indefinite-lived assets
until completion or abandonment and is subject to periodic review for impairment. Accordingly, the allocation of
acquisition cost to identifiable intangible assets has a significant impact on our future operating results. The
allocation process requires extensive use of estimates and assumptions, including estimates of future cash flows
expected to be generated by the acquired assets. Should conditions be different than management’s assessment,
material write-downs of the fair value of intangible assets may be required. We periodically review the estimated
remaining useful lives of our intangible assets. A reduction in the estimate of remaining useful life could result in
accelerated amortization expense or a write-down in future periods. As such, any future write-downs of these assets
would adversely affect our operating results.
      We perform an annual review of the valuation of goodwill in the fourth quarter of each fiscal year, or more
often if indicators of impairment exist. Triggering events for impairment reviews may be indicators such as adverse
industry or economic trends, restructuring actions, lower projections of profitability, or a sustained decline in our
market capitalization. Evaluations of possible impairment and, if applicable, adjustments to carrying values require
us to estimate, among other factors, future cash flows, useful lives, and fair market values of our reporting units and
assets. When we conduct our evaluation of goodwill, the fair value of goodwill is assessed using valuation
techniques that require significant management judgment. Should conditions be different from management’s last
assessment, significant write-downs of goodwill may be required, which would adversely affect our operating
results. In fiscal 2010 we performed such evaluation and found no impairment of goodwill.

  Restructuring Reserves
     We recognize a liability for restructuring costs when the liability is incurred. The restructuring accruals are
based upon management estimates at the time they are recorded. These estimates can change depending upon
changes in facts and circumstances subsequent to the date the original liability was recorded. The main components
of our restructuring charges are workforce reduction, intangibles and fixed assets write-offs and non-cancelable
lease costs related to excess facilities. Severance-related charges are accrued when it is determined that a liability
has been incurred, which is generally when individuals have been notified of their termination dates and expected
severance payments. We record contract cancellation costs when contracts are terminated. The decision to eliminate

                                                          39
excess facilities results in charges for lease termination fees and future commitments to pay lease charges, net of
estimated future sublease income. We recognize charges for elimination of excess facilities when we have vacated
the premises. Intangible asset write-offs consist of impairment of acquired intangible assets related to our decision
to cease the development and availability of specific products. Fixed assets write-offs primarily consist of
equipment, software and furniture associated with excess facilities being eliminated, and are based on an estimate
of the amounts and timing of future cash flows related to the expected future remaining use and ultimate sale or
disposal of the equipment and furniture.
     Our estimates involve a number of risks and uncertainties, some of which are beyond our control, including
future real estate market conditions and our ability to successfully enter into subleases or lease termination
agreements with terms as favorable as those assumed when arriving at our estimates. We regularly evaluate a
number of factors to determine the appropriateness and reasonableness of our restructuring accruals, including the
various assumptions noted above. If actual results differ significantly from our estimates, we may be required to
adjust our restructuring accruals in the future.

  Product Warranties
     Estimated future warranty costs are expensed as a cost of product revenues when revenue is recognized, based
on estimates of the costs that may be incurred under our warranty obligations including material, distribution and
labor costs. Our accrued liability for estimated future warranty costs is included in other accrued liabilities and other
long-term obligations on the accompanying consolidated balance sheets. Factors that affect our warranty liability
include the number of installed units, estimated material costs, estimated distribution costs and estimated labor
costs. We periodically assess the adequacy of our warranty accrual and adjust the amount as considered necessary.

  Stock-Based Compensation
     We account for stock-based compensation using the Black-Scholes option pricing model to estimate the fair
value of each option grant on the date of grant. Our option pricing model requires the input of highly subjective
assumptions, including the expected stock price volatility, expected term, and forfeiture rate. Any changes in these
highly subjective assumptions significantly impact stock-based compensation expense.

  Loss Contingencies
      We are subject to the possibility of various loss contingencies arising in the course of business. We consider the
likelihood of the loss or impairment of an asset or the incurrence of a liability as well as our ability to reasonably
estimate the amount of loss in determining loss contingencies. An estimated loss contingency is accrued when it is
probable that a liability has been incurred or an asset has been impaired and the amount of loss can be reasonably
estimated. We regularly evaluate current information available to us to determine whether such accruals should be
adjusted.

  Fair Value Measurements and Impairments
     All of our available-for-sale investments and nonmarketable securities are subject to periodic impairment
review. Investments are considered to be impaired when a decline in fair value is judged to be other-than-temporary.
This determination requires significant judgment. For publicly traded investments, impairment is determined based
upon the specific facts and circumstances present at the time, including factors such as current economic and market
conditions, the credit rating of the security’s issuer, the length of time an investment’s fair value has been below our
carrying value, and our ability and intent to hold investments to maturity or for a period of time sufficient to allow
for any anticipated recovery in fair value. If an investment’s decline in fair value, caused by factors other than
changes in interest rates, is deemed to be other-than-temporary, we reduce its carrying value to its estimated fair
value, as determined based on quoted market prices, liquidation values or other metrics. For investments in publicly
held companies, we recognize an impairment charge when the decline in the fair value of our investment is below its
cost basis and is judged to be other-than-temporary. The ultimate value realized on these investments is subject to
market price volatility until they are sold.

                                                           40
Pursuant to the accounting guidance for fair value measurement and its subsequent updates, fair value is
defined as the price that would be received to sell an asset or paid to transfer a liability (i.e., the “exit price”) in an
orderly transaction between market participants at the measurement date. The accounting guidance establishes a
hierarchy for inputs used in measuring fair value that minimizes the use of unobservable inputs by requiring the use
of observable market data when available. Observable inputs are inputs that market participants would use in
pricing the asset or liability based on active market data. Unobservable inputs are inputs that reflect the assumptions
market participants would use in pricing the asset or liability based on the best information available in the
circumstances.
     The fair value hierarchy is broken down into the three input levels summarized below:
     • Level 1 — Valuations are based on quoted prices in active markets for identical assets or liabilities, and
       readily accessible by us at the reporting date. Examples of assets and liabilities utilizing Level 1 inputs are
       certain money market funds, U.S. Treasuries and trading securities with quoted prices on active markets.
     • Level 2 — Valuations based on inputs other than the quoted prices in active markets that are observable
       either directly or indirectly in active markets. Examples of assets and liabilities utilizing Level 2 inputs are
       U.S. government agency bonds, corporate bonds, commercial paper, certificates of deposit and
       over-the-counter derivatives.
     • Level 3 — Valuations based on unobservable inputs in which there is little or no market data, which require
       us to develop our own assumptions. Examples of assets and liabilities utilizing Level 3 inputs are cost
       method investments, auction rate securities (ARS) and the Primary Fund.
     We measure our available-for-sale securities at fair value on a recurring basis. Available-for-sale securities
include U.S. Treasury securities, U.S. government agency bonds, corporate bonds, commercial paper, ARSs, money
market funds and certificates of deposit. Where possible, we utilize quoted market prices to measure and such items
are classified as Level 1 in the hierarchy. When quoted market prices for identical assets are unavailable, varying
valuation techniques are used. Such assets are classified as Level 2 or Level 3 in the hierarchy. We classify items in
Level 2 if investments are valued using observable inputs to quoted market prices, benchmark yields, reported
trades, broker/dealer quotes or alternative pricing sources with reasonable levels of price transparency. We classify
items in Level 3 if investments are valued using a pricing model, based on unobservable inputs in the market or that
require us to develop our own assumptions. Our assessment of the significance of a particular input to the fair value
measurement in its entirety requires judgment and considers factors specific to the investment.
     We are also exposed to market risk relating to our available-for-sale investments due to uncertainties in the
credit and capital markets. The fair value of our investments may change significantly due to events and conditions
in the credit and capital markets. These securities/issuers could be subject to review for possible downgrade. Any
downgrade in these credit ratings may result in an additional decline in the estimated fair value of our investments.
We monitor and evaluate the accounting for our investment portfolio on a quarterly basis for additional
other-than-temporary impairment charges.
     We actively review current investment ratings, company specific events, and general economic conditions in
managing our investments and determining whether there is a significant decline in fair value that is oth-
er-than-temporary. As of April 30, 2010 and April 24, 2009, our short-term and long-term investments in
marketable securities have been classified as “available-for-sale” and are carried at fair value. Available-for-sale
investments with original maturities of greater than three months at the date of purchases are classified as short-term
investments as these investments generally consist of marketable securities that are intended to be available to meet
current cash requirements. Currently, all marketable securities held by us are classified as available-for-sale and our
entire ARS portfolio is classified as long-term investments.
      Our ARS portfolio consists of securities with long-term nominal maturities which, in accordance with
investment policy guidelines, had credit ratings of AAA and Aaa at the time of purchase. During fiscal 2008, we
reclassified all of our investments in ARS from short-term investments to long-term investments as we believed our
ability to liquidate these investments in the next twelve months was uncertain. Based on an analysis of the fair value
and marketability of these investments, we recorded temporary impairment charges of approximately $3.3 million
during fiscal 2010, partially offset by $0.7 million in unrealized gains within other comprehensive income (loss).

                                                            41
During fiscal 2009, we recorded temporary impairment charges of approximately $7.0 million, partially offset by
$0.3 million in unrealized gains within other comprehensive income (loss). In addition, during fiscal 2009, we
recorded an other-than-temporary impairment loss of $2.1 million due to a significant decline in the estimated fair
values of certain of our ARS related to credit quality risk and rating downgrades.

     The valuation models used to estimate the fair value of our ARS included numerous assumptions such as
assessments of the underlying structure of each security, expected cash flows, discount rates, credit ratings, workout
periods, and overall capital market liquidity. These assumptions, assessments and the interpretations of relevant
market data are subject to uncertainties, are difficult to predict and require significant judgment. The use of different
assumptions, or applying different judgments to inherently subjective matters and changes in future market
conditions could result in significantly different estimates of fair value. There is no assurance as to when the market
for auction rate securities will stabilize. The fair value of our ARS could change significantly based on market
conditions and continued uncertainties in the credit markets. If these uncertainties continue or if these securities
experience credit rating downgrades, we may incur additional temporary impairment related to our auction rate
securities portfolio. We will continue to monitor the fair value of our ARS and relevant market conditions and will
record additional temporary or other-than-temporary impairments if future circumstances warrant such charges.

      As a result of the bankruptcy filing of Lehman Brothers, which occurred during fiscal 2009, we recorded an
other-than-temporary impairment charge of $11.8 million on our corporate bonds related to investments in
Lehman Brothers securities and approximately $9.3 million on our investments in the Primary Fund that held
Lehman Brothers investments. During fiscal 2010, we sold our remaining holdings of Lehman Brothers bonds and
the Primary Fund made multiple distributions of its assets to its investors, and as of April 30, 2010, we recovered our
recorded investment, with the exception of $0.2 million, for which we recognized an additional loss. As of April 30,
2010, we no longer had any direct or indirect investments related to Lehman Brothers and have recognized all
related losses in our statement of operations.

     During fiscal 2010, 2009 and 2008, recognized gains and losses on available-for-sale investments were not
material. Management determines the appropriate classification of investments at the time of purchase and
reevaluates the classification at each reporting date. The fair value of our marketable securities, including those
included in cash equivalents and long-term investments, was $3,605.2 million and $2,596.6 million as of April 30,
2010 and April 24, 2009, respectively.

     To determine the fair value of nonmarketable investments, we use the most recent information available to us,
including new financings or estimates of current fair value, as well as through traditional valuation techniques. It is
our policy to review the fair value of these investments on a regular basis to determine whether the investments in
these companies are other-than-temporarily impaired. In the case of privately-held companies, this evaluation is
based on information that we request from these companies. If we believe the carrying value of an investment is in
excess of fair value, and this difference is other-than-temporary, it is our policy to write down the investment to fair
value. The carrying value of our investments in privately-held companies was $1.4 million and $3.9 million as of
April 30, 2010 and April 24, 2009, respectively. During fiscal 2010 and 2009, we recorded $3.4 million of gains and
$6.3 million of net impairment charges in our consolidated statements of operations, respectively, for our
investments in privately-held companies, and adjusted the carrying amount of those investments to fair value,
as we deemed the decline in the value of these assets to be other-than-temporary.


  Income Taxes

     The determination of our tax provision is subject to judgments and estimates due to the complexity of the tax
law that we are subject to in several tax jurisdictions. Earnings derived from our international business are generally
taxed at rates that are lower than U.S. rates, resulting in a lower effective tax rate than the U.S. statutory tax rate of
35.0%. The ability to maintain our current effective tax rate is contingent on existing tax laws in both the
United States and the respective countries in which our international subsidiaries are located. Future changes in
domestic or international tax laws could affect the continued realization of the tax benefits we are currently
receiving. In addition, a decrease in the percentage of our total earnings from international business or a change in
the mix of international business among particular tax jurisdictions could increase our overall effective tax rate.

                                                           42
We account for income taxes by recognizing deferred tax assets and liabilities for the effect of temporary
differences between the carrying amounts of assets and liabilities for financial reporting purposes and the amounts
used for income tax purposes. We reduce deferred tax assets by a valuation allowance if it is more likely than not that
some or all of the deferred tax asset will not be realized. Tax attributes related to the exercise of employee stock
options are not realized until they result in a reduction of taxes payable. We do not include unrealized stock option
attributes as components of our gross deferred tax assets and corresponding valuation allowance disclosures.
     We have provided a valuation allowance of $28.3 million as of April 30, 2010, compared to $28.0 million as of
April 24, 2009 and $28.6 million as of April 25, 2008, on certain of our deferred tax assets. The changes in valuation
allowance in fiscal 2010 and 2009 were primarily related to changes in the blended state tax rates. The tax effected
amounts of gross unrealized net operating loss and business tax credit carryforwards, net of their corresponding
valuation allowance at April 30, 2010 are $358.6 million.
      We recognize tax liabilities for uncertain tax positions by applying a recognition threshold and measurement
attribute for the financial statement recognition and measurement of a tax position taken or expected to be taken in a
tax return. We recognize the tax liability for uncertain income tax positions on income tax returns based on a two-
step process. The first step is to determine whether it is more likely than not that each income tax position would be
sustained upon audit. The second step is to estimate and measure the tax benefit as the amount that has a greater than
50% likelihood of being realized upon ultimate settlement with the tax authority. Estimating these amounts requires
us to determine the probability of various possible outcomes. We evaluate these uncertain tax positions on a
quarterly basis. This evaluation is based on the consideration of several factors, including changes in facts or
circumstances, changes in applicable tax law, settlement of issues under audit and new exposures. If we later
determine that our exposure is lower or that the liability is not sufficient to cover our revised expectations, we adjust
the liability and effect a related change in our tax provision during the period in which we make such determination.

New Accounting Standards
     See Note 4 of the accompanying consolidated financial statements for a full description of new accounting
pronouncements, including the respective expected dates of adoption and effects on results of operations and
financial condition.


                                                           43
Results of Operations

     The following table sets forth certain Consolidated Statements of Operations data as a percentage of net
revenues for the periods indicated:
                                                                                                                       Year Ended
                                                                                                           April 30,    April 24,       April 25,
                                                                                                            2010          2009           2008

      Revenues:
        Product . . . . . . . . . . . . . . . . . . . . . . . . . . . . . . . . . . . . . . . .   ....       60.6%        63.2%           67.9%
        Software entitlements and maintenance . . . . . . . . . . . . . . . . .                   ....       17.3         18.2            14.7
        Service . . . . . . . . . . . . . . . . . . . . . . . . . . . . . . . . . . . . . . . .   ....       22.1         22.4            17.4
        GSA settlement . . . . . . . . . . . . . . . . . . . . . . . . . . . . . . . . . .        ....        —           (3.8)             —
           Net revenues                                                                                     100.0        100.0           100.0
      Cost of revenues:
        Cost of product . . . . . . . . . . . . . . . . . . . . . . . . . . . . . . . . . . . . . .          24.8         29.6            28.4
        Cost of software entitlements and maintenance . . . . . . . . . . . . . . .                           0.3          0.3             0.3
        Cost of service . . . . . . . . . . . . . . . . . . . . . . . . . . . . . . . . . . . . . . .        10.8         11.7            10.4
      Gross profit . . . . . . . . . . . . . . . . . . . . . . . . . . . . . . . . . . . . . . . . . . .     64.1         58.4            60.9
      Operating expenses:
        Sales and marketing . . . . . . . . . . . . . . . . . . . . . . . . . . . . . . .         ....       32.9         34.8            32.6
        Research and development . . . . . . . . . . . . . . . . . . . . . . . . . .              ....       13.6         14.6            13.7
        General and administrative . . . . . . . . . . . . . . . . . . . . . . . . . .            ....        6.1          6.0             5.2
        Restructuring and other charges . . . . . . . . . . . . . . . . . . . . . .               ....        0.1          1.6              —
        Acquisition related income, net . . . . . . . . . . . . . . . . . . . . . .               ....       (1.0)          —               —
            Total operating expenses . . . . . . . . . . . . . . . . . . . . . . . . . . . . . .             51.7         57.0            51.5
      Income from operations . . . . . . . . . . . . . . . . . . . . . . . . . . . . . .          ....       12.4           1.4             9.4
      Other income (expenses), net:
        Interest income . . . . . . . . . . . . . . . . . . . . . . . . . . . . . . . . . .       ....         0.9          1.7             2.0
        Interest expense . . . . . . . . . . . . . . . . . . . . . . . . . . . . . . . . . .      ....        (1.9)        (1.9)           (0.2)
        Other income (expenses), net . . . . . . . . . . . . . . . . . . . . . . . .              ....          —          (1.0)            0.4
      Total other income (expenses), net . . . . . . . . . . . . . . . . . . . . . . . . . .                  (1.0)        (1.2)            2.2
      Income before income taxes . . . . . . . . . . . . . . . . . . . . . . . . . . . . . . .               11.4           0.2           11.6
      Provision for (benefit from) income taxes . . . . . . . . . . . . . . . . . . . . .                     1.2          (1.7)           2.2
      Net income . . . . . . . . . . . . . . . . . . . . . . . . . . . . . . . . . . . . . . . . . . .       10.2%          1.9%            9.4%


Discussion and Analysis of Results of Operations

     Net Revenues — Our net revenues for fiscal 2010, 2009 and 2008 were as follows (in millions, except
percentages):
                                                                                                    Year Ended
                                                           April 30, 2010        April 24, 2009       % Change         April 25, 2008       % Change

Net revenues . . . . . . . . . . . . . . . . . . . .         $3,931.4               $3,406.4               15%           $3,303.2                 3%

     Net revenues increased by $525.0 million, or 15%, in fiscal 2010 compared to fiscal 2009 and by $103.2 million,
or 3% in fiscal 2009 compared to fiscal 2008. The increase in our net revenues for fiscal 2010 was primarily related to
an increase in product revenues, while the increase in fiscal 2009 was due to increases in software entitlements and

                                                                            44
maintenance (SEM) and services revenues, partially offset by decreases in product revenues. Additionally, net
revenues for fiscal 2009 were negatively impacted by the $128.7 million GSA settlement.
      Sales through our indirect channels represented 69%, 69% and 63% of net revenues for fiscal 2010, 2009 and
2008, respectively. The indirect channel mix for 2009 would have been 3% higher if not for the impact of the GSA
settlement.
     The following table sets forth sales to customers, who are distributors, who accounted for 10% or more of
revenues (in millions, except percentages):
                                                                                                      Year Ended
                                                                   April 30,         % of        April 24,    % of         April 25,     % of
                                                                    2010            Revenues      2009       Revenues       2008       Revenues

Arrow . . . . . . . . . . . . . . . . . . . . . . . . . . . .      $550.7             14%        $360.3           11%       G 10%       G 10%
Avnet . . . . . . . . . . . . . . . . . . . . . . . . . . . . .     444.0             11%         356.4           10%       G 10%       G 10%

   Product Revenues (in millions, except percentages):
                                                                                                     Year Ended
                                                            April 30, 2010          April 24, 2009     % Change     April 25, 2008     % Change

Product revenues . . . . . . . . . . . . . . . . .            $2,381.1                $2,152.7            11%           $2,242.5          (4)%
     Product revenues increased by $228.4 million, or 11%, in fiscal 2010 compared to fiscal 2009, and decreased
by $89.8 million, or 4% in fiscal 2009 compared to fiscal 2008. Our configured systems comprise bundled hardware
and software products. Configured systems unit volume increased by 19% in fiscal 2010 compared to fiscal 2009,
with the largest increase in low-end systems, and increased by 14% in fiscal 2009 compared to fiscal 2008,
reflecting an increase in low-end systems, partially offset by decreases in mid-range and high-end systems.
     During fiscal 2010, high-end, midrange and low-end systems generated approximately 23%, 56% and 21% of
configured systems revenues, respectively, compared to approximately 24%, 55% and 21%, respectively in fiscal
2009, and approximately 25%, 59% and 16%, respectively, in fiscal 2008. Overall average selling prices (ASPs)
declined in fiscal 2010 compared to fiscal 2009 due primarily to a shift in mix towards low-end systems, as well as
lower ASPs per unit in midrange and low-end systems. ASPs declined in fiscal 2009 compared to fiscal 2008, due
primarily to lower ASPs in all systems ranges and a shift in mix towards low-end systems.
     In addition, our net add-on hardware, software and other product revenues accounted for an $88.5 million
increase in fiscal 2010 compared to fiscal 2009 and a $102.4 million increase in fiscal 2009 compared to fiscal 2008
due to customers increasing the capacity of their storage systems.
     Our systems are highly configurable to respond to customer requirements in the open systems storage markets
that we serve. This wide variation in customer configurations can significantly impact revenues, cost of revenues,
and gross profit performance. Price changes, unit volumes, customer mix and product configuration can also impact
revenues, cost of revenues and gross profit performance. Disks are a significant component of our storage systems.
Industry disk pricing continues to fall every year, and we pass along those price decreases to our customers while
working to maintain relatively constant profit margins on our disk drives. While our sales price per terabyte
continues to decline, improved system performance, increased capacity and software to manage this increased
capacity have an offsetting impact on product revenues.

   Software Entitlements and Maintenance Revenues (in millions, except percentages):
                                                                                                     Year Ended
                                                            April 30, 2010          April 24, 2009     % Change     April 25, 2008     % Change

Software entitlements and maintenance
  revenues . . . . . . . . . . . . . . . . . . . . . .            $679.8               $618.3             10%           $486.9           27%
    SEM revenues increased by $61.5 million, or 10%, in fiscal 2010 compared to fiscal 2009 and increased by
$131.4 million, or 27% in fiscal 2009 compared to fiscal 2008. These increases were the result of an increase in the

                                                                               45
aggregate contract value of the installed base under SEM contracts, which is recognized as revenue ratably over the
terms of the underlying contracts.

   Service Revenues (in millions, except percentages):
                                                                                          Year Ended
                                                       April 30, 2010    April 24, 2009     % Change   April 25, 2008   % Change

Service revenues . . . . . . . . . . . . . . . . .        $870.5            $764.1            14%         $573.8          33%
     Service revenues include hardware maintenance, professional services and educational and training services.
Service revenues increased by $106.4 million, or 14%, in fiscal 2010, compared to fiscal 2009 and by $190.3 million,
or 33% in fiscal 2009, compared to fiscal 2008.
     Service maintenance contract revenues increased 20% in fiscal 2010 compared to fiscal 2009 and increased
35% in fiscal 2009 compared to fiscal 2008, as a result of an increase in the installed base of service contracts and
the timing of recognition of the related revenue. Professional services and educational and training services
revenues increased 4% for fiscal 2010, compared to fiscal 2009, and increased 32% in fiscal 2009, compared to
fiscal 2008.

   GSA settlement (in millions, except percentages):
                                                                                          Year Ended
                                                       April 30, 2010    April 24, 2009     % Change   April 25, 2008   % Change

GSA settlement . . . . . . . . . . . . . . . . . .         $—              $(128.7)          (100)%        $—             NM

NM — Not meaningful.
During fiscal 2009 we recorded $128.7 million as a reduction of revenues for the GSA settlement.

   Revenues by Geographic Area (in millions, except percentages):
                                                                                          Year Ended
                                                       April 30, 2010    April 24, 2009     % Change   April 25, 2008   % Change

Americas (United States, Canada and
  Latin America)* . . . . . . . . . . . . . . . .        $2,208.1          $1,805.2           22%        $1,829.4          (1)%
Europe, Middle East and Africa
  (EMEA) . . . . . . . . . . . . . . . . . . . . . .      1,329.1           1,213.3           11%         1,083.8         12%
Asia Pacific and Japan (APAC) . . . . . . .                 394.2             387.9            1%           390.0         (0)%

Net revenues . . . . . . . . . . . . . . . . . . . .     $3,931.4          $3,406.4                      $3,303.2

* Sales to the United States accounted for 89%, 90% and 91% of Americas’ revenues in fiscal 2010, 2009 and 2008,
  respectively.
    Revenues from the Americas geographic area increased by $402.9 million in fiscal 2010 compared to fiscal
2009, due to an increase in gross revenues of $531.6 million and the negative impact in fiscal 2009 of the
$128.7 million GSA settlement. Sales to Germany accounted for 11% of net revenues in each of fiscal 2010 and
2009, and less than 10% of net revenues in fiscal 2008. No other single foreign country accounted for ten percent or
more of net revenues in any of the years presented.

   Cost of Revenues
     Our cost of revenues consists of three elements: (1) cost of product revenues, which includes the costs of
manufacturing and shipping of our storage systems, amortization of purchased intangible assets, inventory write-
downs, and warranty costs; (2) cost of software maintenance and entitlements, which includes the costs of providing
software entitlements and maintenance and third party royalty costs, and (3) cost of service, which reflects costs

                                                                    46
associated with providing support center activities for hardware, global support partnership programs, professional
services and educational and training services.

     Our gross profits are impacted by a variety of factors including pricing and discount practices, channel sales
mix, revenue mix and product material costs. Service gross profit is also typically impacted by factors such as
changes in the size of our installed base of products, as well as the timing of support service initiations and renewals,
and incremental investments in our customer support infrastructure. If our shipment volumes, product and services
mix, average selling prices and pricing actions that impact our gross profit are adversely affected, whether by
economic uncertainties or for other reasons, our gross profit could decline.

  Cost of Product Revenues (in millions, except percentages):
                                                                                                      Year Ended
                                                           April 30, 2010         April 24, 2009        % Change        April 25, 2008    % Change

Cost of product revenues . . . . . . . . . . .                 $976.4               $1,007.6                (3)%             $938.4           7%

     Cost of product revenues decreased by $31.2 million, or 3%, in fiscal 2010 compared to fiscal 2009 as a result
of lower materials costs, warranty costs and demonstration equipment reserves, partially offset by higher unit
volume. Cost of product revenues increased by $69.2 million, or 7%, in fiscal 2009 compared to fiscal 2008,
primarily due to increased materials cost as a result of increased unit volume and higher per unit costs in all products
ranges.

      The decrease in cost of product revenues in fiscal 2010 compared to fiscal 2009 reflected a decrease in
materials costs of $9.9 million despite an increase in total units shipped. Our material costs were favorably impacted
in fiscal 2010 by lower average per unit materials costs in our midrange and low-end systems due to favorable
materials pricing, which we expect to continue. These favorable impacts were offset by higher unit volume and
higher average per unit materials costs in our high-end systems. In addition, our cost of product revenues were
favorably impacted in fiscal 2010 compared to fiscal 2009 as a result of a decrease of $11.3 million in warranty costs
and $8.6 million in reserves for evaluation equipment due to higher than anticipated sales of such equipment to
customers. Cost of product revenues were negatively impacted in fiscal 2009 compared to fiscal 2008 as a result of
approximately $9.7 million of incremental inventory writedowns.

     Cost of product revenues represented 41% of product revenue for 2010 compared to 47% for 2009, and 42% in
fiscal 2008. The overall reduction of costs as a percentage of revenues in fiscal 2010 was the result of per unit
materials cost reductions outpacing sales price reductions. The increase in materials costs as a percentage of
revenues in fiscal 2009 reflected higher per unit materials costs compared to the prior year.

     Cost of product revenues increased (decreased) due to the following:
                                                                                                           Year % Change        Year % Change
                                                                                                            Fiscal 2009 to       Fiscal 2008 to
                                                                                                             Fiscal 2010          Fiscal 2009

     Materials costs . . . . . . . . . . . . . . . . . . . . . . . . . . . . . . . . . . . . . . . .              1%                   6%
     Excess and obsolete inventory . . . . . . . . . . . . . . . . . . . . . . . . . . . .                       (2)                   1
     Warranty . . . . . . . . . . . . . . . . . . . . . . . . . . . . . . . . . . . . . . . . . . . .            (1)                  —
     Other . . . . . . . . . . . . . . . . . . . . . . . . . . . . . . . . . . . . . . . . . . . . . . .         (1)                  —
     Total change . . . . . . . . . . . . . . . . . . . . . . . . . . . . . . . . . . . . . . . . .              (3)%                    7%


  Cost of Software Entitlements and Maintenance Revenues (in millions, except percentages):
                                                                                                      Year Ended
                                                           April 30, 2010         April 24, 2009        % Change        April 25, 2008    % Change

Cost of software entitlements and
  maintenance revenues . . . . . . . . . . . .                  $12.3                   $9.2                34%               $8.6            7%

                                                                            47
Cost of SEM revenues increased due to the following:
                                                                                                   Year % Change       Year % Change
                                                                                                    Fiscal 2009 to      Fiscal 2008 to
                                                                                                     Fiscal 2010         Fiscal 2009

     Field service engineering costs . . . . . . . . . . . . . . . . . . . . . . . . .                   29%                  30%
     Royalties . . . . . . . . . . . . . . . . . . . . . . . . . . . . . . . . . . . . . . . . .          5                  (23)
     Total change. . . . . . . . . . . . . . . . . . . . . . . . . . . . . . . . . . . . . . .           34%                     7%

     Cost of SEM revenues increased by $3.1 million, or 34%, in fiscal 2010 compared to fiscal 2009 and increased
by $0.6 million, or 7%, in fiscal 2009 compared to fiscal 2008 due to an increase in field service engineering costs.
Cost of SEM revenues represented 2% of SEM revenues for each of the fiscal 2010, 2009 and 2008, respectively.


  Cost of Service Revenues (in millions, except percentages):
                                                                                                   Year Ended
                                                          April 30, 2010        April 24, 2009       % Change        April 25, 2008   % Change

Cost of service revenues . . . . . . . . . . . .              $423.5                $399.7               6%             $342.8           17%

     Cost of service revenues increased by $23.8 million, or 6%, in fiscal 2010 compared to fiscal 2009 due to
increased commissions and incentive compensation plan expenses, as well as an increase in service and support
purchased from third parties, and increased by $56.9 million, or 17%, in fiscal 2009 compared to fiscal 2008 due to
increases in professional support engineer costs, support center activities, and global service partnership programs.
Costs represented 49%, 52% and 60%, respectively, of service revenues for fiscal 2010, 2009 and 2008. The
decrease in service cost of revenues as a percentage of service revenue was primarily due to improved productivity.


  Operating Expenses

  Sales and Marketing, Research and Development, and General and Administrative Expenses

      Compensation costs comprise the largest component of operating expenses. Included in compensation costs are
salaries and related benefits, stock-based compensation costs and employee incentive compensation plan costs.
Compensation costs included in operating expenses increased approximately $108.6 million, or 11%, during fiscal
2010 compared to fiscal 2009, primarily due to (i) a $75.6 million increase in employee incentive compensation due to
stronger operating profit performance, (ii) a $16.4 million increase in stock based compensation, and (iii) a
$16.5 million increase in salaries, benefits and other compensation related costs. In addition, sales and marketing
expenses reflected an increase in commissions expense of $60.7 million during fiscal 2010, reflecting stronger sales
performance compared to fiscal 2009.

     Compensation costs included in operating expenses increased approximately $111.4 million, or 12%, during
fiscal 2009 compared to fiscal 2008, primarily due to (i) an $113.1 million increase in salaries, benefits and other
compensation related costs, reflecting an increase in average headcount and (ii) a $7.3 million increase in employee
incentive compensation, partially offset by a $9.0 million decrease in stock-based compensation expense.


  Sales and Marketing (in millions, except percentages) —
                                                                                                   Year Ended
                                                          April 30, 2010        April 24, 2009       % Change        April 25, 2008   % Change

Sales and marketing expenses . . . . . . . .                $1,293.7              $1,186.1               9%            $1,075.7          10%

     Sales and marketing expense consists primarily of compensation costs, commissions, allocated facilities and
IT costs, advertising and marketing promotional expense, and travel and entertainment expense. In addition, during

                                                                          48
fiscal 2009, we recorded a $9.4 million loss on impairment of a sales force automation tool. Sales and marketing
expenses increased due to the following:
                                                                                                           Year % Change        Year % Change
                                                                                                            Fiscal 2009 to       Fiscal 2008 to
                                                                                                             Fiscal 2010          Fiscal 2009

     Salaries . . . . . . . . . . . . . . . . . . . . . . . . . . . . . . . . . . . . . . . . . . . . .           —%                   6%
     Incentive plan compensation . . . . . . . . . . . . . . . . . . . . . . . . . . . . . .                       3                  —
     Stock based compensation . . . . . . . . . . . . . . . . . . . . . . . . . . . . . . .                        1                  —
     Other compensation related costs . . . . . . . . . . . . . . . . . . . . . . . . . .                          1                  —
     Commissions . . . . . . . . . . . . . . . . . . . . . . . . . . . . . . . . . . . . . . . . .                 5                  —
     Advertising and marketing promotional expense . . . . . . . . . . . . . . .                                  (1)                 —
     IT expenses related to software implementation and IT support . . . .                                         1                   3
     Travel and entertainment expense . . . . . . . . . . . . . . . . . . . . . . . . . .                         (1)                 —
     Asset impairment . . . . . . . . . . . . . . . . . . . . . . . . . . . . . . . . . . . . . .                 (1)                  1
     Other . . . . . . . . . . . . . . . . . . . . . . . . . . . . . . . . . . . . . . . . . . . . . . .           1                  —
     Total change . . . . . . . . . . . . . . . . . . . . . . . . . . . . . . . . . . . . . . . . .               9%                  10%


  Research and Development (in millions, except percentages) —
                                                                                                      Year Ended
                                                           April 30, 2010         April 24, 2009        % Change         April 25, 2008     % Change

Research and development expenses . . .                        $535.7                 $498.5                 7%              $452.2             10%

     Research and development expense consists primarily of compensation costs, allocated facilities and IT costs,
depreciation and amortization, and prototype, non-recurring engineering (NRE) charges and other outside services
costs. Research and development expenses increased due to the following:
                                                                                                           Year % Change        Year % Change
                                                                                                            Fiscal 2009 to       Fiscal 2008 to
                                                                                                             Fiscal 2010          Fiscal 2009

     Salaries . . . . . . . . . . . . . . . . . . . . . . . . . . . . . . . . . . . . . . . . . . . . .           (1)%                     7%
     Incentive plan compensation . . . . . . . . . . . . . . . . . . . . . . . . . . . . . .                       6                       1
     Stock based compensation . . . . . . . . . . . . . . . . . . . . . . . . . . . . . . .                       —                       (2)
     Facilities and IT support costs . . . . . . . . . . . . . . . . . . . . . . . . . . . .                       2                       2
     NRE charges . . . . . . . . . . . . . . . . . . . . . . . . . . . . . . . . . . . . . . . . .                 1                       1
     Other . . . . . . . . . . . . . . . . . . . . . . . . . . . . . . . . . . . . . . . . . . . . . . .          (1)                      1
     Total change . . . . . . . . . . . . . . . . . . . . . . . . . . . . . . . . . . . . . . . . .               7%                  10%

     We believe that our future performance will depend in large part on our ability to maintain and enhance our
current product line, develop new products that achieve market acceptance, maintain technological competitiveness
and meet an expanding range of customer requirements. We expect to continue to spend on current and future
product development efforts, broaden our existing product offerings and introduce new products that expand our
solutions portfolio.


  General and Administrative (in millions, except percentages) —
                                                                                                      Year Ended
                                                           April 30, 2010         April 24, 2009        % Change         April 25, 2008     % Change

General and administrative expenses . . .                      $238.8                 $203.7                17%              $171.5             19%

                                                                            49
General and administrative expense consists primarily of compensation costs, professional and corporate legal
fees, recruiting expenses, and allocated facilities and IT costs. General and administrative expenses increased due to
the following:
                                                                                                           Year % Change       Year % Change
                                                                                                            Fiscal 2009 to      Fiscal 2008 to
                                                                                                             Fiscal 2010         Fiscal 2009

     Salaries . . . . . . . . . . . . . . . . . . . . . . . . . . . . . . . . . . . . . . . . . . . . .           1%                  5%
     Incentive plan compensation . . . . . . . . . . . . . . . . . . . . . . . . . . . . . .                      8                   1
     Stock based compensation . . . . . . . . . . . . . . . . . . . . . . . . . . . . . . .                       4                  —
     Other compensation related costs . . . . . . . . . . . . . . . . . . . . . . . . . .                         3                   1
     Professional and corporate legal fees. . . . . . . . . . . . . . . . . . . . . . . .                        (2)                  8
     IT costs . . . . . . . . . . . . . . . . . . . . . . . . . . . . . . . . . . . . . . . . . . . . .           2                   4
     Other . . . . . . . . . . . . . . . . . . . . . . . . . . . . . . . . . . . . . . . . . . . . . . .          1                  —
     Total change . . . . . . . . . . . . . . . . . . . . . . . . . . . . . . . . . . . . . . . . .              17%                 19%

  Restructuring and Other Charges (in millions, except percentages):
                                                                                                      Year Ended
                                                           April 30, 2010         April 24, 2009        % Change       April 25, 2008    % Change

Restructuring and other charges . . . . . .                      $2.5                  $54.4                (95)%            $0.4          13,500%
      Fiscal 2009 Restructuring Plans — In February 2009, we announced our decision to execute a worldwide
restructuring program, which included a reduction in workforce, the closing or downsizing of certain facilities, and
the establishment of a plan to outsource certain internal activities. In December 2008, we announced our decision to
cease the development and availability of SnapMirror for Open Systems (SMOS), which was originally acquired
through our acquisition of Topio in fiscal 2007. As part of this decision, we also announced the closure of our
engineering facility in Haifa, Israel. These restructuring activities resulted in restructuring charges in fiscal 2009
totaling $51.5 million of severance-related amounts and other charges attributable to the termination of approx-
imately 450 regular positions, abandoned excess facilities, charges relating to non-cancelable lease costs, (which
are net of expected sublease income); contract cancellation charges; outplacement expenses; fixed assets and
intangibles write-offs; as well as $2.9 million of other charges to support our restructuring initiatives. In fiscal 2010,
we recorded additional charges of $2.5 million primarily related to adjustments to future lease commitments and
employee severance costs associated with our fiscal 2009 restructuring plan.
      In recording the facility lease restructuring reserve, we made certain estimates and assumptions related to the
(i) time period over which the relevant buildings would remain vacant, (ii) sublease terms, and (iii) sublease rates.
      Fiscal 2002 Restructuring Plan — As of April 30, 2010, we had $0.5 million remaining in facility restruc-
turing reserves established as part of a restructuring in fiscal 2002 related to future lease commitments on exited
facilities, net of expected sublease income. We reevaluate our estimates and assumptions periodically and make
adjustments as necessary based on the time period over which the facilities will be vacant, expected sublease terms,
and expected sublease rates.
     As of April 30, 2010, the remaining balance of the restructuring reserve related to the fiscal 2009 and 2002
restructuring plans consisted of approximately $4.1 million of facilities-related lease payments, which we expect to
be substantially paid by January 2013.
     See Note 13 of the accompanying consolidated financial statements for further discussion of our restructuring
activities.
  Acquisition Related Income, Net (in millions, except percentages):
                                                                                                      Year Ended
                                                           April 30, 2010         April 24, 2009        % Change       April 25, 2008    % Change

Acquisition related income, net . . . . . . .                  $(39.9)                  $—                 NM                $—             NM

NM — Not meaningful.

                                                                            50
On May 20, 2009, we announced that we had entered into a merger agreement with Data Domain, Inc. (Data
Domain) under which we would acquire Data Domain in a stock and cash transaction. On July 8, 2009, Data
Domain’s Board of Directors terminated the merger agreement and pursuant to the terms of the agreement, Data
Domain paid us a $57.0 million termination fee. We incurred $15.9 million of incremental third-party costs relating
to the terminated merger transaction during the same period, resulting in net proceeds of $41.1 million recorded in
the consolidated statement of operations during fiscal 2010. During fiscal 2010, we paid $1.2 million of acquisition
related expenses related to the acquisition of Bycast Inc. (see Note 20 of the accompanying consolidated financial
statements).

   Other Income and Expense
   Interest Income (in millions, except percentages):
                                                                                            Year Ended
                                                       April 30, 2010      April 24, 2009     % Change       April 25, 2008    % Change

Interest income. . . . . . . . . . . . . . . . . . .        $31.2              $57.6              (46)%         $64.6            (11)%
     The decrease in interest income for fiscal 2010 compared to fiscal 2009, and in fiscal 2009 compared to fiscal
2008, was primarily due to lower market yields on our cash and investment portfolio. In fiscal 2009, this yield
decline was partially offset by an increase in our cash and investment balances due to the issuance of the Convertible
Notes (the “Note”), (see Note 10 of the accompanying consolidated financial statements).
      Interest Expense (in millions, except percentages):
                                                                                            Year Ended
                                                       April 30, 2010      April 24, 2009     % Change       April 25, 2008    % Change

Interest expense . . . . . . . . . . . . . . . . . .        $(74.1)            $(63.4)            17%            $(8.0)          693%
     Interest expense increased $10.7 million for fiscal 2010 compared to fiscal 2009, primarily due to interest
expense on our 1.75% Notes, issued on June 10, 2008, which were outstanding for the full year ended April 30, 2010
but only a partial period in the prior year.
      During fiscal 2010 and fiscal 2009, we recognized approximately $50.8 million and $41.0 million, respec-
tively, in incremental non-cash interest expense from the amortization of debt discount and issuance costs relating to
our Notes. The coupon interest expense related to the Notes was $22.5 million and $19.4 million, respectively, for
fiscal 2010 and fiscal 2009.
     The increase in interest expense in fiscal 2009 compared to fiscal 2008 was primarily due to interest expense
and amortization of debt issuance costs on our Notes, partially offset by lower interest expense related to the
reduced outstanding balance on our secured credit agreement we entered into with JPMorgan in October 2007.

   Other Income (Expense), Net (in millions, except percentages):
                                                                                                Year Ended
                                                              April 30, 2010   April 24, 2009     % Change    April 25, 2008   % Change

Realized gain (loss) on investments, net . . . .                  $ 3.9           $ —               NM            $12.6          (100)%
Impairment of investments . . . . . . . . . . . . . .                —             (29.5)          (100)%            —            NM
Other expenses, net . . . . . . . . . . . . . . . . . . .          (2.4)            (3.6)           (33)%          (0.1)        2,600%
Other income (expense), net. . . . . . . . . . . . .              $ 1.5           $(33.1)           NM            $12.5          NM

NM — Not meaningful
     Other income (expense), net in fiscal 2010 included $3.9 million of net gains on investments, consisting
primarily of a gain on investments in privately held companies of $3.7 million and $1.0 million net gain on our
investment in the Primary Fund and Lehman Brothers securities, offset by net losses on other investments of
$0.8 million. Other expenses included $5.3 in net losses on foreign currency transactions and related hedging
activities, partially offset by other income of $2.9 million.

                                                                      51
Other income (expense), net in fiscal 2009 included a net impairment loss related to our investments in
privately held companies of $6.3 million, an other-than-temporary impairment charge on our available-for-sale
investments related to direct and indirect investments in Lehman Brothers securities of $21.1 million, and an
other-than-temporary decline in the value of our ARS of $2.1 million. Other expenses included $5.0 in net exchange
losses from foreign currency transactions and related hedging activities, partially offset by other income of
$1.4 million.

     Other income (expense), net in fiscal 2008 consisted primarily of a gain of $13.6 million related to the sale of
shares of Blue Coat common stock, partially offset by a net impairment of $1.0 million for our investments in
privately-held companies. Other expense included $0.7 in net exchange losses from foreign currency transactions
and related hedging activities, partially offset by other income of $0.6 million.

  Provision for (Benefit from) Income Taxes (in millions, except percentages):
                                                                                     Year Ended
                                                   April 30, 2010   April 24, 2009     % Change   April 25, 2008   % Change

Provision for (benefit from) income taxes . . .       $46.6            $(56.3)           NM          $73.0           NM

NM — Not meaningful.

      Our effective tax rate for fiscal 2010 was 10.4%, compared to an effective tax benefit of 681.5% for fiscal 2009
and an effective tax rate of 19.1% for fiscal 2008. Our effective tax rate reflects our corporate legal entity structure
and the global nature of our business with a significant amount of our profits generated and taxed in foreign
jurisdictions at rates below the U.S. statutory tax rate. The effective tax rate for fiscal 2010 was favorably impacted
by the geographic mix of profits. The tax benefit rate for fiscal 2009 reflected losses generated in the U.S. during
that period that were partially offset by profits generated in foreign tax jurisdictions where the tax rates were below
the U.S. statutory rate.

      The effective tax rate of 10.4% in fiscal 2010 included a benefit of $105.3 million, or 23.5 percentage points,
related to foreign income tax rates that are lower than the U.S. federal statutory rate of 35%, a benefit of
$7.8 million, or 1.7 percentage points, related to research and development tax credits, a benefit of $2.6 million, or
0.6 percentages points, related to stock-based compensation, partially offset by the unfavorable impact of
$2.6 million, or 0.6 percentage points, related to state income taxes.

     The effective tax benefit of 681.5% for fiscal 2009 included the benefit of $51.0 million, or 616.8 percentage
points, related to foreign income tax rates that are lower than the U.S. federal statutory rate of 35%, a benefit of
$9.2 million, or 111.1 percentage points, related to research and development tax credits, a benefit of $7.9 million,
or 95.5 percentage points, related to state income taxes, partially offset by the unfavorable impact of $10.2 million,
or 122.9 percentage points, related to stock-based compensation.

      The effective tax rate of 19.1% for fiscal 2008 included a benefit of $67.6 million, or 17.7 percentage points,
related to foreign income tax rates that are lower than the U.S. federal statutory rate, a benefit of $4.7 million, or
1.2 percentage points, related to research and development tax credits, partially offset by the unfavorable impact of
$11.02 million, or 2.9 percentages points, related to stock-based compensation, and $2.2 million, or 0.6 percentage
points, related to state income taxes.

Liquidity and Capital Resources

     The following sections discuss our principal liquidity requirements, as well as our sources and uses of cash
flows on our liquidity and capital resources. The principal objectives of our investment policy are the preservation
of principal and maintenance of liquidity. We attempt to mitigate default risk by investing in high-quality
investment grade securities, limiting the time to maturity and by monitoring the counter-parties and underlying
obligors closely. We believe our cash equivalents and short-term investments are liquid and accessible. We are not
aware of any significant deterioration in the fair value of our cash equivalents or investments from the values
reported as of April 30, 2010.

                                                          52
Liquidity Sources, Cash Requirements

     Our principal sources of liquidity as of April 30, 2010 consisted of approximately $3.7 billion in cash, cash
equivalents and short-term investments and cash we expect to generate from operations.

     Cash, cash equivalents and investments consist of the following:
                                                                                                    April 30, 2010   April 24, 2009

       Cash and cash equivalents . . . . . . . . . . . . . . . . . . . . . . . . . . . . . . . .      $1,705.0         $1,494.2
       Short-term investments . . . . . . . . . . . . . . . . . . . . . . . . . . . . . . . . . .      2,019.0          1,110.1
       Long-term investments and restricted cash . . . . . . . . . . . . . . . . . . . .                  72.8            127.3
     Total cash, cash equivalents and investments . . . . . . . . . . . . . . . . . . . .             $3,796.8         $2,731.6

     Our principal liquidity requirements are primarily to meet our working capital needs, support ongoing business
activities, research and development, capital expenditure needs, investment in critical or complementary tech-
nologies, and to service our debt and synthetic leases.

      Key factors that could affect our cash flows include changes in our revenue mix and profitability, as well as our
ability to effectively manage our working capital, in particular, accounts receivable and inventories. Based on our
current business outlook, we believe that our sources of cash will satisfy our working capital needs, capital
expenditures, investment requirements, stock repurchases, contractual obligations, commitments, interest pay-
ments on our Notes and other liquidity requirements associated with operations and meet our cash requirements for
at least the next 12 months. However, in the event our liquidity is insufficient, we may be required to further curtail
spending and implement additional cost saving measures and restructuring actions. In light of the current economic
and market conditions, we cannot be certain that we will continue to generate cash flows at or above current levels or
that we will be able to obtain additional financing, if necessary, on satisfactory terms, if at all.

     Our contractual obligations as of April 30, 2010 are summarized below in the Contractual Obligations tables.

      Our investment portfolio, including auction rate securities has been and will continue to be exposed to market
risk due to trends in the credit and capital markets. However, we are not dependent on liquidating these investments
in the next twelve months in order to meet our liquidity needs. We continue to closely monitor current economic and
market events to minimize our market risk on our investment portfolio. Based on our ability to access our cash and
short-term investments, our expected operating cash flows, and our other potential sources of cash, we do not
anticipate that the lack of liquidity of these investments will impact our ability to fund working capital needs, capital
expenditures, acquisitions or other cash requirements. We intend to and believe that we have the ability to hold these
investments until the market recovers. If current market conditions deteriorate, we may be required to record
additional charges to earnings in future periods.


  Capital Expenditure Requirements

     We expect to fund our capital expenditures, including our commitments related to facilities and equipment
operating leases, over the next few years through existing cash, cash equivalents, investments and cash generated
from operations. The timing and amount of our capital requirements cannot be precisely determined at this time and
will depend on a number of factors including future demand for products, product mix, changes in the network
storage industry, hiring plans and our decisions related to financing our facilities requirement. We expect that our
existing facilities and those being developed in Sunnyvale, California; RTP, North Carolina; and worldwide are
adequate for our requirements over at least the next two years and that additional space will be available as needed.


  Acquisition Related Requirements

     On April 6, 2010, we entered into a definitive agreement to acquire Bycast Inc. for approximately $80 million
in cash. The merger was completed on May 13, 2010.

                                                                    53
Cash Flows

     As of April 30, 2010, compared to April 24, 2009, our cash and cash equivalents and short-term investments
increased by $1.1 billion to $3.7 billion. The increase in cash and cash equivalents and short-term investments was
primarily a result of cash provided by operating activities and issuances of common stock related to employee stock
option exercises and employee stock purchase plan, partially offset by capital expenditures. We derive our liquidity
and capital resources primarily from our cash flow from operations and from working capital. Days sales
outstanding as of April 30, 2010 decreased to 37 days, compared to 46 days as of April 24, 2009, primarily
due to improvements in shipment linearity and collections performance. Working capital increased by $0.9 billion
to $2.6 billion as of April 30, 2010, compared to $1.8 billion as of April 24, 2009, primarily due to an increase in
cash, cash equivalents and short-term investments of $1.1 billion.

  Cash Flows from Operating Activities

      During fiscal 2010 and 2009, we generated cash flows from operating activities of $975.0 million and
$889.2 million, respectively. The primary sources of cash from operations in fiscal 2010 consisted of net income of
$400.4 million, adjusted by non-cash stock-based compensation expense of $159.8 million and depreciation and
amortization expense of $166.0 million. Significant changes in assets and liabilities impacting operating cash flows
in fiscal 2010 included an increase in deferred revenue of $176.7 million, and an increase in accrued compensation
and other current liabilities of $53.2 million. The primary sources of cash from operations in fiscal 2009 consisted of
net income of $64.6 million, adjusted by non-cash stock-based compensation expense of $140.8 million, depre-
ciation and amortization expense of $170.5 million and a deferred tax provision of $124.6 million. Significant
changes in assets and liabilities impacting operating cash flows in fiscal 2009 included a decrease in accounts
receivable of $128.7 million, an increase in deferred revenue of $219.3 million, and an increase in other current
liabilities of $128.7 million related to the GSA settlement.

     We expect that cash provided by operating activities may fluctuate in future periods as a result of a number of
factors, including fluctuations in our operating results, shipment linearity, accounts receivable collections perfor-
mance, inventory and supply chain management, tax benefits from stock-based compensation, and the timing and
amount of compensation and other payments.

  Cash Flows from Investing Activities

     Capital expenditures for fiscal 2010 were $135.6 million, which included the purchase of fifteen acres of land
in Bangalore, India for approximately $28.5 million, compared to $289.6 million in fiscal 2009. We paid
$860.3 million for net purchases and redemptions of short-term investments in fiscal 2010, compared to
$116.8 million in fiscal 2009. In addition, in fiscal 2009 we reclassified $598.0 million of cash equivalents related
to the Primary Fund to short-term investments.

  Cash Flows from Financing Activities

     We received $219.9 million and $696.6 million from financing activities in fiscal 2010 and 2009, respectively.
Proceeds from employee equity award plans, net of shares withheld for taxes were $197.1 million in fiscal 2010,
compared to $85.9 million in fiscal 2009. In fiscal 2010, we received $14.2 million from the settlement of a Note
hedge with Lehman Brothers. In fiscal 2009, we issued $1.265 billion of convertible notes, received proceeds of
$163.1 million for sale of related common stock warrants, and paid $254.9 million for purchase of related note
hedges, made repayments of $172.6 million against our Secured Credit Agreement and the Term Loan and
repurchased 17.0 million shares of common stock for a total of $400.0 million.

     Net proceeds from the issuance of common stock related to employee participation in employee equity award
programs have historically been a significant component of our liquidity. The extent to which our employees
exercise stock options or participate in our ESPP program generally increases or decreases based upon changes in
the market price of our common stock. As a result, our cash flow resulting from the issuance of common stock in
connection with these programs and related tax benefits will vary.

                                                          54
Stock Repurchase Program
    At April 30, 2010, $1.1 billion remained available for future repurchases under plans approved as of that date.
The stock repurchase program may be suspended or discontinued at any time.

   Convertible Notes
     As of April 30, 2010, we had $1.265 billion principal amount of 1.75% Convertible Senior Notes due 2013
(See Note 10 of the accompanying consolidated financial statements). The Notes will mature on June 1, 2013,
unless earlier repurchased or converted. As of April 30, 2010, the Notes have not been repurchased or converted. We
also have not received any shares under the related Note hedges or delivered cash or shares under the related
warrants.

   Credit Facility
    Effective December 22, 2009, we terminated our senior unsecured credit agreement as further discussed in
Note 10 of the accompanying Consolidated Financial Statements.

   Contractual Obligations
    The following summarizes our contractual obligations at April 30, 2010 and the effect such obligations are
expected to have on our liquidity and cash flows in future periods (in millions):
                                                                2011     2012       2013       2014   2015   Thereafter       Total

Contractual Obligations:
Office operating lease payments . . . . . . . . . $ 26.7 $22.3 $ 17.8 $ 15.1 $13.0                            $20.4       $ 115.3
Real estate lease payments(1) . . . . . . . . . .         3.6   3.6 129.5       —     —                         —           136.7
Less: sublease income . . . . . . . . . . . . . . . .    (5.8) (0.8) (0.6)    (0.4) (0.2)                       —            (7.8)
Equipment operating lease payments . . . . .             24.3 10.7    4.6      0.4    —                         —            40.0
Purchase commitments with contract
   manufacturers(2) . . . . . . . . . . . . . . . . . . 139.4   3.6   3.6      1.2   0.2                          —             148.0
Other purchase obligations(3) . . . . . . . . . .        49.4 10.2    3.4      0.3    —                           —              63.3
1.75% Convertible notes(4) . . . . . . . . . . . .       22.1 22.1   22.1  1,276.1    —                           —           1,342.4
   Total by period . . . . . . . . . . . . . . . . . . . $259.7         $71.7 $180.4       $1,292.7 $13.0     $20.4       $1,837.9
Uncertain tax positions(5) . . . . . . . . . . . . .                                                                           122.4
Total Contractual Obligations . . . . . . . . .                                                                           $1,960.3
Other Commercial Commitments:
Letters of credit . . . . . . . . . . . . . . . . . . . . . $     4.1   $ 0.4   $     —    $      — $ —       $ 0.6       $       5.1

     Some of the figures we include in this table are based on management’s estimates and assumptions about these
obligations, including their duration, the possibility of renewal or termination, anticipated actions by management
and third parties and other factors. Because these estimates and assumptions are necessarily subjective, our actual
future obligations may vary from those reflected in the table.

(1) Included in real estate lease payments pursuant to four financing arrangements with BNP Paribas LLC
    (BNPPLC) are (i) lease commitments of $3.6 million in each of the fiscal years 2011 and 2012; and $2.4 million
    in fiscal 2013, which are based on either the LIBOR rate at April 30, 2010 plus a spread or a fixed rate for terms
    of five years, and (ii) at the expiration or termination of the lease, a supplemental payment obligation equal to
    our minimum guarantee of $127.1 million in the event that we elect not to purchase or arrange for sale of the
    buildings.
(2) Contract manufacturer commitments consist of obligations for on hand inventories and non-cancelable
    purchase order with our contract manufacturer. We record a liability for firm, noncancelable, and nonreturnable

                                                                        55
purchase commitments for quantities in excess of our future demand forecasts, which is consistent with the
    valuation of our excess and obsolete inventory. As of April 30, 2010, the liability for these purchase
    commitments in excess of future demand was approximately $3.8 million and is recorded in other current
    liabilities.
(3) Purchase obligations represent an estimate of all open purchase orders and contractual obligations in the
    ordinary course of business, other than commitments with contract manufacturers and suppliers, for which we
    have not received the goods or services. Purchase obligations do not include contracts that may be cancelled
    without penalty. Although open purchase orders are considered enforceable and legally binding, the terms
    generally allow us the option to cancel, reschedule, and adjust our requirements based on our business needs
    prior to the delivery of goods or performance of services.
(4) Included in these amounts are obligations related to the $1.265 billion principal amount of 1.75% Notes due
    2013 (see Note 10 of the accompanying consolidated financial statements). Estimated interest payments for the
    Notes are $77.4 million for fiscal 2011 through fiscal 2014.
(5) As of April 30, 2010, our liability for uncertain tax positions was $122.4 million, which due to the uncertainty of
    the timing of future payments, are presented in the total column on a separate line in this table.

      As of April 30, 2010, we have four leasing arrangements (Leasing Arrangements 1, 2, 3 and 4) with BNPPLC
which requires us to lease certain of our land to BNPPLC for a period of 99 years and to lease approximately
0.6 million square feet of office space for our headquarters in Sunnyvale, which had an original cost of
$149.6 million. Under these leasing arrangements, we pay BNPPLC minimum lease payments, which vary based
on LIBOR plus a spread or a fixed rate on the costs of the facilities on the respective lease commencement dates. We
make payments for each of the leases for a term of five years. We have the option to renew each of the leases for two
consecutive five-year periods upon approval by BNPPLC. Upon expiration (or upon any earlier termination) of the
lease terms, we must elect one of the following options: (i) purchase the buildings from BNPPLC at cost; (ii) if
certain conditions are met, arrange for the sale of the buildings by BNPPLC to a third party for an amount equal to at
least 85% of the costs (residual guarantee), and be liable for any deficiency between the net proceeds received from
the third party and such amounts; or (iii) pay BNPPLC supplemental payments for an amount equal to at least 85%
of the costs (residual guarantee), in which event we may recoup some or all of such payments by arranging for a sale
of each or all buildings by BNPPLC during the ensuing two-year period. The following table summarizes the costs,
the residual guarantee, the applicable LIBOR plus spread or fixed rate at April 30, 2010 and the date we began to
make payments for each of our leasing arrangements (in millions):
                                                                LIBOR
                                                                  Plus                 Lease
   Leasing                                Residual             Spread or            Commencement
Arrangements             Cost            Guarantee             Fixed Rate               Date                       Term

     1                  $48.5              $41.2                 3.99%              January 2008               5   years
     2                  $80.0              $68.0                 1.08%             December 2007               5   years
     3                  $10.5              $ 8.9                 3.97%             December 2007               5   years
     4                  $10.6              $ 9.0                 3.99%             December 2007               5   years

      All leases require us to maintain specified financial covenants with which we were in compliance as of
April 30, 2010. Such financial covenants include a maximum ratio of Total Debt to Earnings before Interest, Taxes,
Depreciation and Amortization and a minimum amount of Unencumbered Cash and Short-Term Investments. Our
failure to comply with these financial covenants could result in a default under the leases which, subject to our right
and ability to exercise our purchase option, would give BNPPLC the right to, among other things, (i) terminate our
possession of the leased property and require us to pay lease termination damages and other amounts as set forth in
the lease agreements, or (ii) exercise certain foreclosure remedies. If we were to exercise our purchase option, or be
required to pay lease termination damages, these payments would significantly reduce our available liquidity, which
could constrain our operating flexibility.

      As of April 30, 2010, we estimated that the fair value of the properties under synthetic lease was $36.9 million
less than their aggregate residual guarantees. We are accruing for this deficiency over the remaining terms of the
respective leases.

                                                          56
We may from time to time terminate one or more of our leasing arrangements and repay amounts outstanding
in order to meet our operating or other objectives.

  Legal Contingencies
      On September 5, 2007, we filed a patent infringement lawsuit in the Eastern District of Texas seeking
compensatory damages and a permanent injunction against Sun Microsystems. On October 25, 2007,
Sun Microsystems filed a counter claim against us in the Eastern District of Texas seeking compensatory damages
and a permanent injunction. On October 29, 2007, Sun filed a second lawsuit against us in the Northern District of
California asserting additional patents against us. The Texas court granted a joint motion to transfer the Texas
lawsuit to the Northern District of California on November 26, 2007. On March 26, 2008, Sun filed a third lawsuit in
federal court that extends the patent infringement charges to storage management technology we acquired in
January 2008. In January 2010, Oracle acquired Sun. The three lawsuits are currently in the discovery and motion
phase and no trial dates have been set, so we are unable at this time to determine the likely outcome of these various
patent litigations. In addition, as we are unable to reasonably estimate the amount or range of the potential
settlement, no accrual has been recorded as of April 30, 2010.
      In addition, we are subject to various legal proceedings and claims which have arisen or may arise in the
normal course of business. While the outcome of these legal matters is currently not determinable, we do not believe
that any current litigation or claims will have a material adverse effect on our business, cash flow, operating results,
or financial condition.

  Off-Balance Sheet Arrangements
      During the ordinary course of business, we provide standby letters of credit or other guarantee instruments to
third parties as required for certain transactions initiated either by us or our subsidiaries. As of April 30, 2010, our
financial guarantees of $5.1 million that were not recorded on our balance sheet consisted of standby letters of credit
related to workers’ compensation, a customs guarantee, a corporate credit card program, foreign rent guarantees and
surety bonds, which were primarily related to self-insurance.
     We use derivative instruments to manage exposures to foreign currency risk. Our primary objective in holding
derivatives is to reduce the volatility of earnings and cash flows associated with changes in foreign currency. The
program is not designated for trading or speculative purposes. Currently, we do not enter into any foreign exchange
forward contracts to hedge exposures related to firm commitments or nonmarketable investments. Our major
foreign currency exchange exposures and related hedging programs are described below:
     • We utilize monthly foreign currency forward and options contracts to hedge exchange rate fluctuations
       related to certain foreign monetary assets and liabilities.
     • We use currency forward contracts to hedge exposures related to forecasted sales denominated in certain
       foreign currencies. These contracts are designated as cash flow hedges and in general closely match the
       underlying forecasted transactions in duration.
      As of April 30, 2010, our notional fair value of foreign exchange forward and foreign currency option contracts
totaled $484.2 million. We do not believe that these derivatives present significant credit risks, because of the short
term maturity of the outstanding contracts at any point in time, the counterparties to the derivatives consist of major
financial institutions, and we manage the notional amount of contracts entered into with any one counterparty. Other
than the risk associated with the financial condition of the counterparties, our maximum exposure related to foreign
currency forward and option contracts is limited to the premiums paid. See Note 12 of the accompanying
consolidated financial statements for more information related to our hedging activities.
     In the ordinary course of business, we enter into recourse lease financing arrangements with third-party leasing
companies and from time to time provide guarantees for a portion of other financing arrangements under which we
could be called upon to make payments to the third-party funding companies in the event of nonpayment by end-
user customers. See Note 18 of the accompanying consolidated financial statements for more information related to
these financing arrangements.

                                                          57
We enter into indemnification agreements with third parties in the ordinary course of business. Generally, these
indemnification agreements require us to reimburse losses suffered by the third party due to various events, such as
lawsuits arising from patent or copyright infringement. These indemnification obligations are considered off-
balance sheet arrangements under accounting guidance.
     We have commitments related to four lease arrangements with BNPPLC for approximately 0.6 million square
feet of office space for our headquarters in Sunnyvale, California (as further described above under “Contractual
Obligations”).
      We have evaluated our accounting for these leases as required by guidance on accounting for variable interest
entities and have determined the following:
     • BNPPLC is a leasing company for BNP Paribas in the United States. BNPPLC is not a “special purpose
       entity” organized for the sole purpose of facilitating the leases to us. The obligation to absorb expected losses
       and receive expected residual returns rests with the parent, BNP Paribas. Therefore, we are not the primary
       beneficiary of BNPPLC as we do not absorb the majority of BNPPLC’s expected losses or expected residual
       returns; and
     • BNPPLC has represented in the related closing agreements that the fair value of the property leased to us by
       BNPPLC is less than half of the total of the fair values of all assets of BNPPLC, excluding any assets of
       BNPPLC held within a silo. Further, the property leased to NetApp is not held within a silo. The definition of
       “held within a silo” means that BNPPLC has obtained funds equal to or in excess of 95% of the fair value of
       the leased asset to acquire or maintain its investment in such asset through nonrecourse financing or other
       contractual arrangements, the effect of which is to leave such asset (or proceeds thereof) as the only
       significant asset of BNPPLC at risk for the repayment of such funds.
     Accordingly, under current accounting guidance, we are not required to consolidate either the leasing entity or
the specific assets that we lease under the BNPPLC lease. Our future minimum lease payments and residual
guarantees under these real estate leases will amount to a total of $136.7 million as discussed in above in
“Contractual Obligations”.

Item 7A. Quantitative and Qualitative Disclosures About Market Risk
     We are exposed to market risk related to fluctuations in interest rates, market prices, and foreign currency
exchange rates. We use certain derivative financial instruments to manage these risks. We do not use derivative
financial instruments for speculative or trading purposes. All financial instruments are used in accordance with
management-approved policies.

Market Risk and Market Interest Risk
     Investment and Interest Income — As of April 30, 2010, we had available-for-sale investments of $2.1 billion.
Our investment portfolio primarily consists of investments with original maturities at the date of purchase of greater
than three months, which are classified as available-for-sale. These investments, consisting primarily of corporate
bonds, commercial paper, U.S. government agency bonds, U.S. Treasuries, and certificates of deposit, are subject to
interest rate and interest income risk and will decrease in value if market interest rates increase. A hypothetical
10 percent increase in market interest rates from levels at April 30, 2010 would cause the fair value of these
available-for-sale investments to decline by approximately $3.6 million. Volatility in market interest rates over time
will cause variability in our interest income. We do not use derivative financial instruments in our investment
portfolio.
     Our investment policy is to limit credit exposure through diversification and investment in highly rated
securities. We further mitigate concentrations of credit risk in our investments by limiting our investments in the
debt securities of a single issuer and by diversifying risk across geographies and type of issuer. We actively review,
along with our investment advisors, current investment ratings, company specific events and general economic
conditions in managing our investments and in determining whether there is a significant decline in fair value that is
other-than-temporary. We will monitor and evaluate the accounting for our investment portfolio on a quarterly basis
for additional other-than-temporary impairment charges.

                                                          58
We are also exposed to market risk relating to our auction rate securities due to uncertainties in the credit and
capital markets. As of April 30, 2010, we recorded cumulative unrealized loss of $3.3 million, offset by $0.7 million
of unrealized gains related to these securities. The fair value of our auction rate securities may change significantly
due to events and conditions in the credit and capital markets. These securities/issuers could be subject to review for
possible downgrade. Any downgrade in these credit ratings may result in an additional decline in the estimated fair
value of our auction rate securities. Changes in the various assumptions used to value these securities and any
increase in the markets’ perceived risk associated with such investments may also result in a decline in estimated
fair value.

      If current market conditions deteriorate, or the anticipated recovery in market values does not occur, we may be
required to record additional unrealized losses in other comprehensive income (loss) or other-than-temporary
impairment charges to earnings in future quarters. We intend, and have the ability, to hold these investments until
the market recovers. We do not believe that the lack of liquidity relating to our portfolio investments will impact our
ability to fund working capital needs, capital expenditures or other operating requirements. See Note 9 of the
accompanying consolidated financial statements in Part II, Item 8; Management’s Discussion and Analysis of
Financial Condition and Results of Operations, “Liquidity and Capital Resources,” in Part II, Item 7; and Risk
Factors in Part I, Item 1A of this Annual Report on Form 10-K for a description of recent market events that may
affect the value and liquidity of the investments in our portfolio that we held at April 30, 2010.

      Lease Commitments — As of April 30, 2010, one of our four lease arrangements with BNPPLC is based on a
floating interest rate. The minimum lease payments will vary based on LIBOR plus a spread. All of our leases have
an initial term of five years, and we have the option to renew these leases for two consecutive five-year periods upon
approval by BNPPLC. A hypothetical 10 percent increase in market interest rate from the level at April 30, 2010
would increase our lease payments on this one floating lease arrangement under the initial five-year term by an
immaterial amount. We do not currently hedge against market interest rate increases.

    Convertible Notes — In June 2008, we issued $1.265 billion principal amount of 1.75% Notes due 2013, of
which $1.017 billion was allocated to debt and $0.248 billion was allocated to equity. Holders may convert the
Notes prior to maturity upon the occurrence of certain circumstances, including, but not limited to:

     • during the five business day period after any five consecutive trading day period in which the trading price of
       the Notes for each day in this five consecutive trading day period was less than 98% of an amount equal to
       (i) the last reported sale price of our common stock multiplied by (ii) the conversion rate on such day;

     • during any calendar quarter if the last reported sale price of our common stock for 20 or more trading days in
       a period of 30 consecutive trading days ending on the last trading day of the immediately preceding calendar
       quarter exceeds 130% of the applicable conversion price in effect for the Notes on the last trading day of such
       immediately preceding calendar quarter; or

     • upon the occurrence of specified corporate transactions under the indenture for the Notes.

     The Notes are convertible into the right to receive cash in an amount up to the principal amount and shares of
our common stock for the conversion value in excess of the principal amount, if any, at an initial conversion rate of
31.4006 shares of common stock per one thousand principal amount of Notes, subject to adjustment as described in
the indenture governing the Notes, which represents an initial conversion price of $31.85 per share.

      Upon conversion, a holder will receive cash in an amount equal to the lesser of the conversion value and the
principal amount of the Notes, and any shares of our common stock for any conversion value in excess of the
principal amount of the Notes. Concurrent with the issuance of the Notes, we entered into convertible note hedge
transactions and separately, warrant transactions, to reduce the potential dilution from the conversion of the Notes
and to mitigate any negative effect such conversion may have on the price of our common stock. In fiscal 2010, we
terminated the hedge transaction with a counterparty to 20% of our Note hedges, and because we have decided not
to replace the hedge, we are subject to potential dilution on the 20% unhedged portion of our Notes upon conversion
if on the date of conversion the per-share market price of our common stock exceeds the conversion price of $31.85.

                                                          59
As of April 30, 2010, none of the conditions allowing the holders of the Notes to convert had been met and we
had not issued any shares related to the Notes. Based on the closing price of our common stock of $34.67 on
April 30, 2010, the if-converted value of our Notes exceeded their principal amount by approximately $112 million.
     The fair value of our Notes is subject to interest rate risk, market risk and other factors due to the convertible
feature. Generally, the fair value of Notes will increase as interest rates fall and/or our common stock price
increases, and decrease as interest rates rise and/or our common stock price decreases. The interest and market value
changes affect the fair value of our Notes, but do not impact our financial position, cash flows, or results of
operations due to the fixed nature of the debt obligations. We do not carry the Notes at fair value, but present the fair
value of the principal amount of our Notes for disclosure purposes. As of April 30, 2010, the principal amount of our
Notes, which consists of the combined debt and equity components, was $1.265 billion, and the total estimated fair
value of such was $1.5 billion based on the closing trading price of $120 per $100 of our Notes as of that date.

Foreign Currency Exchange Rate Risk and Foreign Exchange Forward Contracts
      We hedge risks associated with foreign currency transactions to minimize the impact of changes in foreign
currency exchange rates on earnings. We utilize forward and option contracts to hedge against the short-term impact
of foreign currency fluctuations on certain assets and liabilities denominated in foreign currencies. All balance sheet
hedges are marked to market through earnings every period. We also use foreign exchange forward contracts to
hedge foreign currency forecasted transactions related to forecasted sales transactions. These derivatives are
designated as cash flow hedges under accounting guidance for derivatives and hedging. For cash flow hedges
outstanding at April 30, 2010, the time-value component is recorded in earnings while all other gains or losses were
included in other comprehensive income.
     We do not enter into foreign exchange contracts for speculative or trading purposes. In entering into forward
and option foreign exchange contracts, we have assumed the risk that might arise from the possible inability of
counterparties to meet the terms of their contracts. We attempt to limit our exposure to credit risk by executing
foreign exchange contracts with creditworthy multinational commercial banks. All contracts have a maturity of less
than one year.
    The following table provides information about our currency forward contracts outstanding on April 30, 2010
and April 24, 2009 (in millions):
                                                                       April 30, 2010                     April 24, 2009
                                                                          Notional                           Notional
                                                               Local      Contract       Fair     Local      Contract       Fair
                                                              Currency    Amount        Value    Currency    Amount        Value
Currency                                                      Amount       (USD)        (USD)    Amount       (USD)        (USD)

Euro . . . . . . . . . . . . . . . . . . . . .   ..........    235.9       $313.5       $313.6    126.2       $166.9       $166.9
British Pound Sterling . . . . . . . .           ..........     49.7         76.0         75.9     46.6         68.2         68.3
Canadian Dollar . . . . . . . . . . . .          ..........     28.6         28.1         28.1     24.7         20.5         20.5
Australian Dollar . . . . . . . . . . .          ..........     25.0         23.2         23.0     34.7         24.9         24.9
Other . . . . . . . . . . . . . . . . . . . .    ..........     N/A          43.6         43.6     N/A          33.5         33.5


                                                                    60
Item 8. Financial Statements and Supplementary Data


              REPORT OF INDEPENDENT REGISTERED PUBLIC ACCOUNTING FIRM

To the Board of Directors and Stockholders of
NetApp, Inc.
Sunnyvale, California
      We have audited the accompanying consolidated balance sheets of NetApp, Inc. and subsidiaries (collectively,
the “Company”) as of April 30, 2010 and April 24, 2009, and the related consolidated statements of operations, cash
flows, and stockholders’ equity and comprehensive income for each of the three years in the period ended April 30,
2010. Our audits also included the financial statement schedule listed in Item 15. These consolidated financial
statements and financial statement schedule are the responsibility of the Company’s management. Our respon-
sibility is to express an opinion on the consolidated financial statements and financial statement schedule based on
our audits.
     We conducted our audits in accordance with the standards of the Public Company Accounting Oversight Board
(United States). Those standards require that we plan and perform the audit to obtain reasonable assurance about
whether the financial statements are free of material misstatement. An audit includes examining, on a test basis,
evidence supporting the amounts and disclosures in the financial statements. An audit also includes assessing the
accounting principles used and significant estimates made by management, as well as evaluating the overall
financial statement presentation. We believe that our audits provide a reasonable basis for our opinion.
      In our opinion, such consolidated financial statements present fairly, in all material respects, the financial
position of the Company as of April 30, 2010 and April 24, 2009, and the results of its operations and its cash flows
for each of the three years in the period ended April 30, 2010, in conformity with accounting principles generally
accepted in the United States of America. Also, in our opinion, such financial statement schedule, when considered
in relation to the basic consolidated financial statements taken as a whole, presents fairly, in all material respects, the
information set forth therein.
     We have also audited, in accordance with the standards of the Public Company Accounting Oversight Board
(United States), the Company’s internal control over financial reporting as of April 30, 2010, based on the criteria
established in Internal Control — Integrated Framework issued by the Committee of Sponsoring Organizations of
the Treadway Commission and our report dated June 18, 2010 expressed an unqualified opinion on the Company’s
internal control over financial reporting.


/s/   DELOITTE & TOUCHE LLP

San Jose, California
June 18, 2010


                                                            61
NETAPP, INC.
                                                CONSOLIDATED BALANCE SHEETS

                                                                                                                             April 30,       April 24,
                                                                                                                              2010             2009
                                                                                                                               (In millions, except
                                                                                                                                    par value)
                                                                     ASSETS
Current Assets:
  Cash and cash equivalents . . . . . . . . . . . . . . . . . . . . . . . . . . . . . . . . . . . . . . . . . . .            $ 1,705.0     $ 1,494.2
  Short-term investments . . . . . . . . . . . . . . . . . . . . . . . . . . . . . . . . . . . . . . . . . . . . .             2,019.0       1,110.1
  Accounts receivable, net of allowances of $1.6 million and $3.1 million at
    April 30, 2010 and April 24, 2009, respectively . . . . . . . . . . . . . . . . . . . . . . . . .                            471.5         446.5
  Inventories . . . . . . . . . . . . . . . . . . . . . . . . . . . . . . . . . . . . . . . . . . . . . . . . . . . . . .        112.9          61.1
  Other current assets . . . . . . . . . . . . . . . . . . . . . . . . . . . . . . . . . . . . . . . . . . . . . . . .           228.7         326.9
    Total current assets . . . . . . . . . . . . . . . . . . . . . . . . . . . . . . . . . . . . . . . . . . . . . .           4,537.1       3,438.8
Property and Equipment, Net . . . . . . . . . . . . . . . . . . . . . . . . . . . . . . . . . . . . . . . . .                    804.4         807.9
Goodwill . . . . . . . . . . . . . . . . . . . . . . . . . . . . . . . . . . . . . . . . . . . . . . . . . . . . . . . . .       681.0         681.0
Other Intangible Assets, Net . . . . . . . . . . . . . . . . . . . . . . . . . . . . . . . . . . . . . . . . . .                  25.1          45.7
Long-Term Investments and Restricted Cash . . . . . . . . . . . . . . . . . . . . . . . . . . . . .                               72.8         127.3
Other Non-Current Assets. . . . . . . . . . . . . . . . . . . . . . . . . . . . . . . . . . . . . . . . . . . .                  374.0         283.7
                                                                                                                             $ 6,494.4     $ 5,384.4

                                LIABILITIES AND STOCKHOLDERS’ EQUITY
Current Liabilities:
   Accounts payable . . . . . . . . . . . . . . . . . . . . . . . . . . . . . . . . . . . . . . . . . . . . . . . . .        $     184.6   $     137.8
   Accrued compensation and related benefits. . . . . . . . . . . . . . . . . . . . . . . . . . . . . . .                          379.1         204.2
   Other current liabilities . . . . . . . . . . . . . . . . . . . . . . . . . . . . . . . . . . . . . . . . . . . . .             212.2         323.7
   Short-term deferred revenue . . . . . . . . . . . . . . . . . . . . . . . . . . . . . . . . . . . . . . . . . .               1,135.1       1,013.6
     Total current liabilities . . . . . . . . . . . . . . . . . . . . . . . . . . . . . . . . . . . . . . . . . . . .           1,911.0       1,679.3
1.75% Convertible Senior Notes Due 2013 . . . . . . . . . . . . . . . . . . . . . . . . . . . . . . .                            1,101.5       1,054.7
Other Long-Term Liabilities . . . . . . . . . . . . . . . . . . . . . . . . . . . . . . . . . . . . . . . . . .                    171.9         164.6
Long-Term Deferred Revenue . . . . . . . . . . . . . . . . . . . . . . . . . . . . . . . . . . . . . . . . .                       779.5         701.6
                                                                                                                                 3,963.9       3,600.2
Commitments and Contingencies (Note 18)
Stockholders’ Equity:
  Preferred stock, $0.001 par value, 5.0 shares authorized; no shares issued or
    outstanding in 2010 and 2009. . . . . . . . . . . . . . . . . . . . . . . . . . . . . . . . . . . . . . .                        —              —
  Common stock, $0.001 par value, 885.0 shares authorized; 451.6 and 436.6 shares
    issued at April 30, 2010 and April 24, 2009 . . . . . . . . . . . . . . . . . . . . . . . . . . . .                            0.5           0.4
  Additional paid-in capital. . . . . . . . . . . . . . . . . . . . . . . . . . . . . . . . . . . . . . . . . . . .            3,453.7       3,115.9
  Treasury stock at cost (104.3 shares at April 30, 2010 and April 24, 2009) . . . . . . .                                    (2,927.4)     (2,927.4)
  Retained earnings . . . . . . . . . . . . . . . . . . . . . . . . . . . . . . . . . . . . . . . . . . . . . . . . .          2,000.9       1,600.5
  Accumulated other comprehensive income (loss) . . . . . . . . . . . . . . . . . . . . . . . . . .                                2.8          (5.2)
    Total stockholders’ equity . . . . . . . . . . . . . . . . . . . . . . . . . . . . . . . . . . . . . . . . .               2,530.5       1,784.2
                                                                                                                             $ 6,494.4     $ 5,384.4


                                             See notes to consolidated financial statements.

                                                                            62
NETAPP, INC.
                                      CONSOLIDATED STATEMENTS OF OPERATIONS

                                                                                                                               Year Ended
                                                                                                                 April 30,      April 24,      April 25,
                                                                                                                   2010           2009          2008
                                                                                                                (In millions, except per share amounts)
Revenues:
  Product . . . . . . . . . . . . . . . . . . . . . . . . . . . . . . . . . . .    . . . . . . . . . . . . . . $2,381.1       $2,152.7       $2,242.5
  Software entitlements and maintenance. . . . . . . . . . . .                     ..............                 679.8          618.3          486.9
  Service . . . . . . . . . . . . . . . . . . . . . . . . . . . . . . . . . . .    ..............                 870.5          764.1          573.8
  GSA settlement . . . . . . . . . . . . . . . . . . . . . . . . . . . . .         ..............                    —          (128.7)           —
    Net revenues . . . . . . . . . . . . . . . . . . . . . . . . . . . . .         . . . . . . . . . . . . . . 3,931.4         3,406.4        3,303.2
Cost of Revenues:
  Cost of product . . . . . . . . . . . . . . . . . . . . . . . . . . . . . . . . . . . . . . . . . . .            976.4        1,007.6           938.4
  Cost of software entitlements and maintenance . . . . . . . . . . . . . . . . . . . .                             12.3            9.2             8.6
  Cost of service . . . . . . . . . . . . . . . . . . . . . . . . . . . . . . . . . . . . . . . . . . .            423.5          399.7           342.8
     Total cost of revenues. . . . . . . . . . . . . . . . . . . . . . . . . . . . . . . . . . . . .             1,412.2        1,416.5          1,289.8
   Gross profit . . . . . . . . . . . . . . . . . . . . . . . . . . . . . . . . . . . . . . . . . . . . . .      2,519.2        1,989.9          2,013.4
Operating Expenses:
 Sales and marketing . . . . . . . . . . . . . . . . . . . . . . . . . .           ..............                1,293.7        1,186.1          1,075.7
 Research and development . . . . . . . . . . . . . . . . . . . . .                ..............                  535.7          498.5            452.2
 General and administrative . . . . . . . . . . . . . . . . . . . . .              ..............                  238.8          203.7            171.5
 Restructuring and other charges . . . . . . . . . . . . . . . . .                 ..............                    2.5           54.4              0.4
 Acquisition related income, net . . . . . . . . . . . . . . . . .                 ..............                  (39.9)            —               —
     Total operating expenses. . . . . . . . . . . . . . . . . . . . .             ..............                2,030.8        1,942.7          1,699.8
Income from Operations . . . . . . . . . . . . . . . . . . . . . . .               ..............                  488.4           47.2            313.6
Other Income (Expenses), Net:
  Interest income . . . . . . . . . . . . . . . . . . . . . . . . . . . . .        ..............                    31.2          57.6            64.6
  Interest expense . . . . . . . . . . . . . . . . . . . . . . . . . . . . .       ..............                   (74.1)        (63.4)           (8.0)
  Other income (expenses), net . . . . . . . . . . . . . . . . . . .               ..............                     1.5         (33.1)           12.5
    Total other income (expenses), net . . . . . . . . . . . . . . . . . . . . . . . . . . .                       (41.4)         (38.9)           69.1
Income before Income Taxes . . . . . . . . . . . . . . . . . . . . . . . . . . . . . . . . . .                     447.0            8.3           382.7
Provision for (Benefit from) Income Taxes . . . . . . . . . . . . . . . . . . . . . . .                             46.6          (56.3)           73.0
Net Income . . . . . . . . . . . . . . . . . . . . . . . . . . . . . . . . . . . . . . . . . . . . . . . $ 400.4              $    64.6      $ 309.7
Net Income Per Share:
  Basic . . . . . . . . . . . . . . . . . . . . . . . . . . . . . . . . . . . . . . . . . . . . . . . . . . . $      1.18     $    0.20      $     0.88
   Diluted . . . . . . . . . . . . . . . . . . . . . . . . . . . . . . . . . . . . . . . . . . . . . . . . . $       1.13     $    0.19      $     0.86
Shares Used in Net Income per Share Calculations:
  Basic . . . . . . . . . . . . . . . . . . . . . . . . . . . . . . . . . . . . . . . . . . . . . . . . . . .      339.6          330.3           351.7
   Diluted . . . . . . . . . . . . . . . . . . . . . . . . . . . . . . . . . . . . . . . . . . . . . . . . .       353.2          334.6           361.1


                                              See notes to consolidated financial statements.

                                                                              63
NETAPP, INC.
                                       CONSOLIDATED STATEMENTS OF CASH FLOWS

                                                                                                                                                                     Year Ended
                                                                                                                                                         April 30,     April 24,      April 25,
                                                                                                                                                          2010           2009          2008
                                                                                                                                                                     (In millions)
Cash Flows from Operating Activities:
  Net income . . . . . . . . . . . . . . . . . . . . . . . . . . . . . . . . . . . . . . . . . .                             ....... $                      400.4     $      64.6     $     309.7
  Adjustments to reconcile net income to net cash provided by operating
    activities:
    Depreciation and amortization . . . . . . . . . . . . . . . . . . . . . . . . . . .                                      .   .   .   .   .   .   .      166.0           170.5           148.1
    Stock-based compensation . . . . . . . . . . . . . . . . . . . . . . . . . . . . . .                                     .   .   .   .   .   .   .      159.8           140.8           148.0
    Accretion of discount and issuance costs on notes . . . . . . . . . . . . .                                              .   .   .   .   .   .   .       50.8            41.0              —
    Deferred income taxes . . . . . . . . . . . . . . . . . . . . . . . . . . . . . . . .                                    .   .   .   .   .   .   .      (11.3)         (124.6)          (53.0)
    Tax benefit (charges) from stock-based compensation . . . . . . . . . . .                                                .   .   .   .   .   .   .       (0.9)           45.4            48.2
    Excess tax benefit from stock-based compensation . . . . . . . . . . . . .                                               .   .   .   .   .   .   .       (8.6)          (36.7)          (45.4)
    Other non-cash items, net . . . . . . . . . . . . . . . . . . . . . . . . . . . . . .                                    .   .   .   .   .   .   .        9.7            57.8           (10.0)
Changes in assets and liabilities:
    Accounts receivable . . . . . . . . . . . . . . . . . . . . . . . . . . . . . . . . . .                                  .   .   .   .   .   .   .      (21.3)          128.7           (27.7)
    Inventories . . . . . . . . . . . . . . . . . . . . . . . . . . . . . . . . . . . . . . . . .                            .   .   .   .   .   .   .      (52.1)            9.1           (15.4)
    Other operating assets . . . . . . . . . . . . . . . . . . . . . . . . . . . . . . . . .                                 .   .   .   .   .   .   .      (36.8)           (0.8)           (7.6)
    Accounts payable . . . . . . . . . . . . . . . . . . . . . . . . . . . . . . . . . . . .                                 .   .   .   .   .   .   .       42.7           (27.0)           20.0
    Accrued compensation and other current liabilities . . . . . . . . . . . . .                                             .   .   .   .   .   .   .       53.2           190.5           (24.5)
    Deferred revenue . . . . . . . . . . . . . . . . . . . . . . . . . . . . . . . . . . . .                                 .   .   .   .   .   .   .      176.7           219.3           401.0
    Other operating liabilities . . . . . . . . . . . . . . . . . . . . . . . . . . . . . .                                  .   .   .   .   .   .   .       46.7            10.6           117.5
         Net cash provided by operating activities . . . . . . . . . . . . . . . . . . . . . . . . .                                                        975.0           889.2         1,008.9
Cash Flows from Investing Activities:
    Purchases of investments . . . . . . . . . . . . . . . . . .         .................                                                   .   .   .   (2,632.6)        (1,152.5)       (1,053.5)
    Redemptions of investments . . . . . . . . . . . . . . . .           .................                                                   .   .   .    1,772.3          1,035.7         1,429.9
    Reclassification from cash and cash equivalents to                   short-term investments .                                            .   .   .        —             (598.0)             —
    Purchases of property and equipment . . . . . . . . .                .................                                                   .   .   .     (135.6)          (289.6)         (188.3)
    Acquisition of businesses, net of cash acquired . .                  .................                                                   .   .   .        —                 —            (99.4)
    Other investing activities, net . . . . . . . . . . . . . . .        .................                                                   .   .   .        8.2              1.1            14.2
         Net cash provided by (used in) investing activities . . . . . . . . . . . . . . . . . .                                                           (987.7)        (1,003.3)         102.9
Cash Flows from Financing Activities:
    Issuance of common stock . . . . . . . . . . . . . . . . .           .   .   .   .   .   .   .   .   .   .   .   .   .   .   .   .   .   .   .   .      197.1            85.9           108.7
    Repurchases of common stock . . . . . . . . . . . . . .              .   .   .   .   .   .   .   .   .   .   .   .   .   .   .   .   .   .   .   .        —            (400.0)         (903.7)
    Excess tax benefit from stock-based compensation                     .   .   .   .   .   .   .   .   .   .   .   .   .   .   .   .   .   .   .   .        8.6            36.7            45.4
    Issuance of long-term debt. . . . . . . . . . . . . . . . .          .   .   .   .   .   .   .   .   .   .   .   .   .   .   .   .   .   .   .   .        —           1,238.4           318.7
    Sale of common stock warrants . . . . . . . . . . . . .              .   .   .   .   .   .   .   .   .   .   .   .   .   .   .   .   .   .   .   .        —             163.1             —
    Settlement (purchase) of note hedge . . . . . . . . . .              .   .   .   .   .   .   .   .   .   .   .   .   .   .   .   .   .   .   .   .       14.2          (254.9)            —
    Repayment of long-term debt . . . . . . . . . . . . . . .            .   .   .   .   .   .   .   .   .   .   .   .   .   .   .   .   .   .   .   .        —            (172.6)         (231.5)
         Net cash provided (used in) by financing activities . . . . . . . . . . . . . . . . . .                                                            219.9           696.6          (662.4)
Effect of Exchange Rate Changes on Cash and Cash Equivalents. . . . . . . . . . .                                                                             3.6           (24.8)           (2.0)
Net Increase in Cash and Cash Equivalents . . . . . . . . . . . . . . . . . . . . . . . . . .                                                               210.8           557.7           447.4
Cash and Cash Equivalents:
  Beginning of year . . . . . . . . . . . . . . . . . . . . . . . . . . . . . . . . . . . . . . . . . . . .                                               1,494.2           936.5           489.1
   End of year . . . . . . . . . . . . . . . . . . . . . . . . . . . . . . . . . . . . . . . . . . . . . . . . . $ 1,705.0                                            $ 1,494.2       $     936.5


                                               See notes to consolidated financial statements.

                                                                                     64
NETAPP, INC.
                           CONSOLIDATED STATEMENTS OF STOCKHOLDERS’ EQUITY
                                      AND COMPREHENSIVE INCOME
                                                                     Common Stock            Treasury Stock                   Accumulated
                                                                             Additional                                          Other
                                                                              Paid-in               Treasury        Retained Comprehensive
                                                                Shares Amount Capital   Shares      Amount          Earnings Income (Loss)     Total
                                                                                                    (In millions)
Balances, April 27, 2007 . . . . . . . . . . . . .          . 421.6 $0.4 $2,380.6 (54.6) $(1,623.7) $1,226.2                     $ 5.5       $1,989.0
Components of comprehensive income:
   Net income . . . . . . . . . . . . . . . . . . . . .     .      —      —           —    —              —           309.7        —            309.7
   Currency translation adjustment . . . . . . .            .      —      —           —    —              —              —         1.1            1.1
   Unrealized gain on investments, net . . . .              .      —      —           —    —              —              —        (7.7)          (7.7)
   Unrealized gain on derivatives . . . . . . . .           .      —      —           —    —              —              —         1.9            1.9
      Total comprehensive income . . . . . . .              .      —      —           —    —              —              —         —            305.0
Issuance of common stock, net of taxes . . .                .     7.5     —         108.7  —              —              —         —            108.7
Repurchase of common stock . . . . . . . . . .              .      —      —           — (32.8)         (903.7)           —         —           (903.7)
Stock-based compensation expense . . . . . .                .      —      —         147.9  —              —              —         —            147.9
Stock-based compensation related to
   acquisition. . . . . . . . . . . . . . . . . . . . . .   .      —      —           5.2     —               —          —         —              5.2
Income tax benefit from employee stock
   transactions . . . . . . . . . . . . . . . . . . . . .   .    —       —         48.2    —              —              —         —             48.2
Balances, April 25, 2008 . . . . . . . . . . . . .          . 429.1      0.4    2,690.6 (87.4)       (2,527.4)      1,535.9        0.8        1,700.3
Components of comprehensive income:
   Net income . . . . . . . . . . . . . . . . . . . . .     .      —      —            —    —             —            64.6        —             64.6
   Currency translation adjustment . . . . . . .            .      —      —            —    —             —             —         (4.8)          (4.8)
   Unrealized gain on investments, net . . . .              .      —      —            —                  —             —         (2.0)          (2.0)
   Unrealized gain on derivatives . . . . . . . .           .      —      —            —    —             —             —          0.8            0.8
      Total comprehensive income . . . . . . .              .      —      —            —    —             —             —          —             58.6
Issuance of common stock, net of taxes . . .                .     7.5     —           85.9  —             —             —          —             85.9
Repurchase of common stock . . . . . . . . . .              .      —      —            — (16.9)        (400.0)          —          —           (400.0)
Purchase of note hedges . . . . . . . . . . . . . .         .      —      —         (254.9) —             —             —          —           (254.9)
Sale of common stock warrants . . . . . . . . .             .      —      —          163.1  —             —             —          —            163.1
Convertible debt discount . . . . . . . . . . . . .         .      —      —          248.0  —             —             —          —            248.0
Issuance costs related to equity component
   of convertible notes . . . . . . . . . . . . . . .       .      —      —          (5.2)    —               —          —         —             (5.2)
Net tax effect of issuance costs related to
   convertible notes . . . . . . . . . . . . . . . . .      .      —      —           2.2     —               —          —         —              2.2
Stock-based compensation expense . . . . . .                .      —      —         140.8     —               —          —         —            140.8
Income tax benefit from employee stock
   transactions . . . . . . . . . . . . . . . . . . . . .   .    —       —         45.4     —             —              —         —             45.4
Balances, April 24, 2009 . . . . . . . . . . . . .          . 436.6      0.4    3,115.9 (104.3)      (2,927.4)      1,600.5       (5.2)       1,784.2
Components of comprehensive income:
   Net income . . . . . . . . . . . . . . . . . . . . .     .   —        —            —       —               —       400.4        —            400.4
   Currency translation adjustment . . . . . . .            .   —        —            —       —               —          —         1.5            1.5
   Unrealized gain on investments, net . . . .              .   —        —            —       —               —          —         5.3            5.3
   Unrealized gain on derivatives . . . . . . . .           .   —        —            —       —               —          —         1.2            1.2
      Total comprehensive income . . . . . . .              .   —        —            —                                  —         —            408.4
Issuance of common stock, net of taxes . . .                . 15.0       0.1        197.0     —               —          —         —            197.1
Stock-based compensation expense . . . . . .                .   —        —          159.6     —               —          —         —            159.6
Income tax charge from employee stock
   transactions . . . . . . . . . . . . . . . . . . . . .   .    —   —       (0.9)    —          —         —                       —             (0.9)
Settlement of note hedge . . . . . . . . . . . . .          .    —   —       14.2     —          —         —                       —             14.2
Taxes on settlement of note hedge . . . . . . .             .        —      (32.1)    —          —         —                       —            (32.1)
Balances, April 30, 2010 . . . . . . . . . . . . .          . 451.6 $0.5 $3,453.7 (104.3) $(2,927.4) $2,000.9                    $ 2.8       $2,530.5


                                              See notes to consolidated financial statements.

                                                                               65
NETAPP, INC.
                         NOTES TO CONSOLIDATED FINANCIAL STATEMENTS

1.   The Company
     Based in Sunnyvale, California, NetApp, Inc. (“we” or “the Company”) was incorporated in California in
April 1992 and reincorporated in Delaware in November 2001; in March 2008, the Company changed its name from
Network Appliance, Inc. to NetApp, Inc. The Company is a supplier of enterprise storage and data management
software and hardware products and services. Our solutions help global enterprises meet major information
technology challenges such as managing storage growth, assuring secure and timely information access, protecting
data and controlling costs by providing innovative solutions that simplify the complexity associated with managing
corporate data.

2.   Significant Accounting Policies
    Fiscal Year — We operate on a 52-week or 53-week year ending on the last Friday in April. Fiscal 2010 was a
53-week fiscal year and fiscal 2009 and 2008 were 52-week fiscal years.
     Basis of Presentation — The consolidated financial statements include the Company and its wholly-owned
subsidiaries. Intercompany accounts and transactions are eliminated in consolidation.
     Financial Statements Presentation — Certain prior period amounts have been combined in the accompanying
financial statements to conform to current year presentation.
      Retrospective Application of Accounting Standard to Previously Issued Financial Statements — In May 2008,
the Financial Accounting Standards Board (FASB) issued updated guidance which required that the liability and
equity components of convertible debt instruments that may be settled in cash upon conversion (including partial
cash settlement) be separately accounted for in a manner that reflects an issuer’s non-convertible debt borrowing
rate. The guidance applied to the $1.265 billion aggregate principal amount of 1.75% Convertible Senior Notes (the
Notes) and was adopted by us on a retrospective basis as of April 24, 2009 and for the fiscal year then ended.
      Use of Estimates — The preparation of the consolidated financial statements in conformity with accounting
principles generally accepted in the United States of America (GAAP) requires management to make estimates and
assumptions that affect the reported amounts of assets and liabilities and disclosure of contingent assets and
liabilities at the date of the financial statements and the reported amounts of revenues and expenses during the
reporting period. Such estimates include, but are not limited to, revenue recognition, reserve and allowances;
inventory valuation and purchase order accruals; valuation of goodwill and intangibles; restructuring reserves;
product warranties; self-insurance; stock-based compensation; loss contingencies; investment impairments;
income taxes, and fair value measurements. Actual results could differ from those estimates.
      Financial Instruments — For certain financial instruments, including cash and cash equivalents, short-term
investments, accounts receivable, accounts payable and other current liabilities, the carrying amounts approximate
their fair value due to the relatively short maturity of these balances. The following methods were used to estimate
the fair value of each class of financial instruments for which it is practicable to estimate that value:
     Cash and Cash Equivalents — We consider all highly liquid debt investments with original maturities of three
months or less at time of purchase to be cash equivalents. Cash equivalents consist primarily of money market funds,
for which the carrying amounts are reasonable estimates of fair value. Cash equivalents are recognized at fair value.
     Short-Term Investments. Short-term investments consist of marketable debt or equity securities which are
classified as available-for-sale and are recognized at fair value. The determination of fair value is further detailed in
Note 9 of the accompanying consolidated financial statements. We regularly review our investment portfolio to
identify and evaluate investments that have indications of possible impairment. Factors considered in determining
whether a loss is other-than-temporary include: the length of time and extent to which the fair market value has been
lower than the cost basis, the financial condition and near-term prospects of the investee, credit quality, likelihood of
recovery, and our intent and ability to hold the investment for a period of time sufficient to allow for any anticipated

                                                           66
NETAPP, INC.
                NOTES TO CONSOLIDATED FINANCIAL STATEMENTS — (Continued)

recovery in fair market value. We classify our investments as current or noncurrent based on the nature of the
investments and their availability for use in current operations.
     Unrealized gains and temporary losses, net of related taxes, are included with accumulated other compre-
hensive income (loss) (AOCI). Upon realization, those amounts are reclassified from AOCI to results of operations.
The amortization of premiums and discounts on the investments and realized gains and losses related to investments
are included in results of operations. Other-than-temporary impairments on available-for-sale debt securities are
determined to be either credit losses or losses due to other factors. Credit losses are recognized in our results of
operations and other losses are included in AOCI.
    Investments in Privately-held Companies — We have certain investments in privately-held companies, which
we account for under the cost method, subject to periodic reviews for impairment.
     Fair Value Measurements and Impairments — All of our available-for-sale investments and nonmarketable
equity securities are subject to a periodic impairment review. Investments are considered to be impaired when a
decline in fair value is judged to be other-than-temporary. This determination requires significant judgment.
      For publicly traded investments, impairment is determined based upon the specific facts and circumstances
present at the time, including factors such as current economic and market conditions, the credit rating of the
security’s issuer, the length of time an investment’s fair value has been below our carrying value, the extent to which
fair value was below cost, and our ability and intent to hold investments for a period of time sufficient to allow for
anticipated recovery in value. If an investment’s decline in fair value, caused by factors other than changes in
interest rates, is deemed to be other-than-temporary, we reduce its carrying value to its estimated fair value, as
determined based on quoted market prices or liquidation values. Declines in value judged to be other-than-tempo-
rary, if any, are recorded in operations as incurred.
     For long-term investments, such as auction rate securities, impairment is determined based on fair value and
marketability of these investments. The valuation models we used to estimate fair value included numerous
assumptions such as assessments of the underlying structure of each security, expected cash flows, discount rates,
credit ratings, workout periods, and overall capital market liquidity.
      For nonmarketable investments, impairment is based on the most recent information available to us, including
new financings or estimates of current fair value, as well as through traditional valuation techniques. It is our policy
to review the fair value of these investments on a regular basis to determine whether the investments in these
companies are other-than-temporarily impaired. In the case of privately-held companies, this evaluation is based on
information that we request from these companies. If we believe the carrying value of an investment is in excess of
fair value, and this difference is other-than-temporary, it is our policy to write down the investment to fair value.
      Inventories — Inventories are stated at the lower of cost or market, which approximates actual cost on a
first-in, first out basis. We write down for excess and obsolete inventory based on the difference between the cost of
inventory and the estimated fair value based upon assumptions about future demand and market conditions. In
addition, we record a liability for firm, noncancelable, and unconditional purchase commitments with contract
manufacturers and suppliers for quantities in excess of our future demand forecasts consistent with our valuation of
excess and obsolete inventory.


                                                          67
NETAPP, INC.
                   NOTES TO CONSOLIDATED FINANCIAL STATEMENTS — (Continued)

    Property and Equipment — Property and equipment are recorded at cost. Depreciation and amortization is
computed using the straight-line method, generally over the following periods:
                                                                                               Depreciation Life (years)

     Buildings . . . . . . . . . . . . . . . . . . . . . . . . . . . . . . . . .                      40 years
     Building improvements . . . . . . . . . . . . . . . . . . . . . . .                              10 years
     Furniture and fixtures . . . . . . . . . . . . . . . . . . . . . . . .                           5 years
     Computer, production, engineering, and other
       equipment and purchased software . . . . . . . . . . . .                                    3 to 5 years
     Leasehold improvements. . . . . . . . . . . . . . . . . . . . . .             Shorter of remaining lease term or useful life
     Construction in progress will be amortized over the estimated useful lives of the respective assets when they
are ready for their intended use.
     Software Development Costs — The costs for the development of new software products and substantial
enhancements to existing software products are expensed as incurred until technological feasibility has been
established, at which time any additional costs would be capitalized in accordance with the accounting guidance for
software. Because our current process for developing software is essentially completed concurrently with the
establishment of technological feasibility, which occurs upon the completion of a working model, no costs have
been capitalized for any of the periods presented.
     Sales and Value Added Taxes — Taxes collected from customers and remitted to governmental authorities are
presented on a net basis in the accompanying consolidated statements of operations.
     Goodwill and Purchased Intangible Assets — Goodwill is recorded when the consideration paid for an
acquisition exceeds the fair value of net tangible and intangible assets acquired. Acquisition-related intangible
assets are amortized on a straight-line basis over their economic lives of five years for patents, four to five years for
existing technology, two to eight years for customer relationships and two to seven years for trademarks and
tradenames as we believe this method would most closely reflect the pattern in which the economic benefits of the
assets will be consumed.
      Goodwill is measured and tested for impairment on an annual basis in the fourth quarter of our fiscal year or
more frequently if we believe indicators of impairment exist. Triggering events for impairment reviews may be
indicators such as adverse industry or economic trends, restructuring actions, lower projections of profitability, or a
sustained decline in our market capitalization. The performance of the test involves a two-step process. The first
step requires comparing the fair value of the each of our reporting units to its net book value, including goodwill. We
have three reporting units, the fair value of which is determined based on an allocation of our entity level market
capitalization, as determined through quoted market prices. A potential impairment exists if the fair value of the
reporting unit is lower than its net book value. The second step of the process is only performed if a potential
impairment exists, and it involves determining the difference between the fair value of the reporting unit’s net assets
other than goodwill to the fair value of the reporting unit and if the difference is less than the net book value of
goodwill, an impairment exists and is recorded. We have not been required to perform this second step of the
process because the fair value of our reporting units has exceeded the net book value at every measurement date.
     Impairment of Long-Lived Assets — We review the carrying values of long-lived assets whenever events and
circumstances, such as reductions in demand, lower projections of profitability, significant changes in the manner of
our use of acquired assets, or significant negative industry or economic trends, indicate that the net book value of an
asset may not be recovered through expected future cash flows from its use and eventual disposition. If this review
indicates that there is an impairment, the impaired asset is written down to its fair value, which is typically
calculated using: (i) quoted market prices and/or (ii) discounted expected future cash flows utilizing a discount rate.
Our estimates regarding future anticipated net revenue and cash flows, the remaining economic life of the products
and technologies, or both, may differ from those used to assess the recoverability of assets. In that event, impairment

                                                                          68
NETAPP, INC.
                NOTES TO CONSOLIDATED FINANCIAL STATEMENTS — (Continued)

charges or shortened useful lives of certain long-lived assets may be required, resulting in a reduction in net income
or an increase to net loss in the period when such determinations are made.
      Derivative Instruments — Derivatives that are not designated as hedges are adjusted to fair value through
earnings. If the derivative is designated as a hedge, depending on the nature of the exposure being hedged, changes
in fair value will either be offset against the change in fair value of the hedged items through earnings or recognized
in AOCI until the hedged item is recognized in earnings. The ineffective portion of the hedge is recognized in
earnings immediately.
     As a result of our significant international operations, we are subject to risks associated with fluctuating
exchange rates. We use derivative financial instruments, principally currency forward contracts and currency
options, to attempt to minimize the impact of exchange rate movements on our balance sheet and operating results.
Factors that could have an impact on the effectiveness of our hedging program include the accuracy of forecasts and
the volatility of foreign currency markets. These programs reduce, but do not always entirely eliminate, the impact
of currency exchange movements. The maturities of these instruments are generally less than one year.
     Currently, we do not enter into any foreign exchange forward contracts to hedge exposures related to firm
commitments or nonmarketable investments. Cash flows from our derivative programs are included under operating
activities in the consolidated statement of cash flows with the exception of cash flows from the derivatives used to
hedge the convertible notes issued June 10, 2008. The cash flows related to the Note hedges are included under
financing activities.
     Residual Guarantees — We record liabilities in other accrued liabilities for the fair value of residual
guarantees relating to certain properties under our synthetic leases. In the event that the fair values of the
properties, as determined by appraisals, are below the residual guarantees, we accrue for the deficiencies over the
remaining term of the respective leases.
     Revenue Recognition — We apply the provisions of the accounting guidance for software revenue recognition
to our product sales, both hardware and software, because our software is essential to the performance of our
hardware. We recognize revenue when:
     • Persuasive evidence of an arrangement exists: It is our customary practice to have a purchase order and/or
       contract prior to recognizing revenue on an arrangement from our end users, customers, value-added
       resellers, or distributors.
     • Delivery has occurred: Our product is physically delivered to our customers, generally with standard
       transfer terms such as FOB origin. We typically do not allow for restocking rights with any of our value-
       added resellers or distributors. Products shipped with acceptance criteria or return rights are not recognized
       as revenue until all criteria are achieved. If undelivered products or services exist that are essential to the
       functionality of the delivered product in an arrangement, delivery is not considered to have occurred.
     • The fee is fixed or determinable: Arrangements with payment terms extending beyond our standard terms,
       conditions and practices are not considered to be fixed or determinable. Revenue from such arrangements is
       recognized at the earlier of customer payment or when the fees become due and payable. We typically do not
       allow for price-protection rights with any of our value-added resellers or distributors.
     • Collection is probable: If there is considerable doubt surrounding the credit worthiness of a customer at
       the outset of an arrangement, the associated revenue is deferred and recognized upon cash receipt.
     Our multiple element arrangements include our systems and one or more of the following undelivered
software-related elements: software entitlements and maintenance, premium hardware maintenance, and storage
review services. Our software entitlements and maintenance entitle our customers to receive unspecified product
upgrades and enhancements on a when-and-if-available basis, bug fixes, and patch releases. Premium hardware
maintenance services include contracts for technical support and minimum response times. Revenues from software

                                                          69
NETAPP, INC.
                NOTES TO CONSOLIDATED FINANCIAL STATEMENTS — (Continued)

entitlements and maintenance, premium hardware maintenance services and storage review services are recognized
ratably over the contractual term, generally from one to three years. We also offer extended service contracts (which
extend our standard parts warranty and may include premium hardware maintenance) at the end of the warranty
term; revenues from these contracts are recognized ratably over the contract term. We typically sell professional
services separately from any of our other revenue elements, either on a time and materials basis or for fixed price
standard projects; we recognize revenue for these services as they are performed. Revenue from hardware
installation services is recognized in the period the services are delivered. For arrangements with multiple
elements, we recognize as revenue the difference between the total arrangement price and the greater of fair
value or stated price for any undelivered elements (“the residual method”).
     For our undelivered software-related elements, we determine fair value of these undelivered elements based on
vendor-specific objective evidence (“VSOE”) of fair value, which for us consists of the prices charged when these
services are sold separately. To determine the fair value of these elements, we analyze both the selling prices when
elements are sold separately as well as the concentrations of those prices. We believe those concentrations have
been sufficient to enable us to establish VSOE of fair value for the undelivered elements. If VSOE cannot be
obtained to establish fair value of the undelivered elements, it is required that revenue from the entire arrangement
be initially deferred and recognized ratably over the period these elements are delivered.
      For purposes of presentation in the statement of operations, once fair value has been determined for our
undelivered bundled elements, we allocate revenue first to software entitlements and maintenance, based on VSOE
of its fair value with the remainder allocated to other service revenues.
     We record reductions to revenue for estimated sales returns at the time of shipment. Sales returns are estimated
based on historical sales returns, current trends, and our expectations regarding future experience. We monitor and
analyze the accuracy of sales returns estimates by reviewing actual returns and adjust them for future expectations to
determine the adequacy of our current and future reserve needs. If actual future returns and allowances differ from
past experience, additional allowances may be required.
     Product Warranties — Estimated future warranty costs are expensed as a cost of product revenues when
revenue is recognized, based on estimates of the costs that may be incurred under our warranty obligations including
material, distribution and labor costs. Our accrued liability for estimated future warranty costs is included in other
accrued liabilities and other long-term obligations on the accompanying consolidated balance sheets. Factors that
affect our warranty liability include the number of installed units, estimated material costs, estimated distribution
costs and estimated labor costs. We periodically assess the adequacy of our warranty accrual and adjust the amount
as considered necessary.
     Foreign Currency Translation — For subsidiaries whose functional currency is the local currency, gains and
losses resulting from translation of these foreign currency financial statements into U.S. dollars are recorded in
AOCI. For subsidiaries where the functional currency is the U.S. dollar, gains and losses resulting from the process
of remeasuring foreign currency financial statements into U.S. dollars are included in other income (expenses), net.
     Stock-Based Compensation — We measure and recognize stock-based compensation expense for all stock-
based awards, including employee stock options, restricted stock units and rights to purchase shares under our
ESPP, based on their estimated fair value, and recognize the costs in our financial statements over the employees’
requisite service period.
     The fair value of employee restricted stock units is equal to the market value of our common stock on the date
the award is granted. Calculating the fair value of employee stock options and the rights to purchase shares under the
ESPP requires estimates and significant judgment. The fair value of each option grant is estimated on the date of
grant using the Black-Scholes option pricing model, and is not remeasured as a result of subsequent stock price
fluctuations. Option-pricing models require the input of highly subjective assumptions, including the expected term
of options, and the expected price volatility of the stock underlying such options. Our expected term assumption is
based primarily on historical exercise and post-vesting forfeiture experience. Our stock price volatility assumption

                                                         70
NETAPP, INC.
                 NOTES TO CONSOLIDATED FINANCIAL STATEMENTS — (Continued)

is based on an implied volatility of call options and dealer quotes on call options, generally having a term of greater
than twelve months. The risk-free interest rate is based upon United States Treasury bills with equivalent expected
terms, and the expected dividend is based on our history and expected dividend payouts. Changes in the subjective
assumptions required in the valuation models may significantly affect the estimated value of our stock-based awards
and the related stock-based compensation expense. Likewise, the shortening of the contractual life of our options
could change the estimated exercise behavior in a manner other than currently expected.

     In addition, we estimate the number of stock-based awards that will be forfeited due to employee turnover. Our
forfeiture assumption is based primarily on historical experience. Changes in the estimated forfeiture rate can have a
significant effect on reported stock-based compensation expense, as the effect of adjusting the rate is recognized in
the period the forfeiture estimate is changed.

     Income Taxes — Deferred income tax assets and liabilities are provided for temporary differences that will
result in tax deductions or income in future periods, as well as the future benefit of tax credit carryforwards. A
valuation allowance reduces tax assets to their estimated realizable value.

      Determining the liability for uncertain tax positions requires us to make significant estimates and judgments as
to whether, and the extent to which, additional taxes may be due based on potential tax audit issues in the U.S. and
other tax jurisdictions throughout the world. Our estimates are based on the outcomes of previous audits, as well as
the precedents set in cases in which others have taken similar tax positions to those taken by us. If we later determine
that our exposure is lower or that the liability is not sufficient to cover our revised expectations, we adjust the
liability and effect a related change in our tax provision during the period in which we make such a determination.

     The accounting guidance for income taxes prescribes a comprehensive model for how a company should
recognize, measure, present, and disclose in its financial statements uncertain tax positions that we have taken or
expect to take on a tax return (including a decision whether to file or not to file a return in a particular jurisdiction).
We recognize the tax liability for uncertain income tax positions on the income tax return based on the two-step
process prescribed in the interpretation. The first step is to determine whether it is more likely than not that each
income tax position would be sustained upon audit. The second step is to estimate and measure the tax benefit as the
amount that has a greater than 50% likelihood of being realized upon ultimate settlement with the tax authority.
Estimating these amounts requires us to determine the probability of various possible outcomes. We evaluate these
uncertain tax positions on a quarterly basis. See Note 14 of the accompanying consolidated financial statements for
further discussion.

     Net Income per Share — Basic net income per share is computed by dividing income available to common
stockholders by the weighted average number of common shares outstanding, excluding common shares subject to
repurchase for that period. Diluted net income per share is computed giving effect to all dilutive potential shares that
were outstanding during the period. Dilutive potential common shares consist of incremental common shares
subject to repurchase, common shares issuable upon exercise of stock options, restricted stock awards, ESPP shares,
warrants, and assumed conversion of our Notes.. Repurchased shares are held as treasury stock and our outstanding
shares used to calculate earnings per share have been reduced by the weighted number of repurchased shares.

3.   Concentration of Risk

     Financial instruments that potentially subject us to concentrations of credit risk consist primarily of cash
equivalents, investments, foreign exchange contracts and accounts receivable. Cash equivalents and short-term
investments consist primarily of corporate bonds, U.S. government agency securities, and money market funds, all
of which are considered high investment grade. Our policy is to limit the amount of credit exposure through
diversification and investment in highly rated securities. We further mitigate concentrations of credit risk in our
investments by limiting our investments in the debt securities of a single issuer and by diversifying risk across
geographies and type of issuer.

                                                            71
NETAPP, INC.
                 NOTES TO CONSOLIDATED FINANCIAL STATEMENTS — (Continued)

    Our long term investments, including auction rate securities, have been and will continue to be exposed to
market risk due to uncertainties in the credit and capital markets.
     In entering into forward foreign exchange contracts, we have assumed the risk that might arise from the
possible inability of counterparties to meet the terms of their contracts. The counterparties to these contracts are
major multinational commercial banks, and we do not expect any losses as a result of counterparty defaults.
     We sell our products primarily to large organizations in different industries and geographies. We do not require
collateral or other security to support accounts receivable. In addition, we maintain an allowance for potential credit
losses. To reduce credit risk, we perform ongoing credit evaluations on our customers’ financial condition. We
establish an allowance for doubtful accounts based upon factors surrounding the credit risk of customers, historical
trends and other information and, to date, such losses have been within management’s expectations. Concentrations
of credit risk with respect to trade accounts receivable are limited due to the wide variety of customers who are
dispersed across many geographic regions.
     There are no concentrations of business transacted with a particular market that would severely impact our
business in the near term. However, we currently rely on a limited number of suppliers for certain key components
and a few key contract manufacturers to manufacture most of our products; any disruption or termination of these
arrangements could materially adversely affect our operating results.

4.    Recently Issued Accounting Standards
      In June 2009, the FASB issued revised guidance for the accounting for variable interest entities (VIEs). The
scope within the revised standard now includes qualifying special-purpose entities and provides revised guidance on
(1) determining the primary beneficiary of the VIE, (2) how power is shared, (3) consideration for kick-out,
participating and protective rights, (4) reconsideration of the primary beneficiary, (5) reconsideration of a VIE,
(6) fees paid to decision makers or service providers, and (7) presentation requirements. We are required to adopt
this standard at the beginning of fiscal 2011. We are currently evaluating the impact of the adoption of this guidance
on our consolidated financial statements, but do not expect the adoption to have a material impact on our financial
statements.
      In October 2009, the FASB amended the accounting standards for multiple deliverable revenue arrangements
to:
           (i) provide updated guidance on whether multiple deliverables exist, how the deliverables in an
      arrangement should be separated, and how the consideration should be allocated;
           (ii) require an entity to allocate revenue in an arrangement using best estimate of selling prices (BESP) of
      deliverables if a vendor does not have vendor-specific objective evidence of selling price (VSOE) or third-
      party evidence of selling price (TPE);
            (iii) eliminate the use of the residual method and require an entity to allocate revenue using the relative
      selling price method; and
           (iv) expand the disclosure requirements to require an entity to provide both qualitative and quantitative
      information about the significant judgments made in applying the revised guidance and subsequent changes in
      those judgments that may significantly affect the timing or amount of revenue recognition.
     In addition, in October 2009, the FASB amended the accounting standards for revenue recognition to exclude
tangible products containing software components and non-software components that function together to deliver
the tangible product’s essential functionality from the scope of the software revenue recognition guidance. The
revised revenue recognition accounting standards are effective for revenue arrangements entered into or materially
modified in fiscal years beginning on or after June 15, 2010 and shall be applied on a prospective basis. Earlier
application is permitted. We are required to adopt this standard at the beginning of fiscal 2012, which begins on

                                                          72
NETAPP, INC.
                     NOTES TO CONSOLIDATED FINANCIAL STATEMENTS — (Continued)

April 30, 2011. We are assessing the impact of the new accounting standards on our financial position and results of
operations.
     In January 2010, the FASB issued revised guidance on disclosures related to fair value measurements. This
guidance requires new disclosures about significant transfers in and out of Level 1 and Level 2 and separate
disclosures about purchases, sales, issuances, and settlements with respect to Level 3 measurements. The guidance
also clarifies existing fair value disclosures about valuation techniques and inputs used to measure fair value. The
new disclosures and clarifications of existing disclosures were effective for us in fiscal 2010, except for the
disclosures about purchases, sales, issuances, and settlements relating to Level 3 measurements, which will be
effective for us in the first quarter of fiscal 2012. We do not expect the adoption to have a material impact on our
financial statements.

5.    Statements of Cash Flows
       Supplemental cash flows and noncash investing and financing activities are as follows (in millions):
                                                                                                                          Year Ended
                                                                                                              April 30,    April 24,   April 25,
                                                                                                               2010          2009       2008

Noncash Investing and Financing Activities:
  Acquisition of property and equipment on account. . . . . . . . . . . . . . . . . . . .                      $17.2        $13.2       $27.3
  Taxes on settlement of note hedge . . . . . . . . . . . . . . . . . . . . . . . . . . . . . . . .            $32.1        $ —         $ —
  Options assumed for acquired businesses . . . . . . . . . . . . . . . . . . . . . . . . . . .                  —          $ —         $ 5.2
Supplemental Cash Flow Information:
  Income taxes paid. . . . . . . . . . . . . . . . . . . . . . . . . . . . . . . . . . . . . . . . . . . .     $28.5        $26.3       $29.3
  Income taxes refunded . . . . . . . . . . . . . . . . . . . . . . . . . . . . . . . . . . . . . . . .        $ 5.7        $10.1       $ 2.2
  Interest paid on debt . . . . . . . . . . . . . . . . . . . . . . . . . . . . . . . . . . . . . . . . . .    $22.1        $12.7       $ 8.1

6.    Business Combinations and Divestiture
     Acquisition of Onaro
     On January 28, 2008, we acquired Onaro, Inc. (Onaro), a privately-held company based in Boston, Massa-
chusetts, that provided software solutions for enterprises to increase service quality, return on storage, and
compliance by managing storage as a service, for a total purchase of $110.7 million. We allocated the purchase
price to the estimated tangible and intangible assets acquired and liabilities assumed, based on their estimated fair
values as follows (in millions):
       Tangible assets, net . . . . . . . . . . . . .       .........................................                               $ 7.2
       Identifiable intangible assets . . . . . . .         .........................................                                 36.0
       Goodwill . . . . . . . . . . . . . . . . . . . . .   .........................................                                 79.2
       Deferred income taxes . . . . . . . . . . .          .........................................                                (11.7)
                                                                                                                                    $110.7


     Termination of Proposed Merger with Data Domain, Inc.
   On May 20, 2009, we announced that we had entered into a merger agreement with Data Domain, Inc. (Data
Domain) under which we would acquire Data Domain in a stock and cash transaction. On July 8, 2009, Data
Domain’s Board of Directors terminated the merger agreement and, pursuant to the terms of the agreement, Data
Domain paid us a $57.0 million termination fee. We incurred $15.9 million of incremental third-party costs relating

                                                                         73
NETAPP, INC.
                      NOTES TO CONSOLIDATED FINANCIAL STATEMENTS — (Continued)

to the terminated merger transaction during the same period, resulting in a net amount of $41.1 million which is
included in acquisition related income, net in the consolidated statement of operations.


7.     Goodwill and Purchase Intangible Assets

     Goodwill as of April 30, 2010 and April 24, 2009 was $681.0 million. We conducted our annual goodwill
impairment test in the three month period ended April 30, 2010. Based on this analysis, we determined that there
was no impairment to goodwill. We will continue to monitor conditions and changes that could indicate that our
recorded goodwill may be impaired.

       Identified intangible assets are summarized as follows (in millions):

                                                                                  April 30, 2010                                   April 24, 2009
                                                                     Gross        Accumulated            Net          Gross         Accumulated           Net
                                                                     Assets       Amortization          Assets        Assets        Amortization         Assets

Identified Intangible Assets:
  Patents . . . . . . . . . . . . . . . . . . . . . . . . . .        $ —              $ —               $ —          $ 10.0             $ (9.9)          $ 0.1
  Existing technology . . . . . . . . . . . . . . . . .               75.1             (55.5)            19.6         107.9              (71.2)           36.7
  Trademarks/tradenames . . . . . . . . . . . . . .                    6.4              (4.3)             2.1           6.6               (3.4)            3.2
  Customer contracts/relationships . . . . . . . .                    12.2              (8.8)             3.4          12.5               (6.8)            5.7
     Total identified intangible assets, net . . . .                 $93.7            $(68.6)           $25.1        $137.0             $(91.3)          $45.7

       Amortization expense for identified intangible assets is summarized below (in millions):
                                                                               Year Ended                                       Statement of Operations
                                                      April 30, 2010          April 24, 2009        April 25, 2008                   Classifications

Patents . . . . . . . . . . . . . . . . . . . . .          $ 0.1                  $ 0.5                  $ 2.0             Research and development
Existing technology . . . . . . . . . . .                   17.1                   24.5                   22.5             Cost of product revenues
Other identified intangibles . . . . . .                     3.4                    4.4                    4.4             Sales and marketing
                                                           $20.6                  $29.4                  $28.9

     In fiscal 2009, we ceased development and availability of our SnapMirror for Open Systems product, and as a
result recorded impairment charges of $14.9 million attributable to identified intangible assets related to this
product line.

     As of April 30, 2010, future amortization expense related to identifiable intangible assets was as follows (in
millions):
       Fiscal Year                                                                                                                               Amount

       2011    .........................................                                       ........................                          $11.7
       2012    .........................................                                       ........................                            7.1
       2013    .........................................                                       ........................                            5.0
       2014    .........................................                                       ........................                            0.6
       2015    and thereafter . . . . . . . . . . . . . . . . . . . . . . . . . . . . . .      ........................                            0.7
       Total . . . . . . . . . . . . . . . . . . . . . . . . . . . . . . . . . . . . . . . . . . . . . . . . . . . . . . . . . . . . . . . . .   $25.1

                                                                               74
NETAPP, INC.
                     NOTES TO CONSOLIDATED FINANCIAL STATEMENTS — (Continued)

8.    Balance Sheet Detail

     Cash and cash equivalents (in millions):
                                                                                                                          April 30,    April 24,
                                                                                                                           2010         2009

       Cash . . . . . . . . . . . . . . . . . . . . . . . . . . . . . . . . . . . . . . . . . . . . . . . . . . . . . . . $ 187.8      $ 125.9
       Cash equivalents . . . . . . . . . . . . . . . . . . . . . . . . . . . . . . . . . . . . . . . . . . . . . .        1,517.2      1,368.3
                                                                                                                          $1,705.0     $1,494.2


     Inventories (in millions):
                                                                                                                           April 30,   April 24,
                                                                                                                            2010        2009

       Purchased components . . . . . . . . . . . . . . . . . . . . . . . . . . . . . . . . . . . . . . . . . . .           $  9.4      $ 5.0
       Work-in-process . . . . . . . . . . . . . . . . . . . . . . . . . . . . . . . . . . . . . . . . . . . . . . . .         0.2        0.1
       Finished goods . . . . . . . . . . . . . . . . . . . . . . . . . . . . . . . . . . . . . . . . . . . . . . . . .      103.3       56.0
                                                                                                                            $112.9      $61.1


     Long term investments and restricted cash (in millions):
                                                                                                                           April 30,   April 24,
                                                                                                                            2010        2009

       Auction rate securities . . . . . . . . . . . . . . . . . . . . . . . . . . . . . . . .       ...........             $69.0      $ 66.5
       Primary Reserve Fund . . . . . . . . . . . . . . . . . . . . . . . . . . . . . . . .          ...........                —         51.6
       Nonmarketable securities . . . . . . . . . . . . . . . . . . . . . . . . . . . . . .          ...........               1.4         4.0
       Restricted cash . . . . . . . . . . . . . . . . . . . . . . . . . . . . . . . . . . . . . .   ...........               2.4         5.2
                                                                                                                             $72.8      $127.3


     Property and equipment (in millions):
                                                                                                                          April 30,    April 24,
                                                                                                                           2010         2009

       Land. . . . . . . . . . . . . . . . . . . . . . . . . . . . . .   . . . . . . . . . . . . . . . . . . . . . . . . . $ 204.7     $ 176.1
       Buildings and building improvements . . . . .                     .........................                           394.8       323.3
       Leasehold improvements . . . . . . . . . . . . . . .              .........................                            73.7        70.2
       Computer, production, engineering and other                       equipment and purchased
         software . . . . . . . . . . . . . . . . . . . . . . . . .      .........................                           628.6        562.3
       Furniture. . . . . . . . . . . . . . . . . . . . . . . . . . .    .........................                            63.2         61.7
       Construction-in-progress . . . . . . . . . . . . . . .            .........................                            37.0        114.8
                                                                                                                           1,402.0      1,308.4
       Accumulated depreciation and amortization . . . . . . . . . . . . . . . . . . . . . . . . . .                        (597.6)      (500.5)
                                                                                                                          $ 804.4      $ 807.9

                                                                              75
NETAPP, INC.
                      NOTES TO CONSOLIDATED FINANCIAL STATEMENTS — (Continued)

     Other current assets (in millions):
                                                                                                                       April 30,   April 24,
                                                                                                                        2010        2009

       Deferred income tax assets . . . . . . . . . . . . . . . . . . . . . . . . . . . . . . . . . . . . . . . .      $ 69.6      $207.0
       Prepaid expenses and other current assets . . . . . . . . . . . . . . . . . . . . . . . . . . . . .              157.0       118.9
       Short-term restricted cash . . . . . . . . . . . . . . . . . . . . . . . . . . . . . . . . . . . . . . . . .       2.1         1.0
                                                                                                                       $228.7      $326.9


     Other Current Liabilities (in millions):
                                                                                                                       April 30,   April 24,
                                                                                                                        2010        2009

       Accrual for GSA settlement . . . . . . . . . . . . . . . . . . . . . . . . . . . .                ...........   $     —     $128.7
       Restructuring reserve . . . . . . . . . . . . . . . . . . . . . . . . . . . . . . . . .           ...........        2.3      14.7
       Warranty . . . . . . . . . . . . . . . . . . . . . . . . . . . . . . . . . . . . . . . . . .      ...........       18.2      24.0
       Taxes payable . . . . . . . . . . . . . . . . . . . . . . . . . . . . . . . . . . . . . .         ...........       44.4      38.6
       Marketing programs and rebates . . . . . . . . . . . . . . . . . . . . . . . . .                  ...........       55.7      24.6
       Other . . . . . . . . . . . . . . . . . . . . . . . . . . . . . . . . . . . . . . . . . . . . .   ...........       91.6      93.1
                                                                                                                       $212.2      $323.7


9.    Financial Instruments and Fair Value

     We measure assets and liabilities at fair value based upon expected exit price, representing the amount that
would be received on the sale of an asset or paid to transfer a liability, as the case may be, in an orderly transaction
between market participants. As such, fair value may be based on assumptions that market participants would use in
pricing an asset or liability. The accounting guidance provides a framework for measuring fair value on either a
recurring or nonrecurring basis whereby inputs, used in valuation techniques, are assigned a hierarchical level. The
following are the hierarchical levels of inputs to measure fair value:

            Level 1: Observable inputs that reflect quoted prices (unadjusted) for identical assets or liabilities in
       active markets.

            Level 2: Inputs reflect quoted prices for identical assets or liabilities in markets that are not active;
       quoted prices for similar assets or liabilities in active markets; inputs other than quoted prices that are
       observable for the assets or liabilities; or inputs that are derived principally from or corroborated by observable
       market data by correlation or other means.

            Level 3: Unobservable inputs reflecting our own assumptions incorporated in valuation techniques used
       to determine fair value. These assumptions are required to be consistent with market participant assumptions
       that are reasonably available.

     We consider an active market to be one in which transactions for the asset or liability occur with sufficient
frequency and volume to provide pricing information on an ongoing basis, and view an inactive market as one in
which there are few transactions for the asset or liability, the prices are not current, or price quotations vary
substantially either over time or among market makers. Where appropriate, our own or the counterparty’s non-
performance risk is considered in determining the fair values of liabilities and assets, respectively.

                                                                              76
NETAPP, INC.
                   NOTES TO CONSOLIDATED FINANCIAL STATEMENTS — (Continued)

  Investments
     The following is a summary of investments at April 30, 2010 and April 24, 2009 (in millions):
                                                                     April 30, 2010                                April 24, 2009
                                                                         Gross                                         Gross
                                                                      Unrealized          Estimated                 Unrealized       Estimated
                                                          Cost      Gains     Losses      Fair Value     Cost     Gains     Losses   Fair Value

    Corporate bonds. . . . .      .   .   .   .   .   . $1,128.1    $3.4     $(1.8)       $1,129.7     $ 486.2    $2.3     $(1.8)    $ 486.7
    Auction rate securities       .   .   .   .   .   .     71.6     0.7      (3.3)           69.0         73.2    0.3      (7.0)        66.5
    U.S. agency securities.       .   .   .   .   .   .    775.4     1.7      (0.1)          777.0         80.4    1.4        —          81.8
    U.S. Treasuries . . . . .     .   .   .   .   .   .     41.5     0.4        —             41.9         31.9    0.8        —          32.7
    Commercial papers . .         .   .   .   .   .   .    215.9     —          —            215.9        486.5     —       (0.5)       486.0
    Municipal bonds . . . .       .   .   .   .   .   .      1.5     —          —              1.5          —       —         —            —
    Certificates of deposit .     .   .   .   .   .   .    159.0     —          —            159.0        115.0    0.1        —         115.1
    Money market funds. .         .   .   .   .   .   .  1,211.2     —          —          1,211.2      1,327.8     —         —       1,327.8
    Total debt and equity
      securities . . . . . . . . . . . . . .             3,604.2     6.2        (5.2)      3,605.2      2,601.0    4.9       (9.3)    2,596.6
    Less cash equivalents . . . . . . .                  1,517.2     —           —         1,517.2      1,368.3     —          —      1,368.3
    Less long-term investments . . .                        71.6     0.7        (3.3)         69.0        124.9    0.3       (7.0)      118.2
    Total short-term investments . . $2,015.4                       $5.5     $(1.9)       $2,019.0     $1,107.8   $4.6     $(2.3)    $1,110.1

     We record net unrealized gains or losses on available-for-sale securities that are determined to be temporary in
other comprehensive income (loss). The following table shows the gross unrealized losses and fair values of our
investments, aggregated by investment category and length of time that individual securities have been in a
continuous unrealized loss position, at April 30, 2010 (in millions):
                                                         Less than 12 Months             12 Months or Greater                Total
                                                                     Unrealized                      Unrealized                  Unrealized
                                                       Fair Value      Loss             Fair Value     Loss        Fair Value      Loss

     Corporate bonds . . . . . . . .                    $516.1         $(1.8)            $ —            $ —          $516.1          $(1.8)
     Auction rate securities . . .                          —             —               59.7           (3.3)         59.7           (3.3)
     U.S. agency securities . . .                        165.3          (0.1)               —              —          165.3           (0.1)
     Total . . . . . . . . . . . . . . . .              $681.4         $(1.9)            $59.7          $(3.3)       $741.1          $(5.2)

     The following table shows the gross unrealized losses and fair values of our investments, aggregated by
investment category and length of time that individual securities have been in a continuous unrealized loss position,
at April 24, 2009 (in millions):
                                                         Less than 12 Months             12 Months or Greater                Total
                                                                     Unrealized                      Unrealized                  Unrealized
                                                       Fair Value      Loss             Fair Value     Loss        Fair Value      Loss

     Corporate bonds . . . . . . . .                    $139.5         $(1.2)            $ 58.4         $(0.6)       $197.9          $(1.8)
     Auction rate securities . . .                          —             —                57.6          (7.0)         57.6           (7.0)
     Commercial paper . . . . . .                        400.3          (0.5)                —             —          400.3           (0.5)
     Total . . . . . . . . . . . . . . . .              $539.8         $(1.7)            $116.0         $(7.6)       $655.8          $(9.3)


                                                                               77
NETAPP, INC.
                    NOTES TO CONSOLIDATED FINANCIAL STATEMENTS — (Continued)

     The following table presents the contractual maturities of our debt investments as of April 30, 2010 (in
millions):
      Debt Investment Maturities                                                                                   Cost           Fair Value

      Due   in one year or less . . . . . . . . . . . . . . . . . .   . . . . . . . . . . . . . . . . . . . . . . . $ 745.2       $ 746.7
      Due   in one through two years . . . . . . . . . . . . .        .......................                         801.1         802.4
      Due   in two through three years . . . . . . . . . . . .        .......................                         775.1         775.8
      Due   after three years*. . . . . . . . . . . . . . . . . . .   .......................                          71.6          69.0
                                                                                                               $2,393.0           $2,393.9

* Consists of auction rate securities which have contractual maturities of greater than 10 years.

   Fair Value of Financial Instruments
     The following table summarizes our financial assets and liabilities measured at fair value on a recurring basis
as of April 30, 2010 (in millions):
                                                                                            Quoted Prices        Significant
                                                                                              in Active            Other             Significant
                                                                                             Markets for         Observable         Unobservable
                                                                                           Identical Assets        Inputs              Inputs
                                                                               Total          (Level 1)           (Level 2)           (Level 3)

Assets
  Corporate bonds . . . . . . . . . . . . . . . . . . . . . . . . . . . $1,129.7              $      —            $1,129.7             $ —
  Trading securities . . . . . . . . . . . . . . . . . . . . . . . . . .     12.6                  12.6                 —                —
  U.S. agency securities . . . . . . . . . . . . . . . . . . . . . . .      777.0                    —               777.0               —
  U.S. Treasuries . . . . . . . . . . . . . . . . . . . . . . . . . . . .    41.9                  41.9                 —                —
  Municipal bonds . . . . . . . . . . . . . . . . . . . . . . . . . . .       1.5                    —                 1.5               —
  Commercial paper . . . . . . . . . . . . . . . . . . . . . . . . .        215.9                    —               215.9               —
  Certificates of deposit . . . . . . . . . . . . . . . . . . . . . . .     159.0                    —               159.0               —
  Money market funds . . . . . . . . . . . . . . . . . . . . . . . .      1,211.2               1,211.2                 —                —
  Auction rate securities . . . . . . . . . . . . . . . . . . . . . .        69.0                    —                  —               69.0
  Investment in privately-held companies . . . . . . . . . .                  1.4                    —                  —                1.4
  Foreign currency contracts . . . . . . . . . . . . . . . . . . .            2.0                    —                 2.0               —
Total . . . . . . . . . . . . . . . . . . . . . . . . . . . . . . . . . . . . . $3,621.2      $1,265.7            $2,285.1             $70.4
Liabilities
  Foreign currency contracts . . . . . . . . . . . . . . . . . . . $              (1.0)       $       —           $       (1.0)        $ —


                                                                        78
NETAPP, INC.
                    NOTES TO CONSOLIDATED FINANCIAL STATEMENTS — (Continued)

      Reported as (in millions):
                                                                                            Quoted Prices      Significant
                                                                                              in Active          Other          Significant
                                                                                             Markets for       Observable      Unobservable
                                                                                           Identical Assets      Inputs           Inputs
                                                                               Total          (Level 1)         (Level 2)        (Level 3)

Assets
  Cash equivalents . . . . . . . . . . . . . . . . . . . . . . . . . . . $1,517.2            $1,211.2          $ 306.0            $ —
  Short-term investments . . . . . . . . . . . . . . . . . . . . . .             2,019.0         41.9           1,977.1             —
  Other current assets . . . . . . . . . . . . . . . . . . . . . . . .              12.6         12.6               —               —
  Long-term investments . . . . . . . . . . . . . . . . . . . . . .                 70.4           —                —              70.4
  Other non-current current assets . . . . . . . . . . . . . . .                     2.0           —                2.0             —
Total . . . . . . . . . . . . . . . . . . . . . . . . . . . . . . . . . . . . . $3,621.2     $1,265.7          $2,285.1           $70.4
Liabilities
  Other current liabilities . . . . . . . . . . . . . . . . . . . . . . $         (1.0)      $       —         $      (1.0)       $ —

    We classify investments within Level 1 if quoted prices are available in active markets. Level 1 investments
generally include U.S. Treasuries, trading securities with quoted prices on active markets, and money market funds.
     We classify items in Level 2 if the investments are valued using observable inputs to quoted market prices,
benchmark yields, reported trades, broker/dealer quotes or alternative pricing sources with reasonable levels of
price transparency. These investments include: corporate bonds, commercial paper, U.S. government agency bonds,
municipal bonds, certificates of deposit, and foreign currency contracts. Investments are held by a custodian who
obtains investment prices from a third party pricing provider that incorporates standard inputs in various asset price
models. We corroborate the prices obtained from the pricing service against other independent sources and, as of
April 30, 2010, have not found it necessary to make any adjustments to the prices obtained.
     The unrealized losses on our available-for-sale investments in corporate bonds and U.S. government agency
bonds were caused by market value declines as a result of the recent economic environment, as well as fluctuations
in market interest rates. Because the decline in market value is attributable to changes in market conditions and not
credit quality, and because we do not intend to sell nor likely be required to sell these investments prior to a recovery
of par value, we do not consider these investments to be other-than temporarily impaired at April 30, 2010.
     Our foreign currency forward exchange contracts are also classified within Level 2. We determine the fair
value of these instruments by considering the estimated amount we would pay or receive to terminate these
agreements at the reporting date. We use observable inputs, including quoted prices in active markets for similar
assets or liabilities. Our foreign currency derivative contracts are classified within Level 2 as the valuation inputs are
based on quoted market prices of similar instruments in active markets. Gains and losses generated by hedge assets
and liabilities, and the related derivative instruments were as follows (in millions):
                                                                                                               Year Ended
                                                                                                   April 30,    April 24,     April 25,
                                                                                                    2010          2009         2008

      Gain (loss) generated by hedged assets and liabilities . . . . . . . . . . . .                $(13.5)        $(25.9)    $ 12.8
      Gain (loss) on related derivative instruments . . . . . . . . . . . . . . . . . . .              8.2           20.9      (13.5)
     We classify items in Level 3 if the investments are valued using a pricing model or based on unobservable
inputs in the market. These investments include auction rate securities and cost method investments.
     As of April 24, 2009, we held an investment in the Reserve Primary Fund (the Primary Fund), a money market
fund which had suspended redemptions in September 2008 and was in the process of liquidating its portfolio of
investments, with a recorded value of $51.6 million that had been previously written down from its par value of

                                                                        79
NETAPP, INC.
                   NOTES TO CONSOLIDATED FINANCIAL STATEMENTS — (Continued)

$60.9 million. During fiscal 2010, the Primary Fund made multiple distributions of its assets to its investors and we
recognized an additional loss of $0.2 million in our income statement, and as of April 30, 2010, we had recovered
$51.4 million of our recorded investment. Future distributions, if any, will be recognized as income upon receipt.

      As of April 30, 2010 and April 24, 2009, we had auction rate securities (ARSs) with a par value of
$73.8 million and $75.4 million, respectively, and an estimated fair value of $69.0 million and $66.5 million,
respectively, which are classified as long-term investments. Substantially all of our ARSs are backed by pools of
student loans guaranteed by the U.S. Department of Education. As of April 30, 2010, we recorded cumulative
temporary losses of $2.6 million within AOCI. In addition, we recorded other-than-temporary losses of $2.1 million
in other income (expense), net, during fiscal 2009 based on an analysis of the fair value and marketability of these
investments. We estimated the fair value for each individual ARS using an income (discounted cash flow) approach
that incorporates both observable and unobservable inputs to discount the expected future cash flows. Based on our
ability to access our cash and other short-term investments, our expected operating cash flows, and our other sources
of cash, we do not intend to sell these investments prior to recovery of value. We will continue to monitor our ARS
investments in light of the current debt market environment and evaluate our accounting for these investments.

      As of April 30, 2010 and April 24, 2009, we held investments in a private equity fund of $1.4 million and
$2.0 million, respectively. In addition, at April 24, 2009, we held equity investments in privately held companies of
$1.9 million. During fiscal 2010, we recorded gains of $3.4 million on these investments. During fiscal 2009, we
recorded $6.3 million of impairment charges on certain of these investments and adjusted their carrying amount to
fair value, as we deemed the decline in the value of those assets to be other-than-temporary.

    The table below provides a reconciliation of the beginning and ending balance of our Level 3 financial assets
measured at fair value on a recurring basis using significant unobservable inputs as of April 30, 2010 (in millions).
                                                                             Auction Rate   Private Equity   Privately-Held
                                                              Primary Fund    Securities        Fund          Companies

     Balance at April 25, 2008 . . . . . . . . . . .            $     —         $72.6           $ 2.6            $ 8.6
     Total unrealized losses included in
       other comprehensive income . . . . . . .                       —          (3.2)             —                —
     Total realized losses included in
       earnings . . . . . . . . . . . . . . . . . . . . . .         —            (2.1)             —              (6.3)
     Purchases, sales and settlements, net . . .                 (546.3)         (0.8)           (0.6)            (0.4)
     Transfers to Level 3 . . . . . . . . . . . . . . .           597.9           —                —                —
     Balance at April 24, 2009 . . . . . . . . . . .            $ 51.6          $66.5           $ 2.0            $ 1.9
     Total unrealized gains included in other
       comprehensive income . . . . . . . . . . .                     —           4.2              —                —
     Total realized gains (losses) included in
       earnings . . . . . . . . . . . . . . . . . . . . . .          (0.2)        —               0.8              2.6
     Purchases, sales and settlements, net . . .                    (51.4)       (1.7)           (1.4)            (4.5)
     Balance at April 30, 2010 . . . . . . . . . . .            $     —         $69.0           $ 1.4            $ —


  Other Fair Value Disclosures

     The fair value of certain of our financial instruments that are not measured at fair value, including accounts
receivable, accounts payable, accrued compensation, and other current liabilities, approximates the carrying
amount because of their short maturities. The fair value of our Notes is disclosed in Note 10 of the accompanying
consolidated financial statements and was determined using quoted market prices for those securities.

                                                                      80
NETAPP, INC.
                NOTES TO CONSOLIDATED FINANCIAL STATEMENTS — (Continued)

10.   Financing Arrangements

  1.75% Convertible Senior Notes Due 2013

     On June 10, 2008, we issued $1,265.0 million aggregate principal amount of 1.75% Convertible Senior Notes
due 2013. The Notes are unsecured, unsubordinated obligations of the Company. Interest is payable in cash semi-
annually at a rate of 1.75% per annum. The Notes will mature on June 1, 2013 unless repurchased or converted in
accordance with their terms prior to such date. The Notes may be converted, under the conditions specified below,
based on an initial conversion rate of 31.40 shares of common stock per 1,000 principal amount of Notes (which
represents an initial effective conversion price of the Notes of approximately $31.85 per share), subject to
adjustment as described in the indenture governing the Notes. We received net proceeds of $1,238.4 million, after
deducting issuance costs of $26.6 million.

     The Notes are not redeemable by us prior to the maturity date. In the event of a fundamental change, holders of
the Notes may require us to repurchase all or a portion of their Notes at a repurchase price equal to 100% of the
principal amount of the Notes plus accrued and unpaid interest, if any, to, but excluding, the fundamental change
repurchase date.

      The holders of the Notes may convert their Notes until the close of business on the scheduled trading day
immediately preceding the maturity date if any of the following conditions are met: (1) during the five business day
period after any five consecutive trading day period (the measurement period) in which the trading price of the
Notes for each day in the measurement period was less than 98% of the product of the last reported sale price of our
common stock and the conversion rate for the Notes on each such day; (2) during any calendar quarter (and only
during such calendar quarter) if the last reported sale price of our common stock for 20 or more trading days in a
period of 30 consecutive trading days ending on the last trading day of the immediately preceding calendar quarter
exceeds 130% of the applicable conversion price in effect for the Notes on the last trading day of such immediately
preceding calendar quarter; or (3) upon the occurrence of specified corporate transactions set forth in the indenture
for the Notes. On or after March 1, 2013 until the scheduled trading day immediately preceding the maturity date,
holders of the Notes may convert their Notes regardless of the foregoing conditions. Upon conversion, a holder will
receive cash in an amount equal to the lesser of the conversion value and the principal amount of the Notes, and any
shares of our common stock for any conversion value in excess of the principal amount of the Notes, if any. Holders
of the Notes who convert their Notes in connection with a fundamental change (as defined in the indenture for the
Notes) will, under certain circumstances, be entitled to a make-whole premium in the form of an increase in the
conversion rate.

     As of April 30, 2010, none of the conditions allowing the holders of the Notes to convert had been met and we
had not issued any shares related to the Notes. Based on the closing price of our common stock of $34.67 on
April 30, 2010, the if-converted value of our Notes exceeded their principal amount by approximately $112 million.

     We separately account for the liability and equity components of the Notes. The initial debt component of the
Notes was valued at $1,017.0 million based on the contractual cash flows discounted at an appropriate comparable
market non-convertible debt borrowing rate at the date of issuance of 6.31%, with the equity component
representing the residual amount of the proceeds of $248.0 million which was recorded as a debt discount.
Issuance costs were allocated pro rata based on the relative initial carrying amounts of the debt and equity
components. As a result, $5.2 million of the issuance costs were allocated to the equity component of the Notes, and
$21.4 million of the issuance costs remained classified as long-term other assets. The debt discount and the issuance
costs allocated to the debt component are amortized as additional interest expense over the term of the Notes using
the effective interest method and an effective interest rate of 6.31% for all periods presented.

                                                         81
NETAPP, INC.
                   NOTES TO CONSOLIDATED FINANCIAL STATEMENTS — (Continued)

     The following table reflects the carrying value of our convertible debt as of April 30, 2010 and April 24, 2009
(in millions):
                                                                                                                  April 30,        April 24,
                                                                                                                   2010             2009

     1.75% Convertible Notes Due 2013 . . . . . . . . . . . . . . . . . . . . . . . . . . . . . . . . $1,265.0                     $1,265.0
     Less: Unamortized discount . . . . . . . . . . . . . . . . . . . . . . . . . . . . . . . . . . . . . . (163.5)                  (210.3)
     Net long-term carrying amount of Notes . . . . . . . . . . . . . . . . . . . . . . . . . . . . $1,101.5                       $1,054.7

    The following table presents the amount of interest cost recognized relating to both the contractual interest
coupon and the amortization of the discount and issuance costs (in millions):
                                                                                                                         Year Ended
                                                                                                                    April 30,   April 24,
                                                                                                                     2010         2009

     Contractual interest coupon . . . . . . . . . . . . . . . . . . . . . . . . . . . . . . . . . . . . . . .       $22.5           $19.4
     Amortization of debt discount . . . . . . . . . . . . . . . . . . . . . . . . . . . . . . . . . . . . . .        46.8            37.8
     Amortization of issuance costs . . . . . . . . . . . . . . . . . . . . . . . . . . . . . . . . . . . . .          4.0             3.2
     Total interest cost recognized . . . . . . . . . . . . . . . . . . . . . . . . . . . . . . . . . . . . . .      $73.3           $60.4

     The following table reflects the remaining debt discount and issuance cost as of April 30, 2010 (in millions):
                                                                                                                                    April 30,
                                                                                                                                     2010

     Remaining debt discount . . . . . . . . . . . . . . . . . . . . . . . . . . . . . . . . . . . . . . . . . . . . . . . . . .    $163.5
     Remaining issuance costs . . . . . . . . . . . . . . . . . . . . . . . . . . . . . . . . . . . . . . . . . . . . . . . . .       14.1
     Remaining life of the Notes (years) . . . . . . . . . . . . . . . . . . . . . . . . . . . . . . . . . . . . . . . . . .           3.1

  Note Hedges and Warrants
    Concurrent with the issuance of the Notes, we purchased note hedges and sold warrants. The separate note
hedge and warrants transactions are structured to reduce the potential future economic dilution associated with the
conversion of the Notes. Each of these components is discussed separately below:
     • Note Hedges. Counterparties agreed to sell the Company up to approximately 39.7 million shares, subject
       to anti-dilution adjustments, of our common stock, which is the number of shares initially issuable upon
       conversion of the Notes in full, at a price of $31.85 per share, subject to adjustment. The note hedge
       transactions will be settled in shares in an amount generally equal to the number of shares the Company
       would deliver to holders that convert their Notes. The note hedge transactions will expire at the earlier of
       (1) the last day on which any Notes remain outstanding and (2) the scheduled trading day immediately
       preceding the maturity date of the Notes. The cost of the Note hedges was $254.9 million and has been
       accounted for as an equity transaction.
     • Warrants. We also sold to the same counterparties warrants to acquire, subject to anti-dilution adjustments,
       39.7 million shares of our common stock at an exercise price of $41.28 per share, subject to adjustment, on a
       series of days commencing on September 3, 2013. Upon exercise of the warrants, we have the option to
       deliver cash or shares of our common stock equal to the difference between the then market price and the
       strike price of the warrants.
     As of April 30, 2010, we had not received any shares related to the note hedge transactions or delivered cash or
shares related to the warrant transactions. We received proceeds of $163.1 million related to the sale of the warrants,
which has been classified as equity.

                                                                       82
NETAPP, INC.
                NOTES TO CONSOLIDATED FINANCIAL STATEMENTS — (Continued)

     Lehman Brothers OTC Derivatives, Inc. (“Lehman OTC”) was the counterparty to 20% of our Note hedges.
The bankruptcy filing by Lehman OTC on October 3, 2008 constituted an “event of default” under the hedge
transaction. In April 2010, we terminated the hedge transaction with Lehman OTC in exchange for an unsecured
bankruptcy claim, which we subsequently sold to a third party for $14.2 million. Because we have decided not to
replace the hedge, we are subject to potential dilution on the 20% unhedged portion of our Notes upon conversion if
on the date of conversion the per-share market price of our common stock exceeds the conversion price of $31.85.
The terms of the Notes, the rights of the holders of the Notes and other counterparties to Note hedges and warrants
were not affected by the termination of this hedge.


  Fair Value of Notes

     As of April 30, 2010, the approximate fair value of the principal amount of our Notes, which includes the debt
and equity components, was approximately $1.5 billion, or 120% of the face value of the Notes, based upon quoted
market information.


  Credit Agreements

      On November 2, 2007, we entered into a senior unsecured credit agreement (the “Unsecured Credit
Agreement”) with certain lenders and BNP Paribas (“BNP”), as syndication agent, and JPMorgan Chase Bank
National Association (“JPMorgan”), as administrative agent. The Unsecured Credit Agreement provided for a
revolving unsecured credit facility that is comprised of commitments from various lenders who agree to make
revolving loans and swingline loans and issue letters of credit of up to an aggregate amount of $250.0 million with a
term of five years. Effective December 22, 2009, we terminated this agreement. No borrowings were outstanding at
the time of termination and no penalties resulted from these early terminations.

     On October 5, 2007, we entered into a secured credit agreement (the “Secured Credit Agreement”). The
Secured Credit Agreement provided for a revolving secured credit facility of up to $250.0 million with a term of five
years. In fiscal 2009, we terminated this agreement. No borrowings were outstanding at the time of termination and
no penalties resulted from these early terminations.


11.   Stockholders’ Equity

  Equity Incentive Programs

     Acquisition Plans — We have assumed stock incentive plans in connection with our acquisitions. The options
granted under these plans generally vest at a rate of 25% on the first anniversary of the vesting commencement date
and then ratably over the following 36 months. The restricted stock units generally vest at a rate of 50% on the first
and second annual anniversaries of the vesting commencement date.

      The 1999 Plan — As amended through August 17, 2009, the 1999 Stock Option Plan (“the 1999 Plan”)
comprises five separate equity incentive programs: (i) the Discretionary Option Grant Program under which options
may be granted to eligible individuals at a fixed price per share; (ii) the Stock Appreciation Rights Program under
which eligible persons may be granted stock appreciation rights that allow individuals to receive the appreciation in
Fair Market Value of the shares; (iii) the Stock Issuance Program under which eligible individuals may be issued
shares of Common Stock directly; (iv) the Performance Share and Performance Unit Program (also known as
restricted stock units or RSUs) under which eligible persons may be granted performance shares and performance
units which result in payment to the participant only if performance goals or other vesting criteria are achieved; and
(v) the Automatic Option Grant Program under which nonemployee board members automatically receive equity
grants at designated intervals over their period of board service.

                                                         83
NETAPP, INC.
                     NOTES TO CONSOLIDATED FINANCIAL STATEMENTS — (Continued)

     Under the 1999 Plan, the Board of Directors may grant to employees, nonemployee directors, and consultants
and other independent advisors options to purchase shares of our common stock during their period of service with
us. The exercise price for an incentive stock option and a nonstatutory option cannot be less than 100% of the fair
market value of the common stock on the grant date. Options granted under the 1999 Plan generally vest over a four-
year period. Options granted prior to April 29, 2006, have a term of no more than 10 years after the date of grant and
those granted after April 29, 2006 have a term of no more than seven years, subject to earlier termination upon the
occurrence of certain events. The 1999 Plan prohibits the repricing of any outstanding stock option or stock
appreciation right after it has been granted or to cancel any outstanding stock option or stock appreciation right and
immediately replace it with a new stock option or stock appreciation right with a lower exercise price unless
approved by stockholders. RSUs granted under the 1999 Plan generally vest over a four-year period with 25% of the
units vesting on each annual anniversary of the grant date. The 1999 Plan limits the number of shares issued under
the Stock Issuance Program and the Performance Share and Performance Unit Program to 8.9 million shares plus
50% of the awards cancelled and returned to the 1999 Plan and 50% of the number of shares added to the 1999 Plan
after the 2009 Annual Meeting. The 1999 Plan limits the value of performance units a participant may receive
during any calendar year to $2.0 million. The 1999 Plan expires in August 2019.
     In fiscal 2010, the 1999 Plan was not amended to increase addition shares for issuance. In fiscal 2009 and 2008,
1999 Plan was amended to increase the share reserved by an additional 6.6 million and 7.2 million shares for
issuance under the plan, respectively. As of April 30, 2010, 15.5 million shares were available for grant under our
equity incentive plans.

   Stock Options
    A summary of the combined activity under our stock option plans and agreements is as follows (in millions,
except for per share information and term):
                                                                                         Outstanding
                                                                                           Options             Weighted
                                                                                                Weighted        Average
                                                                                                 Average       Remaining       Aggregate
                                                                                    Numbers      Exercise   Contractual Term    Intrinsic
                                                                                    of Shares      Price         (Years)         Value

Outstanding at April 27, 2007 . . . . . . . . . . . . . . . . . . . . .               63.6       $29.95
  Options granted . . . . . . . . . . . . . . . . . . . . . . . . . . . . . .         11.2        26.41
  Options assumed in acquisition (weighted average fair
    value of $22.22). . . . . . . . . . . . . . . . . . . . . . . . . . . .            0.8        13.82
  Options exercised . . . . . . . . . . . . . . . . . . . . . . . . . . . .           (5.4)       12.47
  Options forfeitures and cancellations . . . . . . . . . . . . . .                   (4.6)       37.54
Outstanding at April 25, 2008 . . . . . . . . . . . . . . . . . . . . .               65.6        30.03
  Options granted . . . . . . . . . . . . . . . . . . . . . . . . . . . . . .          8.7        17.67
  Options exercised . . . . . . . . . . . . . . . . . . . . . . . . . . . .           (3.7)       11.20
  Options forfeitures and cancellations . . . . . . . . . . . . . .                   (4.5)       32.61
Outstanding at April 24, 2009 . . . . . . . . . . . . . . .           ......          66.1        29.27
  Options granted . . . . . . . . . . . . . . . . . . . . . . . .     ......           7.1        26.95
  Options exercised . . . . . . . . . . . . . . . . . . . . . .       ......          (8.5)       19.33
  Options cancelled in the Exchange . . . . . . . . . .               ......         (24.5)       39.05
  Options forfeitures and cancellations . . . . . . . .               ......          (5.0)       39.12
Outstanding at April 30, 2010 . . . . . . . . . . . . . . .           ......          35.2        23.02          4.47           $423.4
   Options vested and expected to vest as of April 30,
     2010 . . . . . . . . . . . . . . . . . . . . . . . . . . . . . . . . . . . .     33.3        22.98          4.38           $402.0
   Exercisable at April 30, 2010 . . . . . . . . . . . . . . . . . . . .              22.2        22.92          3.71           $273.0

                                                                           84
NETAPP, INC.
                    NOTES TO CONSOLIDATED FINANCIAL STATEMENTS — (Continued)

     The intrinsic value of stock options represents the difference between the exercise price of stock options and
the market price of our stock on that day for all in-the-money options. Additional information related to our stock
options is summarized below (in millions except per share information):
                                                                                April 30, 2010   April 24, 2009     April 25, 2008

       Weighted-average fair value per share granted . . . . . . .                 $ 9.74           $ 7.28              $10.13
       Intrinsic value of options exercised . . . . . . . . . . . . . . .          $ 92.9           $ 30.3              $ 83.1
       Proceeds received from the exercise of stock options . .                    $165.1           $ 41.1              $ 66.6
       Fair value of options vested . . . . . . . . . . . . . . . . . . . . .      $165.6           $179.8              $177.1
    There was $93.1 million of total unrecognized compensation expense as of April 30, 2010 related to options.
The unrecognized compensation expense will be amortized on a straight-line basis over a weighted-average
remaining period of 2.7 years.
     The following table summarizes information about stock options outstanding under all option plans as of
April 30, 2010 (in millions, except for per share information and life):
                                                          Options Outstanding                                 Options Exercisable
                                                                  Weighted
                                                                   Average               Weighted                             Weighted
                                        Number                   Remaining               Average                              Average
         Range of                     Outstanding at          Contractual Life           Exercise          Number             Exercise
       Exercise Prices                April 30, 2010              (In Years)              Price           Exercisable          Price

$     0.55         $ 12.43                   2.5                     2.91                $ 10.09              2.2             $     9.90
     12.52           13.56                   3.7                     5.60                  13.56              1.0                  13.56
     13.63           19.17                   3.6                     2.95                  16.58              3.4                  16.61
     19.22           20.69                   5.3                     3.92                  20.36              3.2                  20.16
     20.70           22.56                   4.9                     4.38                  21.81              3.0                  21.67
     22.62           24.72                   4.1                     5.08                  23.81              2.2                  23.48
     24.98           30.74                   4.0                     4.89                  28.41              3.2                  28.28
     30.88           33.54                   5.2                     5.49                  32.94              2.4                  32.36
     33.77          121.69                   1.9                     3.97                  40.92              1.6                  41.70
    122.19          122.19                   —                       0.42                 122.19              —                   122.19
$     0.55         $122.19                  35.2                     4.47                $ 23.02             22.2             $ 22.92


                                                                     85
NETAPP, INC.
                    NOTES TO CONSOLIDATED FINANCIAL STATEMENTS — (Continued)

      The following table summarizes activity related to our RSUs (in millions, except the fair value):
                                                                                                                                    Weighted
                                                                                                                                    Average
                                                                                                                   Numbers of      Grant Date
                                                                                                                     Shares        Fair Value

Outstanding at April 27, 2007 . . . . . . . . . . . . . . . . . . . . . . . .          .................               1.5           $36.42
  RSUs granted . . . . . . . . . . . . . . . . . . . . . . . . . . . . . . . . . . .   .................               3.4            23.11
  RSU assumed in acquisition . . . . . . . . . . . . . . . . . . . . . . . .           .................               0.2            22.83
  RSUs vested . . . . . . . . . . . . . . . . . . . . . . . . . . . . . . . . . . .    .................              (0.3)           33.19
  RSUs forfeitures and cancellations . . . . . . . . . . . . . . . . . . .             .................              (0.2)           33.65
Outstanding at April 25, 2008 . . . . . . . . . . . . . . . . . . . . . . . .          .................               4.6            26.30
  RSUs granted . . . . . . . . . . . . . . . . . . . . . . . . . . . . . . . . . . .   .................               2.2            17.16
  RSUs vested . . . . . . . . . . . . . . . . . . . . . . . . . . . . . . . . . . .    .................              (0.8)           28.81
  RSUs forfeitures and cancellations . . . . . . . . . . . . . . . . . . .             .................              (0.5)           25.48
Outstanding at April 24, 2009 . . . . . . . . . . . . . . . . . . . . . . . .          .................               5.5            22.38
  RSUs granted . . . . . . . . . . . . . . . . . . . . . . . . . . . . . . . . . . .   .................               3.1            29.32
  RSUs issued in the Stock Option Exchange . . . . . . . . . . . . .                   .................               3.2            21.73
  RSUs vested . . . . . . . . . . . . . . . . . . . . . . . . . . . . . . . . . . .    .................              (2.1)           24.64
  RSUs forfeitures and cancellations . . . . . . . . . . . . . . . . . . .             .................              (0.7)           23.39
Outstanding at April 30, 2010 . . . . . . . . . . . . . . . . . . . . . . . . . . . . . . . . . . . . . . . . .        9.0            23.93

    As of April 30, 2010, there was $138.7 million of total unrecognized compensation expense related to RSUs.
The unrecognized compensation expense will be amortized on a straight-line basis over a weighted-average
remaining vesting period of 2.7 years.

     RSUs are converted into common stock upon the release to the employees or directors upon vesting. Upon the
vesting of restricted stock, we primarily use the net share settlement approach, which withholds a portion of the
shares to cover the applicable taxes and decreases the shares issued to the employee by a corresponding value. The
number and the value of the shares netted for employee taxes are summarized in the table below (in millions):
                                                                                                                  Year Ended
                                                                                                   April 30,       April 24,    April 25,
                                                                                                    2010             2009        2008

      RSUs shares withheld for taxes . . . . . . . . . . . . . . . . . . . . . . . . . . . .          0.7            0.3          0.2
      RSUs amount withheld for taxes . . . . . . . . . . . . . . . . . . . . . . . . . . .          $20.8           $5.1         $6.0


   Stock Option Exchange

     In April 2009, our stockholders approved a stock option exchange program (the Exchange) pursuant to which
eligible employees were able to exchange some or all of their outstanding options with an exercise price greater than
or equal to $22.00 per share that were granted before June 20, 2008, whether vested or unvested, for new RSUs. In
connection with the Exchange, we exchanged options to purchase 24.5 million shares of our common stock for total
of 3.2 million RSUs. The fair value of the RSUs issued was measured as the total of the unrecognized compensation
cost of the options surrendered and the incremental value of the RSUs issued, measured as the excess of the fair
value of the RSUs over the fair value of the options tendered immediately before the exchange. The incremental cost
of the RSUs was $5.8 million. The value of the RSUs, totaling $70.1 million, is being amortized over the weighted
average vesting period of the RSUs of 3.5 years.

                                                                        86
NETAPP, INC.
                   NOTES TO CONSOLIDATED FINANCIAL STATEMENTS — (Continued)

     Stock Issuance Program — Under the 1999 Stock Issuance Program, certain eligible persons may be issued
shares of common stock directly. No restricted stock awards (RSAs) were issued to employees during fiscal 2010,
2009 and 2008. At April 30, 2010, 8.0 million shares were available for future issuances under this program.
     The following table summarizes activity related to our restricted stock awards (in millions, except the fair
value):
                                                                                                               Weighted-Average
                                                                                          Number of Shares    Grant Date Fair Value

     Nonvested at April 27, 2007 . . . . . . . . . . . . . . . . . . . . . . . .                0.3                 $34.45
     Awards vested. . . . . . . . . . . . . . . . . . . . . . . . . . . . . . . . . . .        (0.1)                 32.62
     Awards canceled/expired/forfeited . . . . . . . . . . . . . . . . . . . .                 (0.1)                 34.26
     Nonvested at April 25, 2008 . . . . . . . . . . . . . . . . . . . . . . . .                0.1                   35.40
     Awards vested. . . . . . . . . . . . . . . . . . . . . . . . . . . . . . . . . . .         —                     34.07
     Awards canceled/expired/forfeited . . . . . . . . . . . . . . . . . . . .                  —                     30.20
     Nonvested at April 24, 2009 . . . . . . . . . . . . . . . . . . . . . . . .                0.1                   36.68
     Awards vested. . . . . . . . . . . . . . . . . . . . . . . . . . . . . . . . . . .        (0.1)                  34.96
     Nonvested at April 30, 2010 . . . . . . . . . . . . . . . . . . . . . . . .                 —                  $39.83

     Although nonvested shares are legally issued, they are considered contingently returnable shares subject to
repurchase by the Company when employees terminate their employment. The total fair value of shares vested
during fiscal 2010, 2009 and 2008 was $1.8 million, $2.0 million and $1.6 million, respectively. There was
$0.5 million of total unrecognized compensation expense as of April 30, 2010 related to RSAs that will be
amortized on a straight-line basis over a weighted-average remaining period of 0.7 years.
      Employee Stock Purchase Plan — Under the Employee Stock Purchase Plan (ESPP), employees are entitled to
purchase shares of our common stock at 85% of the fair market value at certain specified dates over a two-year
period. In fiscal 2010, 2009 and 2008, the plan was amended to increase the share reserved by an additional
6.7 million, 2.9 million and 1.6 million shares of common stock, respectively. Of the 30.2 million shares authorized
to be issued under this plan, 5.0 million shares were available for issuance at April 30, 2010. Additional information
related to our purchase rights issued under the ESPP is summarized below (in millions, except per share
information):
                                                                                                              Year Ended
                                                                                                  April 30,    April 24,   April 25,
                                                                                                   2010          2009       2008

     Weighted-average fair value per right granted . . . . . . . . . . . . . . . . . .             $ 8.86      $ 6.17      $ 7.44
     Shares issued under the ESPP . . . . . . . . . . . . . . . . . . . . . . . . . . . . .           5.1         3.3         2.1
     Weighted average price of shares issued . . . . . . . . . . . . . . . . . . . . . .           $10.49      $14.96      $23.38


                                                                       87
NETAPP, INC.
                      NOTES TO CONSOLIDATED FINANCIAL STATEMENTS — (Continued)

   Stock-Based Compensation Expense

    Stock-based compensation expenses included in the consolidated statements of operations for fiscal 2010,
2009 and 2008, respectively, are as follows (in millions):
                                                                                                                        Year Ended
                                                                                                            April 30,    April 24,   April 25,
                                                                                                             2010          2009       2008

       Cost of product revenues . . . . . . . . . . . . . . . . . . . . . . . . . . . . .         ....      $ 4.0         $    3.3   $    3.4
       Cost of service revenues . . . . . . . . . . . . . . . . . . . . . . . . . . . . .         ....       14.3             12.3       10.5
       Sales and marketing. . . . . . . . . . . . . . . . . . . . . . . . . . . . . . . . .       ....       73.7             65.1       65.4
       Research and development . . . . . . . . . . . . . . . . . . . . . . . . . . . .           ....       38.5             37.9       46.6
       General and administrative . . . . . . . . . . . . . . . . . . . . . . . . . . . .         ....       29.3             22.2       22.1
          Total stock-based compensation expense . . . . . . . . . . . . . . . . . . . .                    $159.8        $140.8     $148.0

       The following table summarizes stock-based compensation associated with each type of award (in millions):
                                                                                                                        Year Ended
                                                                                                            April 30,    April 24,   April 25,
                                                                                                             2010          2009       2008

       Employee stock options, RSUs and RSAs. . . . . . . . . . . . . . . . . . . . .                       $125.2        $113.4     $131.4
       ESPP . . . . . . . . . . . . . . . . . . . . . . . . . . . . . . . . . . . . . . . . . . . . . . .     34.3          27.4       16.5
       Change in amounts capitalized in inventory . . . . . . . . . . . . . . . . . . .                        0.3            —         0.1
          Total stock-based compensation expense . . . . . . . . . . . . . . . . . . . .                    $159.8        $140.8     $148.0

     For fiscal 2010, 2009 and 2008, total income tax (charges) benefits associated with employee stock
transactions and recognized in stockholders’ equity were $(0.9) million, $45.4 million and $48.2 million,
respectively.

   Valuation Assumptions

    We estimated the fair value of stock options using the Black-Scholes model on the date of the grant.
Assumptions used in the Black-Scholes valuation model were as follows:
                                                             Stock Options                                                 ESPP
                                                              Year Ended                                                Year Ended
                                                 April 30,     April 24,          April 25,           April 30,          April 24,       April 25,
                                                  2010           2009              2008                2010                2009           2008
Expected term in years .         .   .   .   .      4.5           4.0           4.0           1.3           1.3           1.3
Risk-free interest rate . .      .   .   .   . 1.89% - 2.58% 1.08% - 3.69% 2.04% - 5.02% 0.21% - 0.97% 0.92% - 2.52% 2.36% - 4.95%
Volatility . . . . . . . . . .   .   .   .   . 33% - 49%       38% - 69%     33% - 55%     38% - 47%     39% - 76%     35% - 49%
Expected dividend . . . .        .   .   .   .      0%            0%            0%            0%            0%            0%


   Stock Repurchase Program

     Since the inception of our stock repurchase programs on May 13, 2003 through April 30, 2010, we have
purchased a total of 104.3 million shares of our common stock at an average price of $28.06 per share for an
aggregate purchase price of $2.9 billion. As of April 30, 2010, our Board of Directors had authorized the repurchase
of up to $4.0 billion of common stock under various stock repurchase programs, and $1.1 billion remains available
under these authorizations. The stock repurchase programs may be suspended or discontinued at any time.

                                                                             88
NETAPP, INC.
                   NOTES TO CONSOLIDATED FINANCIAL STATEMENTS — (Continued)

     During fiscal 2010, we did not repurchase any shares of our common stock under the stock repurchase
program. During fiscal 2009, we repurchased 17.0 million shares of our common stock at an aggregate cost of
$400.0 million, or a weighted average price of $23.58 per share. During fiscal 2008, we repurchased 32.8 million
shares of our common stock at an aggregate cost of $903.7 million, or a weighted average price of $27.58 per share.
The repurchases were recorded as treasury stock and resulted in a reduction of stockholders’ equity.

   Preferred Stock
     Our Board of Directors has the authority to issue up to 5.0 million shares of preferred stock and to determine
the price, rights, preferences, privileges, and restrictions, including voting rights, of those shares without any further
vote or action by the stockholders.

   Comprehensive Income (Loss)
     Comprehensive income (loss) consists of net income and other comprehensive income (OCI), which is a
separate component of stockholders’ equity and is disclosed within the consolidated statement of stockholders’
equity and comprehensive income. OCI includes foreign currency translation adjustments, unrealized gains and
losses on derivatives and unrealized gains and losses on our available-for-sale securities, which includes a
temporary impairment charge of $3.3 million, $7.0 million and $3.5 million in fiscal 2010, 2009 and 2008,
respectively, associated with our auction rate securities.
     The components of accumulated other comprehensive income (loss), net of related tax effects, at the end of
each fiscal year, were as follows (in millions):
                                                                                                                 2010   2009     2008

Accumulated translation adjustments. . . . . . . . . . . . . . . . . . . . . . . . . . . . . . . . . . . . . .   $1.2   $(0.3)   $ 4.4
Accumulated unrealized gain (loss) on available-for-sale investments . . . . . . . . . . . . . .                  0.9    (4.4)    (2.3)
Accumulated unrealized gain (loss) on derivatives qualifying as cash flow hedges . . . .                          0.7    (0.5)    (1.3)
Total accumulated other comprehensive income (loss) . . . . . . . . . . . . . . . . . . . . . . . . .            $2.8   $(5.2)   $ 0.8


12.   Derivatives and Hedging Activities
      We use derivative instruments to manage exposures to foreign currency risk. Our primary objective in holding
derivatives is to reduce the volatility of earnings and cash flows associated with changes in foreign currency. The
program is not designated for trading or speculative purposes. Our derivatives expose us to credit risk to the extent
that the counterparties may be unable to meet the terms of the agreement. We seek to mitigate such risk by limiting
our counterparties to major financial institutions. In addition, the potential risk of loss with any one counterparty
resulting from this type of credit risk is monitored on an ongoing basis. We also have in place a master netting
arrangement to mitigate the credit risk of our counterparty and potentially to reduce our losses due to counterparty
nonperformance. All contracts have a maturity of less than six months.
      Our major foreign currency exchange exposures and related hedging programs are described below:
     Balance Sheet. We utilize monthly foreign currency forward and options contracts to hedge exchange rate
fluctuations related to certain foreign monetary assets and liabilities. These derivative instruments do not subject us
to material balance sheet risk due to exchange rate movements because gains and losses on these derivatives are
intended to offset gains and losses on the assets and liabilities being hedged and the net amount is included in
earnings.
     Forecasted Transactions. We use currency forward contracts to hedge exposures related to forecasted sales
denominated in certain foreign currencies. These contracts are designated as cash flow hedges and in general
closely match the underlying forecasted transactions in duration. The contracts are carried on the balance sheet at

                                                                    89
NETAPP, INC.
                    NOTES TO CONSOLIDATED FINANCIAL STATEMENTS — (Continued)

fair value, and the effective portion of the contracts’ gains and losses is recorded as AOCI until the forecasted
transaction occurs. When the forecasted transaction occurs, we reclassify the related gain or loss on the cash flow
hedge to revenues. If the underlying forecasted transactions do not occur, or it becomes probable that they will not
occur, the gain or loss on the related cash flow hedge is recognized immediately in earnings. We measure the
effectiveness of hedges of forecasted transactions on a monthly basis by comparing the fair values of the designated
currency forward contracts with the fair values of the forecasted transactions. Any ineffective portion of the
derivative hedging gain or loss as well as changes in the fair value of the derivative’s time value (which are excluded
from the assessment of hedge effectiveness) is recognized in current period earnings.
     Over the next twelve months, it is expected that $0.7 million of derivative net losses recorded in AOCI as of
April 30, 2010 will be reclassified into earnings as an adjustment to revenues. The maximum length of time over
which forecasted foreign denominated revenues are hedged is six months.
     The notional value of our outstanding currency forward contracts that were entered into to hedge forecasted
foreign denominated sales and our balance sheet monetary asset and liability exposures consisted of the following
(in millions):
                                                                                                                      April 30,     April 24,
                                                                                                                       2010          2009

      Cash Flow Hedges
        Euro. . . . . . . . . . . . . . . . . . . . . . . . . . . . . . . . . . . . . . . . . . . .   ...........     $ 81.0        $ 40.0
        British Pound Sterling. . . . . . . . . . . . . . . . . . . . . . . . . . . . . . .           ...........       18.9          18.5
      Balance Sheet Contracts
        Euro. . . . . . . . . . . . . . . . . . . . . . . . . . . . . . . . . . . . . . . . . . . .   ...........      232.6         126.9
        British Pound Sterling. . . . . . . . . . . . . . . . . . . . . . . . . . . . . . .           ...........       57.0          49.8
        Canadian Dollar . . . . . . . . . . . . . . . . . . . . . . . . . . . . . . . . . . .         ...........       28.1          20.5
        Australian Dollar . . . . . . . . . . . . . . . . . . . . . . . . . . . . . . . . . .         ...........       23.0          24.9
        Other . . . . . . . . . . . . . . . . . . . . . . . . . . . . . . . . . . . . . . . . . . .   ...........       43.6          33.5
     We net derivative assets and liabilities in the consolidated balance sheets to the extent that master netting
arrangements meet the requirements of accounting guidance on balance sheet offsetting.
     The fair value of derivative instruments in our consolidated balance sheets as of April 30, 2010 was as follows
(in millions):
                                                                                            Fair Values of Derivative Instruments
                                                                                      Asset Derivatives               Liability Derivatives
                                                                                                                    Balance
                                                                                 Balance Sheet                        Sheet
                                                                                   Location        Fair Value       Location         Fair Value

Derivatives designated as hedging instruments:
                                                               Other current                                        Other current
Foreign exchange forward contracts . . . . . . . . . . . . . . assets                                    $0.7       liabilities           $ —
Derivatives not designated as hedging instruments:
                                                               Other current                                        Other current
Foreign exchange forward contracts . . . . . . . . . . . . . . assets                                     3.8       liabilities            (3.5)
Total derivatives. . . . . . . . . . . . . . . . . . . . . . . . . . . . .                               $4.5                             $(3.5)


                                                                            90
NETAPP, INC.
                    NOTES TO CONSOLIDATED FINANCIAL STATEMENTS — (Continued)

     The effect of derivative instruments designated as cash flow hedges on our consolidated statements of
operations for fiscal 2010 and 2009 was as follows (in millions):
                                                         Year Ended April 30, 2010                    Year Ended April 24, 2009
                                                Gain (Loss)    Gain (Loss)       Gain (Loss) Gain (Loss)    Gain (Loss)      Gain (Loss)
Derivatives in Cash Flow                       Recognized in Reclassified from Recognized in Recognized Reclassified from Recognized in
Hedging Relationships                             AOCI       AOCI into Income      Income     in AOCI AOCI into Income         Income

Foreign exchange forward
  contracts. . . . . . . . . . . . . . . . .      $(0.5)          $(1.7)              $—             $3.3          $2.5                 $(0.7)
     The effect of derivative instruments not designated as hedges on our consolidated statements of operations for
the year ended April 30, 2010, and April 24, 2009 was as follows (in millions):
                                                                                           Year Ended                     Location of
                                                                                                                          Gain (Loss)
                                                                                April 30, 2010    April 24, 2009         Recognized in
      Derivatives Not Designated as Hedging Instruments                             Gain (Loss) Recognized                  Income

      Foreign exchange forward contracts . . . . . . . . . . . . .                                                      Other income
                                                                                      $8.2              $21.6           (expense), net

13.    Restructuring and Other Charges
     During fiscal 2010, 2009 and 2008, we recorded the restructuring expense primarily related to adjustments to
future lease commitments and employee severance costs associated with our fiscal 2009 restructuring plan.
      Activities related to the restructuring reserves for fiscal 2010, 2009 and 2008 were as follows (in millions):
                                                            Severance-           Contract           Fixed
                                                             Related            Cancellation        Assets   Intangible
                                                             Charges Facilities    Costs     Other Write-off Write-off                    Total

Reserve balance at April 27, 2007 . . . . . . .               $   —          $ 2.1       $ —          $ —       $ —        $     —       $ 2.1
Cash payments . . . . . . . . . . . . . . . . . . . . .           —           (0.6)        —            —         —              —         (0.6)
Restructuring charges . . . . . . . . . . . . . . . .             —            0.4         —            —         —              —          0.4
Reserve balance at April 25, 2008 . . . . . . .                   —            1.9             —         —        —               —          1.9
Restructuring and other charges . . . . . . . . .               28.0           4.5            0.3       2.9      3.8            14.9        54.4
Cash payments . . . . . . . . . . . . . . . . . . . . .        (17.6)         (1.0)          (0.1)     (1.8)      —               —        (20.5)
Non-cash charges . . . . . . . . . . . . . . . . . . .            —            0.3             —        0.1     (3.8)          (14.9)      (18.3)
Foreign currency changes . . . . . . . . . . . . .              (0.1)         (0.2)            —         —        —               —         (0.3)
Reserve balance at April 24, 2009 . . . . . . .                 10.3           5.5            0.2       1.2        —             —          17.2
Adjustments to accrual and other charges . .                     0.6           1.6           (0.1)      0.4        —             —           2.5
Cash payments . . . . . . . . . . . . . . . . . . . . .        (11.1)         (3.3)          (0.1)     (1.5)       —             —         (16.0)
Foreign currency changes . . . . . . . . . . . . .               0.2           0.3             —       (0.1)       —             —           0.4
Reserve balance at April 30, 2010 . . . . . . .               $   —          $ 4.1       $ —          $ —       $ —        $     —       $ 4.1


   Fiscal 2009 Restructuring Plans
     In February 2009, we announced our decision to execute a worldwide restructuring program, which included a
reduction in workforce, the closing or downsizing of certain facilities, and the establishment of a plan to outsource
certain internal activities. In December 2008, we announced our decision to cease the development and availability
of our SnapMirror» for Open Systems product, which was originally acquired through our acquisition of Topio in
fiscal 2007. As part of this decision, we also announced the closure of our engineering facility in Haifa, Israel.

                                                                        91
NETAPP, INC.
                     NOTES TO CONSOLIDATED FINANCIAL STATEMENTS — (Continued)

     As of April 30, 2010, we had approximately $3.6 million of facilities-related lease payments related to these
activities and we expect to be substantially paid by January 2013.

  Fiscal 2002 Restructuring Plan
     As of April 30, 2010, we also have $0.5 million remaining in facility restructuring reserves established as part
of a restructuring plan in fiscal 2002 related to future lease commitments on exited facilities, net of expected
sublease income. We expect to substantially fulfill the remaining contractual obligations related to this facility
restructuring reserve by fiscal 2011.
    Of the reserve balance at April 30, 2010, $2.3 million was included in other accrued liabilities, and the
remaining $1.8 million was classified as other long-term obligations.

14.   Income Taxes
      Income before income taxes is as follows (in millions):
                                                                                                                         Year Ended
                                                                                                             April 30,    April 24,    April 25,
                                                                                                              2010          2009        2008

      Domestic . . . . . . . . . . . . . . . . . . . . . . . . . . . . . . . . . . . . . . . . . . . . .     $ 60.2       $(250.9)     $ 45.8
      Foreign . . . . . . . . . . . . . . . . . . . . . . . . . . . . . . . . . . . . . . . . . . . . . .     386.8         259.2       336.9
         Total . . . . . . . . . . . . . . . . . . . . . . . . . . . . . . . . . . . . . . . . . . . . . .   $447.0       $     8.3    $382.7

      The provision for (benefit from) income taxes consists of the following (in millions):
                                                                                                                         Year Ended
                                                                                                             April 30,    April 24,    April 25,
                                                                                                              2010          2009        2008

      Current:
        Federal . . . . . . . . . . . . . . . . . . . . . . . . . . . . . . . . . . . . . . . . . . . .      $ 33.6       $ 16.2       $ 48.8
        State . . . . . . . . . . . . . . . . . . . . . . . . . . . . . . . . . . . . . . . . . . . . . .       1.5         40.8         23.8
        Foreign . . . . . . . . . . . . . . . . . . . . . . . . . . . . . . . . . . . . . . . . . . . .        22.8         11.2         17.8
         Total current . . . . . . . . . . . . . . . . . . . . . . . . . . . . . . . . . . . . . . . .          57.9          68.2        90.4
      Deferred:
        Federal . . . . . . . . . . . . . . . . . . . . . . . . . . . . . . . . . . . . . . . . . . . .         (4.6)         (78.7)       7.1
        State . . . . . . . . . . . . . . . . . . . . . . . . . . . . . . . . . . . . . . . . . . . . . .       (2.9)         (52.0)     (20.4)
        Foreign . . . . . . . . . . . . . . . . . . . . . . . . . . . . . . . . . . . . . . . . . . . .         (3.8)           6.2       (4.1)
         Total deferred . . . . . . . . . . . . . . . . . . . . . . . . . . . . . . . . . . . . . . .          (11.3)      (124.5)       (17.4)
            Provision for (benefit from) income taxes . . . . . . . . . . . . . . . . .                      $ 46.6       $ (56.3)     $ 73.0


                                                                             92
NETAPP, INC.
                   NOTES TO CONSOLIDATED FINANCIAL STATEMENTS — (Continued)

    The provision (benefit) for income taxes differs from the amount computed by applying the statutory federal
income tax rate as follows (in millions):
                                                                                                                      Year Ended
                                                                                                          April 30,    April 24,   April 25,
                                                                                                           2010          2009       2008

    Tax computed at federal statutory rate . . . . . . . . . . . . . . . . . . . . . . .                  $ 156.5      $ 2.9       $133.9
    State income taxes, net of federal benefit . . . . . . . . . . . . . . . . . . . . .                      2.6        (7.9)        2.2
    Federal credits . . . . . . . . . . . . . . . . . . . . . . . . . . . . . . . . . . . . . . . . .        (7.8)       (9.2)       (4.7)
    Stock-based compensation . . . . . . . . . . . . . . . . . . . . . . . . . . . . . . . .                 (2.6)       10.2        11.0
    Foreign earnings in lower tax jurisdiction . . . . . . . . . . . . . . . . . . . . .                   (105.2)      (51.0)      (67.5)
    Other . . . . . . . . . . . . . . . . . . . . . . . . . . . . . . . . . . . . . . . . . . . . . . .       3.1        (1.3)       (1.9)
    Provision for (benefit from) income taxes . . . . . . . . . . . . . . . . . . . . .                   $ 46.6       $(56.3)     $ 73.0

     The income tax benefits (charges) associated with dispositions from employee stock transactions were
recognized as additional paid-in capital (in millions):
                                                                                                                      Year Ended
                                                                                                          April 30,    April 24,   April 25,
                                                                                                           2010          2009       2008

    Income tax benefits (charges) . . . . . . . . . . . . . . . . . . . . . . . . . . . . . .              $(0.9)       $45.4       $48.2
    The components of our deferred tax assets and liabilities are as follows (in millions):
                                                                                                                            Year Ended
                                                                                                                       April 30,   April 24,
                                                                                                                        2010         2009

    Deferred Tax Assets:
    Inventory reserves and capitalization . . . . . . . . . . . . . . . . . . . . . .                 ...........      $  5.1      $ 4.9
    Reserves and accruals not currently deductible . . . . . . . . . . . . . .                        ...........        49.1       113.3
    Net operating loss and credit carryforwards . . . . . . . . . . . . . . . . .                     ...........        75.3        63.6
    Stock-based compensation . . . . . . . . . . . . . . . . . . . . . . . . . . . . .                ...........        90.2        77.8
    Deferred revenue . . . . . . . . . . . . . . . . . . . . . . . . . . . . . . . . . . . .          ...........       168.7       154.3
    Capitalized research and development expenditures . . . . . . . . . . .                           ...........         6.6         6.7
    Investment losses . . . . . . . . . . . . . . . . . . . . . . . . . . . . . . . . . . . .         ...........         2.4         2.3
    Conditional royalty. . . . . . . . . . . . . . . . . . . . . . . . . . . . . . . . . . .          ...........        13.6        13.5
    Other . . . . . . . . . . . . . . . . . . . . . . . . . . . . . . . . . . . . . . . . . . . . .   ...........         1.0         0.2
    Gross deferred tax assets . . . . . . . . . . . . . . . . . . . . . . . . . . . . . . . . . . . . . . . . .         412.0        436.6
    Valuation allowance . . . . . . . . . . . . . . . . . . . . . . . . . . . . . . . . . . . . . . . . . . . . .       (28.3)       (28.0)
      Total deferred tax assets . . . . . . . . . . . . . . . . . . . . . . . . . . . . .             ...........       383.7        408.6
    Deferred Tax Liabilities:
    Depreciation . . . . . . . . . . . . . . . . . . . . . . . . . . . . . . . . . . . . . . .        ...........           8.0       (7.1)
    Acquisition intangibles . . . . . . . . . . . . . . . . . . . . . . . . . . . . . . . .           ...........           8.5       15.0
    Convertible Notes. . . . . . . . . . . . . . . . . . . . . . . . . . . . . . . . . . . .          ...........          35.2         —
    Other . . . . . . . . . . . . . . . . . . . . . . . . . . . . . . . . . . . . . . . . . . . . .   ...........          (1.0)      15.7
       Total deferred tax liabilities . . . . . . . . . . . . . . . . . . . . . . . . . . . . . . . . . . . . .            50.7       23.6
    Net deferred tax assets . . . . . . . . . . . . . . . . . . . . . . . . . . . . . . . . . . . . . . . . . . .      $333.0      $385.0

                                                                           93
NETAPP, INC.
                  NOTES TO CONSOLIDATED FINANCIAL STATEMENTS — (Continued)

     Current and noncurrent net deferred tax assets for fiscal 2010 and 2009 are as follows (in millions):
                                                                                                                       Year Ended
                                                                                                                  April 30,   April 24,
                                                                                                                   2010         2009

     Current net deferred tax assets . . . . . . . . . . . . . . . . . . . . . . . . . . . . . . . . . . . . .    $ 69.6      $207.1
     Noncurrent deferred tax assets . . . . . . . . . . . . . . . . . . . . . . . . . . . . . . . . . . . . .      263.4       192.5
     Noncurrent deferred tax liabilities . . . . . . . . . . . . . . . . . . . . . . . . . . . . . . . . . . .        —        (14.6)

    The valuation allowance increased by $0.3 million and $0.5 million in fiscal 2010 and 2009, respectively,
primarily due to a change in the blended state tax rates.

     A reconciliation of the beginning and ending amount of unrecognized tax benefits is as follows (in millions):
                                                                                                                 Year Ended
                                                                                                  April 30,       April 24,   April 25,
                                                                                                   2010             2009       2008

     Balance at beginning of period . . . . . . . . . . . . . . . . . . . . . . . . .    ....      $110.1         $ 97.8       $58.3
     Additions based on tax positions related to the current year . . .                  ....        34.9           13.8        21.2
     Additions for tax positions of prior years . . . . . . . . . . . . . . . . .        ....         3.7            0.7        18.3
     Decreases in tax positions of prior years . . . . . . . . . . . . . . . . . .       ....       (14.2)          (2.2)         —
     Balance at end of period . . . . . . . . . . . . . . . . . . . . . . . . . . . . . . . . .    $134.5         $110.1       $97.8

     Of the $134.5 million unrecognized tax benefits at April 30, 2010, $122.4 million has been recorded and
included in other long-term liabilities, of which $96.3 million, if recognized, would affect our provision for income
taxes.

     We recognize accrued interest and penalties related to unrecognized foreign tax benefits in the income tax
provision. During the fiscal years ended 2005 through 2010, we recognized total accrued interest and penalties of
approximately $0.8 million and have included this accrual in our liability for unrecognized tax benefits.

     During fiscal 2010, we recorded $32.1 million charge to additional paid in capital related to the establishment
of a $26.1 million tax reserve to provide for the uncertainty relating to the tax treatment of the termination of the
Lehman Brothers bond hedge, as well a $6.0 million deferred tax liability for related temporary tax return
differences in the valuation of the convertible debt as a result of the transaction.

     We are subject to taxation in the United States, various states, and several foreign jurisdictions.

     The tax years that remain subject to examination for our major tax jurisdictions are shown below:

  Tax Years Subject to Examination for Major Tax Jurisdictions at April 30, 2010
     2003 — 2009 . . . . . . . . . . . . . . . . . . . . . .   ..........        United States — federal income tax
     2003 — 2009 . . . . . . . . . . . . . . . . . . . . . .   ..........        United States — state and local income tax
     2004 — 2009 . . . . . . . . . . . . . . . . . . . . . .   ..........        Australia
     2004 — 2009 . . . . . . . . . . . . . . . . . . . . . .   ..........        Germany
     2005 — 2009 . . . . . . . . . . . . . . . . . . . . . .   ..........        India
     2006 — 2009 . . . . . . . . . . . . . . . . . . . . . .   ..........        Japan
     2005 — 2009 . . . . . . . . . . . . . . . . . . . . . .   ..........        The Netherlands
     2004 — 2009 . . . . . . . . . . . . . . . . . . . . . .   ..........        United Kingdom

                                                                     94
NETAPP, INC.
                 NOTES TO CONSOLIDATED FINANCIAL STATEMENTS — (Continued)

     In addition, we are effectively subject to federal tax examination adjustments for tax years ended on or after
fiscal year 2000, in that we have net operating loss carryforwards from these years that could be subject to
adjustment, if and when utilized.

     We are currently undergoing federal and state income tax audits in the United States and several foreign tax
jurisdictions. The rights to some of our intellectual property (“IP”) are owned by certain of our foreign subsidiaries,
and payments are made between foreign and U.S. tax jurisdictions relating to the use of this IP in a qualified cost
sharing arrangement. Recently, several other U.S. companies have had their foreign IP arrangements challenged as
part of IRS examinations, which have resulted in material proposed assessments and/or pending litigation. Effective
September 27, 2007, the IRS’s Large and Mid-Sized Business Division (“LMSB”) released a Coordinated Issues
Paper (“CIP”) with respect to qualified cost sharing arrangements (“CSAs”). Specifically, this CIP provides
guidance to IRS personnel concerning methods that may be applied to evaluate the arm’s length charge (buy-in
payment) for internally developed (pre-existing) as well as acquisition-related intangible property that is made
available to a qualified CSA. During fiscal year 2009 we received Notices of Proposed Adjustments from the IRS in
connection with a federal income tax audit of our fiscal 2003 and 2004 tax year tax returns. We recently filed a
protest with the IRS in response to the Notices of Proposed Adjustments. The Notices of Proposed Adjustments
focus primarily on issues of the timing and the amount of income recognized and deductions taken during the audit
years and on the level of cost allocations made to foreign operations during the audit years. If upon the conclusion of
these audits the ultimate determination of our taxes owed in any of these tax jurisdictions is for an amount in excess
of the tax provision we have recorded in the applicable period or subsequently reserved for, our overall tax provision
and effective tax rate may be adversely impacted. It is reasonably possible the company will reach a final settlement
with the IRS on the 2003 — 2004 audit within the next twelve months.

      On March 22, 2010, the United States Court of Appeals for the Ninth Circuit held in Xilinx Inc. v.
Commissioner that pre-2004 cost sharing regulations do not require stock-based compensation to be included
in the research and development cost base of companies that have entered into a CSA and, therefore, the stock-based
compensation does not have to be allocated among the participants. The Court’s ruling impacts our estimate of tax
benefits required to be recognized under accounting guidance. As a result of the revised ruling, we released the
liability established in our first quarter of fiscal 2010 of $38.6 million in the fourth quarter of fiscal 2010. For fiscal
2010, there was no net income tax expense impact.

     We do not include unrealized stock option attributes as components of our gross deferred tax assets and
corresponding valuation allowance disclosures. The tax effected amounts of gross unrealized net operating loss and
business tax credit carryforwards, and their corresponding valuation allowance have been excluded as of April 30,
2010 are $358.6 million, which will result in additional paid in capital if and when realized as a reduction in taxes
otherwise paid.

    As of April 30, 2010, the amount of accumulated unremitted earnings from our foreign subsidiaries is
approximately $1,181.0 million.

      Network Appliance Systems India Pvt. Ltd., our Indian subsidiary, received a tax holiday from the Indian tax
authorities attributed to its call center and research and development activities effective June 6, 2003. These
activities qualify under the Software Technology Park of India (“STPI”) incentive for the development and
manufacture of computer software and information technology enabled services. Under this tax holiday, net taxable
income derived from call center and research and development activities is exempt from Indian taxation. This tax
holiday is set to expire on March 31, 2011. Notwithstanding qualification for this tax holiday, minimum alternate
tax rules in India effective for us as of fiscal 2009 override the full tax exemption. For fiscal 2010, we were subject to
a minimum alternate tax on this income in India at a rate of 16.99%. The minimum alternate tax paid is eligible for
credit against regular tax paid in future years. The credits may be carried forward for ten years.

                                                            95
NETAPP, INC.
                     NOTES TO CONSOLIDATED FINANCIAL STATEMENTS — (Continued)

    In April 2010 our Dutch subsidiary received a favorable tax ruling from the Dutch tax authorities effective
May 1, 2010 that replaces the previous Dutch tax ruling that expired on April 30, 2010. This ruling results in both a
lower level of earnings subject to tax in the Netherlands and an extension of the expiration date to April 30, 2015.

     As of April 30, 2010, the federal, and state net operating loss carryforwards for income tax purposes were
approximately $793.5 million and $170.0 million, respectively. The federal net operating loss carryforwards will
begin to expire in fiscal 2021. State net operating losses of $6.4 million will expire in fiscal years 2011 through
2013; $10.6 million will expire in fiscal year 2014 while the remaining $152.9 million will expire in fiscal years
2015 through 2030.

      As of April 30, 2010, we had federal and state tax credit carryforwards of approximately $90.1 million and
$82.0 million, respectively, available to offset future income tax liabilities. Federal tax credit carryforwards of
$49.6 million will begin to expire in fiscal years 2015 through 2022, while the remaining $40.4 million will expire
in fiscal years beginning 2023. State tax credits of $0.04 million will expire in fiscal years 2011 through 2013, while
the remaining $81.9 million is available indefinitely to reduce cash taxes otherwise payable. As discussed above,
most of the net operating loss and tax credit carryovers, if realized, will be recognized as additional paid in capital in
that they are employee stock option tax attributes.


15.   Net Income per Share

      The following is a calculation of basic and diluted net income per share for the periods presented (in millions):
                                                                                                                        Year Ended
                                                                                                            April 30,    April 24,   April 25,
                                                                                                             2010          2009       2008

      Net Income. . . . . . . . . . . . . . . . . . . . . . . . . . . . . . . . . . . . . . . . . . .       $400.4       $ 64.6      $309.7
      Weighted average shares:
        Weighted average common shares outstanding . . . . . . . . . . . . . . .                             339.7        330.4       351.9
        Weighted average common shares outstanding subject to
          repurchase . . . . . . . . . . . . . . . . . . . . . . . . . . . . . . . . . . . . . . . .           (0.1)        (0.1)       (0.2)
         Shares used in basic computation . . . . . . . . . . . . . . . . . . . . . . . . .                  339.6        330.3       351.7
         Weighted average common shares outstanding subject to
           repurchase . . . . . . . . . . . . . . . . . . . . . . . . . . . . . . . . . . . . . . . .           0.1          0.1         0.2
         Dilutive potential shares related to employee equity award plans . .                                  13.2          4.2         9.2
         Dilutive impact of assumed conversion of Notes . . . . . . . . . . . . . .                             0.3          —           —
         Shares used in diluted computation . . . . . . . . . . . . . . . . . . . . . . . .                  353.2        334.6       361.1
      Net Income per Share:
        Basic . . . . . . . . . . . . . . . . . . . . . . . . . . . . . . . . . . . . . . . . . . . . . .   $ 1.18       $ 0.20      $ 0.88
         Diluted . . . . . . . . . . . . . . . . . . . . . . . . . . . . . . . . . . . . . . . . . . . .    $ 1.13       $ 0.19      $ 0.86

     The following potential weighted average common shares have been excluded from the diluted net income per
share calculations, as their effect would have been antidilutive (in millions):
                                                                                                                        Year Ended
                                                                                                            April 30,    April 24,   April 25,
                                                                                                             2010          2009       2008

      Options and RSUs . . . . . . . . . . . . . . . . . . . . . . . . . . . . . . . . . . . . . .           19.3         61.1        39.3

                                                                            96
NETAPP, INC.
                     NOTES TO CONSOLIDATED FINANCIAL STATEMENTS — (Continued)

     Dilutive shares outstanding for fiscal years 2010 and 2009 do not include any effect resulting from the warrants
issued in June 2008, and for fiscal year 2009 do not include any effect resulting from assumed conversion of the
Notes, as their impact would be anti-dilutive.


16.   Segment, Geographic, and Significant Customer Information

     We operate in one reportable industry segment: the design, manufacturing, marketing, and technical support of
high-performance networked storage solutions. Our company conducts business globally and is primarily managed
on a geographic basis. Our management reviews financial information presented on a consolidated basis,
accompanied by disaggregated information it receives from its internal management system about revenues by
geographic region, based on the location from which the customer relationship is managed, for purposes of
allocating resources and evaluating financial performance. We do not allocate costs of revenues, research and
development, sales and marketing, or general and administrative expenses to our geographic regions in this internal
management system because management does not review operations or operating results, or make planning
decisions, below the consolidated entity level.

    Summarized revenues by geographic region for fiscal 2010, 2009 and 2008, based on the our internal
management system and as utilized by our Chief Executive Officer, who is considered our Chief Operating Decision
Maker (CODM), is as follows (in millions):
                                                                                                                        Year Ended
                                                                                                        April 30,        April 24,      April 25,
                                                                                                         2010              2009          2008

      Americas (United States, Canada and Latin America)* . . . . . . . . . $2,208.1                                        $1,805.2    $1,829.4
      Europe, Middle East and Africa . . . . . . . . . . . . . . . . . . . . . . . . .       1,329.1                         1,213.3     1,083.8
      Asia Pacific and Japan . . . . . . . . . . . . . . . . . . . . . . . . . . . . . . . .   394.2                           387.9       390.0
         Net revenues . . . . . . . . . . . . . . . . . . . . . . . . . . . . . . . . . . . . . . $3,931.4                  $3,406.4    $3,303.2


* Sales to the United States accounted for 89%, 90% and 91% of Americas’ revenues in fiscal 2010, 2009 and 2008,
  respectively.

     The majority of our assets, excluding cash and cash equivalents and investments and accounts receivable, as of
April 30, 2010 and April 24, 2009 were attributable to our U.S. operations. Our total cash and cash equivalents and
investments held outside of the United States in various foreign subsidiaries was $1.7 billion and $1.3 billion as
April 30, 2010 and April 24, 2009, respectively, and the remaining $2.1 billion and $1.4 billion at the respective year
ends was held in the United States.

     With the exception of property and equipment, we do not identify or allocate our long-lived assets by
geographic area. The following table presents property and equipment information for geographic areas based on
the physical location of the assets (in millions):
                                                                                                                                  Year Ended
                                                                                                                             April 30,   April 24,
                                                                                                                              2010         2009

      United States . . . . . . . . . . . . . . . . . . . . . . . . . . . . . . . . . . . . . . . . . . . . . . . . . .       $735.0     $767.9
      International . . . . . . . . . . . . . . . . . . . . . . . . . . . . . . . . . . . . . . . . . . . . . . . . . . .       69.4       40.0
         Total property and equipment . . . . . . . . . . . . . . . . . . . . . . . . . . . . . . . . . . . .                 $804.4     $807.9

      No single foreign country represented more than 10% of total property and equipment.

                                                                            97
NETAPP, INC.
                     NOTES TO CONSOLIDATED FINANCIAL STATEMENTS — (Continued)

     International sales to single foreign countries which accounted for ten percent or more of net revenues were as
follows (in millions, except percentages):
                                                                                                                Year Ended
                                                                                           April 30,         % of      April 24,         % of
                                                                                            2010           Revenues      2009           Revenues

      Germany . . . . . . . . . . . . . . . . . . . . . . . . . . . . . . . . . . . .       $441.1             11%         $380.2          11%

      No single foreign country accounted for ten percent or more of net revenues in fiscal 2008.

     Sales to customers, who are distributors, for fiscal 2010 and 2009, were as follows (in millions, except
percentages):
                                                                                                                Year Ended
                                                                                           April 30,         % of      April 24,         % of
                                                                                            2010           Revenues      2009           Revenues

      Arrow . . . . . . . . . . . . . . . . . . . . . . . . . . . . . . . . . . . . . .     $550.7             14%         $360.3          11%
      Avnet . . . . . . . . . . . . . . . . . . . . . . . . . . . . . . . . . . . . . .      444.0             11%          356.4          10%

      No customer accounted for ten percent or more of our net revenues during fiscal 2008.

     The following customers accounted for ten percent or more of net accounts receivable as of April 30, 2010 (in
millions):
                                                                                                                                         % of
                                                                                                                          April 30,    Accounts
                                                                                                                           2010        Receivable

      Arrow . . . . . . . . . . . . . . . . . . . . . . . . . . . . . . . . . . . . . . . . . . . . . . . . . . . . . .    $48.7          10%

      No customer accounted for ten percent or more of net accounts receivable as of April 24, 2009.


17.   Employee Benefits and Deferred Compensation

  Employee 401(k) Plans

     We have established a 401(k) tax-deferred savings plan. Employees meeting the eligibility requirements, as
defined, may contribute specified percentages of their salaries. In 2010, 2009 and 2008, we matched 50% of the
employee’s contribution up to a total of 6% of the employee’s annual salary, and the matched contributions are
vested over 3 years. The amounts we contributed to this plan were as follows (in millions):
                                                                                                                          Year Ended
                                                                                                            April 30,      April 24,    April 25,
                                                                                                             2010            2009        2008

      401(k) contributions. . . . . . . . . . . . . . . . . . . . . . . . . . . . . . . . . . . . .            $9.2          $13.6       $12.2


  Deferred Compensation Plans

     We have a non-qualified deferred compensation plan that allows a group of employees within the United States
to contribute base salary and/or incentive compensation on a tax deferred basis in excess of the IRS limits imposed
on 401(k) plans. The amounts of the marketable securities related to investments in debt and equity securities that

                                                                            98
NETAPP, INC.
                    NOTES TO CONSOLIDATED FINANCIAL STATEMENTS — (Continued)

are held in a rabbi trust under non-qualified deferred compensation plans and the related deferred compensation
liability under this plan, which are recorded primarily in other long-term liabilities were as follows (in millions):
                                                                                                                             Year Ended
                                                                                                                        April 30,   April 24,
                                                                                                                         2010         2009

      Marketable securities . . . . . . . . . . . . . . . . . . . . . . . . . . . . . . . . . . . . . . . . . . . .      $12.6        $7.9
      Deferred compensation liabilities reported as:
      Other current liabilities . . . . . . . . . . . . . . . . . . . . . . . . . . . . . . . . . . . . . . . . . . .      2.3         0.9
      Other long-term liabilities . . . . . . . . . . . . . . . . . . . . . . . . . . . . . . . . . . . . . . . . .       10.3         7.0

  Postretirement Health Care Plan

      We maintain a plan to provide postretirement health and welfare benefits to certain executives who meet
certain age and service requirements. Coverage continues through the duration of the lifetime of the retiree or the
retiree’s spouse, whichever is longer. There is no funding requirement associated with the plan and none of the
benefit obligation was funded as of April 30, 2010. The accumulated postretirement benefit obligation of
$4.8 million as of April 30, 2010 has been classified in other long term liabilities in the accompanying consolidated
balance sheets. Assumed health care cost trend rates have a significant effect on the amounts reported for the health
care plan.

18.   Commitments and Contingencies

      Operating Leases — We lease office space in several U.S. locations. Outside the United States, larger leased
sites include sites in The Netherlands, Australia, Belgium, France, Germany, India, Japan, and the United Kingdom.
We also lease equipment and vehicles.

      As of April 30, 2010, we have four leasing arrangements (Leasing Arrangements 1, 2, 3 and 4) for facilities in
Sunnyvale, California with BNPPLC which require us to lease certain of our land to BNPPLC for a period of
99 years, and to lease approximately 0.6 million square feet of office space for our headquarters in Sunnyvale
costing up to $149.6 million. Under these leasing arrangements, we pay BNPPLC minimum lease payments, which
vary based on LIBOR plus a spread or a fixed rate on the costs of the facilities on the respective lease
commencement dates. We make payments for each of the leases for a term of five years. We have the option
to renew each of the leases for two consecutive five-year periods upon approval by BNPPLC. Upon expiration (or
upon any earlier termination) of the lease terms, we must elect one of the following options: (i) purchase the
buildings from BNPPLC at cost; (ii) if certain conditions are met, arrange for the sale of the buildings by BNPPLC
to a third party for an amount equal to at least 85% of the costs (residual guarantee), and be liable for any deficiency
between the net proceeds received from the third party and such amounts; or (iii) pay BNPPLC supplemental
payments for an amount equal to at least 85% of the costs (residual guarantee), in which event we may recoup some
or all of such payments by arranging for a sale of each or all buildings by BNPPLC during the ensuing two-year
period. The following table summarizes the costs, the residual guarantee, the applicable LIBOR plus spread or fixed
rate at April 30, 2010, and the date we began to make payments for each of our leasing arrangements (in millions):
                                                                                LIBOR
                                                                                  Plus                         Lease
   Leasing                                           Residual                  Spread or                    Commencement
Arrangements                   Cost                 Guarantee                  Fixed Rate                       Date                          Term

      1                       $48.5                   $41.2                       3.99%                     January      2008             5   years
      2                       $80.0                   $68.0                       1.08%                   December       2007             5   years
      3                       $10.5                   $ 8.9                       3.97%                   December       2007             5   years
      4                       $10.6                   $ 9.0                       3.99%                   December       2007             5   years

                                                                          99
NETAPP, INC.
                   NOTES TO CONSOLIDATED FINANCIAL STATEMENTS — (Continued)

     These leases require us to maintain specified financial covenants with which we were in compliance as of
April 30, 2010. Such financial covenants include a maximum ratio of Total Debt to Earnings before Interest, Taxes,
Depreciation and Amortization and a minimum amount of Unencumbered Cash and Short-Term Investments.

     Future annual minimum lease payments under all noncancelable operating leases with an initial term in excess
of one year as of April 30, 2010 are as follows (in millions):
                                                            2011        2012         2013             2014       2015      Thereafter        Total

Office operating lease payments . . . . . . .          . $26.7         $22.3        $ 17.8        $15.1        $13.0         $20.4       $115.3
Real estate lease payments . . . . . . . . . . .       .   3.6           3.6         129.5           —            —            —          136.7
Equipment operating lease payments . . .               . 24.3           10.7           4.6          0.4           —            —           40.0
Less: Sublease income . . . . . . . . . . . . . .      .  (5.8)         (0.8)         (0.6)        (0.4)        (0.2)          —           (7.8)
Total lease commitments . . . . . . . . . . . . . $48.8                $35.8        $151.3        $15.1        $12.8         $20.4       $284.2

     Included in real estate lease payments pursuant to four financing arrangements with BNP Paribas Leasing
Corporation (BNPPLC) are (i) lease commitments of $3.6 million in each of the fiscal years 2011 and 2012;
$2.4 million in fiscal 2013, which are based on the LIBOR rate at April 30, 2010 plus a spread or a fixed rate, for
terms of five years; and (ii) at the expiration or termination of the lease, a supplemental payment obligation equal to
our minimum guarantee of $127.1 million in the event that we elect not to purchase or arrange for sale of the
buildings.

     In fiscal 2010, we determined that it was probable that the fair value of the properties under synthetic lease
would be below the guaranteed residual at the end of the initial lease terms. Our current estimate of this shortfall is
$36.9 million. We are accruing for this deficiency over the remaining initial terms of the respective leases of thirty-
two months.

     Rent expense in fiscal 2010, 2009 and 2008 was as follows (in millions):
                                                                                                                    Year Ended
                                                                                                        April 30,    April 24,    April 25,
                                                                                                         2010          2009        2008

     Facilities rent expense . . . . . . . . . . . . . . . . . . . . . . . . . . . . . . . . . . .      $ 43.2          $ 40.6       $33.7
     Equipment rent expense . . . . . . . . . . . . . . . . . . . . . . . . . . . . . . . . . .           23.4            25.3        16.4
                                                                                                        $ 66.6          $ 65.9       $50.1
     Less: sublease income . . . . . . . . . . . . . . . . . . . . . . . . . . . . . . . . . . .         (12.5)          (11.8)       (4.1)
     Net rent expense . . . . . . . . . . . . . . . . . . . . . . . . . . . . . . . . . . . . . . .     $ 54.1          $ 54.1       $46.0


  Purchase Orders and Other Commitments

      In the normal course of business we make commitments to our third party contract manufacturers, to manage
manufacturer lead times and meet product forecasts, and to other parties, to purchase various key components used
in the manufacture of our products. We establish accruals for estimated losses on purchased components for which
we believe it is probable that they will not be utilized in future operations. To the extent that such forecasts are not
achieved, our commitments and associated accruals may change. We had $148.0 million in non-cancelable
purchase commitments with our contract manufacturers as of April 30, 2010. In addition, were recorded a liability
for firm non-cancelable and unconditional purchase commitments with contract manufacturers for quantities in
excess of our future demand forecasts. As of April 30, 2010 and April 24, 2009, such liability amounted to
$3.8 million and $3.2 million, respectively, and is included in other current liabilities in the consolidated balance
sheets.

                                                                       100
NETAPP, INC.
                  NOTES TO CONSOLIDATED FINANCIAL STATEMENTS — (Continued)

     In addition to commitments with contract manufacturers and component suppliers, we have open purchase
orders and contractual obligations associated with our ordinary course of doing business for which we have not
received goods or services. We had $63.3 million in purchase commitments as of April 30, 2010.
      During the ordinary course of business, we provide standby letters of credit or other guarantee instruments to
third parties as required for certain transactions initiated either by us or our subsidiaries. As of April 30, 2010, our
financial guarantees of $5.1 million that were not recorded on our balance sheet consisted of standby letters of credit
related to workers’ compensation, a customs guarantee, a corporate credit card program, foreign rent guarantees and
surety bonds.

  Product Warranties
    We provide customers a warranty on software of ninety days and a warranty on hardware with terms ranging
from one to three years. Following is an analysis of our warranty reserves (in millions):
                                                                                                                        Year Ended
                                                                                                                   April 30,   April 24,
                                                                                                                    2010         2009

     Warranty reserve at beginning of period . . . . . . . . . . . . . . . . . . . . . . . . . . . . . .           $ 42.3       $ 42.8
     Expense accrued during the period . . . . . . . . . . . . . . . . . . . . . . . . . . . . . . . . . .           16.0         25.9
     Warranty costs incurred . . . . . . . . . . . . . . . . . . . . . . . . . . . . . . . . . . . . . . . . . .    (26.4)       (26.4)
     Warranty reserve at end of period . . . . . . . . . . . . . . . . . . . . . . . . . . . . . . . . . . .       $ 31.9       $ 42.3


  Financing Guarantees
     We have both nonrecourse and recourse lease financing arrangements with third-party leasing companies
through new and preexisting relationships with customers. In addition, from time to time we provide guarantees for
a portion of other financing arrangements under which we could be called upon to make payments to our third-party
funding companies in the event of nonpayment by end-user customers. Under the terms of the nonrecourse leases,
we do not have any continuing obligations or liabilities to the third-party leasing companies. Under the terms of the
recourse leases, which are generally three years or less, we remain liable for the aggregate unpaid remaining lease
payments to the third-party leasing companies in the event of end-user customer default. These arrangements are
generally collateralized by a security interest in the underlying assets. Where we provide a guarantee, we defer the
revenues associated with the end-user financing arrangement in accordance with our revenue recognition policies.
As of April 30, 2010, the maximum guaranteed payment contingencies under our financing arrangements totaled
approximately $76.7 million; and the related deferred revenue and cost of revenues totaled approximately
$81.5 million and $9.7 million, respectively. To date, we have not experienced material losses under our lease
financing programs or other financing arrangements.

  Indemnification Agreements
      We enter into standard indemnification agreements in the ordinary course of business. Pursuant to these
agreements, we agree to defend and indemnify other parties, primarily our customers or business partners or
subcontractors, for damages and reasonable costs incurred in any suit or claim brought against them alleging that
our products sold to them infringe any U.S. patent, copyright, trade secret, or similar right. If a product becomes the
subject of an infringement claim, we may, at our option: (i) replace the product with another noninfringing product
that provides substantially similar performance; (ii) modify the infringing product so that it no longer infringes but
remains functionally equivalent; (iii) obtain the right for the customer to continue using the product at our expense
and for the reseller to continue selling the product; (iv) take back the infringing product and refund to customer the
purchase price paid less depreciation amortized on a straight-line basis. We have not been required to make material
payments pursuant to these provisions historically. We have not recorded any liability at April 30, 2010 related to

                                                                      101
NETAPP, INC.
                    NOTES TO CONSOLIDATED FINANCIAL STATEMENTS — (Continued)

these guarantees since the maximum amount of potential future payments under such guarantees, indemnities and
warranties is not determinable, other than as described above.


  Legal Contingencies

      We are subject to various legal proceedings and claims which may arise in the normal course of business.

     On September 5, 2007, we filed a patent infringement lawsuit in the Eastern District of Texas seeking
compensatory damages and a permanent injunction against Sun Microsystems. On October 25, 2007,
Sun Microsystems filed a counter claim against us in the Eastern District of Texas seeking compensatory damages
and a permanent injunction. On October 29, 2007, Sun filed a second lawsuit against us in the Northern District of
California asserting additional patents against us. The Texas court granted a joint motion to transfer the Texas
lawsuit to the Northern District of California on November 26, 2007. On March 26, 2008, Sun filed a third lawsuit in
federal court that extends the patent infringement charges to storage management technology we acquired in
January 2008.

      In January 2010, Oracle acquired Sun. The three lawsuits are currently in the discovery and motion phase and
no trial dates have been set, so we are unable at this time to determine the likely outcome of these various patent
litigations. Since we are unable to reasonably estimate the amount or range of any potential settlement, no accrual
has been recorded as of April 30, 2010.


19.   Selected Quarterly Financial Data (Unaudited)
                                                                                                         Year Ended April 30, 2010
                                                                                               Q1           Q2          Q3              Q4

      Net revenues . . . . . . . . . . . . . . . . . . . . . . . . . . . . . .     . . . $838.0           $910.0     $1,011.7        $1,171.7
      Gross profit . . . . . . . . . . . . . . . . . . . . . . . . . . . . . . .   . . . 522.5             606.7        641.5           748.5
      Net income . . . . . . . . . . . . . . . . . . . . . . . . . . . . . . .     ...     51.7             95.7        107.9           145.1
      Net income per share, basic . . . . . . . . . . . . . . . . . . .            ...     0.15             0.28         0.32            0.42
      Net income per share, diluted . . . . . . . . . . . . . . . . . .            ...     0.15             0.27         0.30            0.40

                                                                                                           Year Ended April 24, 2009
                                                                                                    Q1          Q2         Q3           Q4

      Net revenues . . . . . . . . . . . . . . . . . . . . . . . . . . . . . . . . . . . .      $868.8        $911.6     $746.3        $879.7
      Gross profit . . . . . . . . . . . . . . . . . . . . . . . . . . . . . . . . . . . . .     516.6         546.2      393.2         533.9
      Net income (loss) . . . . . . . . . . . . . . . . . . . . . . . . . . . . . . . .           34.7          43.1      (81.6)         68.4
      Net income (loss) per share, basic . . . . . . . . . . . . . . . . . . . .                  0.10          0.13      (0.25)         0.21
      Net income (loss) per share, diluted . . . . . . . . . . . . . . . . . . .                  0.10          0.13      (0.25)         0.21


20.   Subsequent Event

      On May 13, 2010, we completed the acquisition of Bycast Inc., a privately held company headquartered in
Vancouver, British Columbia, Canada, for approximately $80 million in cash. This acquisition will extend our
leadership position in unified storage by adding an object-based storage software offering which simplifies the task
of large-scale object storage while improving the ability to quickly search and locate data objects. As of April 30,
2010, we had incurred $1.2 million in related expenses which is included in acquisition related income, net in our
consolidated statements of operations.

                                                                          102
Item 9. Changes in and Disagreements with Accountants on Accounting and Financial Disclosure

      None.


Item 9A. Controls and Procedures

(a)   Evaluation of Disclosure Controls and Procedures

      Disclosure Controls are procedures designed to ensure that information required to be disclosed in our reports
filed under the Exchange Act, such as this Annual Report, is recorded, processed, summarized and reported within
the time periods specified in the U.S. Securities and Exchange Commission’s rules and forms. Disclosure Controls
are also designed to ensure that such information is accumulated and communicated to our management, including
the CEO and CFO, as appropriate to allow timely decisions regarding required disclosure.

       Under the supervision and with the participation of our management, including our principal executive officer
and principal financial officer, we conducted an evaluation of the effectiveness of the design and operation of our
disclosure controls and procedures, as defined in Rules 13a-15(e) and 15d-15(e) under the Securities Exchange Act
of 1934, as amended, as of the end of the period covered by this report (the “Evaluation Date”). Based on this
evaluation, our principal executive officer and principal financial officer concluded as of the Evaluation Date that
our disclosure controls and procedures were effective such that the information relating to NetApp, including our
consolidated subsidiaries, required to be disclosed in our Securities and Exchange Commission (“SEC”) reports
(i) is recorded, processed, summarized and reported within the time periods specified in SEC rules and forms, and
(ii) is accumulated and communicated to NetApp’s management, including our principal executive officer and
principal financial officer, as appropriate to allow timely decisions regarding required disclosure.


(b)   Management’s Report on Internal Control Over Financial Reporting

      Our management is responsible for establishing and maintaining adequate internal control over financial
reporting, as such term is defined in Exchange Act Rule 13a-15(f). Our internal control over financial reporting is a
process designed to provide reasonable assurance regarding the reliability of financial reporting and the preparation
of financial statements for external purposes in accordance with generally accepted accounting principles. Because
of its inherent limitations, internal control over financial reporting may not prevent or detect misstatements. Also,
projections of any evaluation of effectiveness to future periods are subject to the risk that controls may become
inadequate because of changes in conditions, or that the degree of compliance with the policies or procedures may
deteriorate.

      Under the supervision and with the participation of our management, including our principal executive officer
and principal financial officer, we conducted an evaluation of the effectiveness of our internal control over financial
reporting based on the criteria established in Internal Control — Integrated Framework issued by the Committee of
Sponsoring Organizations of the Treadway Commission (COSO). Based on this assessment, our management
concluded that, as of April 30, 2010, our internal control over financial reporting was effective based on those
criteria.

     The effectiveness of our internal control over financial reporting as of April 30, 2010 has been audited by
Deloitte & Touche LLP, an independent registered public accounting firm, as stated in their report which is included
herein.


(c)   Changes in Internal Control Over Financial Reporting

    There were no changes in our internal control over financial reporting (as defined in Rule 13a-15(f) under the
Exchange Act) identified in connection with management’s evaluation during our last fiscal quarter that have
materially affected, or are reasonably likely to materially effect, our internal control over financial reporting.

                                                         103
(d)   Report of Independent Registered Public Accounting Firm

REPORT OF INDEPENDENT REGISTERED PUBLIC ACCOUNTING FIRM

To the Board of Directors and Stockholders of
NetApp, Inc.
Sunnyvale, California

     We have audited the internal control over financial reporting of NetApp, Inc. and subsidiaries (collectively, the
“Company”) as of April 30, 2010, based on criteria established in Internal Control — Integrated Framework issued
by the Committee of Sponsoring Organizations of the Treadway Commission. The Company’s management is
responsible for maintaining effective internal control over financial reporting and for its assessment of the
effectiveness of internal control over financial reporting, included in the accompanying Management’s Report
on Internal Control over Financial Reporting. Our responsibility is to express an opinion on the Company’s internal
control over financial reporting based on our audit.

     We conducted our audit in accordance with the standards of the Public Company Accounting Oversight Board
(United States). Those standards require that we plan and perform the audit to obtain reasonable assurance about
whether effective internal control over financial reporting was maintained in all material respects. Our audit
included obtaining an understanding of internal control over financial reporting, assessing the risk that a material
weakness exists, testing and evaluating the design and operating effectiveness of internal control based on the
assessed risk, and performing such other procedures as we considered necessary in the circumstances. We believe
that our audit provides a reasonable basis for our opinion.

     A company’s internal control over financial reporting is a process designed by, or under the supervision of, the
company’s principal executive and principal financial officers, or persons performing similar functions, and
effected by the company’s board of directors, management, and other personnel to provide reasonable assurance
regarding the reliability of financial reporting and the preparation of financial statements for external purposes in
accordance with generally accepted accounting principles. A company’s internal control over financial reporting
includes those policies and procedures that (1) pertain to the maintenance of records that, in reasonable detail,
accurately and fairly reflect the transactions and dispositions of the assets of the company; (2) provide reasonable
assurance that transactions are recorded as necessary to permit preparation of financial statements in accordance
with generally accepted accounting principles, and that receipts and expenditures of the company are being made
only in accordance with authorizations of management and directors of the company; and (3) provide reasonable
assurance regarding prevention or timely detection of unauthorized acquisition, use, or disposition of the company’s
assets that could have a material effect on the financial statements.

     Because of the inherent limitations of internal control over financial reporting, including the possibility of
collusion or improper management override of controls, material misstatements due to error or fraud may not be
prevented or detected on a timely basis. Also, projections of any evaluation of the effectiveness of the internal
control over financial reporting to future periods are subject to the risk that the controls may become inadequate
because of changes in conditions, or that the degree of compliance with the policies or procedures may deteriorate.

     In our opinion, the Company maintained, in all material respects, effective internal control over financial
reporting as of April 30, 2010, based on the criteria established in Internal Control — Integrated Framework issued
by the Committee of Sponsoring Organizations of the Treadway Commission.

     We have also audited, in accordance with the standards of the Public Company Accounting Oversight Board
(United States), the consolidated financial statements and financial statement schedule as of and for the year ended
April 30, 2010 of the Company and our report dated June 18, 2010 expressed an unqualified opinion on those
financial statements and financial statement schedule.

/s/ DELOITTE & TOUCHE LLP
San Jose, California
June 18 2010

                                                         104
Item 9B. Other Information
     None.


                                                     PART III

Item 10.     Directors and Executive Officers of the Registrant
      The information required by this Item with respect to the Company’s executive officers is incorporated herein
by reference from the information under Item 1 of Part I of this Annual Report on Form 10-K under the section
entitled “Executive Officers.” The information required by this Item with respect to the Company’s directors is
incorporated herein by reference from the information provided under the heading “Election of Directors” in the
Proxy Statement for the 2010 Annual Meeting of Stockholders which will be filed with the Securities and Exchange
Commission. The information required by Item 405 of Regulation S-K is incorporated herein by reference from the
information provided under the heading “Section 16(a) Beneficial Ownership Reporting Compliance” in the Proxy
Statement for the 2010 Annual Meeting of Stockholders.
     We have adopted a written code of ethics that applies to our Board of Directors and all of our employees,
including our principal executive officer, principal financial officer and principal accounting officer. A copy of the
code is available on our website at www.netapp.com. We will post any amendments to or waivers from the
provisions of our code of ethics on our website.

Item 11.     Executive Compensation
     Information regarding the compensation of executive officers and directors of the Company is incorporated by
reference from the information under the heading “Executive Compensation and Related Information” in our Proxy
Statement for the 2010 Annual Meeting of Stockholders.

Item 12.     Security Ownership of Certain Beneficial Owners and Management
     Information regarding security ownership of certain beneficial owners and management is incorporated by
reference from the information under the heading “Security Ownership of Certain Beneficial Owners and
Management” in our Proxy Statement for the 2010 Annual Meeting of Stockholders.

Item 13.     Certain Relationships and Related Transactions
     Information regarding certain relationships and related transactions is incorporated by reference from the
information under the caption “Employment Contracts, Termination of Employment and Change-In-Control
Agreements” in our Proxy Statement for the 2010 Annual Meeting of Stockholders.

Item 14.     Principal Accountant Fees and Services
    The information required by this item is incorporated by reference from the information under the caption
“Audit Fees” in our Proxy Statement for the 2010 Annual Meeting of Stockholders.
    With the exception of the information incorporated in Items 10, 11, 12, 13, and 14 of this Annual Report on
Form 10-K, NetApp’s Proxy Statement is not deemed “filed” as part of this Annual Report on Form 10-K.


                                                     PART IV

Item 15.     Exhibits and Financial Statement Schedules
     See the Exhibit Index immediately following Schedule II of this Annual Report on Form 10-K.

                                                         105
SIGNATURES
     Pursuant to the requirements of Section 13 or 15(d) of the Securities Exchange Act of 1934, the Company has
duly caused this report to be signed on its behalf by the undersigned, thereunto duly authorized, on June 18, 2010.


                                                           NETAPP, INC.


                                                           By:            /s/    THOMAS GEORGENS
                                                                 Thomas Georgens
                                                                 Chief Executive Officer, President and Director,
                                                                 (Principal Executive Officer and Principal
                                                                 Operating Officer)

                                             POWER OF ATTORNEY
      KNOW ALL MEN BY THESE PRESENTS, that each person whose signature appears below constitutes and
appoints Thomas Georgens and Steven J. Gomo, and each of them, as his true and lawful attorneys-in-fact and
agents, with full power of substitution and resubstitution, for him and in his name, place and stead, in any and all
capacities, to sign any and all amendments (including post-effective amendments) to this Annual Report on
Form 10-K, and to file the same, with all exhibits thereto, and other documents in connection therewith, with the
Securities and Exchange Commission, granting unto said attorneys-in-fact and agents, and each of them, full power
and authority to do and perform each and every act and thing requisite and necessary to be done in connection
therewith, as fully to all intents and purposes as he might or could do in person, hereby ratifying and confirming all
that said attorneys-in-fact and agents, or any of them, or their or his substitutes, may lawfully do or cause to be done
by virtue thereof.
     Pursuant to the requirements of the Securities Exchange Act of 1934, this report has been signed below by the
following persons on behalf of the Company and in the capacities and on the dates indicated:
                      Signature                                          Title                                Date


     /s/        THOMAS GEORGENS                       Chief Executive Officer, President and            June 18, 2010
                  Thomas Georgens                    Director, (Principal Executive Officer and
                                                            Principal Operating Officer)

    /s/     NICHOLAS G. MOORE                                Lead Independent Director                  June 18, 2010
              Nicholas G. Moore

          /s/    STEVEN J. GOMO                      Executive Vice President of Finance and            June 18, 2010
                  Steven J. Gomo                    Chief Financial Officer (Principal Financial
                                                     Officer and Principal Accounting Officer)

 /s/ DANIEL J. WARMENHOVEN                               Executive Chairman of the Board                June 18, 2010
       Daniel J. Warmenhoven

           /s/ ALAN EARHART                                            Director                         June 18, 2010
                 Alan Earhart

                                                                       Director
                 Donald T. Valentine


                                                          106
Signature               Title        Date


   /s/    MARK LESLIE              Director   June 18, 2010
           Mark Leslie

 /s/     ROBERT T. WALL            Director   June 18, 2010
           Robert T. Wall

                                   Director
         George T. Shaheen

 /s/ JEFFRY R. ALLEN               Director   June 18, 2010
       Jeffry R. Allen

/s/ T. MICHAEL NEVENS              Director   June 18, 2010
       T. Michael Nevens

  /s/     GERALD HELD              Director   June 18, 2010
           Gerald Held


                             107
SCHEDULE II.


                                                                  NETAPP, INC.
                                      VALUATION AND QUALIFYING ACCOUNTS
                               Years Ended April 30, 2010, April 24, 2009, and April 25, 2008
                                                                                                   Additions
                                                                                                   Charged
                                                                                    Balance at   (Credited) to                     Balance
                                                                                    Beginning     Costs and       Reductions      at End of
Description                                                                         of Period      Expenses      and Write-offs    Period

Allowance for doubtful accounts:
  2010. . . . . . . . . . . . . . . . . . . . . . . . . . . . . . . . . . . . . .     $3.1          $—               $1.5           $1.6
  2009. . . . . . . . . . . . . . . . . . . . . . . . . . . . . . . . . . . . . .     $2.4          $1.1             $0.4           $3.1
  2008. . . . . . . . . . . . . . . . . . . . . . . . . . . . . . . . . . . . . .     $2.6          $0.8             $1.0           $2.4


                                                                           108
EXHIBIT INDEX

Exhibit No                                              Description

 2.1(3)      Agreement and Plan of Merger, dated as of November 3, 2003, by and among NetApp, Inc., Nagano
             Sub, Inc., and Spinnaker Networks, Inc.
 2.2(7)      Agreement and Plan of Merger and Reorganization, dated as of June 15, 2005, by and among NetApp
             Inc., Dolphin Acquisition Corp., and Decru, Inc.
 2.3(23)†    Agreement and Plan of Merger, dated as of May 20, 2009, by and among the Company, Kentucky
             Merger Sub One Corporation, Derby Merger Sub Two LLC and Data Domain, Inc.
 2.4(23)     Amendment No. 1 to Agreement and Plan of Merger, dated June 3, 2009, by and among the
             Company, Kentucky Merger Sub One Corporation, Derby Merger Sub Two LLC and Data Domain,
             Inc.
 2.5(24)     Termination Notice to the Merger Agreement, dated July 8, 2009, by and among NetApp, Inc., Data
             Domain, Inc., Kentucky Merger Sub One Corporation, a direct, wholly owned subsidiary of NetApp,
             Inc., and Derby Merger Sub Two LLC, a direct, wholly owned subsidiary of NetApp, Inc.
 3.1(18)     Certificate of Incorporation of the Company, as amended.
 3.2(28)     Bylaws of the Company, as amended.
 4.1(20)     Indenture for 1.75% Convertible Senior Notes Due 2013, dated as of June 10, 2008, by and between
             U.S. Bank National Association, as Trustee, and the Company.
 4.2(20)     Registration Rights Agreement, dated as of June 10, 2008, by and among Goldman, Sachs & Co.,
             Morgan Stanley & Co. Incorporated and the Company.
10.1(28)*    Revised Form of Indemnification Agreement, dated December 17, 2009, by and between the
             Company and each of its directors and officers.
10.2(26)*    The Company’s Amended and Restated Change of Control Severance Agreement (CEO)
10.3(26)*    The Company’s Amended and Restated Change of Control Severance Agreement (Executive
             Chairman).
10.4(19)*    Form of Change of Control Severance Agreements (Non-CEO Executives)
10.5(25)*    The Company’s Amended and Restated Executive Compensation Plan.
10.6(6)*     The Company’s Deferred Compensation Plan.
10.7(25)*    The Company’s Amended and Restated Employee Stock Purchase Plan.
10.8(1)*     The Company’s Amended and Restated 1995 Stock Incentive Plan.
10.9(11)     Form of Stock Option Agreement approved for use under the Company’s amended and restated 1995
             Stock Option Plan
10.10(11)    Form of Stock Option Agreement approved for use under the Company’s amended and restated 1995
             Stock Option Plan (Restricted Stock Agreement).
10.11(11)    Form of Stock Option Agreement approved for use under the Company’s amended and restated 1995
             Stock Option Plan (Chairman of the Board or any Board Committee Chairperson).
10.12(25)*   The Company’s Amended and Restated 1999 Stock Option Plan.
10.13(11)    Form of Stock Option Agreement approved for use under the Company’s amended and restated 1999
             Stock Option Plan.
10.14        Form of Restricted Stock Unit Agreement approved for use under the Company’s amended and
             restated 1999 Stock Option Plan Employees.
10.15(11)    Form of Stock Option Agreement approved for use under the Company’s amended and restated 1999
             Stock Option Plan (Non-Employee Director Automatic Stock Option — Initial).
10.16(11)    Form of Stock Option Agreement approved for use under the Company’s amended and restated 1999
             Stock Option Plan (Non-Employee Director Automatic Stock Option — Annual).
10.17        Form of Restricted Stock Unit Agreement approved for use under the Company’s amended and
             restated 1999 Stock Option Plan (Non-Employees Directors).
10.18(11)    Form of Stock Option Agreement approved for use under the Company’s amended and restated 1999
             Stock Option Plan (China).
10.19(11)    Form of Stock Option Agreement approved for use under the Company’s amended and restated 1999
             Stock Option Plan (France).
Exhibit No                                              Description

10.20(11)   Form of Stock Option Agreement approved for use under the Company’s amended and restated 1999
            Stock Option Plan (India).
10.21(11)   Form of Stock Option Agreement approved for use under the Company’s amended and restated 1999
            Stock Option Plan (United Kingdom).
10.22(18)   Form of Stock Option Agreement approved for use under the Company’s amended and restated 1999
            Stock Option Plan (Israel).
10.23(22)* WebManage Technologies, Inc. 1999 Stock Option Plan.
10.24 (4)* Spinnaker Networks, Inc. 2000 Stock Plan.
10.25 (5)* Alacritus, Inc. 2005 Stock Plan.
10.26(8)    Form of Stock Option Grant Notice and Option Agreement under the Decru, Inc. Amended and
            Restated 2001 Equity Incentive Plan and the 2001 Equity Incentive Plan filed under Attachment II.
10.27(8)    Form of Stock Option Grant Notice and Option Agreement under the Decru, Inc. 2001 Equity
            Incentive Plan and the 2001 Equity Incentive Plan filed under Attachment II.
10.28(8)    Form of Restricted Stock Bonus Grant Notice and Agreement under the Decru, Inc. 2001 Equity
            Incentive Plan.
10.29 (13)* SANPro Systems, Inc. 2001 U.S. Stock Option Plan.
10.30 (17)* Onaro, Inc. Amended and Restated 2002 Stock Option and Incentive Plan (including Appendix —
            Israeli Taxpayers).
10.31(2)    Patent Cross License Agreement, dated as of October 1, 2000, by and between Intel Corporation and
            the Company.
10.32 (9)   Asset Purchase Agreement, dated June 20, 2003, by and between Auspex Systems, Inc. and the
            Company.
10.33(10)   Purchase and Sale Agreement, dated July 27, 2004 by and between Cisco Systems, Inc. and the
            Company.
10.34(14)   Master Confirmation, dated March 19, 2007, by and between JP Morgan Securities Inc. and the
            Company.
10.35(15)   Master Confirmation, dated August 13, 2007, by and between Bank of America, N.A. and the
            Company.
10.36(18)   Amended and Restated Closing Certificate and Agreement (Building 7), dated November 29, 2007,
            by and between BNP Paribas Leasing Corporation and the Company.
10.37(18)   Amended and Restated Construction Agreement (Building 7), dated November 29, 2007, by and
            between BNP Paribas Leasing Corporation and the Company.
10.38(18)   Amended and Restated Lease Agreement (Building 7), dated November 29, 2007, by and between
            BNP Paribas Leasing Corporation and the Company.
10.39(18)   Amended and Restated Common Definitions and Provisions Agreement (Building 7), dated
            November 29, 2007, by and between BNP Paribas Leasing Corporation and the Company.
10.40(18)   Amended and Restated Purchase Agreement (Building 7), dated November 29, 2007, by and between
            BNP Paribas Leasing Corporation and the Company.
10.41(18)   Amended and Restated Ground Lease (Building 7), dated November 29, 2007, by and between BNP
            Paribas Leasing Corporation and the Company.
10.42(18)   First Modification Agreement (Building 7), dated as of April 9, 2008, by and between BNP Paribas
            Leasing Corporation and the Company.
10.43(16)   Closing Certificate and Agreement (Moffett Business Center), dated November 29, 2007, by and
            between BNP Paribas Leasing Corporation and the Company.
10.44(16)   Lease Agreement (Moffett Business Center), dated November 29, 2007, by and between BNP
            Paribas Leasing Corporation and the Company.
10.45(16)   Common Definitions and Provisions Agreement (Moffett Business Center), dated November 29,
            2007, by and between BNP Paribas Leasing Corporation and the Company.
10.46(16)   Purchase Agreement (Moffett Business Center), dated November 29, 2007, by and between BNP
            Paribas Leasing Corporation and the Company.
Exhibit No                                                Description

10.47(18)    First Modification Agreement (Moffett Business Center), dated as of April 9, 2008, by and between
             BNP Paribas Leasing Corporation and the Company.
10.48(16)    Closing Certificate and Agreement (1299 Orleans), dated November 29, 2007, by and between BNP
             Paribas Leasing Corporation and the Company.
10.49(16)    Lease Agreement (1299 Orleans), dated November 29, 2007, by and between BNP Paribas Leasing
             Corporation and the Company.
10.50(16)    Common Definitions and Provisions Agreement (1299 Orleans), dated November 29, 2007, by and
             between BNP Paribas Leasing Corporation and the Company.
10.51(16)    Purchase Agreement (1299 Orleans), dated November 29, 2007, by and between BNP Paribas
             Leasing Corporation and the Company.
10.52(18)    First Modification Agreement (1299 Orleans), dated as of April 9, 2008, by and between BNP
             Paribas Leasing Corporation and the Company.
10.53(27)    Agreement to Sell, dated as of November 18, 2009, by and between Bhoruka Financial Services
             Limited, as Seller, and NetApp India Private Limited, as Buyer.
10.54(20)    Form of Convertible Bond Hedge Confirmation.
10.55(20)    Form of Warrant Confirmation.
10.56(20)    Form of Amendment to Warrant Confirmation.
10.57(21)    Settlement Agreement entered into among the U.S.A, acting through the United States Department of
             Justice and on behalf of the General Services Administration, the Company and Igor Kapuscinski.
21.1         Subsidiaries of the Company.
23.1         Consent of Independent Registered Public Accounting Firm.
24.1         Power of Attorney (see signature page).
31.1         Certification of the Chief Executive Officer pursuant to Section 302(a) of the Sarbanes-Oxley Act of
             2002.
31.2         Certification of the Chief Financial Officer pursuant to Section 302(a) of the Sarbanes-Oxley Act of
             2002.
32.1         Certification of Chief Executive Officer pursuant to 18 U.S.C. Section 1350, as adopted pursuant to
             section 906 of the Sarbanes-Oxley Act of 2002.
32.2         Certification of Chief Financial Officer pursuant to 18 U.S.C. Section 1350, as adopted pursuant to
             section 906 of the Sarbanes-Oxley Act of 2002.

 (1) Previously filed as an exhibit to the Company’s Proxy Statement dated August 21, 1998.
 (2) Previously filed as an exhibit to the Company’s Quarterly Report on Form 10-Q dated March 12, 2001.
 (3) Previously filed as an exhibit to the Company’s Current Report on Form 8-K dated February 27, 2004.
 (4) Previously filed as an exhibit to the Company’s Form S-8 registration statement dated March 1, 2004.
 (5) Previously filed as an exhibit to the Company’s Form S-8 registration statement dated June 2, 2005.
 (6) Previously filed as an exhibit to the Company’s Current Report on Form 8-K dated July 7, 2005.
 (7) Previously filed as an exhibit to the Company’s Quarterly Report on Form 10-Q dated September 2, 2005.
 (8) Previously filed as an exhibit to the Company’s Form S-8 registration statement dated September 2, 2005.
 (9) Previously filed as an exhibit to the Company’s Quarterly Report on Form 10-Q dated September 3, 2003.
(10) Previously filed as an exhibit to the Company’s Quarterly Report on Form 10-Q dated August 31, 2004.
(11) Previously filed as an exhibit to the Company’s Annual Report on Form 10-K dated July 8, 2005.
(12) Previously filed as an exhibit to the Company’s Annual Report on Form 10-K dated July 12, 2006.
(13) Previously filed as an exhibit to the Company’s Form S-8 registration statement dated January 5, 2007.
(14) Previously filed as an exhibit to the Company’s Annual Report on Form 10-K dated June 26, 2007.
(15) Previously filed as an exhibit to the Company’s Quarterly Report on Form 10-Q dated December 4, 2007.
(16) Previously filed as an exhibit to the Company’s Quarterly Report on Form 10-Q dated March 5, 2008.
(17) Previously filed as an exhibit to the Company’s Form S-8 registration statement dated February 25, 2008.
(18) Previously filed as an exhibit to the Company’s Annual Report on Form 10-K dated June 24, 2008.
(19) Previously filed as an exhibit to the Company’s Quarterly Report on Form 10-Q dated September 3, 2008.
(20) Previously filed as an exhibit to the Company’s Current Report on Form 8-K dated June 10, 2008.
(21) Previously filed as an exhibit to the Company’s Annual Report on Form 10-K dated June 17, 2009.
(22) Previously filed as an exhibit to the Company’s S-8 registration statement dated January 16, 2001.
(23) Previously filed as an exhibit to Registration Statement on Form S-4, as filed with the SEC on June 4, 2009.
(24) Previously filed as an exhibit to the Company’s Quarterly Report on Form 10-Q dated September 4, 2009.
(25) Previously filed as exhibits to the Company’s Proxy Statement dated August 20, 2009.
(26) Previously filed as an exhibit to the Company’s Quarterly Report on Form 10-Q dated December 2, 2009.
(27) Previously filed as an exhibit to the Company’s Current Report on Form 8-K dated November 25, 2009.
(28) Previously filed as an exhibit to the Company’s Quarterly Report on Form 10-Q dated March 1, 2010.
* Identifies management plan or compensatory plan or arrangement.
† The schedules and other attachments to this exhibit have been omitted. The Company agrees to furnish a copy of
  any omitted schedules or attachments to the SEC upon request.
TRADEMARKS
      ·Copyright 2010 NetApp, Inc. All rights reserved. No portions of this document may be reproduced without
prior written consent of NetApp, Inc. NetApp, the NetApp logo, Go further, faster, DataFabric, Data ONTAP,
FAServer, FilerView, FlexCache, FlexClone, FlexShare, FlexVol, MultiStore, NearStore, Network Appliance,
SecureShare, SnapDrive, SnapLock, SnapManager, SnapMirror, SnapRestore, Snapshot, SnapVault, and WAFL are
trademarks or registered trademarks of NetApp, Inc. in the United States and/or other countries. Windows is a
registered trademark of Microsoft Corporation. Linux is a registered trademark of Linus Torvalds. UNIX is a
registered trademark of The Open Group. All other brands or products are trademarks or registered trademarks of
their respective holders and should be treated as such.

2010

  • 1.
    UNITED STATES SECURITIESAND EXCHANGE COMMISSION Washington, D.C. 20549 Form 10-K (Mark One) ¥ ANNUAL REPORT PURSUANT TO SECTION 13 OR 15(d) OF THE SECURITIES EXCHANGE ACT OF 1934 For the fiscal year ended April 30, 2010 or n TRANSITION REPORT PURSUANT TO SECTION 13 OR 15(d) OF THE SECURITIES EXCHANGE ACT OF 1934 For the transition period from to Commission File Number 0-27130 NetApp, Inc. (Exact name of registrant as specified in its charter) Delaware 77-0307520 (State or other jurisdiction of (IRS Employer incorporation or organization) Identification No.) 495 East Java Drive, Sunnyvale, California 94089 (Address of principal executive offices, including zip code) Registrant’s telephone number, including area code: (408) 822-6000 Securities registered pursuant to Section 12(b) of the Act: Title of Each Class Name of Exchange on Which Registered Common Stock, $0.001 Par Value The NASDAQ Stock Market LLC Securities registered pursuant to Section 12(g) of the Act: None Indicate by check mark if the registrant is a well-known seasoned issuer, as defined in Rule 405 of the Securities Act. Yes ¥ No n Indicate by check mark if the registrant is not required to file reports pursuant to Section 13 or Section 15(d) of the Act. Yes n No ¥ Indicate by check mark whether the registrant: (1) has filed all reports required to be filed by Section 13 or 15(d) of the Securities Exchange Act of 1934 during the preceding 12 months (or for such shorter period that the registrant was required to file such reports), and (2) has been subject to such filing requirements for the past 90 days. Yes ¥ No n Indicate by check mark whether the registrant has submitted electronically and posted on its corporate Web site, if any, every Interactive Data File required to be submitted and posted pursuant to Rule 405 of Regulation S-T (§232.405 of this chapter) during the preceding 12 months (or for such shorter period that the registrant was required to submit and post such files). Yes n No n Indicate by a check mark if disclosure of delinquent filers pursuant to Item 405 of Regulation S-K is not contained herein, and will not be contained, to the best of registrant’s knowledge, in definitive proxy or information statements incorporated by reference in Part III of this Form 10-K or any amendment to this Form 10-K. n Indicate by check mark whether the registrant is a large accelerated filer, an accelerated filer, a non-accelerated filer, or a smaller reporting company. See the definitions of “large accelerated filer,” “accelerated filer” and “smaller reporting company” in Rule 12b-2 of the Exchange Act. (Check one): Large accelerated filer ¥ Accelerated filer n Non-accelerated filer n Smaller reporting company n (Do not check if a smaller reporting company) Indicate by check mark whether the registrant is a shell company (as defined in Rule 12b-2 of the Exchange Act). Yes n No ¥ The aggregate market value of voting stock held by non-affiliates of the registrant, as of October 30, 2009, the last day of registrant’s most recently completed second fiscal quarter, was $8,339,377,099 (based on the closing price for shares of the registrant’s common stock as reported by the NASDAQ Global Select Market for the last business day prior to that date). Shares of common stock held by each executive officer, director, and holder of 5% or more of the outstanding common stock have been excluded in that such persons may be deemed to be affiliates. This determination of affiliate status is not necessarily a conclusive determination for other purposes. On June 4, 2010, 352,541,867 shares of the registrant’s common stock, $0.001 par value, were outstanding. DOCUMENTS INCORPORATED BY REFERENCE The information called for by Part III of this Form 10-K is hereby incorporated by reference from the definitive Proxy Statement for our annual meeting of stockholders, which will be filed with the Securities and Exchange Commission not later than 120 days after April 30, 2010.
  • 2.
    TABLE OF CONTENTS PART I Item 1 Business . . . . . . . . . . . . . . . . . . . . . . . . . . . . . . . . . . . . . . . . . . . . . . . . . . . . . . . . . . . . . . . 3 Item 1A Risk Factors . . . . . . . . . . . . . . . . . . . . . . . . . . . . . . . . . . . . . . . . . . . . . . . . . . . . . . . . . . . . 11 Item 1B Unresolved Staff Comments . . . . . . . . . . . . . . . . . . . . . . . . . . . . . . . . . . . . . . . . . . . . . . . . 32 Item 2 Properties . . . . . . . . . . . . . . . . . . . . . . . . . . . . . . . . . . . . . . . . . . . . . . . . . . . . . . . . . . . . . . 32 Item 3 Legal Proceedings . . . . . . . . . . . . . . . . . . . . . . . . . . . . . . . . . . . . . . . . . . . . . . . . . . . . . . . . 33 Item 4 Submission of Matters to a Vote of Security Holders . . . . . . . . . . . . . . . . . . . . . . . . . . . . . . 33 PART II Item 5 Market for Registrant’s Common Equity, Related Stockholder Matters and Issuer Purchases of Equity Securities . . . . . . . . . . . . . . . . . . . . . . . . . . . . . . . . . . . . . . . . . . . . . . . . . . . . . . . 34 Item 6 Selected Financial Data . . . . . . . . . . . . . . . . . . . . . . . . . . . . . . . . . . . . . . . . . . . . . . . . . . . . 36 Item 7 Management’s Discussion and Analysis of Financial Condition and Results of Operations . . . 36 Item 7A Quantitative and Qualitative Disclosures About Market Risk . . . . . . . . . . . . . . . . . . . . . . . . . 58 Item 8 Financial Statements and Supplementary Data . . . . . . . . . . . . . . . . . . . . . . . . . . . . . . . . . . . 61 Item 9 Changes in and Disagreements with Accountants on Accounting and Financial Disclosure. . . 103 Item 9A Controls and Procedures . . . . . . . . . . . . . . . . . . . . . . . . . . . . . . . . . . . . . . . . . . . . . . . . . . . 103 Item 9B Other Information . . . . . . . . . . . . . . . . . . . . . . . . . . . . . . . . . . . . . . . . . . . . . . . . . . . . . . . . 105 PART III Item 10 Directors and Executive Officers of the Registrant . . . . . . . . . . . . . . . . . . . . . . . . . . . . . . . . 105 Item 11 Executive Compensation . . . . . . . . . . . . . . . . . . . . . . . . . . . . . . . . . . . . . . . . . . . . . . . . . . . 105 Item 12 Security Ownership of Certain Beneficial Owners and Management . . . . . . . . . . . . . . . . . . . 105 Item 13 Certain Relationships and Related Transactions . . . . . . . . . . . . . . . . . . . . . . . . . . . . . . . . . . 105 Item 14 Principal Accounting Fees and Services . . . . . . . . . . . . . . . . . . . . . . . . . . . . . . . . . . . . . . . . 105 PART IV Item 15 Exhibits and Financial Statement Schedules . . . . . . . . . . . . . . . . . . . . . . . . . . . . . . . . . . . . . 105 Signatures . . . . . . . . . . . . . . . . . . . . . . . . . . . . . . . . . . . . . . . . . . . . . . . . . . . . . . . . . . . . . . . . . . . . . . 106 Schedule II . . . . . . . . . . . . . . . . . . . . . . . . . . . . . . . . . . . . . . . . . . . . . . . . . . . . . . . . . . . . . . . . . . . . . 108 2
  • 3.
    PART I Item 1.Business Forward Looking Statements This Annual Report on Form 10-K contains forward-looking statements within the meaning of Section 27A of the Securities Act of 1933, as amended, and Section 21E of the Securities Exchange Act of 1934, as amended (the “Exchange Act”), and is subject to the safe harbor provisions set forth in the Exchange Act. Forward-looking statements usually contain the words “estimate,” “intend,” “plan,” “predict,” “seek,” “may,” “will,” “should,” “would,” “could,” “anticipate,” “expect,” “believe,” or similar expressions and variations or negatives of these words. In addition, any statements that refer to expectations, projections, or other characterizations of future events or circumstances, including any underlying assumptions, are forward-looking statements. All forward-looking statements, including but not limited to, statements about: • our future financial and operating results; • our business strategies; • management’s plans, beliefs and objectives for future operations, research and development; • acquisitions and joint ventures, growth opportunities, investments and legal proceedings; • competitive positions; • product introductions, development, enhancements and acceptance; • economic and industry trends or trend analyses; • future cash flows and cash deployment strategies; • short-term and long-term cash requirements; • our anticipated tax rate; • the dilutive effect of our convertible Notes and associated warrants on our earnings per share; • the conversion, maturation or repurchase of the Notes, • compliance with laws, regulations and debt covenants; • the continuation of our stock repurchase program; and • the impact of completed acquisitions are inherently uncertain as they are based on management’s current expectations and assumptions concerning future events, and they are subject to numerous known and unknown risks and uncertainties. Therefore, our actual results may differ materially from the forward-looking statements contained herein. Factors that could cause actual results to differ materially from those described herein include, but are not limited to: • acceptance of, and demand for, our products; • the amount of orders received in future periods; • our ability to ship our products in a timely manner; • our ability to achieve anticipated pricing, cost, and gross margins levels; • our ability to successfully manage our backlog and increase revenue; • our ability to successfully execute on our strategy; • our ability to increase our customer base, market share and revenue; • our ability to successfully introduce new products; 3
  • 4.
    • our abilityto maintain the quality of our hardware, software and services offerings; • our ability to adapt to changes in market demand; • the general economic environment and the growth of the storage markets; • demand for our services and support; • our ability to identify and respond to significant market trends and emerging standards; • the impact of industry consolidation; • our ability to successfully manage our investment in people, process, and systems; • our ability to maintain our supplier and contract manufacturer relationships; • the ability of our suppliers and contract manufacturers to meet our requirements; • the ability of our competitors to introduce new products that compete successfully with our products; • our ability to grow direct and indirect sales and to efficiently utilize global service and support; • variability in our gross margins; • our ability to sustain and/or improve our cash and overall financial position; • our cash requirements and terms and availability of financing; • valuation and liquidity of our investment portfolio; • our ability to finance business acquisitions, construction projects and capital expenditures through cash from operations and/or financing; • the results of our ongoing litigation, tax audits, government audits and inquiries; and • those factors discussed under “Risk Factors” elsewhere in this Annual Report on Form 10-K. Readers are cautioned not to place undue reliance on these forward-looking statements, which speak only as of the date hereof and are based upon information available to us at this time. These statements are not guarantees of future performance. We disclaim any obligation to update information in any forward-looking statement. Actual results could vary from our forward looking statements due to foregoing factors as well as other important factors, including those described in the Risk Factors included on page 11. Overview NetApp, Inc. (NetApp) is a leading provider of storage and data management solutions. We offer solutions for storing, managing, protecting and archiving business data. Our solutions are designed to lower the cost of managing and protecting our customers’ data while increasing their agility and competitiveness. We offer comprehensive solutions to help customers effectively streamline operations and lower the cost associated with storing and managing their data. In an era of increasing constraints on information technology (IT) spending, our storage efficiency innovations allow customers to use smaller, more efficient storage systems in support of primary and secondary storage applications, helping them manage the issues associated with continuous data growth. We strive to provide the best experience in the industry with every interaction customers have with our people, products and services. In addition to our broad range of storage and data management solutions, we provide global service and support and work to simplify customer environments by utilizing open standards and closely collaborating and partnering with other industry leaders. We help solve customer business challenges and help enable them to maximize return on investment through a combination of products, technologies, services, and partnerships. Our products and services are designed to meet the expansive requirements and demanding service levels of large enterprises and their mission-critical business applications. To better meet these needs, we partner with key industry leaders, such as Cisco Systems, Inc., IBM Corporation, Microsoft Corporation, SAP Corporation, 4
  • 5.
    Symantec Corporation andVMware, Inc. to develop integrated solutions that optimize the performance of customers’ applications and their infrastructure. In addition, our products have been designed to satisfy the demands of high performance computing and technical data center applications, offering solutions used in the design of semiconductors and automobiles, as well as graphics rendering and seismic exploration. We were incorporated in 1992 and shipped the world’s first networked storage appliance a year later. Since then, we have brought to market many innovations in storage and data management. We have grown to over 8,300 employees with operations in over 130 locations around the world. NetApp Product Overview We offer highly available, scalable and cost-effective storage solutions that incorporate our unified storage platform and the feature-rich functionality of our data and storage resource management software. We believe that our solutions help improve enterprise productivity, performance and profitability, while providing investment protection and enhanced asset utilization. Our enterprise-class storage solutions are complemented by our services expertise to enable interoperability and optimization in the context of the application and IT infrastructure within which they are deployed. Data ONTAP Software Our Fabric-Attached Storage (FAS) and V-Series storage solutions are based on Data ONTAP», a highly scalable and flexible operating system that uniquely supports any mix of storage area network (SAN), network- attached storage (NAS) and Internet Small Computer System Interface (iSCSI) environments concurrently. This unified storage software platform is compatible with UNIX», Linux», Windows» and Web environments. The Data ONTAP operating system provides the foundation to build a shared storage infrastructure and an enterprise-wide data fabric for the full breadth of business applications and data storage and protection require- ments. Data ONTAP features scalability, secure multi-tenancy and unification across protocols and disks. Data ONTAP also unifies storage efficiency, data management and data protection delivery. We believe customers can benefit from these capabilities as they increasingly virtualize application environments. Our deduplication for primary and secondary storage, thin provisioning, and highly efficient hardware help maximize utilization while reducing data center footprint and lowering storage-related power and cooling consumption. A few of the technology features we offer with Data ONTAP include: • FlexShare» technology directs how storage system resources are used to deliver an appropriate level of service for each application ; • FlexCache» technology allows performance acceleration through the creation of read-only cached volumes by creating caching volumes on multiple storage controllers; and • MultiStore» software allows partitioning of individual physical storage systems into multiple secure and separate logical partitions. Storage Efficiency NetApp’s portfolio of efficiency technologies helps our customers reduce their storage spending and get more from storage assets they already own. Some of the efficiency technologies we offer include: • FlexVol» technology provides thin provisioning through virtual volumes, enabling storage architectures to be more efficient and achieve higher utilization using flexible volumes that do not require repartitioning of physical storage space; • FlexClone» technology enables true data cloning using logical copies that do not require additional physical storage space, and allows for instant replication of data volumes and data sets; and • Deduplication technology provides the ability to eliminate duplicate data within primary and secondary disk storage environments, resulting in greater efficiency and higher utilization of storage capacity. 5
  • 6.
    Storage Management andApplication Integration Software Our management software family of products provides a broad range of storage and data management tools to simplify IT administration and enhance flexibility and productivity. We deliver differentiated products and collaborate with industry open standards and interfaces to deliver this value to customers. We have four suites of products targeted to different IT administrative roles: Storage Suite, Server Suite, Database Suite and Application Suite. The software products within these suites are tightly integrated with database and business application software from partners such as Microsoft, Oracle, SAP and VMware, in order to optimize the performance of those applications on our storage systems. Our product offering extends into data center automation, which provides the capability to monitor service levels, manage performance and support change management in complex enterprise SAN environments. We help customers optimize shared infrastructures by supporting individual application performance, service level and security needs even while the storage is shared across multiple applications. FAS Storage Systems Family Our family of modular, scalable, highly available, unified networked storage systems provides access to a full range of enterprise data for users on a variety of platforms. The FAS 6000, FAS 3000, and the FAS 2000 series of fabric-attached enterprise storage systems are designed to consolidate UNIX, Windows, NAS, iSCSI, SAN and Web data in central locations running over standard connection types: Gigabit Ethernet, FC and parallel SCSI (for backup). Our design optimizes and consolidates high-performance data access for individuals in multi-user environments as well as for application servers and server clusters with dedicated access. All of our FAS systems are interoperable and run the highly efficient Data ONTAP operating system. V-Series Family Our V-Series is a network-based virtualization solution that consolidates storage from different suppliers behind our data management interface, providing SAN, iSCSI and NAS access to the data stored in heterogeneous storage arrays. With the V-Series solution, customers are able to: transform existing heterogeneous, multi-vendor storage systems into a single storage pool; simplify storage provisioning and management with Data ONTAP thin provisioning; and dramatically lower backup time, space and cost with Data ONTAP SnapshotTM copies. The V- Series is compatible with the FAS family of storage systems. Data Protection Software Products We offer a broad range of integrated data protection solutions for enterprise customer environments: • Snapshot technology enables near-instantaneous, space efficient online backups of large data sets without affecting system performance; • SnapRestore» technology uses stored SnapshotTM backups to recover entire file systems or data volumes in seconds, regardless of capacity or number of files; • SnapVault» and Open Systems SnapVault technologies provide network- and storage-optimized disk-to-disk backup solutions; • MetroCluster is a unique solution that combines array-based clustering with synchronous mirroring designed to deliver continuous availability and zero data loss; • SnapMirror» data replication solution provides disaster recovery protection for business-critical data matched to the recovery point objectives and recovery time objectives of customer environments. Data Retention and Archive Products To meet growing regulatory compliance demands faced by most enterprises, we offer a broad suite of products to help enable data permanence, accessibility and privacy across a variety of different regulations such as the Sarbanes-Oxley Act, 21 CFR Part 11, SEC Rule 17a-4 and HIPAA. Immutable, cost-effective, resilient and reliable storage architectures can be created utilizing SnapLock» products. 6
  • 7.
    Flash Cache Our NetApp@ Flash Cache modules optimize the performance of random read intensive workloads such as file services and messaging. These intelligent read caches speed access to user data, reducing latency by a factor of 10 or more compared to disk drives. Faster response times can translate into higher throughput for random I/O workloads. NetApp Flash Cache and PAM give users performance that is comparable to that of solid state disks (SSDs) without the complexity of another storage tier. Storage Security Products Our DataFort storage security appliance provides a unified platform for data security and key management across NAS, IP SAN, and tape backup environments. The platform combines wire-speed encryption, access controls, authentication and automated key management to provide strong security for data at rest, while still allowing the capability to search compliant data for legal discovery purposes if the need arises. NetApp has partnered with Brocade Communications Systems, Inc. to provide advanced fabric services for SANs. These high- speed, highly reliable hardware devices deliver fabric-based encryption services to secure data assets either selectively or comprehensively. NetApp Services Our customers demand high availability and reliability of their storage infrastructure to ensure the successful, ongoing operation of their businesses. NetApp’s services are designed with this in mind. We provide professional services, global support solutions and customer education and training to help customers most effectively manage their data. The professional services and support solutions we offer help our customers to resolve business problems, reduce costs, keep businesses up and running continuously, comply with regulations and policies and improve overall operational results. We utilize a global, integrated model to provide consistent service delivery and global support during every phase of the customer engagement, including assessment and analysis, planning, design, installation, implementation, integration, optimization, ongoing support and remote management and monitoring. Services and support often involve phased rollouts, technology transitions and migrations and other long-term engagements. Sales, Principal Markets and Distribution Channels We market and sell our products in numerous countries throughout the world and we continue to make investments in our multi-year branding and awareness campaign to increase visibility of NetApp in the broader IT segment. Our diversified customer base spans a number of customer segments and vertical markets, including energy, financial services, government, high technology, internet, life sciences and healthcare services, major manufac- turing, media, entertainment, animation and video postproduction and telecommunications. We focus primarily on the data management and storage markets, offering an array of solutions from our high-end products designed for large enterprise customers to entry-level products designed for mid-sized enterprise customers. Our solutions are positioned to address the emerging opportunities presented by cloud computing. Our unified storage architecture, secure multi-tenancy capability, scalable systems, efficiency technologies and data manage- ment software functionality provide a powerful combination both for enterprises wanting to develop internal private clouds, and for service providers who want to build IT, Software, Storage and Infrastructure as a Service offerings. As of the end of fiscal 2010, our worldwide sales and marketing function consisted of managers, sales representatives, and technical support personnel. We have field sales offices in more than 45 countries. We employ a multi-channel distribution strategy, selling products and services to end users and service providers through a direct sales force and through channel partners, including value-added resellers, system integrators, original equipment manufacturers (OEMs) and distributors. During fiscal year 2010, sales through our indirect channels represented 69% of our total revenues. Sales to customers Arrow and Avnet, who are distributors, accounted for approximately 14% and 11% of our net revenues, respectively, in fiscal 2010 and for approximately 11% and 10% of our net revenues, respectively, for fiscal 2009. No individual customer accounted for ten percent or more of our net 7
  • 8.
    revenues during fiscal2008. Information about our segment disclosures, foreign operations and net sales attrib- utable to our geographic regions is included in Note 16 of the accompanying consolidated financial statements. Seasonality We have historically experienced a decline in revenues in the first quarter of our fiscal year, as the sales organization spends time developing new business after higher close rates in the fourth quarter, and because sales to European customers are historically weaker during the summer months. During the second quarter of our fiscal year, we have historically experienced increased sales, driven by the government sector, concurrent with the end of the U.S. federal government’s fiscal year in September, as well as an increase in business from European markets. We derive a majority of our revenue in any given quarter from orders booked in the same quarter. Bookings and revenues typically follow intraquarter seasonality patterns weighted toward the back end of the quarter. Backlog We manufacture products based on a combination of specific order requirements and forecasts of our customers’ demand. Orders are generally placed by customers on an as-needed basis. A substantial portion of our products are sold on the basis of standard purchase orders that are cancellable prior to shipment without penalty. In certain circumstances, purchase orders are subject to change with respect to quantity of product or timing of delivery resulting from changes in customer requirements. Our business is characterized by seasonal and intra- quarter variability in demand, as well as short lead-times and product delivery schedules. Accordingly, backlog at any given time may not be a meaningful indicator of future revenue. Manufacturing and Supply Chain We have outsourced manufacturing operations to third parties located in Memphis, Tennessee; Livingston, Scotland; Schiphol Airport, The Netherlands; Shanghai, China; and Singapore. These operations include materials procurement, commodity management, component engineering, test engineering, manufacturing engineering, product assembly, product assurance, quality control, final test, and global logistics. We rely on a limited number of suppliers for materials, as well as several key subcontractors for the production of certain subassemblies and finished systems. We multi-source wherever possible to mitigate supply risk. Our strategy has been to develop close relationships with our suppliers, exchanging critical information and implementing joint quality programs. We also use contract manufacturers for the production of major subassemblies to improve our manufacturing redundancy. This manufacturing strategy minimizes capital investments and overhead expenditures and creates flexibility for rapid expansion. We were awarded ISO 9001 certification on May 29, 1997 and continue to be ISO 9001 certified. We were awarded ISO 14001 certification on December 8, 2004 and continue to be ISO 14001 certified. Research and Development We conduct research and development activities in various locations throughout the world. In fiscal 2010, 2009 and 2008, research and development expenses represented 14%, 15% and 14% of our net revenues, respectively. These costs relate primarily to personnel and related costs incurred to conduct product development activities. Although we develop many of our products internally, we may acquire technology through business combinations or through licensing from third parties when appropriate. We believe that technical leadership is essential to our success and we expect to continue to commit substantial resources to research and development. Competition We compete with many companies in the markets we serve, including companies that offer a broad spectrum of IT products and services and others that offer specific storage and data management products or services. In the storage market, our primary system products and our associated software portfolio compete primarily with storage system products and data management software from EMC, Hitachi Data Systems, HP, IBM, and Oracle Corporation, through its acquisition of Sun Microsystems. In addition, Dell, Inc. is a competitor in the storage marketplace through its business arrangement with EMC, which allows Dell to resell EMC storage hardware and 8
  • 9.
    software products, aswell as through Dell’s acquisition of EqualLogic, through which Dell offers low-priced storage solutions. In the secondary storage market, which includes the disk-to-disk backup, compliance and business continuity segments, our solutions compete primarily against products from EMC and Oracle Corporation, through its acquisition of Sun Microsystems. We believe that most of these companies compete based on their market presence, products, service or price. Some of these companies also compete by offering storage and data management products or services together with other IT products or services, at minimal or no additional cost in order to preserve or gain market share. We believe that we have a number of competitive advantages over many of these companies, including product innovation and the relationships we have with our customers and partners. We believe the advantages of our products include functionality, scalability, performance, quality and operational efficiency. We believe we have an advantage in the nature of the relationships we form with our customers and partners worldwide. We strive to deliver an outstanding experience in every interaction we have with our customers and partners through our product, service and support offerings that enable us to provide our customers with a full range of expertise before, during and after their purchase from us or from one of our partners. An increase in industry consolidation may result in stronger competitors that are better able to compete as sole- source vendors for customers. In addition, current and potential competitors have established or may establish cooperative relationships among themselves or with third parties, including some of our partners. It is possible that new competitors or alliances among competitors may emerge and rapidly acquire significant market share. Proprietary Rights We currently rely on a combination of copyright and trademark laws, trade secrets, confidentiality procedures, contractual provisions, and patents to protect our proprietary rights. We seek to protect our software, documen- tation, and other written materials under trade secret, copyright, and patent laws, which afford only limited protection. We have registered our NetApp name and logo, Network ApplianceTM name and logo, Data ONTAP, DataFabric@, FAServer@, FlexVol, FilerView@, NearStore@, SecureShare@, SnapDrive@, SnapLock, SnapManager@, SnapMirror, SnapRestore, SnapVault, WAFL@, and others as trademarks in the United States. Other U.S. trademarks and U.S. registered trademarks are registered internationally as well. We will continue to evaluate the registration of additional trademarks as appropriate. We generally enter into confidentiality agreements with our employees, resellers, customers, and suppliers. We currently have multiple U.S. and international patent applications pending and multiple U.S. patents issued. In addition, through various licensing arrangements, we receive certain rights to intellectual property of others. We expect to maintain current licensing arrangements and to secure licensing arrangements in the future, as needed and to the extent available on reasonable terms and conditions, to support continued development and sales of our products and services. Some of these licensing arrangements require or may require royalty payments and other licensing fees. The amount of these payments and fees may depend on various factors, including but not limited to: the structure of royalty payments, offsetting considerations, if any, and the degree of use of the licensed technology. The industry in which we compete is characterized by rapidly changing technology, a large number of patents, and frequent claims and related litigation regarding patent and other intellectual property rights, and we are exposed to various risks related to legal proceedings or claims and protection of intellectual property rights. If we are unable to protect our intellectual property, we may be subject to increased competition that could materially and adversely affect our operating results. Environmental Disclosure We seek to comply with all applicable statutory and administrative requirements concerning environmental quality and worker health and safety. We have made, and will continue to make, expenditures for environmental compliance and protection. Such expenditures have not had, and are not expected to have, a material effect on our capital expenditures, results of operations or competitive position. We are voluntarily assessing our greenhouse gas emissions, and have begun to take action to reduce such emissions, for example through establishing employee commuter programs and evaluating the energy efficiency of 9
  • 10.
    our buildings. Variouslaws and regulations have been implemented or are under consideration to mitigate the effects of climate change caused by greenhouse gas emissions. Environmental laws are complex, change frequently and have tended to become more stringent over time. It is often difficult to estimate the future impact of environmental matters. Based on current information and subject to the finalization of the proposed regulations, we believe that our primary risk related to climate change is the risk of increased energy costs. However, because we are not an energy intensive business, we do not anticipate being subject to a cap and trade system or any other mitigation measures that would be material to our operations. We are also subject to other federal, state and local regulations regarding workplace safety and protection of the environment. Various international, federal, state and local provisions regulate the use and discharge of certain hazardous materials used in the manufacture of our products. Failure to comply with environmental regulations in the future could cause us to incur substantial costs or subject us to business interruptions. We believe we are substantially compliant with all applicable environmental laws. All of our products meet the requirements for WEEE, RoHS and China RoHS compliance. We have maintained an Environmental Management System since December 2004 as well as our ISO 14001 certification. As part of ISO 14001 requirements, we conduct an annual review of our operations and we monitor environmental legislation and requirements to help ensure we are taking necessary measures to remain in compliance with applicable laws. Working Capital Practices Information about our working capital practices is included in Item 7 — “Management’s Discussion and Analysis of Financial Condition and Results of Operation” under the heading “Liquidity and Capital Resources” and is incorporated herein by reference. Employees As of April 30, 2010, we had 8,333 employees, of which, 2,346 were in research and development, 3,912 were in sales and marketing, 1,215 were in services and manufacturing operations, and 860 were in finance and administration. We have never had a work stoppage and consider relations with our employees to be good. Competition for technical personnel in the industry in which we compete is intense. We believe that our future success depends in part on our continued ability to hire, assimilate, and retain qualified personnel. To date, we believe that we have been successful in recruiting qualified employees, but there is no assurance that we will continue to be successful in the future. Executive Officers Our executive officers and their ages as of May 25, 2010, are as follows: Name Age Position Thomas Georgens . . . . . . . . . . . . . . . . . 50 President, Chief Executive Officer, Director Manish Goel . . . . . . . . . . . . . . . . . . . . . 45 Executive Vice President, Products Steven J. Gomo . . . . . . . . . . . . . . . . . . . 58 Executive Vice President, Finance and Chief Financial Officer Andrew Kryder . . . . . . . . . . . . . . . . . . . 57 Senior Vice President, General Counsel, Secretary Robert E. Salmon . . . . . . . . . . . . . . . . . 49 Executive Vice President, Field Operations Thomas Georgens is the president and chief executive officer of the Company. Previously, Mr. Georgens served as president and chief operating officer responsible for all product operations and field operations worldwide from February 2008 to August 2009. Mr. Georgens has also been a member of the Board of Directors at NetApp since March 2008. Mr. Georgens joined NetApp in October 2005 as executive vice president and general manager of enterprise storage systems and was named executive vice president of product operations where he served in that role from January 2007 to February 2008. Before joining NetApp, Mr. Georgens spent nine years at Engenio, a subsidiary of LSI Corporation, with the last two years as chief executive officer. He has also served in various other positions, including president of LSI Logic Storage Systems and executive vice president of LSI Corporation. Prior to LSI Corporation, Mr. Georgens spent 11 years at EMC in a variety of engineering and marketing positions. 10
  • 11.
    Mr. Georgens holdsa B.S. degree and an M.E. degree in Computer and Systems Engineering from Rensselaer Polytechnic Institute as well as an M.B.A. degree from Babson College. Manish Goel was appointed the executive vice president of product operations in June 2009, overseeing all aspects of technology strategy and product engineering across the Company’s product portfolio. Mr. Goel has held a variety of leadership roles in corporate development, sales, and business unit general management since he joined NetApp in 2002. Prior to NetApp, Mr. Goel led corporate and business development activities for Cadence Design Systems and Copper Mountain Networks. Prior to that, he spent four years as a strategy consultant for McKinsey and Co. and six years as a systems software engineer. Mr. Goel holds a B.S. in electrical engineering from IIT Chennai, and an MBA in finance from the Wharton School of Business. Steven J. Gomo joined NetApp in August 2002 as senior vice president of finance and chief financial officer. He was appointed executive vice president of finance and chief financial officer in October 2004. Prior to joining the Company, he served as chief financial officer for Gemplus International S.A., headquartered in Luxembourg from November 2000 to April 2002 and as chief financial officer of Silicon Graphics, Inc., from February 1998 to August 2000. Prior to February 1998, he worked at Hewlett-Packard Company for 24 years in various positions, including financial management, corporate finance, general management, and manufacturing. Mr. Gomo currently serves on the board of SanDisk Corporation. Mr. Gomo holds an M.B.A. degree from Santa Clara University and a B.S. degree in business administration from Oregon State University. Andrew Kryder is the Senior Vice President, General Counsel, Secretary of the Company. He was promoted to Senior Vice President Tax and General Counsel in June 2006. Mr. Kryder joined NetApp in August 2000 as Vice President, Legal and Tax and General Counsel. He has served as the Company’s Secretary since 2001. Prior to joining NetApp, he served as General Counsel and Vice President, Tax with Quantum Corporation, headquartered in Santa Clara, California, from November 1990 to August 2000 and was a tax partner and staff accountant with Ernst & Young from June 1977 to November 1990. Mr. Kryder currently serves on the board of JW house, a charitable organization. Mr. Kryder received his Juris Doctorate and Masters of Business Administration from Santa Clara University in 1977 and his B.S. degree in business administration also from Santa Clara University in 1974. Robert E. Salmon joined NetApp in January 1994 and was appointed executive vice president, field operations in December 2005. Mr. Salmon has served as the Company’s executive vice president of worldwide sales since September 2004. From August 2003 to September 2004, Mr. Salmon served as the Company’s senior vice president of worldwide sales and from May 2000 to August 2003, Mr. Salmon served as the Company’s vice president of North American sales. Prior to his tenure at NetApp Mr. Salmon spent nearly ten years with Sun Microsystems and Data General Corporation. Mr. Salmon graduated from California State University, Chico with a B.S. degree in computer science. Additional Information Our Internet address is www.netapp.com. We make available through our Internet Web site our annual reports on Form 10-K, quarterly reports on Form 10-Q, current reports on Form 8-K, and amendments to those reports filed or furnished pursuant to Section 13(a) of the Securities Exchange Act of 1934, as amended, as soon as reasonably practicable after we electronically file such material with, or furnish it to, the SEC. The SEC maintains an Internet site (www.sec.gov) that contains reports, proxy and information statements, and other information regarding issuers that file electronically with the SEC. The public also may read and copy these filings at the SEC’s Public Reference Room at 100 F Street, N.E., Washington, D.C. 20549. Information about this Public Reference Room is available by calling (800) SEC-0330. Item 1A. Risk Factors The following risk factors and other information included in this Annual Report on Form 10-K should be carefully considered. The risks and uncertainties described below are not the only ones we face. Additional risks and uncertainties not presently known to us or that we presently deem less significant may also impair our business operations. Please see page 3 of this Annual Report on Form 10-K for additional discussion of these 11
  • 12.
    forward-looking statements. Ifany of the events or circumstances described in the following risk factors actually occurs, our business, operating results, and financial condition could be materially adversely affected. Our operating results may be adversely affected by uncertain economic and market conditions. We are subject to the effects of general global economic and market conditions. Challenging economic conditions worldwide have from time to time contributed to slowdowns in the computer, storage, and networking industries at large, as well as the information technology (“IT”) market, resulting in: • Reduced demand for our products as a result of constraints on IT related spending by our customers; • Increased price competition for our products from competitors; • Deferment of purchases and orders by customers due to budgetary constraints or changes in current or planned utilization of our systems; • Risk of excess and obsolete inventories; • Risk of supply constraints: • Excess facilities costs; • Higher overhead costs as a percentage of revenues; • Negative impacts from increased financial pressures on customers, distributors and resellers; • Negative impacts from increased financial pressures on key suppliers or contract manufacturers; and • Potential discontinuance of product lines or businesses and related asset impairments. Any of the above mentioned factors could have a material and adverse effect on our business and financial performance. Our quarterly operating results may fluctuate, which could adversely impact our common stock price. We believe that period-to-period comparisons of our results of operations are not necessarily meaningful and should not be relied upon as indicators of future performance. Our operating results have in the past, and will continue to be, subject to quarterly fluctuations as a result of numerous factors, some of which may contribute to more pronounced fluctuations during times of economic volatility. These factors include, but are not limited to, the following: • Fluctuations in demand for our products and services, in part due to changes in general economic conditions and specific economic conditions in the storage and data management market; • A shift in federal government spending patterns; • Changes in sales and implementation cycles for our products and reduced visibility into our customers’ spending plans and associated revenues; • The level of price and product competition in our target product markets; • The impact of economic uncertainty on our customers’ budgets and IT spending capacity; • Our ability to maintain appropriate inventory levels and purchase commitments; • Our reliance on a limited number of suppliers, and industry consolidation in our supply base, which could subject us to periodic supply-and-demand, price rigidity, and quality issues with our components; • The timing of bookings, the cancellation of significant orders and the management of our backlog; • Product configuration and mix; • The extent to which our customers renew their service and maintenance contracts with us; 12
  • 13.
    • Seasonality, suchas our historical seasonal decline in revenues in the first quarter of our fiscal year and seasonal increase in revenues in the second quarter of our fiscal year, with the latter due in part to the impact of the U.S. federal government’s September 30 fiscal year end on the timing of its orders; • Linearity, such as our historical intraquarter bookings and revenue pattern in which a disproportionate percentage of each quarter’s total bookings and related revenue occur in the last month of the quarter; • Announcements and introductions of, and transitions to, new products by us or our competitors; • Deferrals of customer orders in anticipation of new products or product enhancements introduced by us or our competitors; • Our ability to develop, introduce, and market new products and enhancements in a timely manner; • Our levels of expenditure on research and development and sales and marketing programs; • Our ability to effectively manage our operating expenses; • Adverse movements in foreign currency exchange rates in the countries in which we do business; • The dilutive impact of our $1.265 billion of 1.75% convertible senior notes due June 2013 (the “Notes”) and related warrants on our earnings per share; • Excess or inadequate facilities; • Actual events, circumstances, outcomes and amounts differing from judgments, assumptions, and estimates used in determining the values of certain assets (including the amounts of valuation allowances), liabilities, and other items reflected in our consolidated financial statements; • Disruptions resulting from new systems and processes as we continue to enhance and scale our system infrastructure; and • Future accounting pronouncements and changes in accounting rules, such as the increased use of fair value measures, changes in accounting standards related to revenue recognition, and the potential requirement that U.S. registrants prepare financial statements in accordance with International Financial Reporting Standards (IFRS). Due to such factors, operating results for a future period are difficult to predict, and, therefore, prior results are not necessarily indicative of results to be expected in future periods. Any of the foregoing factors, or any other factors discussed elsewhere herein, could have a material adverse effect on our business, results of operations, and financial condition. It is possible that in one or more quarters our results may fall below our forecasts and the expectations of public market analysts and investors. In such event, the trading price of our common stock would likely decrease. Our revenue for a particular period is difficult to forecast, and a shortfall in revenue may harm our business and our operating results. Our revenues for a particular period are difficult to forecast, especially in times of economic uncertainty. Our revenues are also difficult to forecast because the storage and data management market is rapidly evolving, and our sales cycle varies substantially from customer to customer. New or additional product introductions also increase the complexities of forecasting revenues. We derive a majority of our revenues in any given quarter from orders booked in the same quarter. Bookings typically follow intraquarter seasonality patterns weighted toward the back end of the quarter. If we do not achieve bookings in the latter part of a quarter consistent with our quarterly targets, our financial results will be adversely impacted. Additionally, due to the complexities associated with revenue recognition, we may not accurately forecast our non-deferred and deferred revenues, which could adversely impact our results of operations. We use a “pipeline” system, a common industry practice, to forecast bookings and trends in our business. Sales personnel monitor the status of potential business and estimate when a customer will make a purchase decision, the dollar amount of the sale and the products or services to be sold. These estimates are aggregated periodically to 13
  • 14.
    generate a bookingspipeline. Our pipeline estimates may prove to be unreliable either in a particular quarter or over a longer period of time, in part because the “conversion rate” of the pipeline into revenues varies from customer to customer, can be difficult to estimate, and requires management judgment, and also because customers’ purchasing decisions are subject to delay, reduction or cancellation. Small deviations from our forecasted conversion rate may result in inaccurate plans and budgets and could materially and adversely impact our business or our planned results of operations. Economic uncertainties have caused, and may in the future again cause, consumers, businesses and govern- ments to defer purchases in response to tighter budgets, credit, decreased cash availability and declining customer confidence. Accordingly, future demand for our products could differ from our current expectations. We have experienced periods of alternating growth and decline in revenues and operating expenses. If we are not able to successfully manage these fluctuations, our business, financial condition and results of operations could be significantly impacted. Changing market conditions and economic uncertainty create a challenging operating environment for our business. It is critical that we maintain appropriate alignment between our cost structure and our expected growth and revenues, while at the same time, continue to make strategic investments for future growth. Our expense levels are based in part on our expectations as to future revenues, and a significant percentage of our expenses are fixed. We have a limited ability to quickly or significantly reduce our fixed costs, and if revenue levels are below our expectations, operating results will be adversely impacted. During periods of uneven growth, we may incur costs before we realize the anticipated related benefits, which could harm our operating results. We have made, and will continue to make, significant investments in engineering, sales, service and support, marketing programs and other functions to support and grow our business. We are likely to recognize the costs associated with these investments earlier than some of the related anticipated benefits (revenue growth), and the return on these investments may be lower, or may develop more slowly, than we expect, which could harm our business, operating results and financial condition. Conversely, if we are unable to effectively manage our resources and capacity during periods of increasing demand for our products, we could also experience an adverse impact to our business, operating results and financial condition. If the storage and data management market fails to grow, or grows slower than we expect, our revenues will be adversely affected. Also, even if IT spending increases, our revenues may not grow at the same pace. Our gross margins have varied over time and may continue to vary, and such variation may make it more difficult to forecast our earnings. Our total gross margins are impacted by the mix of product, software entitlements and maintenance and services revenues. Our product gross margins have been and may continue to be affected by a variety of factors, including: • Demand for storage and data management products; • Pricing actions, rebates, sales initiatives, discount levels, and price competition; • Direct versus indirect and OEM sales; • Changes in customer, geographic, or product mix, including mix of configurations within products; • The mix of sales to commercial and U.S. government sector end users; • The timing and amount of revenue recognized and deferred; • New product introductions and enhancements; • Licensing and royalty arrangements; 14
  • 15.
    • Excess inventorylevels or purchase commitments as a result of changes in demand forecasts or last time buy purchases; • Possible product and software defects as we transition our products; and • The cost of components, contract manufacturing costs, quality, warranty, and freight. Changes in software entitlements and maintenance gross margins may result from various factors, such as: • The size of the installed base of products under support contracts; • The timing of technical support service contract renewals; • Demand for and the timing of delivery of upgrades; and • The level of spending on our customer support infrastructure. Changes in service gross margins may result from various factors, such as: • The mix of customers; • The size and timing of service contract renewals; • Spares stocking requirements to support new product introductions; • The volume, cost and use of outside partners to deliver support services on our behalf; and • Product quality and serviceability issues. Due to such factors, gross margins are subject to variations from period to period and are difficult to predict. An increase in competition and industry consolidation could materially and adversely affect our operating results. The storage and data management markets are intensely competitive and are characterized by rapidly changing technology. In the storage market, our primary and near-line storage system products and our associated software portfolio compete primarily with storage system products and data management software from EMC, Hitachi Data Systems, HP, IBM, and Oracle Corporation, through its acquisition of Sun Microsystems. In addition, Dell, Inc. is a competitor in the storage marketplace through its business arrangement with EMC, which allows Dell to resell EMC storage hardware and software products, as well as through Dell’s acquisition of EqualLogic, through which Dell offers low-priced storage solutions. In the secondary storage market, which includes the disk-to-disk backup, compliance and business continuity segments, our solutions compete primarily against products from EMC and Oracle Corporation, through its acquisition of Sun Microsystems. There has been a trend toward industry consolidation in our markets for several years. For example, in January 2010, Oracle Corporation, one of our strategic partners, completed its acquisition of Sun Microsystems, one of our competitors; in addition, in July 2009, EMC, one of our competitors, acquired Data Domain. We expect this trend to continue as companies attempt to strengthen or hold their market positions in an evolving industry and as companies become unable to maintain their competitive positions or continue operations. We believe that industry consol- idation may result in stronger competitors that are better able to compete as sole-source vendors for customers. In addition, current and potential competitors have established or may establish strategic alliances among themselves or with third parties, including some of our partners. For example, in November 2009, Cisco and EMC together with VMware announced a Virtual Computing Environment coalition. It is possible that new competitors or alliances among competitors may emerge and rapidly acquire significant market share. We may not be able to compete successfully against current or future competitors. Competitive pressures we face could materially and adversely affect our business and operating results. 15
  • 16.
    Disruption of orchanges in our distribution model could harm our sales. If we fail to develop and maintain strong relationships with our distributors, or if our distributors fail to effectively manage the sale of our products or services on our behalf, our revenues and gross margins could be adversely affected. We market and sell our storage data management solutions directly through our worldwide sales force and indirectly through channel partners such as value-added resellers, systems integrators, distributors, OEMs and strategic business partners, and we derive a significant portion of our revenues from these indirect channels. During fiscal 2010, revenues generated from sales from our indirect channel distribution accounted for 69% of our revenues. In order for us to maintain or increase our revenues, we must effectively manage our relationships with channel partners. Several factors could result in disruption of or changes in our indirect channel distribution model, which could materially harm our revenues and gross margins, including the following: • Our indirect channel partners may compete directly with other channel partners or with our direct sales force. Due to these conflicts, our indirect channel partners could stop or reduce their efforts in marketing our products. • Our indirect channel partners may demand that we absorb a greater share of the risks that their customers may ask them to bear; • Our indirect channel partners may have insufficient financial resources and may not be able to withstand changes and challenges in business conditions; and • Our indirect channel partners’ financial condition or operations may weaken. There is no assurance that we will be able to attract new indirect channel partners, retain these indirect channel partners or that we will be able to secure additional or replacement indirect channel partners in the future, especially in light of changes in end customer demand patterns and changes in available and competing technologies from competitors. The loss of one or more of our key indirect channel partners in a given geographic area could harm our operating results within that area, as qualifying and developing new indirect channel partners typically requires a significant investment of time and resources before acceptable levels of productivity are met. Our inability to effectively establish, train, retain and manage our distribution channel could harm our sales. In addition, we depend on our indirect channel partners to comply with applicable regulatory requirements in the jurisdictions in which they operate. Their failure to do so could have a material adverse effect on our revenues and operating results. Our OEM relationship may not continue to generate significant revenues. In April 2005, we entered into an OEM agreement with IBM, which enables IBM to sell IBM branded solutions based on NetApp unified solutions, including NearStore» and V-Series systems, as well as associated software offerings. While this agreement is an element of our strategy to expand our reach into more customers and countries, we do not have an exclusive relationship with IBM, and there is no minimum commitment for any given period of time; therefore, this relationship may not continue to generate significant revenues. In addition, we have no control over the products that IBM selects to sell, or its release schedule and timing of those products; nor do we control its pricing. In the event that sales through our OEM relationship increase, we may experience distribution channel conflicts between our direct sales force and the OEM or among our channel partners. If we fail to minimize channel conflicts, or if our OEM relationship does not continue to generate significant revenues, our operating results and financial condition could be harmed. 16
  • 17.
    A portion ofour revenues is generated by large, recurring purchases from various customers, resellers and distributors. A loss, cancellation or delay in purchases by any of these parties has and in the future could negatively affect our revenues. During fiscal 2010, sales to distributors Arrow and Avnet accounted for approximately 14% and 11%, respectively of our net revenues. The loss of orders from these, or any of our more significant customers, strategic partners, distributors or resellers could cause our revenues and profitability to suffer. Our ability to attract new customers will depend on a variety of factors, including the cost-effectiveness, reliability, scalability and com- prehensiveness of our product offerings, and our ability to address customer demands. We also have an agreement with Fujitsu Technology Solutions (“Fujitsu”), which enables Fujitsu to lease, sell, market and resell NetApp products to end users and Fujitsu sales partners worldwide and to integrate NetApp products into Fujitsu bundled offerings, as well as to market NetApp’s support services. We generally do not enter into binding purchase commitments with our customers for an extended period of time, and thus we may not be able to continue to receive large, recurring orders from these customers, resellers or distributors. For example, our reseller agreements generally do not require minimum purchases and our customers, resellers and distributors can stop purchasing and marketing our products at any time. Unfavorable economic conditions may negatively impact our operations by affecting the solvency of our customers, resellers and distributors, or the ability of our customers to obtain credit to finance purchases of our products. If the uncertainty in the economy continues, or conditions deteriorate, and our sales decline, our financial condition and operating results could be adversely impacted. Because our expenses are based on our revenue forecasts, a substantial reduction or delay in sales of our products to, or unexpected returns from customers and resellers, or the loss of any significant customer or reseller, could harm our business. We expect that our largest customers in the future could be different from our largest customers today. End users could stop purchasing and indirect channel partners could stop marketing our products at any time. The loss of one or more of our key indirect channel partners or the failure to obtain and ship a number of large orders each quarter could harm our operating results. In addition, a change in the pricing practices of one or more of our large customers could adversely affect our revenues and gross margins. The U.S. government has contributed to our revenue growth and has become an important customer for us. Future revenue from the U.S. government is subject to shifts in government spending patterns. A decrease in government demand for our products could materially affect our revenues. In addition, our business could be adversely affected as a result of future examinations by the U.S. government. The U.S. government has become an important customer for the storage and data management market and for us; however, government demand is unpredictable, and there can be no assurance that we will maintain or grow our revenues from the U.S. government. Government agencies are subject to budgetary processes and expenditure constraints that could lead to delays or decreased capital expenditures in IT spending. If the government or individual agencies within the government reduce or shift their capital spending patterns, our revenues and operating results may be harmed. In addition, selling our products to the U.S. government also subjects us to certain regulatory requirements. For example, in April 2009, we entered into a settlement agreement with the United States of America, acting through the United States Department of Justice (“DOJ”) and on behalf of the General Services Administration (the “GSA”), under which we paid the United States $128.0 million, plus interest of $0.7 million, related to a dispute regarding our discount practices and compliance with the price reduction clause provisions of GSA contracts between August 1997 and February 2005. The failure to comply with U.S. government regulatory requirements could subject us to fines and other penalties, which could have a material adverse effect on our revenues, operating results and financial position. If we are unable to maintain our existing relationships and develop new relationships with major strategic partners, our revenues may be impacted negatively. An element of our strategy to increase revenues is to strategically partner with major third-party software and hardware vendors to integrate our products into their products and also co-market our products with the vendors. We have significant partner relationships with database, business application, backup management and server 17
  • 18.
    virtualization companies, includingMicrosoft, Oracle, SAP, Symantec and VMware. In addition, in November 2009, we announced our intention to expand our relationship with Fujitsu, and in January 2010, we announced an expansion of our collaboration with Cisco and VMware, including a cooperative support arrangement. A number of these strategic partners are industry leaders that offer us expanded access to segments of the storage and data management market. There is intense competition for attractive strategic partners, and even if we can establish relationships with these or other partners, these partnerships may not generate significant revenues or may not continue to be in effect for any specific period of time. If these relationships fail to materialize as expected, we could experience lower than expected revenue growth, suffer delays in product development, or other operational difficulties. In addition, some of our partners, including Oracle, Cisco and VMware, are also partnering with other storage vendors which may increase the availability of competing solutions, harm our ability to continue as the vendor of choice for those partners and harm our ability to grow our business with those partners. We intend to continue to establish and maintain business relationships with technology companies to expand our marketing reach and accelerate the development of our storage and data management solutions. To the extent that we are unsuccessful in developing new relationships or maintaining our existing relationships, our future revenues and operating results could be impacted negatively. In addition, the loss of a strategic partner could have a material adverse effect on our revenues and operating results. Our future financial performance depends on growth in the storage and data management markets. If the performance of these markets does not meet the expectations upon which we calculate and forecast our revenues, our operating results will be materially and adversely impacted. All of our products address the storage and data management markets. Accordingly, our future financial performance will depend in large part on continued growth in the storage and data management markets and on our ability to adapt to emerging standards in these markets. The markets for storage and data management have been recently adversely impacted by the global economic uncertainty, and as a result of continued uncertainty, the markets may not grow as anticipated or may decline. Additionally, emerging standards in these markets may adversely affect the UNIX», Windows» and the World Wide Web server markets upon which we depend. For example, we provide our open access data retention solutions to customers within the financial services, healthcare, pharmaceutical and government market segments, industries that are subject to various evolving governmental regulations with respect to data access, reliability and permanence (such as Rule 17(a)(4) of the Securities Exchange Act of 1934, as amended) in the United States and in the other countries in which we operate. If our products do not meet and continue to comply with these evolving governmental regulations in this regard, customers in these market and geographical segments will not purchase our products, and we will not be able to expand our product offerings in these market and geographical segments at the rates which we have forecasted. Supply chain issues, including financial problems of contract manufacturers or component suppliers, or a shortage of adequate component supply or manufacturing capacity that increases our costs or causes a delay in our ability to fulfill orders, could have a material adverse impact on our business and operating results, and our failure to estimate customer demand properly may result in excess or obsolete component supply, which could adversely affect our gross margins. The fact that we do not own or operate our manufacturing facilities and supply chain exposes us to risks, including reduced control over quality assurance, production costs and product supply, which could have a material adverse impact on the supply of our products and on our business and operating results. We rely on a limited number of suppliers for components utilized in the assembly of our products, which has and could subject us to future periodic supply constraints and price rigidity. Financial problems of either contract manufacturers, component suppliers or other parties in our supply chain and reservation of manufacturing capacity at our contract manufacturers by other companies, inside or outside of our industry, could either limit supply or increase costs of our products. Qualifying a new contract manufacturer and 18
  • 19.
    commencing volume productionis expensive and time-consuming, and disruption or termination of manufacturing capacity from any contract manufacturer could negatively impact our ability to manufacture and sell our products. We intend to regularly introduce new products and product enhancements, which will require us to rapidly achieve volume production by coordinating with our contract manufacturers and suppliers. A reduction or interruption in supply; a significant increase in the price of one or more components; a failure to adequately procure inventory by our contract manufacturers; a failure to appropriately cancel, reschedule, or adjust our requirements based on our business needs; or a decrease in demand for our products could materially adversely affect our business, operating results, and financial condition and could materially damage customer relationships. Furthermore, as a result of binding price or purchase commitments with suppliers, we may be obligated to purchase components at prices that are higher than those available in the current market. In the event that we become committed to purchase components at prices in excess of the current market price when the components are actually used, our gross margins could decrease. As the demand for our products has increased, we have experienced, and may continue to experience tightening of supply of some components leading to longer lead times and component supply constraints, which has and in the future could continue to result in the delay of shipments. We are exposed to the credit and non-payment risk of our customers, resellers, and distributors, especially during times of economic uncertainty and tight credit markets, which could result in material losses. Most of our sales to customers are on an open credit basis, with typical payment terms of 30 days. While we monitor individual customer payment capability in granting such open credit arrangements, and seek to limit such open credit to amounts we believe are reasonable, we may experience losses due to a customer’s inability to pay. Beyond our open credit arrangements, we also have recourse and nonrecourse customer financing leasing arrangements using third party leasing companies. Under the terms of recourse leases, which are treated as off- balance sheet arrangements, we remain liable for the aggregate unpaid remaining lease payments to the third party leasing company in the event of end-user customer default. We also offer financing arrangements whereby the end- user customer pays a fixed monthly amount plus a variable amount based on actual storage capacity used. These arrangements subject us to additional risk around revenue recognition and profitability due to the uncertainties associated with the variable portion of the arrangements. In addition, from time to time we provide guarantees for a portion of other financing arrangements under which we could be called upon to make payments to our funding parties in the event of nonpayment by end-user customers. We expect demand for customer financing to continue. During periods of economic uncertainty, our exposure to credit risks from our customers increases. In addition, our exposure to credit risks of our customers may increase further if our customers and their customers or their lease financing sources are adversely affected by global economic conditions. In the past, there have been bankruptcies by our customers, both who have open credit and who have lease financing arrangements with us, causing us to incur bad debt charges, and, in the case of financing arrangements, a loss of revenues. We may be subject to similar losses in future periods. Any future losses could harm our business and have a material adverse effect on our operating results and financial condition. Additionally, to the extent that the recent turmoil in the credit markets makes it more difficult for customers to obtain open credit or lease financing, those customers’ ability to purchase our product could be adversely impacted, which in turn could have a material adverse impact on our financial condition and operating results. The market price for our common stock has fluctuated significantly in the past and will likely continue to do so in the future. The market price for our common stock has experienced substantial volatility in the past, and several factors could cause substantial fluctuation in the future. These factors include but are not limited to: • Fluctuations in our operating results compared to prior periods and forecasts; • Variations between our operating results and either the guidance we have furnished to the public or the published expectations of securities analysts; • Industry consolidation and the resulting perception of increased competition; 19
  • 20.
    • Economic developmentsin the storage and data management market as a whole; • Fluctuations in the valuation of companies perceived by investors to be comparable to us; • Changes in analysts’ recommendations or projections; • Changes in our relationships with our suppliers, customers, channel and strategic partners; • Announcements of the completion or dissolution of strategic alliances within the industry; • Dilutive impacts of our convertible Notes and related warrants; • International conflicts and acts of terrorism; • Announcements of new products, applications, or product enhancements by us or our competitors; • Inquiries by the SEC, NASDAQ, law enforcement, or other regulatory bodies; and • General market conditions, including recent global or regional economic uncertainties. In addition, the stock market has experienced volatility that has particularly affected the market prices of the equity securities of many technology companies. Certain macroeconomic factors such as changes in interest rates, the market climate for the technology sector, and levels of corporate spending on IT, could continue to have an impact on the trading price of our stock, and the market price of our common stock may fluctuate significantly in the future. Changes in market conditions have led, and in the future could lead, to charges related to the discontinuance of certain of our products and asset impairments. In response to changes in economic conditions and market demands, we may decide to strategically realign our resources and consider cost containment measures including restructuring, disposing of, or otherwise discontinuing certain products. Any decision to limit investment in, dispose of, or otherwise exit products may result in the recording of charges to earnings, including inventory and technology-related or other intangible asset write-offs, workforce reduction costs, charges relating to consolidation of excess facilities, cancellation penalties or claims from third parties who were resellers or users of discontinued products, which would harm our operating results. Our estimates with respect to the useful life or ultimate recoverability of our carrying basis of assets, including purchased intangible assets, could change as a result of such assessments and decisions. Additionally, we are required to perform goodwill impairment tests on an annual basis, and between annual tests in certain circumstances when impairment indicators exist or if certain events or changes in circumstances have occurred. Future goodwill impairment tests may result in charges to earnings, which could materially harm our operating results. If we are unable to develop and introduce new products and respond to technological change, if our new products do not achieve market acceptance, if we fail to manage the interoperability and transition between our new and old products, or if we cannot provide the expected level of service and support for our new products, our operating results could be materially and adversely affected. Our future growth depends upon the successful development and introduction of new hardware and software products. Due to the complexity of storage subsystems and storage security appliances and the difficulty in gauging the engineering effort required to produce new products, such products are subject to significant technical risks. In addition, our new products must respond to technological changes and evolving industry standards. If we are unable, for technological or other reasons, to develop and introduce new products in a timely manner in response to changing market conditions or customer requirements, or if such products do not achieve market acceptance, our operating results could be materially and adversely affected. New or additional product introductions increase the complexities of forecasting revenues, and subject us to additional financial and operational risks. If they are not managed effectively, we could experience material risks to our operations, financial condition and business model. As new or enhanced products are introduced, we must successfully manage the interoperability and transition from older products in order to minimize disruption in customers’ ordering patterns, avoid excessive levels of older product inventories, and ensure that enough supplies of new products can be delivered to meet customers’ demands. 20
  • 21.
    As we enternew or emerging markets, we will likely increase demands on our service and support operations and may be exposed to additional competition. We may not be able to provide products, service and support to effectively compete for these market opportunities. Risks inherent in our international operations could have a material adverse effect on our business. A substantial portion of our revenues are derived from sales outside of the United States. During fiscal 2010, our international revenues accounted for 50% of our total revenues. A substantial portion of our products are manufactured outside of the U.S., and we have research and development and service centers overseas. Accord- ingly, our business and our future operating results could be adversely affected by a variety of factors affecting our international operations, some of which are beyond our control, including regulatory, political, or economic conditions in a specific country or region, trade protection measures and other regulatory requirements, government spending patterns, and acts of terrorism and international conflicts. In addition, we may not be able to maintain or increase international market demand for our products. We face exposure to adverse movements in foreign currency exchange rates as a result of our international operations. These exposures may change over time as business practices evolve, and they could have a material adverse impact on our financial results and cash flows. Our international sales are denominated in U.S. dollars and in foreign currencies. An increase in the value of the U.S. dollar relative to foreign currencies could make our products more expensive and therefore potentially less competitive in foreign markets. Conversely, lowering our price in local currency may result in lower U.S.-based revenues. A decrease in the value of the U.S. dollar relative to foreign currencies could increase operating expenses in foreign markets. Additionally, we have exposures to emerging market currencies, which can experience extreme volatility. We utilize forward and option contracts to hedge our foreign currency exposure associated with certain assets and liabilities as well as anticipated foreign currency cash flows on a short-term basis. All balance sheet hedges are marked to market through earnings every quarter. The time-value component of our cash flow hedges is recorded in earnings while all other gains and losses are marked to market through other comprehensive income until forecasted transactions occur, at which time such realized gains and losses are recognized in earnings. These hedges attempt to reduce, but do not always entirely eliminate, the impact of currency exchange movements. Factors that could have a negative impact on the effectiveness of our hedging program include inaccuracies in forecasting, widening interest rate differentials, and volatility in the foreign exchange market. Our hedging strategies may not be successful and currency exchange rate fluctuations could have a material adverse effect on our operating results. Certain United States Government export restrictions impede our ability to sell to certain end users certain of our products. The United States, through the Bureau of Industry Security, places restrictions on the export of certain encryption technology. These restrictions may include: the requirement to have a license to export the technology; the requirement to have software licenses approved before export is allowed; and outright bans on the licensing of certain encryption technology to particular end users or to all end users in a particular country. Certain of our products are subject to various levels of export restrictions. These export restrictions could negatively impact our business. Our international operations are subject to other risks, including general import/export restrictions, regulations related to data privacy, and other complex rules and regulations under which we must conduct business in foreign countries. We are also subject to the potential loss of proprietary information due to piracy, misappro- priation or laws that may be less protective of our intellectual property rights than U.S. law. Such factors could have an adverse impact on our business, operating results and financial position. Additional risks inherent in our international business activities generally include, among others, longer accounts receivable payment cycles and difficulties in managing international operations. Moreover, in many foreign countries, particularly in those with developing economies, it is common to engage in business practices that are prohibited by regulations applicable to us, such as the Foreign Corrupt Practices Act. Although we implement policies and procedures designed to ensure compliance with these laws, our employees, contractors and agents, as well as those companies to which we outsource certain of our business operations, may take actions in violation of these policies. Any such violation could subject us to fines and other penalties, which could have a material adverse effect on our business, financial condition or results of operations. 21
  • 22.
    Changes in oureffective tax rate or adverse outcomes resulting from examination of our income tax returns could adversely affect our results. Our effective tax rate could be adversely affected by several factors, many of which are outside of our control, including: • Earnings being lower than anticipated in countries where we are taxed at lower rates as compared to the U.S. statutory tax rate; • Material differences between forecasted and actual tax rates as a result of a shift in the mix of pretax profits and losses by tax jurisdiction, our ability to use tax credits, or effective tax rates by tax jurisdiction that differ from our estimates; • Changing tax laws or related interpretations, accounting standards, regulations, and interpretations in multiple tax jurisdictions in which we operate, as well as the requirements of certain tax rulings; • An increase in expenses not deductible for tax purposes, including certain stock-based compensation expense, write-offs of acquired in-process research and development, and impairment of goodwill; • The tax effects of purchase accounting for acquisitions and restructuring charges that may cause fluctuations between reporting periods; • Changes related to our ability to ultimately realize future benefits attributed to our deferred tax assets, including those related to other-than-temporary impairments; • Tax assessments resulting from income tax audits or any related tax interest or penalties could significantly affect our income tax provision for the period in which the settlements take place; and • A change in our decision to indefinitely reinvest foreign earnings. We receive significant tax benefits from sales to our non-U.S. customers. These benefits are contingent upon existing tax regulations in the United States and in the countries in which our international operations are located. Future changes in domestic or international tax regulations could adversely affect our ability to continue to realize these tax benefits. We have not provided for United States federal and state income taxes or foreign withholding taxes that may result on future remittances of undistributed earnings of foreign subsidiaries. The Obama admin- istration has announced several proposals to reform United States tax rules, including proposals that may result in a reduction or elimination of the deferral of United States income tax on our future unrepatriated earnings. Should such anti-deferral provisions be enacted, our effective tax rate could be adversely affected. We are currently undergoing federal income tax audits in the United States and several foreign tax jurisdictions. The rights to some of our intellectual property (“IP”) are owned by certain of our foreign subsidiaries, and payments are made between U.S. and foreign tax jurisdictions relating to the use of this IP in a qualified cost sharing arrangement. In recent years, several other U.S. companies have had their foreign IP arrangements challenged as part of IRS examinations, which has resulted in material proposed assessments and/or litigation with respect to those companies. During fiscal year 2009, we received Notices of Proposed Adjustments from the IRS in connection with a federal income tax audit of our fiscal 2003 and 2004 tax returns. We filed a protest with the IRS in response to the Notices of Proposed Adjustments and subsequently received a rebuttal from the IRS examination team in response to our protest. We recently were informed by the IRS that this audit will proceed to the IRS Appeals level for further administrative review. The Notices of Proposed Adjustments in this audit focus primarily on issues of the timing and the amount of income recognized and deductions taken during the audit years and on the level of cost allocations made to foreign operations during the audit years. The IRS recently commenced the examination of our fiscal 2005 through 2007 federal income tax returns, and in addition, the California Franchise Tax Board has notified us of their intent to examine our fiscal 2007 and 2008 California tax returns. The scope of the IRS and California Franchise Tax Board examinations are unclear at this time. If the ultimate determination of income taxes assessed under the current IRS audits or under audits being conducted in any of the other tax jurisdictions in which we operate results in an amount in excess of the tax provision we have recorded or reserved for, our operating results, cash flows and financial condition could be adversely affected. 22
  • 23.
    Our international operationscurrently benefit from a tax ruling concluded in the Netherlands which expires on April 30, 2015 and results in a lower level of earnings subject to tax in the Netherlands. If we are unable to negotiate a similar tax ruling upon expiration of the current ruling, our effective tax rate could increase and our operating results could be adversely affected. Our effective tax rate could also be adversely affected by different and evolving interpretations of existing law or regulations, which in turn would negatively impact our operating and financial results as a whole. Our effective tax rate could also be adversely affected if there is a change in international operations and how the operations are managed and structured. The price of our common stock could decline to the extent that our financial results are materially affected by an adverse change in our effective tax rate. Our leverage and debt service obligations may adversely affect our financial condition, results of operations and our earnings per share. As a result of the sale of our Notes, we have a greater amount of long-term debt than we have maintained in the past. In addition, we have various synthetic lease arrangements related to some of our facilities at our corporate headquarters in Sunnyvale, California, and, subject to the restrictions in our existing and any future financing agreements, we may incur additional debt. Our maintenance of higher levels of indebtedness could have adverse consequences including: • Impacting our ability to satisfy our obligations; • Increasing the portion of our cash flows from operations may have to be dedicated to interest and principal payments and may not be available for operations, working capital, capital expenditures, expansion, acquisitions or general corporate or other purposes; • Impairing our ability to obtain additional financing in the future; • Limiting our flexibility in planning for, or reacting to, changes in our business and industry; and • Making us more vulnerable to downturns in our business, our industry or the economy in general. Our ability to meet our expenses and debt obligations will depend on our future performance, which will be affected by financial, business, economic, regulatory and other factors. We will not be able to control many of these factors, such as economic conditions and governmental regulations. Furthermore, our operations may not generate sufficient cash flows to enable us to meet our expenses and service our debt. As a result, we may be required to repatriate funds from our foreign subsidiaries which could result in a significant tax liability to us. If we are unable to generate sufficient cash flows from operations, or if we are unable to repatriate sufficient or any funds from our foreign subsidiaries, in order to meet our expenses and debt service obligations, we may need to enter into new financing arrangements to obtain the necessary funds, or we may be required to raise additional funds through other means. If we determine it is necessary to seek additional funding for any reason, we may not be able to obtain such funding or, if funding is available, obtain it on acceptable terms. If we fail to make a payment on our debt, we could be in default on such debt, and this default could cause us to be in default on our other outstanding indebtedness. The note hedges and warrant transactions that we entered into in connection with the sale of the Notes may affect the trading price of our common stock. In connection with the issuance of the Notes, we entered into privately negotiated convertible note hedge transactions with certain option counterparties (the “Counterparties”), which are expected to offset the potential dilution to our common stock upon any conversion of the Notes. At the same time, we also entered into warrant transactions with the Counterparties pursuant to which we may issue shares of our common stock above a certain strike price. In connection with these hedging transactions, the Counterparties may have entered into various over-the-counter derivative transactions with respect to our common stock or purchased shares of our common stock in secondary market transactions at or following the pricing of the Notes. Such activities may have had the effect of increasing the price of our common stock. The Counterparties are likely to modify their hedge positions from time to time prior to conversion or maturity of the Notes by purchasing and selling shares of our common stock or entering into other derivative transactions. Additionally, these transactions may expose us to counterparty credit risk for nonperformance. The effect, if any, of any of these transactions and activities on the market price of our common stock or the Notes will depend, in part, on market conditions and cannot be ascertained at this time, but any 23
  • 24.
    of these activitiescould adversely affect the value of our common stock. In addition, if our stock price exceeds the strike price for the warrants, there could be additional dilution to our shareholders, which could adversely affect the value of our common stock. Lehman Brothers OTC Derivatives, Inc. (“Lehman OTC”) was the counterparty to 20% of our Note hedges. The bankruptcy filing by Lehman OTC on October 3, 2008 constituted an “event of default” under the hedge transaction. In April 2010, we terminated the hedge transaction with Lehman OTC in exchange for an unsecured bankruptcy claim, which we subsequently sold to a third party for approximately $14 million. Because we have decided not to replace the hedge, we are subject to potential dilution on the 20% unhedged portion of our Notes upon conversion if on the date of conversion the per-share market price of our common stock exceeds the conversion price of $31.85. The terms of the Notes, the rights of the holders of the Notes and other counterparties to Note hedges and warrants were not affected by the termination of this hedge. The price of our common stock could also be affected by sales of our common stock by investors who view the Notes as a more attractive means of equity participation in our company and by hedging or arbitrage trading activity that we expect to develop involving our common stock by holders of the Notes. The hedging or arbitrage could, in turn, affect the trading price of the Notes and warrants. Future issuances of common stock related to our Notes, warrants, stock options, restricted stock units, and our Employee Stock Purchase Plan may adversely affect the trading price of our common stock and the Notes. The conversion of some or all of our outstanding Notes will dilute the ownership interest of existing stockholders to the extent we deliver common stock upon conversion of the Notes. We will satisfy our obligation upon conversion by delivering cash for the principal amount of the Notes and shares of common stock, if any, to the extent the conversion value exceeds the principal amount. Any new issuance of equity securities, including the issuance of shares upon conversion of the Notes or the exercise of related warrants which are not offset by our Note hedges, could dilute the interests of our then-existing stockholders, including holders who receive shares upon conversion of their Notes, and could substantially decrease the trading price of our common stock and the Notes. In addition, any sales in the public market of any common stock issuable upon such conversion or the exercise of warrants could adversely affect prevailing market prices of our common stock. As of April 30, 2010, we had options to purchase approximately 35 million shares of our common stock outstanding and a total of approximately 9 million restricted shares and restricted stock units outstanding. If all of these outstanding options were exercised, and all of the outstanding restricted stock and restricted stock units vested, the proceeds to the Company would average approximately $18 per share. We also had 15.5 million shares of our common stock reserved for issuance under our stock plans with respect to equity awards that have not been granted. The exercise of all of the outstanding options and/or the vesting of all outstanding restricted shares and restricted stock units would dilute the interests of our then-existing stockholders, and any sales in the public market of the common stock issuable upon such exercise could adversely affect the trading price of our common stock. In addition, we have an Employee Stock Purchase Plan (ESPP) under which employees are entitled to purchase shares of our common stock at 85% of the fair market value at certain specified dates over a two-year period. As of April 30, 2010, we had approximately 5.0 million shares of our common stock available for issuance under the ESPP. The issuance of shares under the ESPP would dilute the interests of our then-existing stockholders, and any sales in the public market of the common stock issuable upon such exercise could adversely affect the trading price of our common stock. We may issue equity securities in the future for a number of reasons, including to finance our operations related to business strategy (including in connection with acquisitions, strategic alliances or other transactions), to increase our capital, to adjust our ratio of debt to equity, to satisfy our obligations upon the exercise of outstanding warrants or options upon conversion of the Notes, or for other reasons. 24
  • 25.
    We are exposedto fluctuations in the market values of our portfolio investments and in interest rates; impairment of our investments could harm our financial results. At April 30, 2010, we had $3.8 billion in cash, cash equivalents, available-for-sale securities and restricted cash and investments. We invest our cash in a variety of financial instruments, consisting principally of investments in U.S. Treasury securities, commercial paper, U.S. government agency bonds, corporate bonds, auction rate securities, certificates of deposit, and money market funds. These investments are subject to general credit, liquidity, market and interest rate risks, which have been exacerbated by unusual events such as the financial and credit crisis, and bankruptcy filings in the United States which have affected various sectors of the financial markets and led to global credit and liquidity issues. These securities are generally classified as “available-for-sale” and, consequently, are recorded on our consolidated balance sheets at fair value with unrealized gains or losses reported as a component of accumulated other comprehensive income (loss), net of tax. Investments in both fixed rate and floating rate interest earning instruments carry a degree of interest rate risk. Fixed rate debt securities may have their market value adversely impacted due to a rise in interest rates, while floating rate securities may produce less income than expected if interest rates fall. Due in part to these factors, our future investment income may fall short of expectations due to changes in interest rates. Currently, we do not use derivative financial instruments in our investment portfolio. We may suffer losses if forced to sell securities that have experienced a decline in market value because of changes in interest rates. Currently, we do not use financial derivatives to hedge our interest rate exposure. The fair value of our investments may change significantly due to events and conditions in the credit and capital markets. For instance, as a result of the bankruptcy filing of Lehman Brothers, which occurred during fiscal 2009, we recorded an other-than-temporary impairment charge of $11.8 million on our corporate bonds related to investments in Lehman Brothers securities and approximately $9.3 million on our investments in the Primary Fund that held Lehman Brothers investments. Any investment securities that we hold or the issues of such securities could be subject to review for possible downgrade. Any downgrade in these credit ratings may result in an additional decline in the estimated fair value of our investments. Changes in the various assumptions used to value these securities and any increase in the markets’ perceived risk associated with such investments may also result in a decline in estimated fair value. If such investments suffer market price declines, as we experienced with some of our investments during fiscal 2009, we may recognize in earnings the decline in the fair value of our investments below their cost basis when the decline is judged to be other-than-temporary. On occasion, we make strategic investments in other companies, including private equity funds, which may decline in value and/or not meet desired objectives. The success of these investments depends on various factors over which we may have limited or no control. As of April 30, 2010, we had an investment with the carrying value of $1.4 million in a private equity fund. The risks to our strategic investment portfolio may be exacerbated by unfavorable financial market and macroeconomic conditions and, as a result, the value of the investment portfolio could be negatively impacted and lead to impairment charges. In the event of adverse conditions in the credit and capital markets, our investment portfolio may be impacted and we could determine that some or all of our investments have experienced an other-than-temporary decline in fair value, requiring further impairments, which could adversely impact our financial position and operating results. A significant portion of our cash and cash equivalents balances are held overseas. If we are not able to generate sufficient cash domestically in order to fund our U.S. operations and strategic opportunities, and to service our debt, we may incur a significant tax liability in order to repatriate the overseas cash balances, or we may need to raise additional capital in the future. A portion of our earnings which is generated from our international operations is held and invested by certain of our foreign subsidiaries. These amounts are not freely available for dividend repatriation to the United States without triggering significant adverse tax consequences, which could adversely affect our financial results. As a result, if the cash generated by our domestic operations is not sufficient to fund our domestic operations, our broader corporate initiatives such as stock repurchases, acquisitions, and other strategic opportunities, and to service our outstanding indebtedness, we may need to raise additional funds through public or private debt or equity financings, or we may need to obtain new credit facilities to the extent we choose not to repatriate our overseas cash. Such 25
  • 26.
    additional financing maynot be available on terms favorable to us, or at all, and any new equity financings or offerings would dilute our current stockholders’ ownership. Furthermore, lenders, particularly in light of the current challenges in the credit markets, may not agree to extend us new, additional or continuing credit. If adequate funds are not available, or are not available on acceptable terms, we may be forced to repatriate our foreign cash and incur a significant tax expense or we may not be able to take advantage of strategic opportunities, develop new products, respond to competitive pressures or repay our outstanding indebtedness. In any such case, our business, operating results or financial condition could be adversely impacted. Our synthetic leases are off-balance sheet arrangements that could negatively affect our financial condition and operating results. We have invested substantial resources in new facilities and physical infrastructure, which will increase our fixed costs. Our operating results could be harmed if our business does not grow proportionately to our increase in fixed costs. We have various synthetic lease arrangements with BNP Paribas Leasing Corporation as lessor (“BBPPLC”) for our headquarters office buildings and land in Sunnyvale, California. These synthetic leases qualify for operating lease accounting treatment under the accounting guidance for leases and are not considered variable interest entities under applicable accounting guidance. Therefore, we do not include the properties or the associated debt on our condensed consolidated balance sheet. However, if circumstances were to change regarding our or BNPPLC’s ownership of the properties, or in BNPPLC’s overall portfolio, we could be required to consolidate the entity, the leased facilities and the associated debt. Our future minimum lease payments under these synthetic leases limit our flexibility in planning for, or reacting to, changes in our business by restricting the funds available for use in addressing such changes. If we are unable to grow our business and revenues proportionately to our increase in fixed costs, our operating results will be harmed. If we elect not to purchase the properties at the end of the lease term, we have guaranteed a minimum residual value to BNPPLC. If the fair value of the properties declines below that guaranteed minimum residual value, our residual value guarantee would require us to pay the difference to BNPPLC. As of April 30, 2010, the estimated fair value of the properties was approximately $36.9 million below the guaranteed minimum residual value, which we will accrue over the remaining term of the respective leases. Any further decline in the fair value of the properties could adversely impact our cash flows, financial condition and operating results. As a result of excess capacity in our Sunnyvale facilities, certain of our facilities subject to synthetic lease arrangements have been subleased or are vacant. These subleases will expire through 2012 and we may not be able to generate sufficient sublease income to cover the carrying costs of these facilities. In addition, we may experience changes in our operations in the future that could result in additional excess capacity and vacant facilities. We will continue to be responsible for all carrying costs of these facilities under operating leases until such time as we can sublease these facilities or terminate the applicable leases based on the contractual terms of the operating lease agreements, and these costs may have an adverse effect on our business, operating results and financial condition. We have credit exposure to our hedging counterparties. In order to minimize volatility in earnings associated with fluctuations in the value of foreign currency relative to the U.S. Dollar, we utilize forward and option contracts to hedge our exposure to foreign currencies. As a result of entering into these hedging contracts with major financial institutions, we may be subject to counterparty nonperformance risk. Should there be a counterparty default, we could be exposed to the net losses on the hedged arrangements or be unable to recover anticipated net gains from the transactions. We are subject to restrictive and financial covenants in our synthetic lease arrangements. The restrictive covenants may restrict our ability to operate our business. Our ongoing extension of credit under our synthetic lease arrangements are subject to continued compliance with financial covenants. If we do not comply with these restrictive and financial covenants or otherwise default under the arrangements, we may be required to repay any outstanding amounts or repurchase the properties which are subject to the synthetic lease arrangements. If we lose access to the synthetic lease arrangements, we may not be able to obtain alternative financing on acceptable terms, which could limit our operating flexibility. 26
  • 27.
    The agreements governingour synthetic lease arrangements contain restrictive covenants that limit our ability to operate our business, including restrictions on our ability to: • Incur indebtedness; • Incur indebtedness at the subsidiary level; • Grant liens; • Sell all or substantially all our assets: • Enter into certain mergers; • Change our business; • Enter into swap agreements; • Enter into transactions with our affiliates; and • Enter into certain restrictive agreements. As a result of these restrictive covenants, our ability to respond to changes in business and economic conditions and to obtain additional financing, if needed, may be restricted. We may also be prevented from engaging in transactions that might otherwise be beneficial to us, such as strategic acquisitions or joint ventures. Our failure to comply with the restrictive and financial covenants could result in a default under our synthetic lease arrangements, which would give the counterparties thereto the ability to exercise certain rights, including the right to accelerate the amounts owed thereunder and to terminate the arrangement. In addition, our failure to comply with these covenants and the acceleration of amounts owed under synthetic lease arrangements could result in a default under the Notes, which could permit the holders to accelerate the Notes. If all of our debt is accelerated, we may not have sufficient funds available to repay such debt. Funds associated with certain of our auction rate securities may not be accessible for more than 12 months and our auction rate securities may experience further other-than-temporary declines in value, which would adversely affect our earnings. Auction rate securities (ARSs) held by us are securities with long-term nominal maturities, which, in accordance with investment policy guidelines, had credit ratings of AAA and Aaa at time of purchase. Interest rates for ARS are reset through a “Dutch auction” each month, which prior to February 2008 had provided a liquid market for these securities. All of our ARSs are backed by pools of student loans guaranteed by the U.S. Department of Education, and we believe the credit quality of these securities is high based on this guarantee. However, liquidity issues in the global credit markets resulted in the failure of auctions for certain of our ARS investments, with a par value of $73.8 million. For each failed auction, the interest rate resets to a maximum rate defined for each security, and the ARS continue to pay interest in accordance with their terms, although the principal associated with the ARS will not be accessible until there is a successful auction or such time as other markets for ARS investments develop or the final maturity of the individual securities. As of April 30, 2010, we determined there was a total decline in the fair value of our ARS investments of approximately $4.7 million, of which we have recorded cumulative temporary impairment charges of $2.6 million, and $2.1 million was recognized as an other-than-temporary impairment charge. In addition, we have classified all of our auction rate securities as long-term assets in our consolidated balance sheets at April 30, 2010 as our ability to liquidate such securities in the next 12 months is uncertain. Although we currently have the ability and intent to hold these ARS investments until recovery in market value or until maturity, if current market conditions deteriorate further, or the anticipated recovery in market liquidity does not occur, we may be required to record additional impairment charges in future quarters. 27
  • 28.
    We may needto undertake cost-reduction initiatives and restructuring initiatives in the future. We have previously recognized restructuring charges related to initiatives to realign our business strategies and resize our business in response to economic and market conditions, including those announced in February 2009 and December 2008. We may undertake future cost-reduction initiatives and restructuring plans that may adversely impact our operations and we may not realize all of the anticipated benefits of our prior or any future restructurings. Our acquisitions may not provide the anticipated benefits and may disrupt our existing business. As part of our strategy, we are continuously evaluating opportunities to buy other businesses or technologies that would complement our current products, expand the breadth of our markets, or enhance our technical capabilities. The success of our acquisitions is impacted by a number of factors, and may be subject to the following risks: • The inability to successfully integrate the operations, technologies, products and personnel of the acquired companies; • The diversion of management’s attention from normal daily operations of the business; • The loss of key employees; • Substantial transaction costs and accounting charges; and • Exposure to litigation related to acquisitions. Any future acquisitions may also result in risks to our existing business, including: • Dilution of our current stockholders’ percentage ownership to the extent we issue new equity; • Assumption of additional liabilities; • Incurrence of additional debt or a decline in available cash; • Adverse effects to our financial statements, such as the need to make large and immediate write-offs or the incurrence of restructuring and other related expenses; • Liability for intellectual property infringement and other litigation claims, which we may or may not be aware of at the time of acquisition; and • Creation of goodwill or other intangible assets that could result in significant future amortization expense or impairment charges. The failure to achieve the anticipated benefits of an acquisition may also result in impairment charges for goodwill or acquired intangibles. For example, in fiscal 2009, we announced our decision to cease the development and availability of our SMOS product, which was originally acquired through our acquisition of Topio, Inc. in fiscal 2007, resulting in the impairment of acquired intangibles related to such acquisition. Additional or realized risks of this nature could have a material adverse effect on our business, financial condition and results of operations. The occurrence of any of the above risks could seriously harm our business. If we are unable to establish fair value for any undelivered element of a sales arrangement, all or a portion of the revenues relating to the arrangement could be deferred to future periods. In the course of our sales efforts, we often enter into multiple element arrangements that include our systems and one or more of the following undelivered software-related elements: software entitlements and maintenance, premium hardware maintenance, and storage review services. If we are required to change the pricing of our software-related elements through discounting, or otherwise introduce variability in the pricing of such elements, we may be unable to maintain Vendor Specific Objective Evidence of fair value of the undelivered elements of the arrangement, and would therefore be required to delay the recognition of all or a portion of the related arrangement. A delay in the recognition of revenues may cause fluctuations in our financial results and may adversely affect our operating margins. 28
  • 29.
    We are continuallyseeking ways to make our cost structure and business processes more efficient, including moving activities from higher-cost to lower-cost owned locations, as well as outsourcing certain business process functions. Problems with the execution of these activities could have an adverse effect on our business or results of operations. We continuously seek to make our cost structure and business processes more efficient. We are focused on increasing workforce flexibility and scalability, and improving overall competitiveness by leveraging our global capabilities, as well as external talent and skills worldwide. For example, certain engineering activities and projects that were formerly performed in the U.S. have been moved to lower cost international locations and we rely on partners or third party service providers for the provision of certain business process functions and activities in IT, human resources and accounting. The challenges involved with these initiatives include executing business functions in accordance with local laws and other obligations while maintaining adequate standards, controls and procedures. We are also subject to increased business continuity risks as we increase our reliance on such parties. For example, we may no longer be able to exercise control over some aspects of the future development, support or maintenance of outsourced operations and processes, including the management and internal controls associated with those outsourced business operations and processes, which could adversely affect our business. If we are unable to effectively utilize or integrate and interoperate with external resources or if our partners or third party service providers experience business difficulties or are unable to provide business services as anticipated, we may need to seek alternative service providers or resume providing these business processes internally, which could be costly and time- consuming and have a material adverse effect on our operating results. In addition, we may not achieve the expected benefits of our business process improvement initiatives. We are subject to risks related to the provision of employee health care benefits. We use a combination of insurance and self-insurance for workers’ compensation coverage and health care plans. We record expenses under these plans based on estimates of the number and costs of expected claims, administrative costs and stop-loss premiums. These estimates are then adjusted each year to reflect actual costs incurred. Actual costs under these plans are subject to variability depending primarily upon participant enrollment and demographics, the actual number and costs of claims made and whether and how much the stop-loss insurance we purchase covers the cost of these claims. In the event that our cost estimates differ from actual costs, we could incur additional unplanned health care costs which could adversely impact our financial condition. In March 2010, comprehensive health care reform legislation under the Patient Protection and Affordable Care Act (HR 3590) and the Health Care Education and Affordability Reconciliation Act (HR 4872) (collectively, the “Acts”) was passed and signed into law. Among other things, the health reform legislation includes guaranteed coverage requirements, eliminates pre-existing condition exclusions and annual and lifetime maximum limits, restricts the extent to which policies can be rescinded, and imposes new and significant taxes on health insurers and health care benefits. Provisions of the health reform legislation become effective at various dates over the next several years. The Department of Health and Human Services, the National Association of Insurance Commis- sioners, the Department of Labor and the Treasury Department have yet to issue necessary enabling regulations and guidance with respect to the health care reform legislation. Due to the breadth and complexity of the health reform legislation, the lack of implementing regulations and interpretive guidance, and the phased-in nature of the implementation, it is difficult to predict the overall impact of the health reform legislation on our business over the coming years. Possible adverse affects of the health reform legislation include reduced revenues, increased costs, exposure to expanded liability and requirements for us to revise the ways in which we conduct business or risk of loss of business. In addition, our results of operations, financial position, and cash flows could be materially adversely affected. We depend on attracting and retaining qualified personnel. If we are unable to attract and retain such personnel, our operating results could be materially and adversely impacted. Our continued success depends, in part, on our ability to identify, attract, motivate and retain qualified personnel. Because our future success is dependent on our ability to continue to enhance and introduce new 29
  • 30.
    products, we areparticularly dependent on our ability to identify, attract, motivate and retain qualified engineers with the requisite education, background and industry experience. Competition for qualified employees, partic- ularly in Silicon Valley, can be intense. The loss of the services of a significant number of our employees, particularly our engineers, salespeople and key managers, could be disruptive to our development efforts or business relationships and could materially and adversely affect our operating results. Additionally, a component of our strategy to hire and retain personnel consists of long-term compensation in the form of equity-based grants. We face increased risk of the inability to continue to offer equity if we are unable to obtain shareholder approval in light of increased shareholder activism and heightened focus on corporate compensation practices. Such inability could adversely impact our ability to continue to attract and retain employees. Our business could be materially and adversely affected as a result of a natural disaster, terrorist acts or other catastrophic events. We depend on the ability of our personnel, raw materials, equipment and products to move reasonably unimpeded around the world. Any political, military, terrorism, global trade, world health or other issue that hinders this movement or restricts the import or export of materials could lead to significant business disruptions. Furthermore, any strike, economic failure or other material disruption caused by fire, floods, hurricanes, volcanoes, power loss, power shortages, environmental disasters, telecommunications failures, break-ins and similar events could also adversely affect our ability to conduct business. If such disruptions result in cancellations of customer orders or contribute to a general decrease in economic activity or corporate spending on information technology, or directly impact our marketing, manufacturing, financial and logistics functions, our results of operations and financial condition could be materially adversely affected. In addition, our headquarters are located in Northern California, an area susceptible to earthquakes. If any significant disaster were to occur, our ability to operate our business could be impaired. Undetected software errors, hardware errors, or failures found in new products may result in loss of or delay in market acceptance of our products, which could increase our costs and reduce our revenues. Product quality problems could lead to reduced revenues, gross margins and operating results. Our products may contain undetected software errors, hardware errors or failures when first introduced or as new versions are released. Despite testing by us and by current and potential customers, errors may not be found in new products until after commencement of commercial shipments, resulting in loss of or delay in market acceptance, which could materially and adversely affect our operating results. In addition, if we fail to remedy a product defect, we may experience a failure of a product line, temporary or permanent withdrawal from a product or market, damage to our reputation, inventory costs or product reengineering expenses, and these occurrences could have a material impact on our revenues, gross margins and operating results. We may be subject to losses that may result from or are alleged to result from defects in our products, which could subject us to claims for damages, including consequential damages. We are exposed to various risks related to legal proceedings or claims and protection of intellectual property rights, which could adversely affect our operating results. We are a party to lawsuits in the normal course of our business, including our ongoing litigation with Sun Microsystems which was recently acquired by Oracle Corporation. Litigation can be expensive, lengthy and disruptive to normal business operations. Moreover, the results of complex legal proceedings are difficult to predict. An unfavorable resolution of a particular lawsuit could have a material adverse effect on our business, operating results, or financial condition. If we are unable to protect our intellectual property, we may be subject to increased competition that could materially and adversely affect our operating results. Our success depends significantly upon our proprietary technology. We rely on a combination of copyright and trademark laws, trade secrets, confidentiality procedures, contractual provisions, and patents to protect our proprietary rights. We seek to protect our software, documentation and other written materials under trade secret, copyright and patent laws, which afford only limited protection. 30
  • 31.
    Some of ourU.S. trademarks are registered internationally as well. We will continue to evaluate the registration of additional trademarks as appropriate. We generally enter into confidentiality agreements with our employees and with our resellers, strategic partners and customers. We currently have multiple U.S. and international patent applications pending and multiple U.S. patents issued. The pending applications may not be approved, and our existing and future patents may be challenged. If such challenges are brought, the patents may be invalidated. We may not be able to develop proprietary products or technologies that are patentable, or where any issued patent will provide us with any competitive advantages or will not be challenged by third parties. Further, the patents of others may materially and adversely affect our ability to do business. In addition, a failure to obtain and defend our trademark registrations may impede our marketing and branding efforts and competitive position. Litigation may be necessary to protect our proprietary technology. Any such litigation may be time-consuming and costly. Despite our efforts to protect our proprietary rights, unauthorized parties may attempt to copy aspects of our products or obtain and use information that we regard as proprietary. In addition, the laws of some foreign countries do not protect proprietary rights to as great an extent as do the laws of the United States. Our means of protecting our proprietary rights may not be adequate or our competitors may independently develop similar technology, duplicate our products, or design around patents issued to us or other intellectual property rights of ours. We are subject to intellectual property infringement claims. We may, from time to time, receive claims that we are infringing third parties’ intellectual property rights. Third parties may in the future, claim infringement by us with respect to current or future products, patents, trademarks or other proprietary rights. We expect that companies in the network storage and data management market will increasingly be subject to infringement claims as the number of products and competitors in our industry segment grows and the functionality of products in different industry segments overlaps. Any such claims could be time consuming, result in costly litigation, cause product shipment delays, require us to redesign our products or enter into royalty or licensing agreements, any of which could materially and adversely affect our operating results. Such royalty or licensing agreements, if required, may not be available on terms acceptable to us or at all. Our business could be materially adversely affected by changes in regulations or standards regarding energy efficiency of our products and climate change issues. We continually seek ways to increase the energy efficiency of our products. Recent analyses have estimated the amount of global carbon emissions that are due to information technology products. As a result, governmental and non-governmental organizations have turned their attention to development of regulations and standards to drive technological improvements and reduce such amount of carbon emissions. There is a risk that the development of these standards will not fully address the complexity of the technology developed by the IT industry or will favor certain technological approaches. Depending on the regulations or standards that are ultimately adopted, com- pliance could adversely affect our business, financial condition or operating results. Climate change issues, energy usage and emissions controls may result in new environmental legislation and regulations, at any or all of the international, federal and state levels, that may unfavorably impact us, our suppliers, and our customers in how we conduct our business including the design, development, and manufacturing of our products. This could cause us to incur additional direct costs in complying with any new environmental regulations, as well as increased indirect costs resulting from our customers, suppliers or both incurring additional compliance costs that get passed on to us. These costs may adversely impact our operations and financial condition. Our business and results of operations could be adversely impacted as a consequence of regulations or business trends such as: • Decreased demand for storage products that produce significant greenhouse gases • Increased demand for storage products that produce lower emissions and are more energy efficient, and increased competition to develop such products; and • Reputational risk based on negative public perception of publicly reported data on our greenhouse gas emissions. 31
  • 32.
    Our business issubject to increasingly complex corporate governance, public disclosure, accounting and tax requirements that have increased both our costs and the risk of noncompliance. Because our common stock is publicly traded, we are subject to certain rules and regulations of federal, state and financial market exchange entities charged with the protection of investors and the oversight of companies whose securities are publicly traded. These entities, including the Public Company Accounting Oversight Board, the SEC, and NASDAQ, have implemented requirements and regulations and continue developing additional regulations and requirements in response to corporate scandals and laws enacted by Congress, most notably the Sarbanes-Oxley Act of 2002. Our efforts to comply with these regulations have resulted in, and are likely to continue resulting in, increased general and administrative expenses and diversion of management time and attention from revenue-generating activities to compliance activities. We completed our evaluation of our internal controls over financial reporting for the fiscal year ended April 30, 2010 as required by Section 404 of the Sarbanes-Oxley Act of 2002. Although our assessment, testing and evaluation resulted in our conclusion that as of April 30, 2010, our internal controls over financial reporting were effective, we cannot predict the outcome of our testing in future periods. If our internal controls are ineffective in future periods, our business and reputation could be harmed. We may incur additional expenses and commitment of management’s time in connection with further evaluations, both of which could materially increase our operating expenses and accordingly reduce our operating results. Because new and modified laws, regulations, and standards are subject to varying interpretations in many cases due to their lack of specificity, their application in practice may evolve over time as new guidance is provided by regulatory and governing bodies. This evolution may result in continuing uncertainty regarding compliance matters and additional costs necessitated by ongoing revisions to our disclosure and governance practices. Changes in financial accounting standards may cause adverse unexpected fluctuations and affect our reported results of operations. A change in accounting standards or practices and varying interpretations of existing accounting pronounce- ments, such as changes to standards related to revenue recognition standards recently adopted by the FASB, the increased use of fair value measure, and the potential requirement that U.S. registrants prepare financial statements in accordance with International Financial Reporting Standards (“IFRS”), could have a significant effect on our reported financial results or the way we conduct our business. Item 1B. Unresolved Staff Comments None. Item 2. Properties We own approximately 0.9 million square feet of facilities at our Sunnyvale, California headquarters, of which we occupy approximately 0.8 million square feet. In addition, we have commitments related to various lease arrangements with BNP Paribas LLC (“BNP”) for approximately 0.6 million square feet of additional facilities, of which we occupy approximately 0.3 million square feet (as further described below under “Contractual Obliga- tions” in Item 7 and Note 18 of the accompanying consolidated financial statements under Item 8). Our headquarters site supports corporate general administration, sales and marketing, research and development, global services, and operations. We own approximately 0.6 million square feet of facilities in Research Triangle Park (RTP), North Carolina, of which we occupy approximately 0.5 million square feet. This site supports sales and marketing, research and development, and global services. We lease and occupy approximately 0.3 million square feet of facilities in Bangalore, India. We also own fifteen acres of land in Bangalore, India to be developed for future use. This site supports sales and marketing, research and development, and global services. 32
  • 33.
    We lease othersales offices and research and development facilities throughout the U.S. and internationally. We expect that our existing facilities and those being developed worldwide are suitable and adequate for our requirements over at least the next two years and that additional space will be available as needed. See additional discussion regarding properties in Note 18 of the accompanying consolidated financial statements under Item 8. and Item 7. Management’s Discussion and Analysis of Financial Condition and Results of Operations — Liquidity and Capital Resources. Item 3. Legal Proceedings On September 5, 2007, we filed a patent infringement lawsuit in the Eastern District of Texas seeking compensatory damages and a permanent injunction against Sun Microsystems. On October 25, 2007, Sun Micro- systems filed a counter claim against us in the Eastern District of Texas seeking compensatory damages and a permanent injunction. On October 29, 2007, Sun filed a second lawsuit against us in the Northern District of California asserting additional patents against us. The Texas court granted a joint motion to transfer the Texas lawsuit to the Northern District of California on November 26, 2007. On March 26, 2008, Sun filed a third lawsuit in federal court that extends the patent infringement charges to storage management technology we acquired in January 2008. In January 2010, Oracle acquired Sun. The three lawsuits are currently in the discovery and motion phase and no trial dates have been set, so we are unable at this time to determine the likely outcome of these various patent litigations. Since we are unable to reasonably estimate the amount or range of any potential settlement, no accrual has been recorded as of April 30, 2010. Item 4. Reserved 33
  • 34.
    PART II Item 5.Market for Registrant’s Common Equity, Related Stockholder Matters and Issuer Purchases of Equity Securities Our common stock commenced trading on the NASDAQ Global Select Market (and its predecessor, the Nasdaq National Market) on November 21, 1995, and is traded under the symbol “NTAP.” As of June 4, 2010 there were 866 holders of record of the common stock. The closing price for our common stock on June 4, 2010 was $37.88. The following table sets forth for the periods indicated the high and low closing sale prices for our common stock as reported on the NASDAQ Global Select Market. Fiscal 2010 Fiscal 2009 High Low High Low First Quarter . . . ................................. $23.56 $16.93 $27.31 $21.66 Second Quarter . ................................. 29.50 21.55 26.42 12.20 Third Quarter . . ................................. 34.54 27.60 15.32 10.39 Fourth Quarter . . ................................. 36.17 29.83 18.84 12.52 The following graph shows a five-year comparison of cumulative total return on our common stock, the NASDAQ Composite Index and the S&P 500 Information Technology Index from April 30, 2005 through April 30, 2010. The past performance of our common stock is no indication of future performance. COMPARISON OF 5 YEAR CUMULATIVE TOTAL RETURN* Among NetApp, Inc., The NASDAQ Composite Index And The S&P Information Technology Index 250 NetApp., Inc. NASDAQ Composite 200 S&P Information Technology DOLLARS 150 100 50 0 4/05 4/06 4/07 4/08 4/09 4/10 * $100 invested on 4/30/05 in stock or index, including reinvestment of dividends. Fiscal year ending April 30. Copyright· 2010 S&P, a division of The McGraw-Hill Companies Inc. All rights reserved. 4/05 4/06 4/07 4/08 4/09 4/10 NetApp, Inc. 100.00 139.00 139.52 90.74 68.62 130.00 NASDAQ Composite 100.00 121.25 134.58 127.40 89.92 129.99 S&P Information Technology 100.00 116.84 128.45 129.74 95.11 136.47 34
  • 35.
    We believe thata number of factors may cause the market price of our common stock to fluctuate significantly. See “Item 1A. Business — Risk Factors.” Dividend Policy We have never paid cash dividends on our capital stock. We currently anticipate retaining all available funds, if any, to finance internal growth and product development as well as other possible management initiatives, including stock repurchases and acquisitions. Payment of dividends in the future will depend upon our earnings and financial condition and such other factors as the Board of Directors may consider or deem appropriate at the time. Securities Authorized for Issuance under Equity Compensation Plans Information regarding securities authorized for issuance under equity compensation plans is incorporated by reference to our Proxy Statement for the 2010 Annual Meeting of Stockholders. Unregistered Securities Sold in Fiscal 2010 We did not sell any unregistered securities during fiscal 2010. Issuer Purchases of Equity Securities On May 13, 2003, we announced that our Board of Directors had authorized a stock repurchase program. As of April 30, 2010, our Board of Directors had authorized the repurchase of up to $4,023.6 million of common stock under this program. We did not repurchase any common stock during the three month period ended April 30, 2010. As of April 30, 2010, we had repurchased 104.3 million shares of our common stock at a weighted-average price of $28.06 per share for an aggregate purchase price of $2,927.4 million since inception of the stock repurchase program, and the remaining authorized amount for stock repurchases under this program was $1,096.3 million with no termination date. 35
  • 36.
    Item 6. SelectedFinancial Data The following selected consolidated financial data set forth below was derived from our historical audited consolidated financial statements and should be read in conjunction with, “Management’s Discussion and Analysis of Financial Condition and Results of Operations” and “Financial Statements and Supplementary Data,” and other financial data included elsewhere in this Annual Report on Form 10-K. Our historical results of operations are not necessarily indicative of results of operations to be expected for any future period. Fiscal Year Ended April 30, April 24, April 25, April 27, April 28, 2010 2009 2008 2007 2006 (In millions, except per-share amounts) Net revenues(1) . . . . . . . . . . . . . . . . . . . $3,931.4 $3,406.4 $3,303.2 $2,804.3 $2,066.5 Total cost of revenue . . . . . . . . . . . . . . . 1,412.2 1,416.5 1,289.8 1,099.8 810.0 Gross profit . . . . . . . . . . . . . . . . . . . . . . 2,519.2 1,989.9 2,013.4 1,704.5 1,256.5 Total operating expenses . . . . . . . . . . . . . 2,030.8 1,942.7 1,699.8 1,403.3 948.2 Income from operations . . . . . . . . . . . . . 488.4 47.2 313.6 301.2 308.3 Net income(1) . . . . . . . . . . . . . . . . . . . . $ 400.4 $ 64.6 $ 309.7 $ 297.7 $ 266.5 Net income per share, basic . . . . . . . . . . $ 1.18 $ 0.20 $ 0.88 $ 0.80 $ 0.72 Net income per share, diluted . . . . . . . . . $ 1.13 $ 0.19 $ 0.86 $ 0.77 $ 0.69 Shares used in basic net income per share calculation . . . . . . . . . . . . . . . . . 339.6 330.3 351.7 371.2 371.1 Shares used in diluted net income per share calculation . . . . . . . . . . . . . . . . . 353.2 334.6 361.1 388.5 388.4 April 30, April 24, April 25, April 27, April 28, 2010 2009 2008 2007 2006 (In millions) Cash, cash equivalents and short-term investments . . . . . . . . . . . . . . . . . . . . . $3,724.0 $2,604.3 $1,164.4 $1,308.8 $1,322.9 Working capital . . . . . . . . . . . . . . . . . . . 2,626.1 1,759.5 653.3 1,053.3 1,116.0 Total assets . . . . . . . . . . . . . . . . . . . . . . 6,494.4 5,384.4 4,071.0 3,658.5 3,261.0 Short-term debt . . . . . . . . . . . . . . . . . . . — — — 85.1 166.2 Long-term debt and other . . . . . . . . . . . . 1,273.4 1,219.3 318.7 9.5 138.2 Total stockholders’ equity . . . . . . . . . . . . 2,530.5 1,784.2 1,700.3 1,989.0 1,923.5 (1) Net revenues and net income for fiscal 2009 included a GSA settlement of $128.7 million. Net income for fiscal 2006 included an income tax provision of $22.5 million related to the American Jobs Creation Act and the repatriation of foreign subsidiary earnings back to the United States of America. Item 7. Management’s Discussion and Analysis of Financial Condition and Results of Operations The following discussion of our financial condition and results of operations should be read together with the financial statements and the related notes set forth under “Item 8. Financial Statements and Supplementary Data”. The following discussion also contains trend information and other forward looking statements that involve a number of risks and uncertainties. The Risk Factors set forth in “Item 1. Business” are hereby incorporated into the discussion by reference. 36
  • 37.
    Overview Revenues for fiscal 2010 were $3.9 billion, up $0.5 billion, or 15%, from fiscal 2009. Improved revenue performance in fiscal 2010 was the result of improvements in product, software entitlements and maintenance and service revenues. Revenues in fiscal 2009 were negatively impacted by a $128.7 million settlement with the General Services Administration (GSA). The dispute regarded our discounting practices and compliance with the price reduction provisions of GSA contracts between August 1997 and February 2005. Gross profit margins increased during fiscal 2010 due largely to reductions in product materials cost, partially offset by a decrease in the overall average selling prices of our products, as well as an increase in our SEM and services revenues mix relative to product revenues. In addition, our gross profit margin in fiscal 2009 was negatively impacted by the GSA settlement. During fiscal 2010, sales and marketing, research and development, and general and administrative expenses totaled $2.1 billion, up 10% from fiscal 2009 and reflected the impact of an increase in incentive compensation and commissions expense related to our stronger sales and operating profit performance, as well as having 53 weeks in fiscal 2010 compared to 52 weeks in fiscal 2009. During fiscal 2010, we entered into a merger agreement with Data Domain, Inc., which was subsequently terminated on July 8, 2009. In accordance with the agreement, we received a $57.0 million termination fee, which, when netted against $15.9 million of incremental third-party costs we incurred relating to the terminated merger transaction, resulted in net proceeds of $41.1 million. Critical Accounting Estimates and Policies Our discussion and analysis of financial condition and results of operations are based upon our consolidated financial statements, which have been prepared in accordance with accounting principles generally accepted in the United States of America. The preparation of such statements requires us to make estimates and assumptions that affect the reported amounts of revenues and expenses during the reporting period and the reported amounts of assets and liabilities as of the date of the financial statements. Our estimates are based on historical experience and other assumptions that we consider to be appropriate in the circumstances. However, actual future results may vary from our estimates. We believe that the following accounting policies are significantly affected by critical accounting estimates and that they are both highly important to the portrayal of our financial condition and results and require difficult management judgments and assumptions about matters that are inherently uncertain. Note 2 of the accompanying consolidated financial statements describes the significant accounting policies used in the preparation of the consolidated financial statements. Certain of these significant accounting policies are considered to be critical accounting policies. We believe the accounting policies described below are the ones that most frequently require us to make estimates and judgments and therefore are critical to the understanding of our results of operations. Revenue Recognition, Reserves and Allowances We apply the provisions of the accounting guidance for software revenue recognition to our product sales, both hardware and software, because our software is essential to the performance of our hardware. We recognize revenue when: • Persuasive evidence of an arrangement exists: It is our customary practice to have a purchase order and/or contract prior to recognizing revenue on an arrangement from our end users, customers, value-added resellers, or distributors. • Delivery has occurred: Our product is physically delivered to our customers, generally with standard transfer terms such as FOB origin. We typically do not allow for restocking rights with any of our value- added resellers or distributors. Products shipped with acceptance criteria or return rights are not recognized as revenue until all criteria are achieved. If undelivered products or services exist that are essential to the functionality of the delivered product in an arrangement, delivery is not considered to have occurred. 37
  • 38.
    • The feeis fixed or determinable: Arrangements with payment terms extending beyond our standard terms, conditions and practices are not considered to be fixed or determinable. Revenue from such arrangements is recognized at the earlier of customer payment or when the fees become due and payable. We typically do not allow for price-protection rights with any of our value-added resellers or distributors. • Collection is probable: If there is considerable doubt surrounding the credit worthiness of a customer at the outset of an arrangement, the associated revenue is deferred and recognized upon cash receipt. Our multiple element arrangements include our systems and one or more of the following undelivered software-related elements: software entitlements and maintenance, premium hardware maintenance and storage review services. Our software entitlements and maintenance entitle our customers to receive unspecified product upgrades and enhancements on a when-and-if-available basis, bug fixes, and patch releases. Premium hardware maintenance services include contracts for technical support and minimum response times. Revenues from software entitlements and maintenance, premium hardware maintenance services and storage review services are recognized ratably over the contractual term, generally from one to three years. We also offer extended service contracts (which extend our standard parts warranty and may include premium hardware maintenance) at the end of the warranty term; revenues from these contracts are recognized ratably over the contract term. We typically sell professional services separately from any of our other revenue elements, either on a time and materials basis or for fixed price standard projects; we recognize revenue for these services as they are performed. Revenue from hardware installation services is recognized in the period the services are delivered. For arrangements with multiple elements, we recognize as revenue the difference between the total arrangement price and the greater of fair value or stated price for any undelivered elements (“the residual method”). For our undelivered software-related elements, we determine fair value of these undelivered elements based on vendor-specific objective evidence (“VSOE”) of fair value, which for us consists of the prices charged when these services are sold separately. To determine the fair value of these elements, we analyze both the selling prices when elements are sold separately as well as the concentrations of those prices. We believe those concentrations have been sufficient to enable us to establish VSOE of fair value for the undelivered elements. If VSOE cannot be obtained to establish fair value of the undelivered elements, it is required that revenue from the entire arrangement be initially deferred and recognized ratably over the period these elements are delivered. For purposes of presentation in the statement of operations, once fair value has been determined for our undelivered bundled elements, we allocate revenue first to software entitlements and maintenance, based on VSOE of its fair value, with the remainder allocated to other service revenues. We record reductions to revenue for estimated sales returns at the time of shipment. Sales returns are estimated based on historical sales returns, current trends, and our expectations regarding future experience. We monitor and analyze the accuracy of sales returns estimates by reviewing actual returns and adjust them for future expectations to determine the adequacy of our current and future reserve needs. Our reserve levels have been sufficient to cover actual returns and have not required material changes in subsequent periods. While we currently have no expectations for significant changes to these reserves, if actual future returns and allowances differ from past experience, additional allowances may be required. We also maintain a separate allowance for doubtful accounts for estimated losses based on our assessment of the collectibility of specific customer accounts and the aging of the accounts receivable. We analyze accounts receivable and historical bad debts, customer concentrations, customer solvency, current economic and geographic trends, and changes in customer payment terms and practices when evaluating the adequacy of our current and future allowance. In circumstances where we are aware of a specific customer’s inability to meet its financial obligations to us, a specific allowance for bad debt is estimated and recorded, which reduces the recognized receivable to the estimated amount we believe will ultimately be collected. We monitor and analyze the accuracy of our allowance for doubtful accounts estimate by reviewing past collectibility and adjusting it for future expectations to determine the adequacy of our current and future allowance. Our reserve levels have generally been sufficient to cover credit losses. Our allowance for doubtful accounts as of April 30, 2010 was $1.6 million, compared to $3.1 million as of April 24, 2009. If the financial condition of our customers were to deteriorate, resulting in an impairment of their ability to make payments, additional allowances may be required. 38
  • 39.
    Inventory Valuation andPurchase Order Accruals Inventories are stated at the lower of cost or market (which approximates actual cost on a first-in, first-out basis). We perform an excess and obsolete analysis of our inventory based upon assumptions about future demand and market conditions. We adjust the inventory value based on estimated excess and obsolete inventories determined primarily by future demand forecasts. Although we strive for accuracy in our forecasts of future product demand, any significant unanticipated changes in demand or technological developments could have a significant impact on the value of our inventory commitments and on our reported results. If actual market conditions are less favorable than those projected, additional write-downs and other charges against earnings may be required. If actual market conditions are more favorable, we may realize higher gross profits in the period when the written-down inventory is sold. Historically, our inventory reserves have been sufficient to cover any excess and obsolete exposure and have not required material adjustments in subsequent periods. In the normal course of business we make commitments to our third party contract manufacturers to manage lead times and meet product forecasts, and to other parties to purchase various key components used in the manufacture of our products. We establish accruals for estimated losses on purchased components for which we believe it is probable that they will not be utilized in future operations. To the extent that such forecasts are not achieved, our commitments and associated accruals may change. We are subject to a variety of federal, state, local, and foreign environmental regulations relating to the use, storage, discharge, and disposal of hazardous chemicals used in the manufacture of our products, which may require design changes or recycling of products we manufacture. We will continue to monitor our compliance with these regulations, which may require us to incur higher costs, and adversely impact our operating results. Valuation of Goodwill and Intangibles Purchased intangible assets are amortized over their useful lives unless these lives are determined to be indefinite. In-process research and development is capitalized at fair value and classified as indefinite-lived assets until completion or abandonment and is subject to periodic review for impairment. Accordingly, the allocation of acquisition cost to identifiable intangible assets has a significant impact on our future operating results. The allocation process requires extensive use of estimates and assumptions, including estimates of future cash flows expected to be generated by the acquired assets. Should conditions be different than management’s assessment, material write-downs of the fair value of intangible assets may be required. We periodically review the estimated remaining useful lives of our intangible assets. A reduction in the estimate of remaining useful life could result in accelerated amortization expense or a write-down in future periods. As such, any future write-downs of these assets would adversely affect our operating results. We perform an annual review of the valuation of goodwill in the fourth quarter of each fiscal year, or more often if indicators of impairment exist. Triggering events for impairment reviews may be indicators such as adverse industry or economic trends, restructuring actions, lower projections of profitability, or a sustained decline in our market capitalization. Evaluations of possible impairment and, if applicable, adjustments to carrying values require us to estimate, among other factors, future cash flows, useful lives, and fair market values of our reporting units and assets. When we conduct our evaluation of goodwill, the fair value of goodwill is assessed using valuation techniques that require significant management judgment. Should conditions be different from management’s last assessment, significant write-downs of goodwill may be required, which would adversely affect our operating results. In fiscal 2010 we performed such evaluation and found no impairment of goodwill. Restructuring Reserves We recognize a liability for restructuring costs when the liability is incurred. The restructuring accruals are based upon management estimates at the time they are recorded. These estimates can change depending upon changes in facts and circumstances subsequent to the date the original liability was recorded. The main components of our restructuring charges are workforce reduction, intangibles and fixed assets write-offs and non-cancelable lease costs related to excess facilities. Severance-related charges are accrued when it is determined that a liability has been incurred, which is generally when individuals have been notified of their termination dates and expected severance payments. We record contract cancellation costs when contracts are terminated. The decision to eliminate 39
  • 40.
    excess facilities resultsin charges for lease termination fees and future commitments to pay lease charges, net of estimated future sublease income. We recognize charges for elimination of excess facilities when we have vacated the premises. Intangible asset write-offs consist of impairment of acquired intangible assets related to our decision to cease the development and availability of specific products. Fixed assets write-offs primarily consist of equipment, software and furniture associated with excess facilities being eliminated, and are based on an estimate of the amounts and timing of future cash flows related to the expected future remaining use and ultimate sale or disposal of the equipment and furniture. Our estimates involve a number of risks and uncertainties, some of which are beyond our control, including future real estate market conditions and our ability to successfully enter into subleases or lease termination agreements with terms as favorable as those assumed when arriving at our estimates. We regularly evaluate a number of factors to determine the appropriateness and reasonableness of our restructuring accruals, including the various assumptions noted above. If actual results differ significantly from our estimates, we may be required to adjust our restructuring accruals in the future. Product Warranties Estimated future warranty costs are expensed as a cost of product revenues when revenue is recognized, based on estimates of the costs that may be incurred under our warranty obligations including material, distribution and labor costs. Our accrued liability for estimated future warranty costs is included in other accrued liabilities and other long-term obligations on the accompanying consolidated balance sheets. Factors that affect our warranty liability include the number of installed units, estimated material costs, estimated distribution costs and estimated labor costs. We periodically assess the adequacy of our warranty accrual and adjust the amount as considered necessary. Stock-Based Compensation We account for stock-based compensation using the Black-Scholes option pricing model to estimate the fair value of each option grant on the date of grant. Our option pricing model requires the input of highly subjective assumptions, including the expected stock price volatility, expected term, and forfeiture rate. Any changes in these highly subjective assumptions significantly impact stock-based compensation expense. Loss Contingencies We are subject to the possibility of various loss contingencies arising in the course of business. We consider the likelihood of the loss or impairment of an asset or the incurrence of a liability as well as our ability to reasonably estimate the amount of loss in determining loss contingencies. An estimated loss contingency is accrued when it is probable that a liability has been incurred or an asset has been impaired and the amount of loss can be reasonably estimated. We regularly evaluate current information available to us to determine whether such accruals should be adjusted. Fair Value Measurements and Impairments All of our available-for-sale investments and nonmarketable securities are subject to periodic impairment review. Investments are considered to be impaired when a decline in fair value is judged to be other-than-temporary. This determination requires significant judgment. For publicly traded investments, impairment is determined based upon the specific facts and circumstances present at the time, including factors such as current economic and market conditions, the credit rating of the security’s issuer, the length of time an investment’s fair value has been below our carrying value, and our ability and intent to hold investments to maturity or for a period of time sufficient to allow for any anticipated recovery in fair value. If an investment’s decline in fair value, caused by factors other than changes in interest rates, is deemed to be other-than-temporary, we reduce its carrying value to its estimated fair value, as determined based on quoted market prices, liquidation values or other metrics. For investments in publicly held companies, we recognize an impairment charge when the decline in the fair value of our investment is below its cost basis and is judged to be other-than-temporary. The ultimate value realized on these investments is subject to market price volatility until they are sold. 40
  • 41.
    Pursuant to theaccounting guidance for fair value measurement and its subsequent updates, fair value is defined as the price that would be received to sell an asset or paid to transfer a liability (i.e., the “exit price”) in an orderly transaction between market participants at the measurement date. The accounting guidance establishes a hierarchy for inputs used in measuring fair value that minimizes the use of unobservable inputs by requiring the use of observable market data when available. Observable inputs are inputs that market participants would use in pricing the asset or liability based on active market data. Unobservable inputs are inputs that reflect the assumptions market participants would use in pricing the asset or liability based on the best information available in the circumstances. The fair value hierarchy is broken down into the three input levels summarized below: • Level 1 — Valuations are based on quoted prices in active markets for identical assets or liabilities, and readily accessible by us at the reporting date. Examples of assets and liabilities utilizing Level 1 inputs are certain money market funds, U.S. Treasuries and trading securities with quoted prices on active markets. • Level 2 — Valuations based on inputs other than the quoted prices in active markets that are observable either directly or indirectly in active markets. Examples of assets and liabilities utilizing Level 2 inputs are U.S. government agency bonds, corporate bonds, commercial paper, certificates of deposit and over-the-counter derivatives. • Level 3 — Valuations based on unobservable inputs in which there is little or no market data, which require us to develop our own assumptions. Examples of assets and liabilities utilizing Level 3 inputs are cost method investments, auction rate securities (ARS) and the Primary Fund. We measure our available-for-sale securities at fair value on a recurring basis. Available-for-sale securities include U.S. Treasury securities, U.S. government agency bonds, corporate bonds, commercial paper, ARSs, money market funds and certificates of deposit. Where possible, we utilize quoted market prices to measure and such items are classified as Level 1 in the hierarchy. When quoted market prices for identical assets are unavailable, varying valuation techniques are used. Such assets are classified as Level 2 or Level 3 in the hierarchy. We classify items in Level 2 if investments are valued using observable inputs to quoted market prices, benchmark yields, reported trades, broker/dealer quotes or alternative pricing sources with reasonable levels of price transparency. We classify items in Level 3 if investments are valued using a pricing model, based on unobservable inputs in the market or that require us to develop our own assumptions. Our assessment of the significance of a particular input to the fair value measurement in its entirety requires judgment and considers factors specific to the investment. We are also exposed to market risk relating to our available-for-sale investments due to uncertainties in the credit and capital markets. The fair value of our investments may change significantly due to events and conditions in the credit and capital markets. These securities/issuers could be subject to review for possible downgrade. Any downgrade in these credit ratings may result in an additional decline in the estimated fair value of our investments. We monitor and evaluate the accounting for our investment portfolio on a quarterly basis for additional other-than-temporary impairment charges. We actively review current investment ratings, company specific events, and general economic conditions in managing our investments and determining whether there is a significant decline in fair value that is oth- er-than-temporary. As of April 30, 2010 and April 24, 2009, our short-term and long-term investments in marketable securities have been classified as “available-for-sale” and are carried at fair value. Available-for-sale investments with original maturities of greater than three months at the date of purchases are classified as short-term investments as these investments generally consist of marketable securities that are intended to be available to meet current cash requirements. Currently, all marketable securities held by us are classified as available-for-sale and our entire ARS portfolio is classified as long-term investments. Our ARS portfolio consists of securities with long-term nominal maturities which, in accordance with investment policy guidelines, had credit ratings of AAA and Aaa at the time of purchase. During fiscal 2008, we reclassified all of our investments in ARS from short-term investments to long-term investments as we believed our ability to liquidate these investments in the next twelve months was uncertain. Based on an analysis of the fair value and marketability of these investments, we recorded temporary impairment charges of approximately $3.3 million during fiscal 2010, partially offset by $0.7 million in unrealized gains within other comprehensive income (loss). 41
  • 42.
    During fiscal 2009,we recorded temporary impairment charges of approximately $7.0 million, partially offset by $0.3 million in unrealized gains within other comprehensive income (loss). In addition, during fiscal 2009, we recorded an other-than-temporary impairment loss of $2.1 million due to a significant decline in the estimated fair values of certain of our ARS related to credit quality risk and rating downgrades. The valuation models used to estimate the fair value of our ARS included numerous assumptions such as assessments of the underlying structure of each security, expected cash flows, discount rates, credit ratings, workout periods, and overall capital market liquidity. These assumptions, assessments and the interpretations of relevant market data are subject to uncertainties, are difficult to predict and require significant judgment. The use of different assumptions, or applying different judgments to inherently subjective matters and changes in future market conditions could result in significantly different estimates of fair value. There is no assurance as to when the market for auction rate securities will stabilize. The fair value of our ARS could change significantly based on market conditions and continued uncertainties in the credit markets. If these uncertainties continue or if these securities experience credit rating downgrades, we may incur additional temporary impairment related to our auction rate securities portfolio. We will continue to monitor the fair value of our ARS and relevant market conditions and will record additional temporary or other-than-temporary impairments if future circumstances warrant such charges. As a result of the bankruptcy filing of Lehman Brothers, which occurred during fiscal 2009, we recorded an other-than-temporary impairment charge of $11.8 million on our corporate bonds related to investments in Lehman Brothers securities and approximately $9.3 million on our investments in the Primary Fund that held Lehman Brothers investments. During fiscal 2010, we sold our remaining holdings of Lehman Brothers bonds and the Primary Fund made multiple distributions of its assets to its investors, and as of April 30, 2010, we recovered our recorded investment, with the exception of $0.2 million, for which we recognized an additional loss. As of April 30, 2010, we no longer had any direct or indirect investments related to Lehman Brothers and have recognized all related losses in our statement of operations. During fiscal 2010, 2009 and 2008, recognized gains and losses on available-for-sale investments were not material. Management determines the appropriate classification of investments at the time of purchase and reevaluates the classification at each reporting date. The fair value of our marketable securities, including those included in cash equivalents and long-term investments, was $3,605.2 million and $2,596.6 million as of April 30, 2010 and April 24, 2009, respectively. To determine the fair value of nonmarketable investments, we use the most recent information available to us, including new financings or estimates of current fair value, as well as through traditional valuation techniques. It is our policy to review the fair value of these investments on a regular basis to determine whether the investments in these companies are other-than-temporarily impaired. In the case of privately-held companies, this evaluation is based on information that we request from these companies. If we believe the carrying value of an investment is in excess of fair value, and this difference is other-than-temporary, it is our policy to write down the investment to fair value. The carrying value of our investments in privately-held companies was $1.4 million and $3.9 million as of April 30, 2010 and April 24, 2009, respectively. During fiscal 2010 and 2009, we recorded $3.4 million of gains and $6.3 million of net impairment charges in our consolidated statements of operations, respectively, for our investments in privately-held companies, and adjusted the carrying amount of those investments to fair value, as we deemed the decline in the value of these assets to be other-than-temporary. Income Taxes The determination of our tax provision is subject to judgments and estimates due to the complexity of the tax law that we are subject to in several tax jurisdictions. Earnings derived from our international business are generally taxed at rates that are lower than U.S. rates, resulting in a lower effective tax rate than the U.S. statutory tax rate of 35.0%. The ability to maintain our current effective tax rate is contingent on existing tax laws in both the United States and the respective countries in which our international subsidiaries are located. Future changes in domestic or international tax laws could affect the continued realization of the tax benefits we are currently receiving. In addition, a decrease in the percentage of our total earnings from international business or a change in the mix of international business among particular tax jurisdictions could increase our overall effective tax rate. 42
  • 43.
    We account forincome taxes by recognizing deferred tax assets and liabilities for the effect of temporary differences between the carrying amounts of assets and liabilities for financial reporting purposes and the amounts used for income tax purposes. We reduce deferred tax assets by a valuation allowance if it is more likely than not that some or all of the deferred tax asset will not be realized. Tax attributes related to the exercise of employee stock options are not realized until they result in a reduction of taxes payable. We do not include unrealized stock option attributes as components of our gross deferred tax assets and corresponding valuation allowance disclosures. We have provided a valuation allowance of $28.3 million as of April 30, 2010, compared to $28.0 million as of April 24, 2009 and $28.6 million as of April 25, 2008, on certain of our deferred tax assets. The changes in valuation allowance in fiscal 2010 and 2009 were primarily related to changes in the blended state tax rates. The tax effected amounts of gross unrealized net operating loss and business tax credit carryforwards, net of their corresponding valuation allowance at April 30, 2010 are $358.6 million. We recognize tax liabilities for uncertain tax positions by applying a recognition threshold and measurement attribute for the financial statement recognition and measurement of a tax position taken or expected to be taken in a tax return. We recognize the tax liability for uncertain income tax positions on income tax returns based on a two- step process. The first step is to determine whether it is more likely than not that each income tax position would be sustained upon audit. The second step is to estimate and measure the tax benefit as the amount that has a greater than 50% likelihood of being realized upon ultimate settlement with the tax authority. Estimating these amounts requires us to determine the probability of various possible outcomes. We evaluate these uncertain tax positions on a quarterly basis. This evaluation is based on the consideration of several factors, including changes in facts or circumstances, changes in applicable tax law, settlement of issues under audit and new exposures. If we later determine that our exposure is lower or that the liability is not sufficient to cover our revised expectations, we adjust the liability and effect a related change in our tax provision during the period in which we make such determination. New Accounting Standards See Note 4 of the accompanying consolidated financial statements for a full description of new accounting pronouncements, including the respective expected dates of adoption and effects on results of operations and financial condition. 43
  • 44.
    Results of Operations The following table sets forth certain Consolidated Statements of Operations data as a percentage of net revenues for the periods indicated: Year Ended April 30, April 24, April 25, 2010 2009 2008 Revenues: Product . . . . . . . . . . . . . . . . . . . . . . . . . . . . . . . . . . . . . . . . .... 60.6% 63.2% 67.9% Software entitlements and maintenance . . . . . . . . . . . . . . . . . .... 17.3 18.2 14.7 Service . . . . . . . . . . . . . . . . . . . . . . . . . . . . . . . . . . . . . . . . .... 22.1 22.4 17.4 GSA settlement . . . . . . . . . . . . . . . . . . . . . . . . . . . . . . . . . . .... — (3.8) — Net revenues 100.0 100.0 100.0 Cost of revenues: Cost of product . . . . . . . . . . . . . . . . . . . . . . . . . . . . . . . . . . . . . . 24.8 29.6 28.4 Cost of software entitlements and maintenance . . . . . . . . . . . . . . . 0.3 0.3 0.3 Cost of service . . . . . . . . . . . . . . . . . . . . . . . . . . . . . . . . . . . . . . . 10.8 11.7 10.4 Gross profit . . . . . . . . . . . . . . . . . . . . . . . . . . . . . . . . . . . . . . . . . . . 64.1 58.4 60.9 Operating expenses: Sales and marketing . . . . . . . . . . . . . . . . . . . . . . . . . . . . . . . .... 32.9 34.8 32.6 Research and development . . . . . . . . . . . . . . . . . . . . . . . . . . .... 13.6 14.6 13.7 General and administrative . . . . . . . . . . . . . . . . . . . . . . . . . . .... 6.1 6.0 5.2 Restructuring and other charges . . . . . . . . . . . . . . . . . . . . . . .... 0.1 1.6 — Acquisition related income, net . . . . . . . . . . . . . . . . . . . . . . .... (1.0) — — Total operating expenses . . . . . . . . . . . . . . . . . . . . . . . . . . . . . . 51.7 57.0 51.5 Income from operations . . . . . . . . . . . . . . . . . . . . . . . . . . . . . . .... 12.4 1.4 9.4 Other income (expenses), net: Interest income . . . . . . . . . . . . . . . . . . . . . . . . . . . . . . . . . . .... 0.9 1.7 2.0 Interest expense . . . . . . . . . . . . . . . . . . . . . . . . . . . . . . . . . . .... (1.9) (1.9) (0.2) Other income (expenses), net . . . . . . . . . . . . . . . . . . . . . . . . .... — (1.0) 0.4 Total other income (expenses), net . . . . . . . . . . . . . . . . . . . . . . . . . . (1.0) (1.2) 2.2 Income before income taxes . . . . . . . . . . . . . . . . . . . . . . . . . . . . . . . 11.4 0.2 11.6 Provision for (benefit from) income taxes . . . . . . . . . . . . . . . . . . . . . 1.2 (1.7) 2.2 Net income . . . . . . . . . . . . . . . . . . . . . . . . . . . . . . . . . . . . . . . . . . . 10.2% 1.9% 9.4% Discussion and Analysis of Results of Operations Net Revenues — Our net revenues for fiscal 2010, 2009 and 2008 were as follows (in millions, except percentages): Year Ended April 30, 2010 April 24, 2009 % Change April 25, 2008 % Change Net revenues . . . . . . . . . . . . . . . . . . . . $3,931.4 $3,406.4 15% $3,303.2 3% Net revenues increased by $525.0 million, or 15%, in fiscal 2010 compared to fiscal 2009 and by $103.2 million, or 3% in fiscal 2009 compared to fiscal 2008. The increase in our net revenues for fiscal 2010 was primarily related to an increase in product revenues, while the increase in fiscal 2009 was due to increases in software entitlements and 44
  • 45.
    maintenance (SEM) andservices revenues, partially offset by decreases in product revenues. Additionally, net revenues for fiscal 2009 were negatively impacted by the $128.7 million GSA settlement. Sales through our indirect channels represented 69%, 69% and 63% of net revenues for fiscal 2010, 2009 and 2008, respectively. The indirect channel mix for 2009 would have been 3% higher if not for the impact of the GSA settlement. The following table sets forth sales to customers, who are distributors, who accounted for 10% or more of revenues (in millions, except percentages): Year Ended April 30, % of April 24, % of April 25, % of 2010 Revenues 2009 Revenues 2008 Revenues Arrow . . . . . . . . . . . . . . . . . . . . . . . . . . . . $550.7 14% $360.3 11% G 10% G 10% Avnet . . . . . . . . . . . . . . . . . . . . . . . . . . . . . 444.0 11% 356.4 10% G 10% G 10% Product Revenues (in millions, except percentages): Year Ended April 30, 2010 April 24, 2009 % Change April 25, 2008 % Change Product revenues . . . . . . . . . . . . . . . . . $2,381.1 $2,152.7 11% $2,242.5 (4)% Product revenues increased by $228.4 million, or 11%, in fiscal 2010 compared to fiscal 2009, and decreased by $89.8 million, or 4% in fiscal 2009 compared to fiscal 2008. Our configured systems comprise bundled hardware and software products. Configured systems unit volume increased by 19% in fiscal 2010 compared to fiscal 2009, with the largest increase in low-end systems, and increased by 14% in fiscal 2009 compared to fiscal 2008, reflecting an increase in low-end systems, partially offset by decreases in mid-range and high-end systems. During fiscal 2010, high-end, midrange and low-end systems generated approximately 23%, 56% and 21% of configured systems revenues, respectively, compared to approximately 24%, 55% and 21%, respectively in fiscal 2009, and approximately 25%, 59% and 16%, respectively, in fiscal 2008. Overall average selling prices (ASPs) declined in fiscal 2010 compared to fiscal 2009 due primarily to a shift in mix towards low-end systems, as well as lower ASPs per unit in midrange and low-end systems. ASPs declined in fiscal 2009 compared to fiscal 2008, due primarily to lower ASPs in all systems ranges and a shift in mix towards low-end systems. In addition, our net add-on hardware, software and other product revenues accounted for an $88.5 million increase in fiscal 2010 compared to fiscal 2009 and a $102.4 million increase in fiscal 2009 compared to fiscal 2008 due to customers increasing the capacity of their storage systems. Our systems are highly configurable to respond to customer requirements in the open systems storage markets that we serve. This wide variation in customer configurations can significantly impact revenues, cost of revenues, and gross profit performance. Price changes, unit volumes, customer mix and product configuration can also impact revenues, cost of revenues and gross profit performance. Disks are a significant component of our storage systems. Industry disk pricing continues to fall every year, and we pass along those price decreases to our customers while working to maintain relatively constant profit margins on our disk drives. While our sales price per terabyte continues to decline, improved system performance, increased capacity and software to manage this increased capacity have an offsetting impact on product revenues. Software Entitlements and Maintenance Revenues (in millions, except percentages): Year Ended April 30, 2010 April 24, 2009 % Change April 25, 2008 % Change Software entitlements and maintenance revenues . . . . . . . . . . . . . . . . . . . . . . $679.8 $618.3 10% $486.9 27% SEM revenues increased by $61.5 million, or 10%, in fiscal 2010 compared to fiscal 2009 and increased by $131.4 million, or 27% in fiscal 2009 compared to fiscal 2008. These increases were the result of an increase in the 45
  • 46.
    aggregate contract valueof the installed base under SEM contracts, which is recognized as revenue ratably over the terms of the underlying contracts. Service Revenues (in millions, except percentages): Year Ended April 30, 2010 April 24, 2009 % Change April 25, 2008 % Change Service revenues . . . . . . . . . . . . . . . . . $870.5 $764.1 14% $573.8 33% Service revenues include hardware maintenance, professional services and educational and training services. Service revenues increased by $106.4 million, or 14%, in fiscal 2010, compared to fiscal 2009 and by $190.3 million, or 33% in fiscal 2009, compared to fiscal 2008. Service maintenance contract revenues increased 20% in fiscal 2010 compared to fiscal 2009 and increased 35% in fiscal 2009 compared to fiscal 2008, as a result of an increase in the installed base of service contracts and the timing of recognition of the related revenue. Professional services and educational and training services revenues increased 4% for fiscal 2010, compared to fiscal 2009, and increased 32% in fiscal 2009, compared to fiscal 2008. GSA settlement (in millions, except percentages): Year Ended April 30, 2010 April 24, 2009 % Change April 25, 2008 % Change GSA settlement . . . . . . . . . . . . . . . . . . $— $(128.7) (100)% $— NM NM — Not meaningful. During fiscal 2009 we recorded $128.7 million as a reduction of revenues for the GSA settlement. Revenues by Geographic Area (in millions, except percentages): Year Ended April 30, 2010 April 24, 2009 % Change April 25, 2008 % Change Americas (United States, Canada and Latin America)* . . . . . . . . . . . . . . . . $2,208.1 $1,805.2 22% $1,829.4 (1)% Europe, Middle East and Africa (EMEA) . . . . . . . . . . . . . . . . . . . . . . 1,329.1 1,213.3 11% 1,083.8 12% Asia Pacific and Japan (APAC) . . . . . . . 394.2 387.9 1% 390.0 (0)% Net revenues . . . . . . . . . . . . . . . . . . . . $3,931.4 $3,406.4 $3,303.2 * Sales to the United States accounted for 89%, 90% and 91% of Americas’ revenues in fiscal 2010, 2009 and 2008, respectively. Revenues from the Americas geographic area increased by $402.9 million in fiscal 2010 compared to fiscal 2009, due to an increase in gross revenues of $531.6 million and the negative impact in fiscal 2009 of the $128.7 million GSA settlement. Sales to Germany accounted for 11% of net revenues in each of fiscal 2010 and 2009, and less than 10% of net revenues in fiscal 2008. No other single foreign country accounted for ten percent or more of net revenues in any of the years presented. Cost of Revenues Our cost of revenues consists of three elements: (1) cost of product revenues, which includes the costs of manufacturing and shipping of our storage systems, amortization of purchased intangible assets, inventory write- downs, and warranty costs; (2) cost of software maintenance and entitlements, which includes the costs of providing software entitlements and maintenance and third party royalty costs, and (3) cost of service, which reflects costs 46
  • 47.
    associated with providingsupport center activities for hardware, global support partnership programs, professional services and educational and training services. Our gross profits are impacted by a variety of factors including pricing and discount practices, channel sales mix, revenue mix and product material costs. Service gross profit is also typically impacted by factors such as changes in the size of our installed base of products, as well as the timing of support service initiations and renewals, and incremental investments in our customer support infrastructure. If our shipment volumes, product and services mix, average selling prices and pricing actions that impact our gross profit are adversely affected, whether by economic uncertainties or for other reasons, our gross profit could decline. Cost of Product Revenues (in millions, except percentages): Year Ended April 30, 2010 April 24, 2009 % Change April 25, 2008 % Change Cost of product revenues . . . . . . . . . . . $976.4 $1,007.6 (3)% $938.4 7% Cost of product revenues decreased by $31.2 million, or 3%, in fiscal 2010 compared to fiscal 2009 as a result of lower materials costs, warranty costs and demonstration equipment reserves, partially offset by higher unit volume. Cost of product revenues increased by $69.2 million, or 7%, in fiscal 2009 compared to fiscal 2008, primarily due to increased materials cost as a result of increased unit volume and higher per unit costs in all products ranges. The decrease in cost of product revenues in fiscal 2010 compared to fiscal 2009 reflected a decrease in materials costs of $9.9 million despite an increase in total units shipped. Our material costs were favorably impacted in fiscal 2010 by lower average per unit materials costs in our midrange and low-end systems due to favorable materials pricing, which we expect to continue. These favorable impacts were offset by higher unit volume and higher average per unit materials costs in our high-end systems. In addition, our cost of product revenues were favorably impacted in fiscal 2010 compared to fiscal 2009 as a result of a decrease of $11.3 million in warranty costs and $8.6 million in reserves for evaluation equipment due to higher than anticipated sales of such equipment to customers. Cost of product revenues were negatively impacted in fiscal 2009 compared to fiscal 2008 as a result of approximately $9.7 million of incremental inventory writedowns. Cost of product revenues represented 41% of product revenue for 2010 compared to 47% for 2009, and 42% in fiscal 2008. The overall reduction of costs as a percentage of revenues in fiscal 2010 was the result of per unit materials cost reductions outpacing sales price reductions. The increase in materials costs as a percentage of revenues in fiscal 2009 reflected higher per unit materials costs compared to the prior year. Cost of product revenues increased (decreased) due to the following: Year % Change Year % Change Fiscal 2009 to Fiscal 2008 to Fiscal 2010 Fiscal 2009 Materials costs . . . . . . . . . . . . . . . . . . . . . . . . . . . . . . . . . . . . . . . . 1% 6% Excess and obsolete inventory . . . . . . . . . . . . . . . . . . . . . . . . . . . . (2) 1 Warranty . . . . . . . . . . . . . . . . . . . . . . . . . . . . . . . . . . . . . . . . . . . . (1) — Other . . . . . . . . . . . . . . . . . . . . . . . . . . . . . . . . . . . . . . . . . . . . . . . (1) — Total change . . . . . . . . . . . . . . . . . . . . . . . . . . . . . . . . . . . . . . . . . (3)% 7% Cost of Software Entitlements and Maintenance Revenues (in millions, except percentages): Year Ended April 30, 2010 April 24, 2009 % Change April 25, 2008 % Change Cost of software entitlements and maintenance revenues . . . . . . . . . . . . $12.3 $9.2 34% $8.6 7% 47
  • 48.
    Cost of SEMrevenues increased due to the following: Year % Change Year % Change Fiscal 2009 to Fiscal 2008 to Fiscal 2010 Fiscal 2009 Field service engineering costs . . . . . . . . . . . . . . . . . . . . . . . . . 29% 30% Royalties . . . . . . . . . . . . . . . . . . . . . . . . . . . . . . . . . . . . . . . . . 5 (23) Total change. . . . . . . . . . . . . . . . . . . . . . . . . . . . . . . . . . . . . . . 34% 7% Cost of SEM revenues increased by $3.1 million, or 34%, in fiscal 2010 compared to fiscal 2009 and increased by $0.6 million, or 7%, in fiscal 2009 compared to fiscal 2008 due to an increase in field service engineering costs. Cost of SEM revenues represented 2% of SEM revenues for each of the fiscal 2010, 2009 and 2008, respectively. Cost of Service Revenues (in millions, except percentages): Year Ended April 30, 2010 April 24, 2009 % Change April 25, 2008 % Change Cost of service revenues . . . . . . . . . . . . $423.5 $399.7 6% $342.8 17% Cost of service revenues increased by $23.8 million, or 6%, in fiscal 2010 compared to fiscal 2009 due to increased commissions and incentive compensation plan expenses, as well as an increase in service and support purchased from third parties, and increased by $56.9 million, or 17%, in fiscal 2009 compared to fiscal 2008 due to increases in professional support engineer costs, support center activities, and global service partnership programs. Costs represented 49%, 52% and 60%, respectively, of service revenues for fiscal 2010, 2009 and 2008. The decrease in service cost of revenues as a percentage of service revenue was primarily due to improved productivity. Operating Expenses Sales and Marketing, Research and Development, and General and Administrative Expenses Compensation costs comprise the largest component of operating expenses. Included in compensation costs are salaries and related benefits, stock-based compensation costs and employee incentive compensation plan costs. Compensation costs included in operating expenses increased approximately $108.6 million, or 11%, during fiscal 2010 compared to fiscal 2009, primarily due to (i) a $75.6 million increase in employee incentive compensation due to stronger operating profit performance, (ii) a $16.4 million increase in stock based compensation, and (iii) a $16.5 million increase in salaries, benefits and other compensation related costs. In addition, sales and marketing expenses reflected an increase in commissions expense of $60.7 million during fiscal 2010, reflecting stronger sales performance compared to fiscal 2009. Compensation costs included in operating expenses increased approximately $111.4 million, or 12%, during fiscal 2009 compared to fiscal 2008, primarily due to (i) an $113.1 million increase in salaries, benefits and other compensation related costs, reflecting an increase in average headcount and (ii) a $7.3 million increase in employee incentive compensation, partially offset by a $9.0 million decrease in stock-based compensation expense. Sales and Marketing (in millions, except percentages) — Year Ended April 30, 2010 April 24, 2009 % Change April 25, 2008 % Change Sales and marketing expenses . . . . . . . . $1,293.7 $1,186.1 9% $1,075.7 10% Sales and marketing expense consists primarily of compensation costs, commissions, allocated facilities and IT costs, advertising and marketing promotional expense, and travel and entertainment expense. In addition, during 48
  • 49.
    fiscal 2009, werecorded a $9.4 million loss on impairment of a sales force automation tool. Sales and marketing expenses increased due to the following: Year % Change Year % Change Fiscal 2009 to Fiscal 2008 to Fiscal 2010 Fiscal 2009 Salaries . . . . . . . . . . . . . . . . . . . . . . . . . . . . . . . . . . . . . . . . . . . . . —% 6% Incentive plan compensation . . . . . . . . . . . . . . . . . . . . . . . . . . . . . . 3 — Stock based compensation . . . . . . . . . . . . . . . . . . . . . . . . . . . . . . . 1 — Other compensation related costs . . . . . . . . . . . . . . . . . . . . . . . . . . 1 — Commissions . . . . . . . . . . . . . . . . . . . . . . . . . . . . . . . . . . . . . . . . . 5 — Advertising and marketing promotional expense . . . . . . . . . . . . . . . (1) — IT expenses related to software implementation and IT support . . . . 1 3 Travel and entertainment expense . . . . . . . . . . . . . . . . . . . . . . . . . . (1) — Asset impairment . . . . . . . . . . . . . . . . . . . . . . . . . . . . . . . . . . . . . . (1) 1 Other . . . . . . . . . . . . . . . . . . . . . . . . . . . . . . . . . . . . . . . . . . . . . . . 1 — Total change . . . . . . . . . . . . . . . . . . . . . . . . . . . . . . . . . . . . . . . . . 9% 10% Research and Development (in millions, except percentages) — Year Ended April 30, 2010 April 24, 2009 % Change April 25, 2008 % Change Research and development expenses . . . $535.7 $498.5 7% $452.2 10% Research and development expense consists primarily of compensation costs, allocated facilities and IT costs, depreciation and amortization, and prototype, non-recurring engineering (NRE) charges and other outside services costs. Research and development expenses increased due to the following: Year % Change Year % Change Fiscal 2009 to Fiscal 2008 to Fiscal 2010 Fiscal 2009 Salaries . . . . . . . . . . . . . . . . . . . . . . . . . . . . . . . . . . . . . . . . . . . . . (1)% 7% Incentive plan compensation . . . . . . . . . . . . . . . . . . . . . . . . . . . . . . 6 1 Stock based compensation . . . . . . . . . . . . . . . . . . . . . . . . . . . . . . . — (2) Facilities and IT support costs . . . . . . . . . . . . . . . . . . . . . . . . . . . . 2 2 NRE charges . . . . . . . . . . . . . . . . . . . . . . . . . . . . . . . . . . . . . . . . . 1 1 Other . . . . . . . . . . . . . . . . . . . . . . . . . . . . . . . . . . . . . . . . . . . . . . . (1) 1 Total change . . . . . . . . . . . . . . . . . . . . . . . . . . . . . . . . . . . . . . . . . 7% 10% We believe that our future performance will depend in large part on our ability to maintain and enhance our current product line, develop new products that achieve market acceptance, maintain technological competitiveness and meet an expanding range of customer requirements. We expect to continue to spend on current and future product development efforts, broaden our existing product offerings and introduce new products that expand our solutions portfolio. General and Administrative (in millions, except percentages) — Year Ended April 30, 2010 April 24, 2009 % Change April 25, 2008 % Change General and administrative expenses . . . $238.8 $203.7 17% $171.5 19% 49
  • 50.
    General and administrativeexpense consists primarily of compensation costs, professional and corporate legal fees, recruiting expenses, and allocated facilities and IT costs. General and administrative expenses increased due to the following: Year % Change Year % Change Fiscal 2009 to Fiscal 2008 to Fiscal 2010 Fiscal 2009 Salaries . . . . . . . . . . . . . . . . . . . . . . . . . . . . . . . . . . . . . . . . . . . . . 1% 5% Incentive plan compensation . . . . . . . . . . . . . . . . . . . . . . . . . . . . . . 8 1 Stock based compensation . . . . . . . . . . . . . . . . . . . . . . . . . . . . . . . 4 — Other compensation related costs . . . . . . . . . . . . . . . . . . . . . . . . . . 3 1 Professional and corporate legal fees. . . . . . . . . . . . . . . . . . . . . . . . (2) 8 IT costs . . . . . . . . . . . . . . . . . . . . . . . . . . . . . . . . . . . . . . . . . . . . . 2 4 Other . . . . . . . . . . . . . . . . . . . . . . . . . . . . . . . . . . . . . . . . . . . . . . . 1 — Total change . . . . . . . . . . . . . . . . . . . . . . . . . . . . . . . . . . . . . . . . . 17% 19% Restructuring and Other Charges (in millions, except percentages): Year Ended April 30, 2010 April 24, 2009 % Change April 25, 2008 % Change Restructuring and other charges . . . . . . $2.5 $54.4 (95)% $0.4 13,500% Fiscal 2009 Restructuring Plans — In February 2009, we announced our decision to execute a worldwide restructuring program, which included a reduction in workforce, the closing or downsizing of certain facilities, and the establishment of a plan to outsource certain internal activities. In December 2008, we announced our decision to cease the development and availability of SnapMirror for Open Systems (SMOS), which was originally acquired through our acquisition of Topio in fiscal 2007. As part of this decision, we also announced the closure of our engineering facility in Haifa, Israel. These restructuring activities resulted in restructuring charges in fiscal 2009 totaling $51.5 million of severance-related amounts and other charges attributable to the termination of approx- imately 450 regular positions, abandoned excess facilities, charges relating to non-cancelable lease costs, (which are net of expected sublease income); contract cancellation charges; outplacement expenses; fixed assets and intangibles write-offs; as well as $2.9 million of other charges to support our restructuring initiatives. In fiscal 2010, we recorded additional charges of $2.5 million primarily related to adjustments to future lease commitments and employee severance costs associated with our fiscal 2009 restructuring plan. In recording the facility lease restructuring reserve, we made certain estimates and assumptions related to the (i) time period over which the relevant buildings would remain vacant, (ii) sublease terms, and (iii) sublease rates. Fiscal 2002 Restructuring Plan — As of April 30, 2010, we had $0.5 million remaining in facility restruc- turing reserves established as part of a restructuring in fiscal 2002 related to future lease commitments on exited facilities, net of expected sublease income. We reevaluate our estimates and assumptions periodically and make adjustments as necessary based on the time period over which the facilities will be vacant, expected sublease terms, and expected sublease rates. As of April 30, 2010, the remaining balance of the restructuring reserve related to the fiscal 2009 and 2002 restructuring plans consisted of approximately $4.1 million of facilities-related lease payments, which we expect to be substantially paid by January 2013. See Note 13 of the accompanying consolidated financial statements for further discussion of our restructuring activities. Acquisition Related Income, Net (in millions, except percentages): Year Ended April 30, 2010 April 24, 2009 % Change April 25, 2008 % Change Acquisition related income, net . . . . . . . $(39.9) $— NM $— NM NM — Not meaningful. 50
  • 51.
    On May 20,2009, we announced that we had entered into a merger agreement with Data Domain, Inc. (Data Domain) under which we would acquire Data Domain in a stock and cash transaction. On July 8, 2009, Data Domain’s Board of Directors terminated the merger agreement and pursuant to the terms of the agreement, Data Domain paid us a $57.0 million termination fee. We incurred $15.9 million of incremental third-party costs relating to the terminated merger transaction during the same period, resulting in net proceeds of $41.1 million recorded in the consolidated statement of operations during fiscal 2010. During fiscal 2010, we paid $1.2 million of acquisition related expenses related to the acquisition of Bycast Inc. (see Note 20 of the accompanying consolidated financial statements). Other Income and Expense Interest Income (in millions, except percentages): Year Ended April 30, 2010 April 24, 2009 % Change April 25, 2008 % Change Interest income. . . . . . . . . . . . . . . . . . . $31.2 $57.6 (46)% $64.6 (11)% The decrease in interest income for fiscal 2010 compared to fiscal 2009, and in fiscal 2009 compared to fiscal 2008, was primarily due to lower market yields on our cash and investment portfolio. In fiscal 2009, this yield decline was partially offset by an increase in our cash and investment balances due to the issuance of the Convertible Notes (the “Note”), (see Note 10 of the accompanying consolidated financial statements). Interest Expense (in millions, except percentages): Year Ended April 30, 2010 April 24, 2009 % Change April 25, 2008 % Change Interest expense . . . . . . . . . . . . . . . . . . $(74.1) $(63.4) 17% $(8.0) 693% Interest expense increased $10.7 million for fiscal 2010 compared to fiscal 2009, primarily due to interest expense on our 1.75% Notes, issued on June 10, 2008, which were outstanding for the full year ended April 30, 2010 but only a partial period in the prior year. During fiscal 2010 and fiscal 2009, we recognized approximately $50.8 million and $41.0 million, respec- tively, in incremental non-cash interest expense from the amortization of debt discount and issuance costs relating to our Notes. The coupon interest expense related to the Notes was $22.5 million and $19.4 million, respectively, for fiscal 2010 and fiscal 2009. The increase in interest expense in fiscal 2009 compared to fiscal 2008 was primarily due to interest expense and amortization of debt issuance costs on our Notes, partially offset by lower interest expense related to the reduced outstanding balance on our secured credit agreement we entered into with JPMorgan in October 2007. Other Income (Expense), Net (in millions, except percentages): Year Ended April 30, 2010 April 24, 2009 % Change April 25, 2008 % Change Realized gain (loss) on investments, net . . . . $ 3.9 $ — NM $12.6 (100)% Impairment of investments . . . . . . . . . . . . . . — (29.5) (100)% — NM Other expenses, net . . . . . . . . . . . . . . . . . . . (2.4) (3.6) (33)% (0.1) 2,600% Other income (expense), net. . . . . . . . . . . . . $ 1.5 $(33.1) NM $12.5 NM NM — Not meaningful Other income (expense), net in fiscal 2010 included $3.9 million of net gains on investments, consisting primarily of a gain on investments in privately held companies of $3.7 million and $1.0 million net gain on our investment in the Primary Fund and Lehman Brothers securities, offset by net losses on other investments of $0.8 million. Other expenses included $5.3 in net losses on foreign currency transactions and related hedging activities, partially offset by other income of $2.9 million. 51
  • 52.
    Other income (expense),net in fiscal 2009 included a net impairment loss related to our investments in privately held companies of $6.3 million, an other-than-temporary impairment charge on our available-for-sale investments related to direct and indirect investments in Lehman Brothers securities of $21.1 million, and an other-than-temporary decline in the value of our ARS of $2.1 million. Other expenses included $5.0 in net exchange losses from foreign currency transactions and related hedging activities, partially offset by other income of $1.4 million. Other income (expense), net in fiscal 2008 consisted primarily of a gain of $13.6 million related to the sale of shares of Blue Coat common stock, partially offset by a net impairment of $1.0 million for our investments in privately-held companies. Other expense included $0.7 in net exchange losses from foreign currency transactions and related hedging activities, partially offset by other income of $0.6 million. Provision for (Benefit from) Income Taxes (in millions, except percentages): Year Ended April 30, 2010 April 24, 2009 % Change April 25, 2008 % Change Provision for (benefit from) income taxes . . . $46.6 $(56.3) NM $73.0 NM NM — Not meaningful. Our effective tax rate for fiscal 2010 was 10.4%, compared to an effective tax benefit of 681.5% for fiscal 2009 and an effective tax rate of 19.1% for fiscal 2008. Our effective tax rate reflects our corporate legal entity structure and the global nature of our business with a significant amount of our profits generated and taxed in foreign jurisdictions at rates below the U.S. statutory tax rate. The effective tax rate for fiscal 2010 was favorably impacted by the geographic mix of profits. The tax benefit rate for fiscal 2009 reflected losses generated in the U.S. during that period that were partially offset by profits generated in foreign tax jurisdictions where the tax rates were below the U.S. statutory rate. The effective tax rate of 10.4% in fiscal 2010 included a benefit of $105.3 million, or 23.5 percentage points, related to foreign income tax rates that are lower than the U.S. federal statutory rate of 35%, a benefit of $7.8 million, or 1.7 percentage points, related to research and development tax credits, a benefit of $2.6 million, or 0.6 percentages points, related to stock-based compensation, partially offset by the unfavorable impact of $2.6 million, or 0.6 percentage points, related to state income taxes. The effective tax benefit of 681.5% for fiscal 2009 included the benefit of $51.0 million, or 616.8 percentage points, related to foreign income tax rates that are lower than the U.S. federal statutory rate of 35%, a benefit of $9.2 million, or 111.1 percentage points, related to research and development tax credits, a benefit of $7.9 million, or 95.5 percentage points, related to state income taxes, partially offset by the unfavorable impact of $10.2 million, or 122.9 percentage points, related to stock-based compensation. The effective tax rate of 19.1% for fiscal 2008 included a benefit of $67.6 million, or 17.7 percentage points, related to foreign income tax rates that are lower than the U.S. federal statutory rate, a benefit of $4.7 million, or 1.2 percentage points, related to research and development tax credits, partially offset by the unfavorable impact of $11.02 million, or 2.9 percentages points, related to stock-based compensation, and $2.2 million, or 0.6 percentage points, related to state income taxes. Liquidity and Capital Resources The following sections discuss our principal liquidity requirements, as well as our sources and uses of cash flows on our liquidity and capital resources. The principal objectives of our investment policy are the preservation of principal and maintenance of liquidity. We attempt to mitigate default risk by investing in high-quality investment grade securities, limiting the time to maturity and by monitoring the counter-parties and underlying obligors closely. We believe our cash equivalents and short-term investments are liquid and accessible. We are not aware of any significant deterioration in the fair value of our cash equivalents or investments from the values reported as of April 30, 2010. 52
  • 53.
    Liquidity Sources, CashRequirements Our principal sources of liquidity as of April 30, 2010 consisted of approximately $3.7 billion in cash, cash equivalents and short-term investments and cash we expect to generate from operations. Cash, cash equivalents and investments consist of the following: April 30, 2010 April 24, 2009 Cash and cash equivalents . . . . . . . . . . . . . . . . . . . . . . . . . . . . . . . . $1,705.0 $1,494.2 Short-term investments . . . . . . . . . . . . . . . . . . . . . . . . . . . . . . . . . . 2,019.0 1,110.1 Long-term investments and restricted cash . . . . . . . . . . . . . . . . . . . . 72.8 127.3 Total cash, cash equivalents and investments . . . . . . . . . . . . . . . . . . . . $3,796.8 $2,731.6 Our principal liquidity requirements are primarily to meet our working capital needs, support ongoing business activities, research and development, capital expenditure needs, investment in critical or complementary tech- nologies, and to service our debt and synthetic leases. Key factors that could affect our cash flows include changes in our revenue mix and profitability, as well as our ability to effectively manage our working capital, in particular, accounts receivable and inventories. Based on our current business outlook, we believe that our sources of cash will satisfy our working capital needs, capital expenditures, investment requirements, stock repurchases, contractual obligations, commitments, interest pay- ments on our Notes and other liquidity requirements associated with operations and meet our cash requirements for at least the next 12 months. However, in the event our liquidity is insufficient, we may be required to further curtail spending and implement additional cost saving measures and restructuring actions. In light of the current economic and market conditions, we cannot be certain that we will continue to generate cash flows at or above current levels or that we will be able to obtain additional financing, if necessary, on satisfactory terms, if at all. Our contractual obligations as of April 30, 2010 are summarized below in the Contractual Obligations tables. Our investment portfolio, including auction rate securities has been and will continue to be exposed to market risk due to trends in the credit and capital markets. However, we are not dependent on liquidating these investments in the next twelve months in order to meet our liquidity needs. We continue to closely monitor current economic and market events to minimize our market risk on our investment portfolio. Based on our ability to access our cash and short-term investments, our expected operating cash flows, and our other potential sources of cash, we do not anticipate that the lack of liquidity of these investments will impact our ability to fund working capital needs, capital expenditures, acquisitions or other cash requirements. We intend to and believe that we have the ability to hold these investments until the market recovers. If current market conditions deteriorate, we may be required to record additional charges to earnings in future periods. Capital Expenditure Requirements We expect to fund our capital expenditures, including our commitments related to facilities and equipment operating leases, over the next few years through existing cash, cash equivalents, investments and cash generated from operations. The timing and amount of our capital requirements cannot be precisely determined at this time and will depend on a number of factors including future demand for products, product mix, changes in the network storage industry, hiring plans and our decisions related to financing our facilities requirement. We expect that our existing facilities and those being developed in Sunnyvale, California; RTP, North Carolina; and worldwide are adequate for our requirements over at least the next two years and that additional space will be available as needed. Acquisition Related Requirements On April 6, 2010, we entered into a definitive agreement to acquire Bycast Inc. for approximately $80 million in cash. The merger was completed on May 13, 2010. 53
  • 54.
    Cash Flows As of April 30, 2010, compared to April 24, 2009, our cash and cash equivalents and short-term investments increased by $1.1 billion to $3.7 billion. The increase in cash and cash equivalents and short-term investments was primarily a result of cash provided by operating activities and issuances of common stock related to employee stock option exercises and employee stock purchase plan, partially offset by capital expenditures. We derive our liquidity and capital resources primarily from our cash flow from operations and from working capital. Days sales outstanding as of April 30, 2010 decreased to 37 days, compared to 46 days as of April 24, 2009, primarily due to improvements in shipment linearity and collections performance. Working capital increased by $0.9 billion to $2.6 billion as of April 30, 2010, compared to $1.8 billion as of April 24, 2009, primarily due to an increase in cash, cash equivalents and short-term investments of $1.1 billion. Cash Flows from Operating Activities During fiscal 2010 and 2009, we generated cash flows from operating activities of $975.0 million and $889.2 million, respectively. The primary sources of cash from operations in fiscal 2010 consisted of net income of $400.4 million, adjusted by non-cash stock-based compensation expense of $159.8 million and depreciation and amortization expense of $166.0 million. Significant changes in assets and liabilities impacting operating cash flows in fiscal 2010 included an increase in deferred revenue of $176.7 million, and an increase in accrued compensation and other current liabilities of $53.2 million. The primary sources of cash from operations in fiscal 2009 consisted of net income of $64.6 million, adjusted by non-cash stock-based compensation expense of $140.8 million, depre- ciation and amortization expense of $170.5 million and a deferred tax provision of $124.6 million. Significant changes in assets and liabilities impacting operating cash flows in fiscal 2009 included a decrease in accounts receivable of $128.7 million, an increase in deferred revenue of $219.3 million, and an increase in other current liabilities of $128.7 million related to the GSA settlement. We expect that cash provided by operating activities may fluctuate in future periods as a result of a number of factors, including fluctuations in our operating results, shipment linearity, accounts receivable collections perfor- mance, inventory and supply chain management, tax benefits from stock-based compensation, and the timing and amount of compensation and other payments. Cash Flows from Investing Activities Capital expenditures for fiscal 2010 were $135.6 million, which included the purchase of fifteen acres of land in Bangalore, India for approximately $28.5 million, compared to $289.6 million in fiscal 2009. We paid $860.3 million for net purchases and redemptions of short-term investments in fiscal 2010, compared to $116.8 million in fiscal 2009. In addition, in fiscal 2009 we reclassified $598.0 million of cash equivalents related to the Primary Fund to short-term investments. Cash Flows from Financing Activities We received $219.9 million and $696.6 million from financing activities in fiscal 2010 and 2009, respectively. Proceeds from employee equity award plans, net of shares withheld for taxes were $197.1 million in fiscal 2010, compared to $85.9 million in fiscal 2009. In fiscal 2010, we received $14.2 million from the settlement of a Note hedge with Lehman Brothers. In fiscal 2009, we issued $1.265 billion of convertible notes, received proceeds of $163.1 million for sale of related common stock warrants, and paid $254.9 million for purchase of related note hedges, made repayments of $172.6 million against our Secured Credit Agreement and the Term Loan and repurchased 17.0 million shares of common stock for a total of $400.0 million. Net proceeds from the issuance of common stock related to employee participation in employee equity award programs have historically been a significant component of our liquidity. The extent to which our employees exercise stock options or participate in our ESPP program generally increases or decreases based upon changes in the market price of our common stock. As a result, our cash flow resulting from the issuance of common stock in connection with these programs and related tax benefits will vary. 54
  • 55.
    Stock Repurchase Program At April 30, 2010, $1.1 billion remained available for future repurchases under plans approved as of that date. The stock repurchase program may be suspended or discontinued at any time. Convertible Notes As of April 30, 2010, we had $1.265 billion principal amount of 1.75% Convertible Senior Notes due 2013 (See Note 10 of the accompanying consolidated financial statements). The Notes will mature on June 1, 2013, unless earlier repurchased or converted. As of April 30, 2010, the Notes have not been repurchased or converted. We also have not received any shares under the related Note hedges or delivered cash or shares under the related warrants. Credit Facility Effective December 22, 2009, we terminated our senior unsecured credit agreement as further discussed in Note 10 of the accompanying Consolidated Financial Statements. Contractual Obligations The following summarizes our contractual obligations at April 30, 2010 and the effect such obligations are expected to have on our liquidity and cash flows in future periods (in millions): 2011 2012 2013 2014 2015 Thereafter Total Contractual Obligations: Office operating lease payments . . . . . . . . . $ 26.7 $22.3 $ 17.8 $ 15.1 $13.0 $20.4 $ 115.3 Real estate lease payments(1) . . . . . . . . . . 3.6 3.6 129.5 — — — 136.7 Less: sublease income . . . . . . . . . . . . . . . . (5.8) (0.8) (0.6) (0.4) (0.2) — (7.8) Equipment operating lease payments . . . . . 24.3 10.7 4.6 0.4 — — 40.0 Purchase commitments with contract manufacturers(2) . . . . . . . . . . . . . . . . . . 139.4 3.6 3.6 1.2 0.2 — 148.0 Other purchase obligations(3) . . . . . . . . . . 49.4 10.2 3.4 0.3 — — 63.3 1.75% Convertible notes(4) . . . . . . . . . . . . 22.1 22.1 22.1 1,276.1 — — 1,342.4 Total by period . . . . . . . . . . . . . . . . . . . $259.7 $71.7 $180.4 $1,292.7 $13.0 $20.4 $1,837.9 Uncertain tax positions(5) . . . . . . . . . . . . . 122.4 Total Contractual Obligations . . . . . . . . . $1,960.3 Other Commercial Commitments: Letters of credit . . . . . . . . . . . . . . . . . . . . . $ 4.1 $ 0.4 $ — $ — $ — $ 0.6 $ 5.1 Some of the figures we include in this table are based on management’s estimates and assumptions about these obligations, including their duration, the possibility of renewal or termination, anticipated actions by management and third parties and other factors. Because these estimates and assumptions are necessarily subjective, our actual future obligations may vary from those reflected in the table. (1) Included in real estate lease payments pursuant to four financing arrangements with BNP Paribas LLC (BNPPLC) are (i) lease commitments of $3.6 million in each of the fiscal years 2011 and 2012; and $2.4 million in fiscal 2013, which are based on either the LIBOR rate at April 30, 2010 plus a spread or a fixed rate for terms of five years, and (ii) at the expiration or termination of the lease, a supplemental payment obligation equal to our minimum guarantee of $127.1 million in the event that we elect not to purchase or arrange for sale of the buildings. (2) Contract manufacturer commitments consist of obligations for on hand inventories and non-cancelable purchase order with our contract manufacturer. We record a liability for firm, noncancelable, and nonreturnable 55
  • 56.
    purchase commitments forquantities in excess of our future demand forecasts, which is consistent with the valuation of our excess and obsolete inventory. As of April 30, 2010, the liability for these purchase commitments in excess of future demand was approximately $3.8 million and is recorded in other current liabilities. (3) Purchase obligations represent an estimate of all open purchase orders and contractual obligations in the ordinary course of business, other than commitments with contract manufacturers and suppliers, for which we have not received the goods or services. Purchase obligations do not include contracts that may be cancelled without penalty. Although open purchase orders are considered enforceable and legally binding, the terms generally allow us the option to cancel, reschedule, and adjust our requirements based on our business needs prior to the delivery of goods or performance of services. (4) Included in these amounts are obligations related to the $1.265 billion principal amount of 1.75% Notes due 2013 (see Note 10 of the accompanying consolidated financial statements). Estimated interest payments for the Notes are $77.4 million for fiscal 2011 through fiscal 2014. (5) As of April 30, 2010, our liability for uncertain tax positions was $122.4 million, which due to the uncertainty of the timing of future payments, are presented in the total column on a separate line in this table. As of April 30, 2010, we have four leasing arrangements (Leasing Arrangements 1, 2, 3 and 4) with BNPPLC which requires us to lease certain of our land to BNPPLC for a period of 99 years and to lease approximately 0.6 million square feet of office space for our headquarters in Sunnyvale, which had an original cost of $149.6 million. Under these leasing arrangements, we pay BNPPLC minimum lease payments, which vary based on LIBOR plus a spread or a fixed rate on the costs of the facilities on the respective lease commencement dates. We make payments for each of the leases for a term of five years. We have the option to renew each of the leases for two consecutive five-year periods upon approval by BNPPLC. Upon expiration (or upon any earlier termination) of the lease terms, we must elect one of the following options: (i) purchase the buildings from BNPPLC at cost; (ii) if certain conditions are met, arrange for the sale of the buildings by BNPPLC to a third party for an amount equal to at least 85% of the costs (residual guarantee), and be liable for any deficiency between the net proceeds received from the third party and such amounts; or (iii) pay BNPPLC supplemental payments for an amount equal to at least 85% of the costs (residual guarantee), in which event we may recoup some or all of such payments by arranging for a sale of each or all buildings by BNPPLC during the ensuing two-year period. The following table summarizes the costs, the residual guarantee, the applicable LIBOR plus spread or fixed rate at April 30, 2010 and the date we began to make payments for each of our leasing arrangements (in millions): LIBOR Plus Lease Leasing Residual Spread or Commencement Arrangements Cost Guarantee Fixed Rate Date Term 1 $48.5 $41.2 3.99% January 2008 5 years 2 $80.0 $68.0 1.08% December 2007 5 years 3 $10.5 $ 8.9 3.97% December 2007 5 years 4 $10.6 $ 9.0 3.99% December 2007 5 years All leases require us to maintain specified financial covenants with which we were in compliance as of April 30, 2010. Such financial covenants include a maximum ratio of Total Debt to Earnings before Interest, Taxes, Depreciation and Amortization and a minimum amount of Unencumbered Cash and Short-Term Investments. Our failure to comply with these financial covenants could result in a default under the leases which, subject to our right and ability to exercise our purchase option, would give BNPPLC the right to, among other things, (i) terminate our possession of the leased property and require us to pay lease termination damages and other amounts as set forth in the lease agreements, or (ii) exercise certain foreclosure remedies. If we were to exercise our purchase option, or be required to pay lease termination damages, these payments would significantly reduce our available liquidity, which could constrain our operating flexibility. As of April 30, 2010, we estimated that the fair value of the properties under synthetic lease was $36.9 million less than their aggregate residual guarantees. We are accruing for this deficiency over the remaining terms of the respective leases. 56
  • 57.
    We may fromtime to time terminate one or more of our leasing arrangements and repay amounts outstanding in order to meet our operating or other objectives. Legal Contingencies On September 5, 2007, we filed a patent infringement lawsuit in the Eastern District of Texas seeking compensatory damages and a permanent injunction against Sun Microsystems. On October 25, 2007, Sun Microsystems filed a counter claim against us in the Eastern District of Texas seeking compensatory damages and a permanent injunction. On October 29, 2007, Sun filed a second lawsuit against us in the Northern District of California asserting additional patents against us. The Texas court granted a joint motion to transfer the Texas lawsuit to the Northern District of California on November 26, 2007. On March 26, 2008, Sun filed a third lawsuit in federal court that extends the patent infringement charges to storage management technology we acquired in January 2008. In January 2010, Oracle acquired Sun. The three lawsuits are currently in the discovery and motion phase and no trial dates have been set, so we are unable at this time to determine the likely outcome of these various patent litigations. In addition, as we are unable to reasonably estimate the amount or range of the potential settlement, no accrual has been recorded as of April 30, 2010. In addition, we are subject to various legal proceedings and claims which have arisen or may arise in the normal course of business. While the outcome of these legal matters is currently not determinable, we do not believe that any current litigation or claims will have a material adverse effect on our business, cash flow, operating results, or financial condition. Off-Balance Sheet Arrangements During the ordinary course of business, we provide standby letters of credit or other guarantee instruments to third parties as required for certain transactions initiated either by us or our subsidiaries. As of April 30, 2010, our financial guarantees of $5.1 million that were not recorded on our balance sheet consisted of standby letters of credit related to workers’ compensation, a customs guarantee, a corporate credit card program, foreign rent guarantees and surety bonds, which were primarily related to self-insurance. We use derivative instruments to manage exposures to foreign currency risk. Our primary objective in holding derivatives is to reduce the volatility of earnings and cash flows associated with changes in foreign currency. The program is not designated for trading or speculative purposes. Currently, we do not enter into any foreign exchange forward contracts to hedge exposures related to firm commitments or nonmarketable investments. Our major foreign currency exchange exposures and related hedging programs are described below: • We utilize monthly foreign currency forward and options contracts to hedge exchange rate fluctuations related to certain foreign monetary assets and liabilities. • We use currency forward contracts to hedge exposures related to forecasted sales denominated in certain foreign currencies. These contracts are designated as cash flow hedges and in general closely match the underlying forecasted transactions in duration. As of April 30, 2010, our notional fair value of foreign exchange forward and foreign currency option contracts totaled $484.2 million. We do not believe that these derivatives present significant credit risks, because of the short term maturity of the outstanding contracts at any point in time, the counterparties to the derivatives consist of major financial institutions, and we manage the notional amount of contracts entered into with any one counterparty. Other than the risk associated with the financial condition of the counterparties, our maximum exposure related to foreign currency forward and option contracts is limited to the premiums paid. See Note 12 of the accompanying consolidated financial statements for more information related to our hedging activities. In the ordinary course of business, we enter into recourse lease financing arrangements with third-party leasing companies and from time to time provide guarantees for a portion of other financing arrangements under which we could be called upon to make payments to the third-party funding companies in the event of nonpayment by end- user customers. See Note 18 of the accompanying consolidated financial statements for more information related to these financing arrangements. 57
  • 58.
    We enter intoindemnification agreements with third parties in the ordinary course of business. Generally, these indemnification agreements require us to reimburse losses suffered by the third party due to various events, such as lawsuits arising from patent or copyright infringement. These indemnification obligations are considered off- balance sheet arrangements under accounting guidance. We have commitments related to four lease arrangements with BNPPLC for approximately 0.6 million square feet of office space for our headquarters in Sunnyvale, California (as further described above under “Contractual Obligations”). We have evaluated our accounting for these leases as required by guidance on accounting for variable interest entities and have determined the following: • BNPPLC is a leasing company for BNP Paribas in the United States. BNPPLC is not a “special purpose entity” organized for the sole purpose of facilitating the leases to us. The obligation to absorb expected losses and receive expected residual returns rests with the parent, BNP Paribas. Therefore, we are not the primary beneficiary of BNPPLC as we do not absorb the majority of BNPPLC’s expected losses or expected residual returns; and • BNPPLC has represented in the related closing agreements that the fair value of the property leased to us by BNPPLC is less than half of the total of the fair values of all assets of BNPPLC, excluding any assets of BNPPLC held within a silo. Further, the property leased to NetApp is not held within a silo. The definition of “held within a silo” means that BNPPLC has obtained funds equal to or in excess of 95% of the fair value of the leased asset to acquire or maintain its investment in such asset through nonrecourse financing or other contractual arrangements, the effect of which is to leave such asset (or proceeds thereof) as the only significant asset of BNPPLC at risk for the repayment of such funds. Accordingly, under current accounting guidance, we are not required to consolidate either the leasing entity or the specific assets that we lease under the BNPPLC lease. Our future minimum lease payments and residual guarantees under these real estate leases will amount to a total of $136.7 million as discussed in above in “Contractual Obligations”. Item 7A. Quantitative and Qualitative Disclosures About Market Risk We are exposed to market risk related to fluctuations in interest rates, market prices, and foreign currency exchange rates. We use certain derivative financial instruments to manage these risks. We do not use derivative financial instruments for speculative or trading purposes. All financial instruments are used in accordance with management-approved policies. Market Risk and Market Interest Risk Investment and Interest Income — As of April 30, 2010, we had available-for-sale investments of $2.1 billion. Our investment portfolio primarily consists of investments with original maturities at the date of purchase of greater than three months, which are classified as available-for-sale. These investments, consisting primarily of corporate bonds, commercial paper, U.S. government agency bonds, U.S. Treasuries, and certificates of deposit, are subject to interest rate and interest income risk and will decrease in value if market interest rates increase. A hypothetical 10 percent increase in market interest rates from levels at April 30, 2010 would cause the fair value of these available-for-sale investments to decline by approximately $3.6 million. Volatility in market interest rates over time will cause variability in our interest income. We do not use derivative financial instruments in our investment portfolio. Our investment policy is to limit credit exposure through diversification and investment in highly rated securities. We further mitigate concentrations of credit risk in our investments by limiting our investments in the debt securities of a single issuer and by diversifying risk across geographies and type of issuer. We actively review, along with our investment advisors, current investment ratings, company specific events and general economic conditions in managing our investments and in determining whether there is a significant decline in fair value that is other-than-temporary. We will monitor and evaluate the accounting for our investment portfolio on a quarterly basis for additional other-than-temporary impairment charges. 58
  • 59.
    We are alsoexposed to market risk relating to our auction rate securities due to uncertainties in the credit and capital markets. As of April 30, 2010, we recorded cumulative unrealized loss of $3.3 million, offset by $0.7 million of unrealized gains related to these securities. The fair value of our auction rate securities may change significantly due to events and conditions in the credit and capital markets. These securities/issuers could be subject to review for possible downgrade. Any downgrade in these credit ratings may result in an additional decline in the estimated fair value of our auction rate securities. Changes in the various assumptions used to value these securities and any increase in the markets’ perceived risk associated with such investments may also result in a decline in estimated fair value. If current market conditions deteriorate, or the anticipated recovery in market values does not occur, we may be required to record additional unrealized losses in other comprehensive income (loss) or other-than-temporary impairment charges to earnings in future quarters. We intend, and have the ability, to hold these investments until the market recovers. We do not believe that the lack of liquidity relating to our portfolio investments will impact our ability to fund working capital needs, capital expenditures or other operating requirements. See Note 9 of the accompanying consolidated financial statements in Part II, Item 8; Management’s Discussion and Analysis of Financial Condition and Results of Operations, “Liquidity and Capital Resources,” in Part II, Item 7; and Risk Factors in Part I, Item 1A of this Annual Report on Form 10-K for a description of recent market events that may affect the value and liquidity of the investments in our portfolio that we held at April 30, 2010. Lease Commitments — As of April 30, 2010, one of our four lease arrangements with BNPPLC is based on a floating interest rate. The minimum lease payments will vary based on LIBOR plus a spread. All of our leases have an initial term of five years, and we have the option to renew these leases for two consecutive five-year periods upon approval by BNPPLC. A hypothetical 10 percent increase in market interest rate from the level at April 30, 2010 would increase our lease payments on this one floating lease arrangement under the initial five-year term by an immaterial amount. We do not currently hedge against market interest rate increases. Convertible Notes — In June 2008, we issued $1.265 billion principal amount of 1.75% Notes due 2013, of which $1.017 billion was allocated to debt and $0.248 billion was allocated to equity. Holders may convert the Notes prior to maturity upon the occurrence of certain circumstances, including, but not limited to: • during the five business day period after any five consecutive trading day period in which the trading price of the Notes for each day in this five consecutive trading day period was less than 98% of an amount equal to (i) the last reported sale price of our common stock multiplied by (ii) the conversion rate on such day; • during any calendar quarter if the last reported sale price of our common stock for 20 or more trading days in a period of 30 consecutive trading days ending on the last trading day of the immediately preceding calendar quarter exceeds 130% of the applicable conversion price in effect for the Notes on the last trading day of such immediately preceding calendar quarter; or • upon the occurrence of specified corporate transactions under the indenture for the Notes. The Notes are convertible into the right to receive cash in an amount up to the principal amount and shares of our common stock for the conversion value in excess of the principal amount, if any, at an initial conversion rate of 31.4006 shares of common stock per one thousand principal amount of Notes, subject to adjustment as described in the indenture governing the Notes, which represents an initial conversion price of $31.85 per share. Upon conversion, a holder will receive cash in an amount equal to the lesser of the conversion value and the principal amount of the Notes, and any shares of our common stock for any conversion value in excess of the principal amount of the Notes. Concurrent with the issuance of the Notes, we entered into convertible note hedge transactions and separately, warrant transactions, to reduce the potential dilution from the conversion of the Notes and to mitigate any negative effect such conversion may have on the price of our common stock. In fiscal 2010, we terminated the hedge transaction with a counterparty to 20% of our Note hedges, and because we have decided not to replace the hedge, we are subject to potential dilution on the 20% unhedged portion of our Notes upon conversion if on the date of conversion the per-share market price of our common stock exceeds the conversion price of $31.85. 59
  • 60.
    As of April30, 2010, none of the conditions allowing the holders of the Notes to convert had been met and we had not issued any shares related to the Notes. Based on the closing price of our common stock of $34.67 on April 30, 2010, the if-converted value of our Notes exceeded their principal amount by approximately $112 million. The fair value of our Notes is subject to interest rate risk, market risk and other factors due to the convertible feature. Generally, the fair value of Notes will increase as interest rates fall and/or our common stock price increases, and decrease as interest rates rise and/or our common stock price decreases. The interest and market value changes affect the fair value of our Notes, but do not impact our financial position, cash flows, or results of operations due to the fixed nature of the debt obligations. We do not carry the Notes at fair value, but present the fair value of the principal amount of our Notes for disclosure purposes. As of April 30, 2010, the principal amount of our Notes, which consists of the combined debt and equity components, was $1.265 billion, and the total estimated fair value of such was $1.5 billion based on the closing trading price of $120 per $100 of our Notes as of that date. Foreign Currency Exchange Rate Risk and Foreign Exchange Forward Contracts We hedge risks associated with foreign currency transactions to minimize the impact of changes in foreign currency exchange rates on earnings. We utilize forward and option contracts to hedge against the short-term impact of foreign currency fluctuations on certain assets and liabilities denominated in foreign currencies. All balance sheet hedges are marked to market through earnings every period. We also use foreign exchange forward contracts to hedge foreign currency forecasted transactions related to forecasted sales transactions. These derivatives are designated as cash flow hedges under accounting guidance for derivatives and hedging. For cash flow hedges outstanding at April 30, 2010, the time-value component is recorded in earnings while all other gains or losses were included in other comprehensive income. We do not enter into foreign exchange contracts for speculative or trading purposes. In entering into forward and option foreign exchange contracts, we have assumed the risk that might arise from the possible inability of counterparties to meet the terms of their contracts. We attempt to limit our exposure to credit risk by executing foreign exchange contracts with creditworthy multinational commercial banks. All contracts have a maturity of less than one year. The following table provides information about our currency forward contracts outstanding on April 30, 2010 and April 24, 2009 (in millions): April 30, 2010 April 24, 2009 Notional Notional Local Contract Fair Local Contract Fair Currency Amount Value Currency Amount Value Currency Amount (USD) (USD) Amount (USD) (USD) Euro . . . . . . . . . . . . . . . . . . . . . .......... 235.9 $313.5 $313.6 126.2 $166.9 $166.9 British Pound Sterling . . . . . . . . .......... 49.7 76.0 75.9 46.6 68.2 68.3 Canadian Dollar . . . . . . . . . . . . .......... 28.6 28.1 28.1 24.7 20.5 20.5 Australian Dollar . . . . . . . . . . . .......... 25.0 23.2 23.0 34.7 24.9 24.9 Other . . . . . . . . . . . . . . . . . . . . .......... N/A 43.6 43.6 N/A 33.5 33.5 60
  • 61.
    Item 8. FinancialStatements and Supplementary Data REPORT OF INDEPENDENT REGISTERED PUBLIC ACCOUNTING FIRM To the Board of Directors and Stockholders of NetApp, Inc. Sunnyvale, California We have audited the accompanying consolidated balance sheets of NetApp, Inc. and subsidiaries (collectively, the “Company”) as of April 30, 2010 and April 24, 2009, and the related consolidated statements of operations, cash flows, and stockholders’ equity and comprehensive income for each of the three years in the period ended April 30, 2010. Our audits also included the financial statement schedule listed in Item 15. These consolidated financial statements and financial statement schedule are the responsibility of the Company’s management. Our respon- sibility is to express an opinion on the consolidated financial statements and financial statement schedule based on our audits. We conducted our audits in accordance with the standards of the Public Company Accounting Oversight Board (United States). Those standards require that we plan and perform the audit to obtain reasonable assurance about whether the financial statements are free of material misstatement. An audit includes examining, on a test basis, evidence supporting the amounts and disclosures in the financial statements. An audit also includes assessing the accounting principles used and significant estimates made by management, as well as evaluating the overall financial statement presentation. We believe that our audits provide a reasonable basis for our opinion. In our opinion, such consolidated financial statements present fairly, in all material respects, the financial position of the Company as of April 30, 2010 and April 24, 2009, and the results of its operations and its cash flows for each of the three years in the period ended April 30, 2010, in conformity with accounting principles generally accepted in the United States of America. Also, in our opinion, such financial statement schedule, when considered in relation to the basic consolidated financial statements taken as a whole, presents fairly, in all material respects, the information set forth therein. We have also audited, in accordance with the standards of the Public Company Accounting Oversight Board (United States), the Company’s internal control over financial reporting as of April 30, 2010, based on the criteria established in Internal Control — Integrated Framework issued by the Committee of Sponsoring Organizations of the Treadway Commission and our report dated June 18, 2010 expressed an unqualified opinion on the Company’s internal control over financial reporting. /s/ DELOITTE & TOUCHE LLP San Jose, California June 18, 2010 61
  • 62.
    NETAPP, INC. CONSOLIDATED BALANCE SHEETS April 30, April 24, 2010 2009 (In millions, except par value) ASSETS Current Assets: Cash and cash equivalents . . . . . . . . . . . . . . . . . . . . . . . . . . . . . . . . . . . . . . . . . . . $ 1,705.0 $ 1,494.2 Short-term investments . . . . . . . . . . . . . . . . . . . . . . . . . . . . . . . . . . . . . . . . . . . . . 2,019.0 1,110.1 Accounts receivable, net of allowances of $1.6 million and $3.1 million at April 30, 2010 and April 24, 2009, respectively . . . . . . . . . . . . . . . . . . . . . . . . . 471.5 446.5 Inventories . . . . . . . . . . . . . . . . . . . . . . . . . . . . . . . . . . . . . . . . . . . . . . . . . . . . . . 112.9 61.1 Other current assets . . . . . . . . . . . . . . . . . . . . . . . . . . . . . . . . . . . . . . . . . . . . . . . . 228.7 326.9 Total current assets . . . . . . . . . . . . . . . . . . . . . . . . . . . . . . . . . . . . . . . . . . . . . . 4,537.1 3,438.8 Property and Equipment, Net . . . . . . . . . . . . . . . . . . . . . . . . . . . . . . . . . . . . . . . . . 804.4 807.9 Goodwill . . . . . . . . . . . . . . . . . . . . . . . . . . . . . . . . . . . . . . . . . . . . . . . . . . . . . . . . . 681.0 681.0 Other Intangible Assets, Net . . . . . . . . . . . . . . . . . . . . . . . . . . . . . . . . . . . . . . . . . . 25.1 45.7 Long-Term Investments and Restricted Cash . . . . . . . . . . . . . . . . . . . . . . . . . . . . . 72.8 127.3 Other Non-Current Assets. . . . . . . . . . . . . . . . . . . . . . . . . . . . . . . . . . . . . . . . . . . . 374.0 283.7 $ 6,494.4 $ 5,384.4 LIABILITIES AND STOCKHOLDERS’ EQUITY Current Liabilities: Accounts payable . . . . . . . . . . . . . . . . . . . . . . . . . . . . . . . . . . . . . . . . . . . . . . . . . $ 184.6 $ 137.8 Accrued compensation and related benefits. . . . . . . . . . . . . . . . . . . . . . . . . . . . . . . 379.1 204.2 Other current liabilities . . . . . . . . . . . . . . . . . . . . . . . . . . . . . . . . . . . . . . . . . . . . . 212.2 323.7 Short-term deferred revenue . . . . . . . . . . . . . . . . . . . . . . . . . . . . . . . . . . . . . . . . . . 1,135.1 1,013.6 Total current liabilities . . . . . . . . . . . . . . . . . . . . . . . . . . . . . . . . . . . . . . . . . . . . 1,911.0 1,679.3 1.75% Convertible Senior Notes Due 2013 . . . . . . . . . . . . . . . . . . . . . . . . . . . . . . . 1,101.5 1,054.7 Other Long-Term Liabilities . . . . . . . . . . . . . . . . . . . . . . . . . . . . . . . . . . . . . . . . . . 171.9 164.6 Long-Term Deferred Revenue . . . . . . . . . . . . . . . . . . . . . . . . . . . . . . . . . . . . . . . . . 779.5 701.6 3,963.9 3,600.2 Commitments and Contingencies (Note 18) Stockholders’ Equity: Preferred stock, $0.001 par value, 5.0 shares authorized; no shares issued or outstanding in 2010 and 2009. . . . . . . . . . . . . . . . . . . . . . . . . . . . . . . . . . . . . . . — — Common stock, $0.001 par value, 885.0 shares authorized; 451.6 and 436.6 shares issued at April 30, 2010 and April 24, 2009 . . . . . . . . . . . . . . . . . . . . . . . . . . . . 0.5 0.4 Additional paid-in capital. . . . . . . . . . . . . . . . . . . . . . . . . . . . . . . . . . . . . . . . . . . . 3,453.7 3,115.9 Treasury stock at cost (104.3 shares at April 30, 2010 and April 24, 2009) . . . . . . . (2,927.4) (2,927.4) Retained earnings . . . . . . . . . . . . . . . . . . . . . . . . . . . . . . . . . . . . . . . . . . . . . . . . . 2,000.9 1,600.5 Accumulated other comprehensive income (loss) . . . . . . . . . . . . . . . . . . . . . . . . . . 2.8 (5.2) Total stockholders’ equity . . . . . . . . . . . . . . . . . . . . . . . . . . . . . . . . . . . . . . . . . 2,530.5 1,784.2 $ 6,494.4 $ 5,384.4 See notes to consolidated financial statements. 62
  • 63.
    NETAPP, INC. CONSOLIDATED STATEMENTS OF OPERATIONS Year Ended April 30, April 24, April 25, 2010 2009 2008 (In millions, except per share amounts) Revenues: Product . . . . . . . . . . . . . . . . . . . . . . . . . . . . . . . . . . . . . . . . . . . . . . . . . $2,381.1 $2,152.7 $2,242.5 Software entitlements and maintenance. . . . . . . . . . . . .............. 679.8 618.3 486.9 Service . . . . . . . . . . . . . . . . . . . . . . . . . . . . . . . . . . . .............. 870.5 764.1 573.8 GSA settlement . . . . . . . . . . . . . . . . . . . . . . . . . . . . . .............. — (128.7) — Net revenues . . . . . . . . . . . . . . . . . . . . . . . . . . . . . . . . . . . . . . . . . . . 3,931.4 3,406.4 3,303.2 Cost of Revenues: Cost of product . . . . . . . . . . . . . . . . . . . . . . . . . . . . . . . . . . . . . . . . . . . 976.4 1,007.6 938.4 Cost of software entitlements and maintenance . . . . . . . . . . . . . . . . . . . . 12.3 9.2 8.6 Cost of service . . . . . . . . . . . . . . . . . . . . . . . . . . . . . . . . . . . . . . . . . . . 423.5 399.7 342.8 Total cost of revenues. . . . . . . . . . . . . . . . . . . . . . . . . . . . . . . . . . . . . 1,412.2 1,416.5 1,289.8 Gross profit . . . . . . . . . . . . . . . . . . . . . . . . . . . . . . . . . . . . . . . . . . . . . . 2,519.2 1,989.9 2,013.4 Operating Expenses: Sales and marketing . . . . . . . . . . . . . . . . . . . . . . . . . . .............. 1,293.7 1,186.1 1,075.7 Research and development . . . . . . . . . . . . . . . . . . . . . .............. 535.7 498.5 452.2 General and administrative . . . . . . . . . . . . . . . . . . . . . .............. 238.8 203.7 171.5 Restructuring and other charges . . . . . . . . . . . . . . . . . .............. 2.5 54.4 0.4 Acquisition related income, net . . . . . . . . . . . . . . . . . .............. (39.9) — — Total operating expenses. . . . . . . . . . . . . . . . . . . . . .............. 2,030.8 1,942.7 1,699.8 Income from Operations . . . . . . . . . . . . . . . . . . . . . . . .............. 488.4 47.2 313.6 Other Income (Expenses), Net: Interest income . . . . . . . . . . . . . . . . . . . . . . . . . . . . . .............. 31.2 57.6 64.6 Interest expense . . . . . . . . . . . . . . . . . . . . . . . . . . . . . .............. (74.1) (63.4) (8.0) Other income (expenses), net . . . . . . . . . . . . . . . . . . . .............. 1.5 (33.1) 12.5 Total other income (expenses), net . . . . . . . . . . . . . . . . . . . . . . . . . . . (41.4) (38.9) 69.1 Income before Income Taxes . . . . . . . . . . . . . . . . . . . . . . . . . . . . . . . . . . 447.0 8.3 382.7 Provision for (Benefit from) Income Taxes . . . . . . . . . . . . . . . . . . . . . . . 46.6 (56.3) 73.0 Net Income . . . . . . . . . . . . . . . . . . . . . . . . . . . . . . . . . . . . . . . . . . . . . . . $ 400.4 $ 64.6 $ 309.7 Net Income Per Share: Basic . . . . . . . . . . . . . . . . . . . . . . . . . . . . . . . . . . . . . . . . . . . . . . . . . . . $ 1.18 $ 0.20 $ 0.88 Diluted . . . . . . . . . . . . . . . . . . . . . . . . . . . . . . . . . . . . . . . . . . . . . . . . . $ 1.13 $ 0.19 $ 0.86 Shares Used in Net Income per Share Calculations: Basic . . . . . . . . . . . . . . . . . . . . . . . . . . . . . . . . . . . . . . . . . . . . . . . . . . . 339.6 330.3 351.7 Diluted . . . . . . . . . . . . . . . . . . . . . . . . . . . . . . . . . . . . . . . . . . . . . . . . . 353.2 334.6 361.1 See notes to consolidated financial statements. 63
  • 64.
    NETAPP, INC. CONSOLIDATED STATEMENTS OF CASH FLOWS Year Ended April 30, April 24, April 25, 2010 2009 2008 (In millions) Cash Flows from Operating Activities: Net income . . . . . . . . . . . . . . . . . . . . . . . . . . . . . . . . . . . . . . . . . . ....... $ 400.4 $ 64.6 $ 309.7 Adjustments to reconcile net income to net cash provided by operating activities: Depreciation and amortization . . . . . . . . . . . . . . . . . . . . . . . . . . . . . . . . . . 166.0 170.5 148.1 Stock-based compensation . . . . . . . . . . . . . . . . . . . . . . . . . . . . . . . . . . . . . 159.8 140.8 148.0 Accretion of discount and issuance costs on notes . . . . . . . . . . . . . . . . . . . . 50.8 41.0 — Deferred income taxes . . . . . . . . . . . . . . . . . . . . . . . . . . . . . . . . . . . . . . . (11.3) (124.6) (53.0) Tax benefit (charges) from stock-based compensation . . . . . . . . . . . . . . . . . . (0.9) 45.4 48.2 Excess tax benefit from stock-based compensation . . . . . . . . . . . . . . . . . . . . (8.6) (36.7) (45.4) Other non-cash items, net . . . . . . . . . . . . . . . . . . . . . . . . . . . . . . . . . . . . . 9.7 57.8 (10.0) Changes in assets and liabilities: Accounts receivable . . . . . . . . . . . . . . . . . . . . . . . . . . . . . . . . . . . . . . . . . (21.3) 128.7 (27.7) Inventories . . . . . . . . . . . . . . . . . . . . . . . . . . . . . . . . . . . . . . . . . . . . . . . . (52.1) 9.1 (15.4) Other operating assets . . . . . . . . . . . . . . . . . . . . . . . . . . . . . . . . . . . . . . . . (36.8) (0.8) (7.6) Accounts payable . . . . . . . . . . . . . . . . . . . . . . . . . . . . . . . . . . . . . . . . . . . 42.7 (27.0) 20.0 Accrued compensation and other current liabilities . . . . . . . . . . . . . . . . . . . . 53.2 190.5 (24.5) Deferred revenue . . . . . . . . . . . . . . . . . . . . . . . . . . . . . . . . . . . . . . . . . . . 176.7 219.3 401.0 Other operating liabilities . . . . . . . . . . . . . . . . . . . . . . . . . . . . . . . . . . . . . 46.7 10.6 117.5 Net cash provided by operating activities . . . . . . . . . . . . . . . . . . . . . . . . . 975.0 889.2 1,008.9 Cash Flows from Investing Activities: Purchases of investments . . . . . . . . . . . . . . . . . . ................. . . . (2,632.6) (1,152.5) (1,053.5) Redemptions of investments . . . . . . . . . . . . . . . . ................. . . . 1,772.3 1,035.7 1,429.9 Reclassification from cash and cash equivalents to short-term investments . . . . — (598.0) — Purchases of property and equipment . . . . . . . . . ................. . . . (135.6) (289.6) (188.3) Acquisition of businesses, net of cash acquired . . ................. . . . — — (99.4) Other investing activities, net . . . . . . . . . . . . . . . ................. . . . 8.2 1.1 14.2 Net cash provided by (used in) investing activities . . . . . . . . . . . . . . . . . . (987.7) (1,003.3) 102.9 Cash Flows from Financing Activities: Issuance of common stock . . . . . . . . . . . . . . . . . . . . . . . . . . . . . . . . . . . . . 197.1 85.9 108.7 Repurchases of common stock . . . . . . . . . . . . . . . . . . . . . . . . . . . . . . . . . . — (400.0) (903.7) Excess tax benefit from stock-based compensation . . . . . . . . . . . . . . . . . . . . 8.6 36.7 45.4 Issuance of long-term debt. . . . . . . . . . . . . . . . . . . . . . . . . . . . . . . . . . . . . — 1,238.4 318.7 Sale of common stock warrants . . . . . . . . . . . . . . . . . . . . . . . . . . . . . . . . . — 163.1 — Settlement (purchase) of note hedge . . . . . . . . . . . . . . . . . . . . . . . . . . . . . . 14.2 (254.9) — Repayment of long-term debt . . . . . . . . . . . . . . . . . . . . . . . . . . . . . . . . . . . — (172.6) (231.5) Net cash provided (used in) by financing activities . . . . . . . . . . . . . . . . . . 219.9 696.6 (662.4) Effect of Exchange Rate Changes on Cash and Cash Equivalents. . . . . . . . . . . 3.6 (24.8) (2.0) Net Increase in Cash and Cash Equivalents . . . . . . . . . . . . . . . . . . . . . . . . . . 210.8 557.7 447.4 Cash and Cash Equivalents: Beginning of year . . . . . . . . . . . . . . . . . . . . . . . . . . . . . . . . . . . . . . . . . . . . 1,494.2 936.5 489.1 End of year . . . . . . . . . . . . . . . . . . . . . . . . . . . . . . . . . . . . . . . . . . . . . . . . . $ 1,705.0 $ 1,494.2 $ 936.5 See notes to consolidated financial statements. 64
  • 65.
    NETAPP, INC. CONSOLIDATED STATEMENTS OF STOCKHOLDERS’ EQUITY AND COMPREHENSIVE INCOME Common Stock Treasury Stock Accumulated Additional Other Paid-in Treasury Retained Comprehensive Shares Amount Capital Shares Amount Earnings Income (Loss) Total (In millions) Balances, April 27, 2007 . . . . . . . . . . . . . . 421.6 $0.4 $2,380.6 (54.6) $(1,623.7) $1,226.2 $ 5.5 $1,989.0 Components of comprehensive income: Net income . . . . . . . . . . . . . . . . . . . . . . — — — — — 309.7 — 309.7 Currency translation adjustment . . . . . . . . — — — — — — 1.1 1.1 Unrealized gain on investments, net . . . . . — — — — — — (7.7) (7.7) Unrealized gain on derivatives . . . . . . . . . — — — — — — 1.9 1.9 Total comprehensive income . . . . . . . . — — — — — — — 305.0 Issuance of common stock, net of taxes . . . . 7.5 — 108.7 — — — — 108.7 Repurchase of common stock . . . . . . . . . . . — — — (32.8) (903.7) — — (903.7) Stock-based compensation expense . . . . . . . — — 147.9 — — — — 147.9 Stock-based compensation related to acquisition. . . . . . . . . . . . . . . . . . . . . . . — — 5.2 — — — — 5.2 Income tax benefit from employee stock transactions . . . . . . . . . . . . . . . . . . . . . . — — 48.2 — — — — 48.2 Balances, April 25, 2008 . . . . . . . . . . . . . . 429.1 0.4 2,690.6 (87.4) (2,527.4) 1,535.9 0.8 1,700.3 Components of comprehensive income: Net income . . . . . . . . . . . . . . . . . . . . . . — — — — — 64.6 — 64.6 Currency translation adjustment . . . . . . . . — — — — — — (4.8) (4.8) Unrealized gain on investments, net . . . . . — — — — — (2.0) (2.0) Unrealized gain on derivatives . . . . . . . . . — — — — — — 0.8 0.8 Total comprehensive income . . . . . . . . — — — — — — — 58.6 Issuance of common stock, net of taxes . . . . 7.5 — 85.9 — — — — 85.9 Repurchase of common stock . . . . . . . . . . . — — — (16.9) (400.0) — — (400.0) Purchase of note hedges . . . . . . . . . . . . . . . — — (254.9) — — — — (254.9) Sale of common stock warrants . . . . . . . . . . — — 163.1 — — — — 163.1 Convertible debt discount . . . . . . . . . . . . . . — — 248.0 — — — — 248.0 Issuance costs related to equity component of convertible notes . . . . . . . . . . . . . . . . — — (5.2) — — — — (5.2) Net tax effect of issuance costs related to convertible notes . . . . . . . . . . . . . . . . . . — — 2.2 — — — — 2.2 Stock-based compensation expense . . . . . . . — — 140.8 — — — — 140.8 Income tax benefit from employee stock transactions . . . . . . . . . . . . . . . . . . . . . . — — 45.4 — — — — 45.4 Balances, April 24, 2009 . . . . . . . . . . . . . . 436.6 0.4 3,115.9 (104.3) (2,927.4) 1,600.5 (5.2) 1,784.2 Components of comprehensive income: Net income . . . . . . . . . . . . . . . . . . . . . . — — — — — 400.4 — 400.4 Currency translation adjustment . . . . . . . . — — — — — — 1.5 1.5 Unrealized gain on investments, net . . . . . — — — — — — 5.3 5.3 Unrealized gain on derivatives . . . . . . . . . — — — — — — 1.2 1.2 Total comprehensive income . . . . . . . . — — — — — 408.4 Issuance of common stock, net of taxes . . . . 15.0 0.1 197.0 — — — — 197.1 Stock-based compensation expense . . . . . . . — — 159.6 — — — — 159.6 Income tax charge from employee stock transactions . . . . . . . . . . . . . . . . . . . . . . — — (0.9) — — — — (0.9) Settlement of note hedge . . . . . . . . . . . . . . — — 14.2 — — — — 14.2 Taxes on settlement of note hedge . . . . . . . . — (32.1) — — — — (32.1) Balances, April 30, 2010 . . . . . . . . . . . . . . 451.6 $0.5 $3,453.7 (104.3) $(2,927.4) $2,000.9 $ 2.8 $2,530.5 See notes to consolidated financial statements. 65
  • 66.
    NETAPP, INC. NOTES TO CONSOLIDATED FINANCIAL STATEMENTS 1. The Company Based in Sunnyvale, California, NetApp, Inc. (“we” or “the Company”) was incorporated in California in April 1992 and reincorporated in Delaware in November 2001; in March 2008, the Company changed its name from Network Appliance, Inc. to NetApp, Inc. The Company is a supplier of enterprise storage and data management software and hardware products and services. Our solutions help global enterprises meet major information technology challenges such as managing storage growth, assuring secure and timely information access, protecting data and controlling costs by providing innovative solutions that simplify the complexity associated with managing corporate data. 2. Significant Accounting Policies Fiscal Year — We operate on a 52-week or 53-week year ending on the last Friday in April. Fiscal 2010 was a 53-week fiscal year and fiscal 2009 and 2008 were 52-week fiscal years. Basis of Presentation — The consolidated financial statements include the Company and its wholly-owned subsidiaries. Intercompany accounts and transactions are eliminated in consolidation. Financial Statements Presentation — Certain prior period amounts have been combined in the accompanying financial statements to conform to current year presentation. Retrospective Application of Accounting Standard to Previously Issued Financial Statements — In May 2008, the Financial Accounting Standards Board (FASB) issued updated guidance which required that the liability and equity components of convertible debt instruments that may be settled in cash upon conversion (including partial cash settlement) be separately accounted for in a manner that reflects an issuer’s non-convertible debt borrowing rate. The guidance applied to the $1.265 billion aggregate principal amount of 1.75% Convertible Senior Notes (the Notes) and was adopted by us on a retrospective basis as of April 24, 2009 and for the fiscal year then ended. Use of Estimates — The preparation of the consolidated financial statements in conformity with accounting principles generally accepted in the United States of America (GAAP) requires management to make estimates and assumptions that affect the reported amounts of assets and liabilities and disclosure of contingent assets and liabilities at the date of the financial statements and the reported amounts of revenues and expenses during the reporting period. Such estimates include, but are not limited to, revenue recognition, reserve and allowances; inventory valuation and purchase order accruals; valuation of goodwill and intangibles; restructuring reserves; product warranties; self-insurance; stock-based compensation; loss contingencies; investment impairments; income taxes, and fair value measurements. Actual results could differ from those estimates. Financial Instruments — For certain financial instruments, including cash and cash equivalents, short-term investments, accounts receivable, accounts payable and other current liabilities, the carrying amounts approximate their fair value due to the relatively short maturity of these balances. The following methods were used to estimate the fair value of each class of financial instruments for which it is practicable to estimate that value: Cash and Cash Equivalents — We consider all highly liquid debt investments with original maturities of three months or less at time of purchase to be cash equivalents. Cash equivalents consist primarily of money market funds, for which the carrying amounts are reasonable estimates of fair value. Cash equivalents are recognized at fair value. Short-Term Investments. Short-term investments consist of marketable debt or equity securities which are classified as available-for-sale and are recognized at fair value. The determination of fair value is further detailed in Note 9 of the accompanying consolidated financial statements. We regularly review our investment portfolio to identify and evaluate investments that have indications of possible impairment. Factors considered in determining whether a loss is other-than-temporary include: the length of time and extent to which the fair market value has been lower than the cost basis, the financial condition and near-term prospects of the investee, credit quality, likelihood of recovery, and our intent and ability to hold the investment for a period of time sufficient to allow for any anticipated 66
  • 67.
    NETAPP, INC. NOTES TO CONSOLIDATED FINANCIAL STATEMENTS — (Continued) recovery in fair market value. We classify our investments as current or noncurrent based on the nature of the investments and their availability for use in current operations. Unrealized gains and temporary losses, net of related taxes, are included with accumulated other compre- hensive income (loss) (AOCI). Upon realization, those amounts are reclassified from AOCI to results of operations. The amortization of premiums and discounts on the investments and realized gains and losses related to investments are included in results of operations. Other-than-temporary impairments on available-for-sale debt securities are determined to be either credit losses or losses due to other factors. Credit losses are recognized in our results of operations and other losses are included in AOCI. Investments in Privately-held Companies — We have certain investments in privately-held companies, which we account for under the cost method, subject to periodic reviews for impairment. Fair Value Measurements and Impairments — All of our available-for-sale investments and nonmarketable equity securities are subject to a periodic impairment review. Investments are considered to be impaired when a decline in fair value is judged to be other-than-temporary. This determination requires significant judgment. For publicly traded investments, impairment is determined based upon the specific facts and circumstances present at the time, including factors such as current economic and market conditions, the credit rating of the security’s issuer, the length of time an investment’s fair value has been below our carrying value, the extent to which fair value was below cost, and our ability and intent to hold investments for a period of time sufficient to allow for anticipated recovery in value. If an investment’s decline in fair value, caused by factors other than changes in interest rates, is deemed to be other-than-temporary, we reduce its carrying value to its estimated fair value, as determined based on quoted market prices or liquidation values. Declines in value judged to be other-than-tempo- rary, if any, are recorded in operations as incurred. For long-term investments, such as auction rate securities, impairment is determined based on fair value and marketability of these investments. The valuation models we used to estimate fair value included numerous assumptions such as assessments of the underlying structure of each security, expected cash flows, discount rates, credit ratings, workout periods, and overall capital market liquidity. For nonmarketable investments, impairment is based on the most recent information available to us, including new financings or estimates of current fair value, as well as through traditional valuation techniques. It is our policy to review the fair value of these investments on a regular basis to determine whether the investments in these companies are other-than-temporarily impaired. In the case of privately-held companies, this evaluation is based on information that we request from these companies. If we believe the carrying value of an investment is in excess of fair value, and this difference is other-than-temporary, it is our policy to write down the investment to fair value. Inventories — Inventories are stated at the lower of cost or market, which approximates actual cost on a first-in, first out basis. We write down for excess and obsolete inventory based on the difference between the cost of inventory and the estimated fair value based upon assumptions about future demand and market conditions. In addition, we record a liability for firm, noncancelable, and unconditional purchase commitments with contract manufacturers and suppliers for quantities in excess of our future demand forecasts consistent with our valuation of excess and obsolete inventory. 67
  • 68.
    NETAPP, INC. NOTES TO CONSOLIDATED FINANCIAL STATEMENTS — (Continued) Property and Equipment — Property and equipment are recorded at cost. Depreciation and amortization is computed using the straight-line method, generally over the following periods: Depreciation Life (years) Buildings . . . . . . . . . . . . . . . . . . . . . . . . . . . . . . . . . 40 years Building improvements . . . . . . . . . . . . . . . . . . . . . . . 10 years Furniture and fixtures . . . . . . . . . . . . . . . . . . . . . . . . 5 years Computer, production, engineering, and other equipment and purchased software . . . . . . . . . . . . 3 to 5 years Leasehold improvements. . . . . . . . . . . . . . . . . . . . . . Shorter of remaining lease term or useful life Construction in progress will be amortized over the estimated useful lives of the respective assets when they are ready for their intended use. Software Development Costs — The costs for the development of new software products and substantial enhancements to existing software products are expensed as incurred until technological feasibility has been established, at which time any additional costs would be capitalized in accordance with the accounting guidance for software. Because our current process for developing software is essentially completed concurrently with the establishment of technological feasibility, which occurs upon the completion of a working model, no costs have been capitalized for any of the periods presented. Sales and Value Added Taxes — Taxes collected from customers and remitted to governmental authorities are presented on a net basis in the accompanying consolidated statements of operations. Goodwill and Purchased Intangible Assets — Goodwill is recorded when the consideration paid for an acquisition exceeds the fair value of net tangible and intangible assets acquired. Acquisition-related intangible assets are amortized on a straight-line basis over their economic lives of five years for patents, four to five years for existing technology, two to eight years for customer relationships and two to seven years for trademarks and tradenames as we believe this method would most closely reflect the pattern in which the economic benefits of the assets will be consumed. Goodwill is measured and tested for impairment on an annual basis in the fourth quarter of our fiscal year or more frequently if we believe indicators of impairment exist. Triggering events for impairment reviews may be indicators such as adverse industry or economic trends, restructuring actions, lower projections of profitability, or a sustained decline in our market capitalization. The performance of the test involves a two-step process. The first step requires comparing the fair value of the each of our reporting units to its net book value, including goodwill. We have three reporting units, the fair value of which is determined based on an allocation of our entity level market capitalization, as determined through quoted market prices. A potential impairment exists if the fair value of the reporting unit is lower than its net book value. The second step of the process is only performed if a potential impairment exists, and it involves determining the difference between the fair value of the reporting unit’s net assets other than goodwill to the fair value of the reporting unit and if the difference is less than the net book value of goodwill, an impairment exists and is recorded. We have not been required to perform this second step of the process because the fair value of our reporting units has exceeded the net book value at every measurement date. Impairment of Long-Lived Assets — We review the carrying values of long-lived assets whenever events and circumstances, such as reductions in demand, lower projections of profitability, significant changes in the manner of our use of acquired assets, or significant negative industry or economic trends, indicate that the net book value of an asset may not be recovered through expected future cash flows from its use and eventual disposition. If this review indicates that there is an impairment, the impaired asset is written down to its fair value, which is typically calculated using: (i) quoted market prices and/or (ii) discounted expected future cash flows utilizing a discount rate. Our estimates regarding future anticipated net revenue and cash flows, the remaining economic life of the products and technologies, or both, may differ from those used to assess the recoverability of assets. In that event, impairment 68
  • 69.
    NETAPP, INC. NOTES TO CONSOLIDATED FINANCIAL STATEMENTS — (Continued) charges or shortened useful lives of certain long-lived assets may be required, resulting in a reduction in net income or an increase to net loss in the period when such determinations are made. Derivative Instruments — Derivatives that are not designated as hedges are adjusted to fair value through earnings. If the derivative is designated as a hedge, depending on the nature of the exposure being hedged, changes in fair value will either be offset against the change in fair value of the hedged items through earnings or recognized in AOCI until the hedged item is recognized in earnings. The ineffective portion of the hedge is recognized in earnings immediately. As a result of our significant international operations, we are subject to risks associated with fluctuating exchange rates. We use derivative financial instruments, principally currency forward contracts and currency options, to attempt to minimize the impact of exchange rate movements on our balance sheet and operating results. Factors that could have an impact on the effectiveness of our hedging program include the accuracy of forecasts and the volatility of foreign currency markets. These programs reduce, but do not always entirely eliminate, the impact of currency exchange movements. The maturities of these instruments are generally less than one year. Currently, we do not enter into any foreign exchange forward contracts to hedge exposures related to firm commitments or nonmarketable investments. Cash flows from our derivative programs are included under operating activities in the consolidated statement of cash flows with the exception of cash flows from the derivatives used to hedge the convertible notes issued June 10, 2008. The cash flows related to the Note hedges are included under financing activities. Residual Guarantees — We record liabilities in other accrued liabilities for the fair value of residual guarantees relating to certain properties under our synthetic leases. In the event that the fair values of the properties, as determined by appraisals, are below the residual guarantees, we accrue for the deficiencies over the remaining term of the respective leases. Revenue Recognition — We apply the provisions of the accounting guidance for software revenue recognition to our product sales, both hardware and software, because our software is essential to the performance of our hardware. We recognize revenue when: • Persuasive evidence of an arrangement exists: It is our customary practice to have a purchase order and/or contract prior to recognizing revenue on an arrangement from our end users, customers, value-added resellers, or distributors. • Delivery has occurred: Our product is physically delivered to our customers, generally with standard transfer terms such as FOB origin. We typically do not allow for restocking rights with any of our value- added resellers or distributors. Products shipped with acceptance criteria or return rights are not recognized as revenue until all criteria are achieved. If undelivered products or services exist that are essential to the functionality of the delivered product in an arrangement, delivery is not considered to have occurred. • The fee is fixed or determinable: Arrangements with payment terms extending beyond our standard terms, conditions and practices are not considered to be fixed or determinable. Revenue from such arrangements is recognized at the earlier of customer payment or when the fees become due and payable. We typically do not allow for price-protection rights with any of our value-added resellers or distributors. • Collection is probable: If there is considerable doubt surrounding the credit worthiness of a customer at the outset of an arrangement, the associated revenue is deferred and recognized upon cash receipt. Our multiple element arrangements include our systems and one or more of the following undelivered software-related elements: software entitlements and maintenance, premium hardware maintenance, and storage review services. Our software entitlements and maintenance entitle our customers to receive unspecified product upgrades and enhancements on a when-and-if-available basis, bug fixes, and patch releases. Premium hardware maintenance services include contracts for technical support and minimum response times. Revenues from software 69
  • 70.
    NETAPP, INC. NOTES TO CONSOLIDATED FINANCIAL STATEMENTS — (Continued) entitlements and maintenance, premium hardware maintenance services and storage review services are recognized ratably over the contractual term, generally from one to three years. We also offer extended service contracts (which extend our standard parts warranty and may include premium hardware maintenance) at the end of the warranty term; revenues from these contracts are recognized ratably over the contract term. We typically sell professional services separately from any of our other revenue elements, either on a time and materials basis or for fixed price standard projects; we recognize revenue for these services as they are performed. Revenue from hardware installation services is recognized in the period the services are delivered. For arrangements with multiple elements, we recognize as revenue the difference between the total arrangement price and the greater of fair value or stated price for any undelivered elements (“the residual method”). For our undelivered software-related elements, we determine fair value of these undelivered elements based on vendor-specific objective evidence (“VSOE”) of fair value, which for us consists of the prices charged when these services are sold separately. To determine the fair value of these elements, we analyze both the selling prices when elements are sold separately as well as the concentrations of those prices. We believe those concentrations have been sufficient to enable us to establish VSOE of fair value for the undelivered elements. If VSOE cannot be obtained to establish fair value of the undelivered elements, it is required that revenue from the entire arrangement be initially deferred and recognized ratably over the period these elements are delivered. For purposes of presentation in the statement of operations, once fair value has been determined for our undelivered bundled elements, we allocate revenue first to software entitlements and maintenance, based on VSOE of its fair value with the remainder allocated to other service revenues. We record reductions to revenue for estimated sales returns at the time of shipment. Sales returns are estimated based on historical sales returns, current trends, and our expectations regarding future experience. We monitor and analyze the accuracy of sales returns estimates by reviewing actual returns and adjust them for future expectations to determine the adequacy of our current and future reserve needs. If actual future returns and allowances differ from past experience, additional allowances may be required. Product Warranties — Estimated future warranty costs are expensed as a cost of product revenues when revenue is recognized, based on estimates of the costs that may be incurred under our warranty obligations including material, distribution and labor costs. Our accrued liability for estimated future warranty costs is included in other accrued liabilities and other long-term obligations on the accompanying consolidated balance sheets. Factors that affect our warranty liability include the number of installed units, estimated material costs, estimated distribution costs and estimated labor costs. We periodically assess the adequacy of our warranty accrual and adjust the amount as considered necessary. Foreign Currency Translation — For subsidiaries whose functional currency is the local currency, gains and losses resulting from translation of these foreign currency financial statements into U.S. dollars are recorded in AOCI. For subsidiaries where the functional currency is the U.S. dollar, gains and losses resulting from the process of remeasuring foreign currency financial statements into U.S. dollars are included in other income (expenses), net. Stock-Based Compensation — We measure and recognize stock-based compensation expense for all stock- based awards, including employee stock options, restricted stock units and rights to purchase shares under our ESPP, based on their estimated fair value, and recognize the costs in our financial statements over the employees’ requisite service period. The fair value of employee restricted stock units is equal to the market value of our common stock on the date the award is granted. Calculating the fair value of employee stock options and the rights to purchase shares under the ESPP requires estimates and significant judgment. The fair value of each option grant is estimated on the date of grant using the Black-Scholes option pricing model, and is not remeasured as a result of subsequent stock price fluctuations. Option-pricing models require the input of highly subjective assumptions, including the expected term of options, and the expected price volatility of the stock underlying such options. Our expected term assumption is based primarily on historical exercise and post-vesting forfeiture experience. Our stock price volatility assumption 70
  • 71.
    NETAPP, INC. NOTES TO CONSOLIDATED FINANCIAL STATEMENTS — (Continued) is based on an implied volatility of call options and dealer quotes on call options, generally having a term of greater than twelve months. The risk-free interest rate is based upon United States Treasury bills with equivalent expected terms, and the expected dividend is based on our history and expected dividend payouts. Changes in the subjective assumptions required in the valuation models may significantly affect the estimated value of our stock-based awards and the related stock-based compensation expense. Likewise, the shortening of the contractual life of our options could change the estimated exercise behavior in a manner other than currently expected. In addition, we estimate the number of stock-based awards that will be forfeited due to employee turnover. Our forfeiture assumption is based primarily on historical experience. Changes in the estimated forfeiture rate can have a significant effect on reported stock-based compensation expense, as the effect of adjusting the rate is recognized in the period the forfeiture estimate is changed. Income Taxes — Deferred income tax assets and liabilities are provided for temporary differences that will result in tax deductions or income in future periods, as well as the future benefit of tax credit carryforwards. A valuation allowance reduces tax assets to their estimated realizable value. Determining the liability for uncertain tax positions requires us to make significant estimates and judgments as to whether, and the extent to which, additional taxes may be due based on potential tax audit issues in the U.S. and other tax jurisdictions throughout the world. Our estimates are based on the outcomes of previous audits, as well as the precedents set in cases in which others have taken similar tax positions to those taken by us. If we later determine that our exposure is lower or that the liability is not sufficient to cover our revised expectations, we adjust the liability and effect a related change in our tax provision during the period in which we make such a determination. The accounting guidance for income taxes prescribes a comprehensive model for how a company should recognize, measure, present, and disclose in its financial statements uncertain tax positions that we have taken or expect to take on a tax return (including a decision whether to file or not to file a return in a particular jurisdiction). We recognize the tax liability for uncertain income tax positions on the income tax return based on the two-step process prescribed in the interpretation. The first step is to determine whether it is more likely than not that each income tax position would be sustained upon audit. The second step is to estimate and measure the tax benefit as the amount that has a greater than 50% likelihood of being realized upon ultimate settlement with the tax authority. Estimating these amounts requires us to determine the probability of various possible outcomes. We evaluate these uncertain tax positions on a quarterly basis. See Note 14 of the accompanying consolidated financial statements for further discussion. Net Income per Share — Basic net income per share is computed by dividing income available to common stockholders by the weighted average number of common shares outstanding, excluding common shares subject to repurchase for that period. Diluted net income per share is computed giving effect to all dilutive potential shares that were outstanding during the period. Dilutive potential common shares consist of incremental common shares subject to repurchase, common shares issuable upon exercise of stock options, restricted stock awards, ESPP shares, warrants, and assumed conversion of our Notes.. Repurchased shares are held as treasury stock and our outstanding shares used to calculate earnings per share have been reduced by the weighted number of repurchased shares. 3. Concentration of Risk Financial instruments that potentially subject us to concentrations of credit risk consist primarily of cash equivalents, investments, foreign exchange contracts and accounts receivable. Cash equivalents and short-term investments consist primarily of corporate bonds, U.S. government agency securities, and money market funds, all of which are considered high investment grade. Our policy is to limit the amount of credit exposure through diversification and investment in highly rated securities. We further mitigate concentrations of credit risk in our investments by limiting our investments in the debt securities of a single issuer and by diversifying risk across geographies and type of issuer. 71
  • 72.
    NETAPP, INC. NOTES TO CONSOLIDATED FINANCIAL STATEMENTS — (Continued) Our long term investments, including auction rate securities, have been and will continue to be exposed to market risk due to uncertainties in the credit and capital markets. In entering into forward foreign exchange contracts, we have assumed the risk that might arise from the possible inability of counterparties to meet the terms of their contracts. The counterparties to these contracts are major multinational commercial banks, and we do not expect any losses as a result of counterparty defaults. We sell our products primarily to large organizations in different industries and geographies. We do not require collateral or other security to support accounts receivable. In addition, we maintain an allowance for potential credit losses. To reduce credit risk, we perform ongoing credit evaluations on our customers’ financial condition. We establish an allowance for doubtful accounts based upon factors surrounding the credit risk of customers, historical trends and other information and, to date, such losses have been within management’s expectations. Concentrations of credit risk with respect to trade accounts receivable are limited due to the wide variety of customers who are dispersed across many geographic regions. There are no concentrations of business transacted with a particular market that would severely impact our business in the near term. However, we currently rely on a limited number of suppliers for certain key components and a few key contract manufacturers to manufacture most of our products; any disruption or termination of these arrangements could materially adversely affect our operating results. 4. Recently Issued Accounting Standards In June 2009, the FASB issued revised guidance for the accounting for variable interest entities (VIEs). The scope within the revised standard now includes qualifying special-purpose entities and provides revised guidance on (1) determining the primary beneficiary of the VIE, (2) how power is shared, (3) consideration for kick-out, participating and protective rights, (4) reconsideration of the primary beneficiary, (5) reconsideration of a VIE, (6) fees paid to decision makers or service providers, and (7) presentation requirements. We are required to adopt this standard at the beginning of fiscal 2011. We are currently evaluating the impact of the adoption of this guidance on our consolidated financial statements, but do not expect the adoption to have a material impact on our financial statements. In October 2009, the FASB amended the accounting standards for multiple deliverable revenue arrangements to: (i) provide updated guidance on whether multiple deliverables exist, how the deliverables in an arrangement should be separated, and how the consideration should be allocated; (ii) require an entity to allocate revenue in an arrangement using best estimate of selling prices (BESP) of deliverables if a vendor does not have vendor-specific objective evidence of selling price (VSOE) or third- party evidence of selling price (TPE); (iii) eliminate the use of the residual method and require an entity to allocate revenue using the relative selling price method; and (iv) expand the disclosure requirements to require an entity to provide both qualitative and quantitative information about the significant judgments made in applying the revised guidance and subsequent changes in those judgments that may significantly affect the timing or amount of revenue recognition. In addition, in October 2009, the FASB amended the accounting standards for revenue recognition to exclude tangible products containing software components and non-software components that function together to deliver the tangible product’s essential functionality from the scope of the software revenue recognition guidance. The revised revenue recognition accounting standards are effective for revenue arrangements entered into or materially modified in fiscal years beginning on or after June 15, 2010 and shall be applied on a prospective basis. Earlier application is permitted. We are required to adopt this standard at the beginning of fiscal 2012, which begins on 72
  • 73.
    NETAPP, INC. NOTES TO CONSOLIDATED FINANCIAL STATEMENTS — (Continued) April 30, 2011. We are assessing the impact of the new accounting standards on our financial position and results of operations. In January 2010, the FASB issued revised guidance on disclosures related to fair value measurements. This guidance requires new disclosures about significant transfers in and out of Level 1 and Level 2 and separate disclosures about purchases, sales, issuances, and settlements with respect to Level 3 measurements. The guidance also clarifies existing fair value disclosures about valuation techniques and inputs used to measure fair value. The new disclosures and clarifications of existing disclosures were effective for us in fiscal 2010, except for the disclosures about purchases, sales, issuances, and settlements relating to Level 3 measurements, which will be effective for us in the first quarter of fiscal 2012. We do not expect the adoption to have a material impact on our financial statements. 5. Statements of Cash Flows Supplemental cash flows and noncash investing and financing activities are as follows (in millions): Year Ended April 30, April 24, April 25, 2010 2009 2008 Noncash Investing and Financing Activities: Acquisition of property and equipment on account. . . . . . . . . . . . . . . . . . . . $17.2 $13.2 $27.3 Taxes on settlement of note hedge . . . . . . . . . . . . . . . . . . . . . . . . . . . . . . . . $32.1 $ — $ — Options assumed for acquired businesses . . . . . . . . . . . . . . . . . . . . . . . . . . . — $ — $ 5.2 Supplemental Cash Flow Information: Income taxes paid. . . . . . . . . . . . . . . . . . . . . . . . . . . . . . . . . . . . . . . . . . . . $28.5 $26.3 $29.3 Income taxes refunded . . . . . . . . . . . . . . . . . . . . . . . . . . . . . . . . . . . . . . . . $ 5.7 $10.1 $ 2.2 Interest paid on debt . . . . . . . . . . . . . . . . . . . . . . . . . . . . . . . . . . . . . . . . . . $22.1 $12.7 $ 8.1 6. Business Combinations and Divestiture Acquisition of Onaro On January 28, 2008, we acquired Onaro, Inc. (Onaro), a privately-held company based in Boston, Massa- chusetts, that provided software solutions for enterprises to increase service quality, return on storage, and compliance by managing storage as a service, for a total purchase of $110.7 million. We allocated the purchase price to the estimated tangible and intangible assets acquired and liabilities assumed, based on their estimated fair values as follows (in millions): Tangible assets, net . . . . . . . . . . . . . ......................................... $ 7.2 Identifiable intangible assets . . . . . . . ......................................... 36.0 Goodwill . . . . . . . . . . . . . . . . . . . . . ......................................... 79.2 Deferred income taxes . . . . . . . . . . . ......................................... (11.7) $110.7 Termination of Proposed Merger with Data Domain, Inc. On May 20, 2009, we announced that we had entered into a merger agreement with Data Domain, Inc. (Data Domain) under which we would acquire Data Domain in a stock and cash transaction. On July 8, 2009, Data Domain’s Board of Directors terminated the merger agreement and, pursuant to the terms of the agreement, Data Domain paid us a $57.0 million termination fee. We incurred $15.9 million of incremental third-party costs relating 73
  • 74.
    NETAPP, INC. NOTES TO CONSOLIDATED FINANCIAL STATEMENTS — (Continued) to the terminated merger transaction during the same period, resulting in a net amount of $41.1 million which is included in acquisition related income, net in the consolidated statement of operations. 7. Goodwill and Purchase Intangible Assets Goodwill as of April 30, 2010 and April 24, 2009 was $681.0 million. We conducted our annual goodwill impairment test in the three month period ended April 30, 2010. Based on this analysis, we determined that there was no impairment to goodwill. We will continue to monitor conditions and changes that could indicate that our recorded goodwill may be impaired. Identified intangible assets are summarized as follows (in millions): April 30, 2010 April 24, 2009 Gross Accumulated Net Gross Accumulated Net Assets Amortization Assets Assets Amortization Assets Identified Intangible Assets: Patents . . . . . . . . . . . . . . . . . . . . . . . . . . $ — $ — $ — $ 10.0 $ (9.9) $ 0.1 Existing technology . . . . . . . . . . . . . . . . . 75.1 (55.5) 19.6 107.9 (71.2) 36.7 Trademarks/tradenames . . . . . . . . . . . . . . 6.4 (4.3) 2.1 6.6 (3.4) 3.2 Customer contracts/relationships . . . . . . . . 12.2 (8.8) 3.4 12.5 (6.8) 5.7 Total identified intangible assets, net . . . . $93.7 $(68.6) $25.1 $137.0 $(91.3) $45.7 Amortization expense for identified intangible assets is summarized below (in millions): Year Ended Statement of Operations April 30, 2010 April 24, 2009 April 25, 2008 Classifications Patents . . . . . . . . . . . . . . . . . . . . . $ 0.1 $ 0.5 $ 2.0 Research and development Existing technology . . . . . . . . . . . 17.1 24.5 22.5 Cost of product revenues Other identified intangibles . . . . . . 3.4 4.4 4.4 Sales and marketing $20.6 $29.4 $28.9 In fiscal 2009, we ceased development and availability of our SnapMirror for Open Systems product, and as a result recorded impairment charges of $14.9 million attributable to identified intangible assets related to this product line. As of April 30, 2010, future amortization expense related to identifiable intangible assets was as follows (in millions): Fiscal Year Amount 2011 ......................................... ........................ $11.7 2012 ......................................... ........................ 7.1 2013 ......................................... ........................ 5.0 2014 ......................................... ........................ 0.6 2015 and thereafter . . . . . . . . . . . . . . . . . . . . . . . . . . . . . . ........................ 0.7 Total . . . . . . . . . . . . . . . . . . . . . . . . . . . . . . . . . . . . . . . . . . . . . . . . . . . . . . . . . . . . . . . . . $25.1 74
  • 75.
    NETAPP, INC. NOTES TO CONSOLIDATED FINANCIAL STATEMENTS — (Continued) 8. Balance Sheet Detail Cash and cash equivalents (in millions): April 30, April 24, 2010 2009 Cash . . . . . . . . . . . . . . . . . . . . . . . . . . . . . . . . . . . . . . . . . . . . . . . . . . . . . . . $ 187.8 $ 125.9 Cash equivalents . . . . . . . . . . . . . . . . . . . . . . . . . . . . . . . . . . . . . . . . . . . . . . 1,517.2 1,368.3 $1,705.0 $1,494.2 Inventories (in millions): April 30, April 24, 2010 2009 Purchased components . . . . . . . . . . . . . . . . . . . . . . . . . . . . . . . . . . . . . . . . . . . $ 9.4 $ 5.0 Work-in-process . . . . . . . . . . . . . . . . . . . . . . . . . . . . . . . . . . . . . . . . . . . . . . . . 0.2 0.1 Finished goods . . . . . . . . . . . . . . . . . . . . . . . . . . . . . . . . . . . . . . . . . . . . . . . . . 103.3 56.0 $112.9 $61.1 Long term investments and restricted cash (in millions): April 30, April 24, 2010 2009 Auction rate securities . . . . . . . . . . . . . . . . . . . . . . . . . . . . . . . . ........... $69.0 $ 66.5 Primary Reserve Fund . . . . . . . . . . . . . . . . . . . . . . . . . . . . . . . . ........... — 51.6 Nonmarketable securities . . . . . . . . . . . . . . . . . . . . . . . . . . . . . . ........... 1.4 4.0 Restricted cash . . . . . . . . . . . . . . . . . . . . . . . . . . . . . . . . . . . . . . ........... 2.4 5.2 $72.8 $127.3 Property and equipment (in millions): April 30, April 24, 2010 2009 Land. . . . . . . . . . . . . . . . . . . . . . . . . . . . . . . . . . . . . . . . . . . . . . . . . . . . . . . $ 204.7 $ 176.1 Buildings and building improvements . . . . . ......................... 394.8 323.3 Leasehold improvements . . . . . . . . . . . . . . . ......................... 73.7 70.2 Computer, production, engineering and other equipment and purchased software . . . . . . . . . . . . . . . . . . . . . . . . . ......................... 628.6 562.3 Furniture. . . . . . . . . . . . . . . . . . . . . . . . . . . ......................... 63.2 61.7 Construction-in-progress . . . . . . . . . . . . . . . ......................... 37.0 114.8 1,402.0 1,308.4 Accumulated depreciation and amortization . . . . . . . . . . . . . . . . . . . . . . . . . . (597.6) (500.5) $ 804.4 $ 807.9 75
  • 76.
    NETAPP, INC. NOTES TO CONSOLIDATED FINANCIAL STATEMENTS — (Continued) Other current assets (in millions): April 30, April 24, 2010 2009 Deferred income tax assets . . . . . . . . . . . . . . . . . . . . . . . . . . . . . . . . . . . . . . . . $ 69.6 $207.0 Prepaid expenses and other current assets . . . . . . . . . . . . . . . . . . . . . . . . . . . . . 157.0 118.9 Short-term restricted cash . . . . . . . . . . . . . . . . . . . . . . . . . . . . . . . . . . . . . . . . . 2.1 1.0 $228.7 $326.9 Other Current Liabilities (in millions): April 30, April 24, 2010 2009 Accrual for GSA settlement . . . . . . . . . . . . . . . . . . . . . . . . . . . . ........... $ — $128.7 Restructuring reserve . . . . . . . . . . . . . . . . . . . . . . . . . . . . . . . . . ........... 2.3 14.7 Warranty . . . . . . . . . . . . . . . . . . . . . . . . . . . . . . . . . . . . . . . . . . ........... 18.2 24.0 Taxes payable . . . . . . . . . . . . . . . . . . . . . . . . . . . . . . . . . . . . . . ........... 44.4 38.6 Marketing programs and rebates . . . . . . . . . . . . . . . . . . . . . . . . . ........... 55.7 24.6 Other . . . . . . . . . . . . . . . . . . . . . . . . . . . . . . . . . . . . . . . . . . . . . ........... 91.6 93.1 $212.2 $323.7 9. Financial Instruments and Fair Value We measure assets and liabilities at fair value based upon expected exit price, representing the amount that would be received on the sale of an asset or paid to transfer a liability, as the case may be, in an orderly transaction between market participants. As such, fair value may be based on assumptions that market participants would use in pricing an asset or liability. The accounting guidance provides a framework for measuring fair value on either a recurring or nonrecurring basis whereby inputs, used in valuation techniques, are assigned a hierarchical level. The following are the hierarchical levels of inputs to measure fair value: Level 1: Observable inputs that reflect quoted prices (unadjusted) for identical assets or liabilities in active markets. Level 2: Inputs reflect quoted prices for identical assets or liabilities in markets that are not active; quoted prices for similar assets or liabilities in active markets; inputs other than quoted prices that are observable for the assets or liabilities; or inputs that are derived principally from or corroborated by observable market data by correlation or other means. Level 3: Unobservable inputs reflecting our own assumptions incorporated in valuation techniques used to determine fair value. These assumptions are required to be consistent with market participant assumptions that are reasonably available. We consider an active market to be one in which transactions for the asset or liability occur with sufficient frequency and volume to provide pricing information on an ongoing basis, and view an inactive market as one in which there are few transactions for the asset or liability, the prices are not current, or price quotations vary substantially either over time or among market makers. Where appropriate, our own or the counterparty’s non- performance risk is considered in determining the fair values of liabilities and assets, respectively. 76
  • 77.
    NETAPP, INC. NOTES TO CONSOLIDATED FINANCIAL STATEMENTS — (Continued) Investments The following is a summary of investments at April 30, 2010 and April 24, 2009 (in millions): April 30, 2010 April 24, 2009 Gross Gross Unrealized Estimated Unrealized Estimated Cost Gains Losses Fair Value Cost Gains Losses Fair Value Corporate bonds. . . . . . . . . . . $1,128.1 $3.4 $(1.8) $1,129.7 $ 486.2 $2.3 $(1.8) $ 486.7 Auction rate securities . . . . . . 71.6 0.7 (3.3) 69.0 73.2 0.3 (7.0) 66.5 U.S. agency securities. . . . . . . 775.4 1.7 (0.1) 777.0 80.4 1.4 — 81.8 U.S. Treasuries . . . . . . . . . . . 41.5 0.4 — 41.9 31.9 0.8 — 32.7 Commercial papers . . . . . . . . 215.9 — — 215.9 486.5 — (0.5) 486.0 Municipal bonds . . . . . . . . . . 1.5 — — 1.5 — — — — Certificates of deposit . . . . . . . 159.0 — — 159.0 115.0 0.1 — 115.1 Money market funds. . . . . . . . 1,211.2 — — 1,211.2 1,327.8 — — 1,327.8 Total debt and equity securities . . . . . . . . . . . . . . 3,604.2 6.2 (5.2) 3,605.2 2,601.0 4.9 (9.3) 2,596.6 Less cash equivalents . . . . . . . 1,517.2 — — 1,517.2 1,368.3 — — 1,368.3 Less long-term investments . . . 71.6 0.7 (3.3) 69.0 124.9 0.3 (7.0) 118.2 Total short-term investments . . $2,015.4 $5.5 $(1.9) $2,019.0 $1,107.8 $4.6 $(2.3) $1,110.1 We record net unrealized gains or losses on available-for-sale securities that are determined to be temporary in other comprehensive income (loss). The following table shows the gross unrealized losses and fair values of our investments, aggregated by investment category and length of time that individual securities have been in a continuous unrealized loss position, at April 30, 2010 (in millions): Less than 12 Months 12 Months or Greater Total Unrealized Unrealized Unrealized Fair Value Loss Fair Value Loss Fair Value Loss Corporate bonds . . . . . . . . $516.1 $(1.8) $ — $ — $516.1 $(1.8) Auction rate securities . . . — — 59.7 (3.3) 59.7 (3.3) U.S. agency securities . . . 165.3 (0.1) — — 165.3 (0.1) Total . . . . . . . . . . . . . . . . $681.4 $(1.9) $59.7 $(3.3) $741.1 $(5.2) The following table shows the gross unrealized losses and fair values of our investments, aggregated by investment category and length of time that individual securities have been in a continuous unrealized loss position, at April 24, 2009 (in millions): Less than 12 Months 12 Months or Greater Total Unrealized Unrealized Unrealized Fair Value Loss Fair Value Loss Fair Value Loss Corporate bonds . . . . . . . . $139.5 $(1.2) $ 58.4 $(0.6) $197.9 $(1.8) Auction rate securities . . . — — 57.6 (7.0) 57.6 (7.0) Commercial paper . . . . . . 400.3 (0.5) — — 400.3 (0.5) Total . . . . . . . . . . . . . . . . $539.8 $(1.7) $116.0 $(7.6) $655.8 $(9.3) 77
  • 78.
    NETAPP, INC. NOTES TO CONSOLIDATED FINANCIAL STATEMENTS — (Continued) The following table presents the contractual maturities of our debt investments as of April 30, 2010 (in millions): Debt Investment Maturities Cost Fair Value Due in one year or less . . . . . . . . . . . . . . . . . . . . . . . . . . . . . . . . . . . . . . . . . $ 745.2 $ 746.7 Due in one through two years . . . . . . . . . . . . . ....................... 801.1 802.4 Due in two through three years . . . . . . . . . . . . ....................... 775.1 775.8 Due after three years*. . . . . . . . . . . . . . . . . . . ....................... 71.6 69.0 $2,393.0 $2,393.9 * Consists of auction rate securities which have contractual maturities of greater than 10 years. Fair Value of Financial Instruments The following table summarizes our financial assets and liabilities measured at fair value on a recurring basis as of April 30, 2010 (in millions): Quoted Prices Significant in Active Other Significant Markets for Observable Unobservable Identical Assets Inputs Inputs Total (Level 1) (Level 2) (Level 3) Assets Corporate bonds . . . . . . . . . . . . . . . . . . . . . . . . . . . $1,129.7 $ — $1,129.7 $ — Trading securities . . . . . . . . . . . . . . . . . . . . . . . . . . 12.6 12.6 — — U.S. agency securities . . . . . . . . . . . . . . . . . . . . . . . 777.0 — 777.0 — U.S. Treasuries . . . . . . . . . . . . . . . . . . . . . . . . . . . . 41.9 41.9 — — Municipal bonds . . . . . . . . . . . . . . . . . . . . . . . . . . . 1.5 — 1.5 — Commercial paper . . . . . . . . . . . . . . . . . . . . . . . . . 215.9 — 215.9 — Certificates of deposit . . . . . . . . . . . . . . . . . . . . . . . 159.0 — 159.0 — Money market funds . . . . . . . . . . . . . . . . . . . . . . . . 1,211.2 1,211.2 — — Auction rate securities . . . . . . . . . . . . . . . . . . . . . . 69.0 — — 69.0 Investment in privately-held companies . . . . . . . . . . 1.4 — — 1.4 Foreign currency contracts . . . . . . . . . . . . . . . . . . . 2.0 — 2.0 — Total . . . . . . . . . . . . . . . . . . . . . . . . . . . . . . . . . . . . . $3,621.2 $1,265.7 $2,285.1 $70.4 Liabilities Foreign currency contracts . . . . . . . . . . . . . . . . . . . $ (1.0) $ — $ (1.0) $ — 78
  • 79.
    NETAPP, INC. NOTES TO CONSOLIDATED FINANCIAL STATEMENTS — (Continued) Reported as (in millions): Quoted Prices Significant in Active Other Significant Markets for Observable Unobservable Identical Assets Inputs Inputs Total (Level 1) (Level 2) (Level 3) Assets Cash equivalents . . . . . . . . . . . . . . . . . . . . . . . . . . . $1,517.2 $1,211.2 $ 306.0 $ — Short-term investments . . . . . . . . . . . . . . . . . . . . . . 2,019.0 41.9 1,977.1 — Other current assets . . . . . . . . . . . . . . . . . . . . . . . . 12.6 12.6 — — Long-term investments . . . . . . . . . . . . . . . . . . . . . . 70.4 — — 70.4 Other non-current current assets . . . . . . . . . . . . . . . 2.0 — 2.0 — Total . . . . . . . . . . . . . . . . . . . . . . . . . . . . . . . . . . . . . $3,621.2 $1,265.7 $2,285.1 $70.4 Liabilities Other current liabilities . . . . . . . . . . . . . . . . . . . . . . $ (1.0) $ — $ (1.0) $ — We classify investments within Level 1 if quoted prices are available in active markets. Level 1 investments generally include U.S. Treasuries, trading securities with quoted prices on active markets, and money market funds. We classify items in Level 2 if the investments are valued using observable inputs to quoted market prices, benchmark yields, reported trades, broker/dealer quotes or alternative pricing sources with reasonable levels of price transparency. These investments include: corporate bonds, commercial paper, U.S. government agency bonds, municipal bonds, certificates of deposit, and foreign currency contracts. Investments are held by a custodian who obtains investment prices from a third party pricing provider that incorporates standard inputs in various asset price models. We corroborate the prices obtained from the pricing service against other independent sources and, as of April 30, 2010, have not found it necessary to make any adjustments to the prices obtained. The unrealized losses on our available-for-sale investments in corporate bonds and U.S. government agency bonds were caused by market value declines as a result of the recent economic environment, as well as fluctuations in market interest rates. Because the decline in market value is attributable to changes in market conditions and not credit quality, and because we do not intend to sell nor likely be required to sell these investments prior to a recovery of par value, we do not consider these investments to be other-than temporarily impaired at April 30, 2010. Our foreign currency forward exchange contracts are also classified within Level 2. We determine the fair value of these instruments by considering the estimated amount we would pay or receive to terminate these agreements at the reporting date. We use observable inputs, including quoted prices in active markets for similar assets or liabilities. Our foreign currency derivative contracts are classified within Level 2 as the valuation inputs are based on quoted market prices of similar instruments in active markets. Gains and losses generated by hedge assets and liabilities, and the related derivative instruments were as follows (in millions): Year Ended April 30, April 24, April 25, 2010 2009 2008 Gain (loss) generated by hedged assets and liabilities . . . . . . . . . . . . $(13.5) $(25.9) $ 12.8 Gain (loss) on related derivative instruments . . . . . . . . . . . . . . . . . . . 8.2 20.9 (13.5) We classify items in Level 3 if the investments are valued using a pricing model or based on unobservable inputs in the market. These investments include auction rate securities and cost method investments. As of April 24, 2009, we held an investment in the Reserve Primary Fund (the Primary Fund), a money market fund which had suspended redemptions in September 2008 and was in the process of liquidating its portfolio of investments, with a recorded value of $51.6 million that had been previously written down from its par value of 79
  • 80.
    NETAPP, INC. NOTES TO CONSOLIDATED FINANCIAL STATEMENTS — (Continued) $60.9 million. During fiscal 2010, the Primary Fund made multiple distributions of its assets to its investors and we recognized an additional loss of $0.2 million in our income statement, and as of April 30, 2010, we had recovered $51.4 million of our recorded investment. Future distributions, if any, will be recognized as income upon receipt. As of April 30, 2010 and April 24, 2009, we had auction rate securities (ARSs) with a par value of $73.8 million and $75.4 million, respectively, and an estimated fair value of $69.0 million and $66.5 million, respectively, which are classified as long-term investments. Substantially all of our ARSs are backed by pools of student loans guaranteed by the U.S. Department of Education. As of April 30, 2010, we recorded cumulative temporary losses of $2.6 million within AOCI. In addition, we recorded other-than-temporary losses of $2.1 million in other income (expense), net, during fiscal 2009 based on an analysis of the fair value and marketability of these investments. We estimated the fair value for each individual ARS using an income (discounted cash flow) approach that incorporates both observable and unobservable inputs to discount the expected future cash flows. Based on our ability to access our cash and other short-term investments, our expected operating cash flows, and our other sources of cash, we do not intend to sell these investments prior to recovery of value. We will continue to monitor our ARS investments in light of the current debt market environment and evaluate our accounting for these investments. As of April 30, 2010 and April 24, 2009, we held investments in a private equity fund of $1.4 million and $2.0 million, respectively. In addition, at April 24, 2009, we held equity investments in privately held companies of $1.9 million. During fiscal 2010, we recorded gains of $3.4 million on these investments. During fiscal 2009, we recorded $6.3 million of impairment charges on certain of these investments and adjusted their carrying amount to fair value, as we deemed the decline in the value of those assets to be other-than-temporary. The table below provides a reconciliation of the beginning and ending balance of our Level 3 financial assets measured at fair value on a recurring basis using significant unobservable inputs as of April 30, 2010 (in millions). Auction Rate Private Equity Privately-Held Primary Fund Securities Fund Companies Balance at April 25, 2008 . . . . . . . . . . . $ — $72.6 $ 2.6 $ 8.6 Total unrealized losses included in other comprehensive income . . . . . . . — (3.2) — — Total realized losses included in earnings . . . . . . . . . . . . . . . . . . . . . . — (2.1) — (6.3) Purchases, sales and settlements, net . . . (546.3) (0.8) (0.6) (0.4) Transfers to Level 3 . . . . . . . . . . . . . . . 597.9 — — — Balance at April 24, 2009 . . . . . . . . . . . $ 51.6 $66.5 $ 2.0 $ 1.9 Total unrealized gains included in other comprehensive income . . . . . . . . . . . — 4.2 — — Total realized gains (losses) included in earnings . . . . . . . . . . . . . . . . . . . . . . (0.2) — 0.8 2.6 Purchases, sales and settlements, net . . . (51.4) (1.7) (1.4) (4.5) Balance at April 30, 2010 . . . . . . . . . . . $ — $69.0 $ 1.4 $ — Other Fair Value Disclosures The fair value of certain of our financial instruments that are not measured at fair value, including accounts receivable, accounts payable, accrued compensation, and other current liabilities, approximates the carrying amount because of their short maturities. The fair value of our Notes is disclosed in Note 10 of the accompanying consolidated financial statements and was determined using quoted market prices for those securities. 80
  • 81.
    NETAPP, INC. NOTES TO CONSOLIDATED FINANCIAL STATEMENTS — (Continued) 10. Financing Arrangements 1.75% Convertible Senior Notes Due 2013 On June 10, 2008, we issued $1,265.0 million aggregate principal amount of 1.75% Convertible Senior Notes due 2013. The Notes are unsecured, unsubordinated obligations of the Company. Interest is payable in cash semi- annually at a rate of 1.75% per annum. The Notes will mature on June 1, 2013 unless repurchased or converted in accordance with their terms prior to such date. The Notes may be converted, under the conditions specified below, based on an initial conversion rate of 31.40 shares of common stock per 1,000 principal amount of Notes (which represents an initial effective conversion price of the Notes of approximately $31.85 per share), subject to adjustment as described in the indenture governing the Notes. We received net proceeds of $1,238.4 million, after deducting issuance costs of $26.6 million. The Notes are not redeemable by us prior to the maturity date. In the event of a fundamental change, holders of the Notes may require us to repurchase all or a portion of their Notes at a repurchase price equal to 100% of the principal amount of the Notes plus accrued and unpaid interest, if any, to, but excluding, the fundamental change repurchase date. The holders of the Notes may convert their Notes until the close of business on the scheduled trading day immediately preceding the maturity date if any of the following conditions are met: (1) during the five business day period after any five consecutive trading day period (the measurement period) in which the trading price of the Notes for each day in the measurement period was less than 98% of the product of the last reported sale price of our common stock and the conversion rate for the Notes on each such day; (2) during any calendar quarter (and only during such calendar quarter) if the last reported sale price of our common stock for 20 or more trading days in a period of 30 consecutive trading days ending on the last trading day of the immediately preceding calendar quarter exceeds 130% of the applicable conversion price in effect for the Notes on the last trading day of such immediately preceding calendar quarter; or (3) upon the occurrence of specified corporate transactions set forth in the indenture for the Notes. On or after March 1, 2013 until the scheduled trading day immediately preceding the maturity date, holders of the Notes may convert their Notes regardless of the foregoing conditions. Upon conversion, a holder will receive cash in an amount equal to the lesser of the conversion value and the principal amount of the Notes, and any shares of our common stock for any conversion value in excess of the principal amount of the Notes, if any. Holders of the Notes who convert their Notes in connection with a fundamental change (as defined in the indenture for the Notes) will, under certain circumstances, be entitled to a make-whole premium in the form of an increase in the conversion rate. As of April 30, 2010, none of the conditions allowing the holders of the Notes to convert had been met and we had not issued any shares related to the Notes. Based on the closing price of our common stock of $34.67 on April 30, 2010, the if-converted value of our Notes exceeded their principal amount by approximately $112 million. We separately account for the liability and equity components of the Notes. The initial debt component of the Notes was valued at $1,017.0 million based on the contractual cash flows discounted at an appropriate comparable market non-convertible debt borrowing rate at the date of issuance of 6.31%, with the equity component representing the residual amount of the proceeds of $248.0 million which was recorded as a debt discount. Issuance costs were allocated pro rata based on the relative initial carrying amounts of the debt and equity components. As a result, $5.2 million of the issuance costs were allocated to the equity component of the Notes, and $21.4 million of the issuance costs remained classified as long-term other assets. The debt discount and the issuance costs allocated to the debt component are amortized as additional interest expense over the term of the Notes using the effective interest method and an effective interest rate of 6.31% for all periods presented. 81
  • 82.
    NETAPP, INC. NOTES TO CONSOLIDATED FINANCIAL STATEMENTS — (Continued) The following table reflects the carrying value of our convertible debt as of April 30, 2010 and April 24, 2009 (in millions): April 30, April 24, 2010 2009 1.75% Convertible Notes Due 2013 . . . . . . . . . . . . . . . . . . . . . . . . . . . . . . . . $1,265.0 $1,265.0 Less: Unamortized discount . . . . . . . . . . . . . . . . . . . . . . . . . . . . . . . . . . . . . . (163.5) (210.3) Net long-term carrying amount of Notes . . . . . . . . . . . . . . . . . . . . . . . . . . . . $1,101.5 $1,054.7 The following table presents the amount of interest cost recognized relating to both the contractual interest coupon and the amortization of the discount and issuance costs (in millions): Year Ended April 30, April 24, 2010 2009 Contractual interest coupon . . . . . . . . . . . . . . . . . . . . . . . . . . . . . . . . . . . . . . . $22.5 $19.4 Amortization of debt discount . . . . . . . . . . . . . . . . . . . . . . . . . . . . . . . . . . . . . . 46.8 37.8 Amortization of issuance costs . . . . . . . . . . . . . . . . . . . . . . . . . . . . . . . . . . . . . 4.0 3.2 Total interest cost recognized . . . . . . . . . . . . . . . . . . . . . . . . . . . . . . . . . . . . . . $73.3 $60.4 The following table reflects the remaining debt discount and issuance cost as of April 30, 2010 (in millions): April 30, 2010 Remaining debt discount . . . . . . . . . . . . . . . . . . . . . . . . . . . . . . . . . . . . . . . . . . . . . . . . . . $163.5 Remaining issuance costs . . . . . . . . . . . . . . . . . . . . . . . . . . . . . . . . . . . . . . . . . . . . . . . . . 14.1 Remaining life of the Notes (years) . . . . . . . . . . . . . . . . . . . . . . . . . . . . . . . . . . . . . . . . . . 3.1 Note Hedges and Warrants Concurrent with the issuance of the Notes, we purchased note hedges and sold warrants. The separate note hedge and warrants transactions are structured to reduce the potential future economic dilution associated with the conversion of the Notes. Each of these components is discussed separately below: • Note Hedges. Counterparties agreed to sell the Company up to approximately 39.7 million shares, subject to anti-dilution adjustments, of our common stock, which is the number of shares initially issuable upon conversion of the Notes in full, at a price of $31.85 per share, subject to adjustment. The note hedge transactions will be settled in shares in an amount generally equal to the number of shares the Company would deliver to holders that convert their Notes. The note hedge transactions will expire at the earlier of (1) the last day on which any Notes remain outstanding and (2) the scheduled trading day immediately preceding the maturity date of the Notes. The cost of the Note hedges was $254.9 million and has been accounted for as an equity transaction. • Warrants. We also sold to the same counterparties warrants to acquire, subject to anti-dilution adjustments, 39.7 million shares of our common stock at an exercise price of $41.28 per share, subject to adjustment, on a series of days commencing on September 3, 2013. Upon exercise of the warrants, we have the option to deliver cash or shares of our common stock equal to the difference between the then market price and the strike price of the warrants. As of April 30, 2010, we had not received any shares related to the note hedge transactions or delivered cash or shares related to the warrant transactions. We received proceeds of $163.1 million related to the sale of the warrants, which has been classified as equity. 82
  • 83.
    NETAPP, INC. NOTES TO CONSOLIDATED FINANCIAL STATEMENTS — (Continued) Lehman Brothers OTC Derivatives, Inc. (“Lehman OTC”) was the counterparty to 20% of our Note hedges. The bankruptcy filing by Lehman OTC on October 3, 2008 constituted an “event of default” under the hedge transaction. In April 2010, we terminated the hedge transaction with Lehman OTC in exchange for an unsecured bankruptcy claim, which we subsequently sold to a third party for $14.2 million. Because we have decided not to replace the hedge, we are subject to potential dilution on the 20% unhedged portion of our Notes upon conversion if on the date of conversion the per-share market price of our common stock exceeds the conversion price of $31.85. The terms of the Notes, the rights of the holders of the Notes and other counterparties to Note hedges and warrants were not affected by the termination of this hedge. Fair Value of Notes As of April 30, 2010, the approximate fair value of the principal amount of our Notes, which includes the debt and equity components, was approximately $1.5 billion, or 120% of the face value of the Notes, based upon quoted market information. Credit Agreements On November 2, 2007, we entered into a senior unsecured credit agreement (the “Unsecured Credit Agreement”) with certain lenders and BNP Paribas (“BNP”), as syndication agent, and JPMorgan Chase Bank National Association (“JPMorgan”), as administrative agent. The Unsecured Credit Agreement provided for a revolving unsecured credit facility that is comprised of commitments from various lenders who agree to make revolving loans and swingline loans and issue letters of credit of up to an aggregate amount of $250.0 million with a term of five years. Effective December 22, 2009, we terminated this agreement. No borrowings were outstanding at the time of termination and no penalties resulted from these early terminations. On October 5, 2007, we entered into a secured credit agreement (the “Secured Credit Agreement”). The Secured Credit Agreement provided for a revolving secured credit facility of up to $250.0 million with a term of five years. In fiscal 2009, we terminated this agreement. No borrowings were outstanding at the time of termination and no penalties resulted from these early terminations. 11. Stockholders’ Equity Equity Incentive Programs Acquisition Plans — We have assumed stock incentive plans in connection with our acquisitions. The options granted under these plans generally vest at a rate of 25% on the first anniversary of the vesting commencement date and then ratably over the following 36 months. The restricted stock units generally vest at a rate of 50% on the first and second annual anniversaries of the vesting commencement date. The 1999 Plan — As amended through August 17, 2009, the 1999 Stock Option Plan (“the 1999 Plan”) comprises five separate equity incentive programs: (i) the Discretionary Option Grant Program under which options may be granted to eligible individuals at a fixed price per share; (ii) the Stock Appreciation Rights Program under which eligible persons may be granted stock appreciation rights that allow individuals to receive the appreciation in Fair Market Value of the shares; (iii) the Stock Issuance Program under which eligible individuals may be issued shares of Common Stock directly; (iv) the Performance Share and Performance Unit Program (also known as restricted stock units or RSUs) under which eligible persons may be granted performance shares and performance units which result in payment to the participant only if performance goals or other vesting criteria are achieved; and (v) the Automatic Option Grant Program under which nonemployee board members automatically receive equity grants at designated intervals over their period of board service. 83
  • 84.
    NETAPP, INC. NOTES TO CONSOLIDATED FINANCIAL STATEMENTS — (Continued) Under the 1999 Plan, the Board of Directors may grant to employees, nonemployee directors, and consultants and other independent advisors options to purchase shares of our common stock during their period of service with us. The exercise price for an incentive stock option and a nonstatutory option cannot be less than 100% of the fair market value of the common stock on the grant date. Options granted under the 1999 Plan generally vest over a four- year period. Options granted prior to April 29, 2006, have a term of no more than 10 years after the date of grant and those granted after April 29, 2006 have a term of no more than seven years, subject to earlier termination upon the occurrence of certain events. The 1999 Plan prohibits the repricing of any outstanding stock option or stock appreciation right after it has been granted or to cancel any outstanding stock option or stock appreciation right and immediately replace it with a new stock option or stock appreciation right with a lower exercise price unless approved by stockholders. RSUs granted under the 1999 Plan generally vest over a four-year period with 25% of the units vesting on each annual anniversary of the grant date. The 1999 Plan limits the number of shares issued under the Stock Issuance Program and the Performance Share and Performance Unit Program to 8.9 million shares plus 50% of the awards cancelled and returned to the 1999 Plan and 50% of the number of shares added to the 1999 Plan after the 2009 Annual Meeting. The 1999 Plan limits the value of performance units a participant may receive during any calendar year to $2.0 million. The 1999 Plan expires in August 2019. In fiscal 2010, the 1999 Plan was not amended to increase addition shares for issuance. In fiscal 2009 and 2008, 1999 Plan was amended to increase the share reserved by an additional 6.6 million and 7.2 million shares for issuance under the plan, respectively. As of April 30, 2010, 15.5 million shares were available for grant under our equity incentive plans. Stock Options A summary of the combined activity under our stock option plans and agreements is as follows (in millions, except for per share information and term): Outstanding Options Weighted Weighted Average Average Remaining Aggregate Numbers Exercise Contractual Term Intrinsic of Shares Price (Years) Value Outstanding at April 27, 2007 . . . . . . . . . . . . . . . . . . . . . 63.6 $29.95 Options granted . . . . . . . . . . . . . . . . . . . . . . . . . . . . . . 11.2 26.41 Options assumed in acquisition (weighted average fair value of $22.22). . . . . . . . . . . . . . . . . . . . . . . . . . . . 0.8 13.82 Options exercised . . . . . . . . . . . . . . . . . . . . . . . . . . . . (5.4) 12.47 Options forfeitures and cancellations . . . . . . . . . . . . . . (4.6) 37.54 Outstanding at April 25, 2008 . . . . . . . . . . . . . . . . . . . . . 65.6 30.03 Options granted . . . . . . . . . . . . . . . . . . . . . . . . . . . . . . 8.7 17.67 Options exercised . . . . . . . . . . . . . . . . . . . . . . . . . . . . (3.7) 11.20 Options forfeitures and cancellations . . . . . . . . . . . . . . (4.5) 32.61 Outstanding at April 24, 2009 . . . . . . . . . . . . . . . ...... 66.1 29.27 Options granted . . . . . . . . . . . . . . . . . . . . . . . . ...... 7.1 26.95 Options exercised . . . . . . . . . . . . . . . . . . . . . . ...... (8.5) 19.33 Options cancelled in the Exchange . . . . . . . . . . ...... (24.5) 39.05 Options forfeitures and cancellations . . . . . . . . ...... (5.0) 39.12 Outstanding at April 30, 2010 . . . . . . . . . . . . . . . ...... 35.2 23.02 4.47 $423.4 Options vested and expected to vest as of April 30, 2010 . . . . . . . . . . . . . . . . . . . . . . . . . . . . . . . . . . . . 33.3 22.98 4.38 $402.0 Exercisable at April 30, 2010 . . . . . . . . . . . . . . . . . . . . 22.2 22.92 3.71 $273.0 84
  • 85.
    NETAPP, INC. NOTES TO CONSOLIDATED FINANCIAL STATEMENTS — (Continued) The intrinsic value of stock options represents the difference between the exercise price of stock options and the market price of our stock on that day for all in-the-money options. Additional information related to our stock options is summarized below (in millions except per share information): April 30, 2010 April 24, 2009 April 25, 2008 Weighted-average fair value per share granted . . . . . . . $ 9.74 $ 7.28 $10.13 Intrinsic value of options exercised . . . . . . . . . . . . . . . $ 92.9 $ 30.3 $ 83.1 Proceeds received from the exercise of stock options . . $165.1 $ 41.1 $ 66.6 Fair value of options vested . . . . . . . . . . . . . . . . . . . . . $165.6 $179.8 $177.1 There was $93.1 million of total unrecognized compensation expense as of April 30, 2010 related to options. The unrecognized compensation expense will be amortized on a straight-line basis over a weighted-average remaining period of 2.7 years. The following table summarizes information about stock options outstanding under all option plans as of April 30, 2010 (in millions, except for per share information and life): Options Outstanding Options Exercisable Weighted Average Weighted Weighted Number Remaining Average Average Range of Outstanding at Contractual Life Exercise Number Exercise Exercise Prices April 30, 2010 (In Years) Price Exercisable Price $ 0.55 $ 12.43 2.5 2.91 $ 10.09 2.2 $ 9.90 12.52 13.56 3.7 5.60 13.56 1.0 13.56 13.63 19.17 3.6 2.95 16.58 3.4 16.61 19.22 20.69 5.3 3.92 20.36 3.2 20.16 20.70 22.56 4.9 4.38 21.81 3.0 21.67 22.62 24.72 4.1 5.08 23.81 2.2 23.48 24.98 30.74 4.0 4.89 28.41 3.2 28.28 30.88 33.54 5.2 5.49 32.94 2.4 32.36 33.77 121.69 1.9 3.97 40.92 1.6 41.70 122.19 122.19 — 0.42 122.19 — 122.19 $ 0.55 $122.19 35.2 4.47 $ 23.02 22.2 $ 22.92 85
  • 86.
    NETAPP, INC. NOTES TO CONSOLIDATED FINANCIAL STATEMENTS — (Continued) The following table summarizes activity related to our RSUs (in millions, except the fair value): Weighted Average Numbers of Grant Date Shares Fair Value Outstanding at April 27, 2007 . . . . . . . . . . . . . . . . . . . . . . . . ................. 1.5 $36.42 RSUs granted . . . . . . . . . . . . . . . . . . . . . . . . . . . . . . . . . . . ................. 3.4 23.11 RSU assumed in acquisition . . . . . . . . . . . . . . . . . . . . . . . . ................. 0.2 22.83 RSUs vested . . . . . . . . . . . . . . . . . . . . . . . . . . . . . . . . . . . ................. (0.3) 33.19 RSUs forfeitures and cancellations . . . . . . . . . . . . . . . . . . . ................. (0.2) 33.65 Outstanding at April 25, 2008 . . . . . . . . . . . . . . . . . . . . . . . . ................. 4.6 26.30 RSUs granted . . . . . . . . . . . . . . . . . . . . . . . . . . . . . . . . . . . ................. 2.2 17.16 RSUs vested . . . . . . . . . . . . . . . . . . . . . . . . . . . . . . . . . . . ................. (0.8) 28.81 RSUs forfeitures and cancellations . . . . . . . . . . . . . . . . . . . ................. (0.5) 25.48 Outstanding at April 24, 2009 . . . . . . . . . . . . . . . . . . . . . . . . ................. 5.5 22.38 RSUs granted . . . . . . . . . . . . . . . . . . . . . . . . . . . . . . . . . . . ................. 3.1 29.32 RSUs issued in the Stock Option Exchange . . . . . . . . . . . . . ................. 3.2 21.73 RSUs vested . . . . . . . . . . . . . . . . . . . . . . . . . . . . . . . . . . . ................. (2.1) 24.64 RSUs forfeitures and cancellations . . . . . . . . . . . . . . . . . . . ................. (0.7) 23.39 Outstanding at April 30, 2010 . . . . . . . . . . . . . . . . . . . . . . . . . . . . . . . . . . . . . . . . . 9.0 23.93 As of April 30, 2010, there was $138.7 million of total unrecognized compensation expense related to RSUs. The unrecognized compensation expense will be amortized on a straight-line basis over a weighted-average remaining vesting period of 2.7 years. RSUs are converted into common stock upon the release to the employees or directors upon vesting. Upon the vesting of restricted stock, we primarily use the net share settlement approach, which withholds a portion of the shares to cover the applicable taxes and decreases the shares issued to the employee by a corresponding value. The number and the value of the shares netted for employee taxes are summarized in the table below (in millions): Year Ended April 30, April 24, April 25, 2010 2009 2008 RSUs shares withheld for taxes . . . . . . . . . . . . . . . . . . . . . . . . . . . . 0.7 0.3 0.2 RSUs amount withheld for taxes . . . . . . . . . . . . . . . . . . . . . . . . . . . $20.8 $5.1 $6.0 Stock Option Exchange In April 2009, our stockholders approved a stock option exchange program (the Exchange) pursuant to which eligible employees were able to exchange some or all of their outstanding options with an exercise price greater than or equal to $22.00 per share that were granted before June 20, 2008, whether vested or unvested, for new RSUs. In connection with the Exchange, we exchanged options to purchase 24.5 million shares of our common stock for total of 3.2 million RSUs. The fair value of the RSUs issued was measured as the total of the unrecognized compensation cost of the options surrendered and the incremental value of the RSUs issued, measured as the excess of the fair value of the RSUs over the fair value of the options tendered immediately before the exchange. The incremental cost of the RSUs was $5.8 million. The value of the RSUs, totaling $70.1 million, is being amortized over the weighted average vesting period of the RSUs of 3.5 years. 86
  • 87.
    NETAPP, INC. NOTES TO CONSOLIDATED FINANCIAL STATEMENTS — (Continued) Stock Issuance Program — Under the 1999 Stock Issuance Program, certain eligible persons may be issued shares of common stock directly. No restricted stock awards (RSAs) were issued to employees during fiscal 2010, 2009 and 2008. At April 30, 2010, 8.0 million shares were available for future issuances under this program. The following table summarizes activity related to our restricted stock awards (in millions, except the fair value): Weighted-Average Number of Shares Grant Date Fair Value Nonvested at April 27, 2007 . . . . . . . . . . . . . . . . . . . . . . . . 0.3 $34.45 Awards vested. . . . . . . . . . . . . . . . . . . . . . . . . . . . . . . . . . . (0.1) 32.62 Awards canceled/expired/forfeited . . . . . . . . . . . . . . . . . . . . (0.1) 34.26 Nonvested at April 25, 2008 . . . . . . . . . . . . . . . . . . . . . . . . 0.1 35.40 Awards vested. . . . . . . . . . . . . . . . . . . . . . . . . . . . . . . . . . . — 34.07 Awards canceled/expired/forfeited . . . . . . . . . . . . . . . . . . . . — 30.20 Nonvested at April 24, 2009 . . . . . . . . . . . . . . . . . . . . . . . . 0.1 36.68 Awards vested. . . . . . . . . . . . . . . . . . . . . . . . . . . . . . . . . . . (0.1) 34.96 Nonvested at April 30, 2010 . . . . . . . . . . . . . . . . . . . . . . . . — $39.83 Although nonvested shares are legally issued, they are considered contingently returnable shares subject to repurchase by the Company when employees terminate their employment. The total fair value of shares vested during fiscal 2010, 2009 and 2008 was $1.8 million, $2.0 million and $1.6 million, respectively. There was $0.5 million of total unrecognized compensation expense as of April 30, 2010 related to RSAs that will be amortized on a straight-line basis over a weighted-average remaining period of 0.7 years. Employee Stock Purchase Plan — Under the Employee Stock Purchase Plan (ESPP), employees are entitled to purchase shares of our common stock at 85% of the fair market value at certain specified dates over a two-year period. In fiscal 2010, 2009 and 2008, the plan was amended to increase the share reserved by an additional 6.7 million, 2.9 million and 1.6 million shares of common stock, respectively. Of the 30.2 million shares authorized to be issued under this plan, 5.0 million shares were available for issuance at April 30, 2010. Additional information related to our purchase rights issued under the ESPP is summarized below (in millions, except per share information): Year Ended April 30, April 24, April 25, 2010 2009 2008 Weighted-average fair value per right granted . . . . . . . . . . . . . . . . . . $ 8.86 $ 6.17 $ 7.44 Shares issued under the ESPP . . . . . . . . . . . . . . . . . . . . . . . . . . . . . 5.1 3.3 2.1 Weighted average price of shares issued . . . . . . . . . . . . . . . . . . . . . . $10.49 $14.96 $23.38 87
  • 88.
    NETAPP, INC. NOTES TO CONSOLIDATED FINANCIAL STATEMENTS — (Continued) Stock-Based Compensation Expense Stock-based compensation expenses included in the consolidated statements of operations for fiscal 2010, 2009 and 2008, respectively, are as follows (in millions): Year Ended April 30, April 24, April 25, 2010 2009 2008 Cost of product revenues . . . . . . . . . . . . . . . . . . . . . . . . . . . . . .... $ 4.0 $ 3.3 $ 3.4 Cost of service revenues . . . . . . . . . . . . . . . . . . . . . . . . . . . . . .... 14.3 12.3 10.5 Sales and marketing. . . . . . . . . . . . . . . . . . . . . . . . . . . . . . . . . .... 73.7 65.1 65.4 Research and development . . . . . . . . . . . . . . . . . . . . . . . . . . . . .... 38.5 37.9 46.6 General and administrative . . . . . . . . . . . . . . . . . . . . . . . . . . . . .... 29.3 22.2 22.1 Total stock-based compensation expense . . . . . . . . . . . . . . . . . . . . $159.8 $140.8 $148.0 The following table summarizes stock-based compensation associated with each type of award (in millions): Year Ended April 30, April 24, April 25, 2010 2009 2008 Employee stock options, RSUs and RSAs. . . . . . . . . . . . . . . . . . . . . $125.2 $113.4 $131.4 ESPP . . . . . . . . . . . . . . . . . . . . . . . . . . . . . . . . . . . . . . . . . . . . . . . 34.3 27.4 16.5 Change in amounts capitalized in inventory . . . . . . . . . . . . . . . . . . . 0.3 — 0.1 Total stock-based compensation expense . . . . . . . . . . . . . . . . . . . . $159.8 $140.8 $148.0 For fiscal 2010, 2009 and 2008, total income tax (charges) benefits associated with employee stock transactions and recognized in stockholders’ equity were $(0.9) million, $45.4 million and $48.2 million, respectively. Valuation Assumptions We estimated the fair value of stock options using the Black-Scholes model on the date of the grant. Assumptions used in the Black-Scholes valuation model were as follows: Stock Options ESPP Year Ended Year Ended April 30, April 24, April 25, April 30, April 24, April 25, 2010 2009 2008 2010 2009 2008 Expected term in years . . . . . 4.5 4.0 4.0 1.3 1.3 1.3 Risk-free interest rate . . . . . . 1.89% - 2.58% 1.08% - 3.69% 2.04% - 5.02% 0.21% - 0.97% 0.92% - 2.52% 2.36% - 4.95% Volatility . . . . . . . . . . . . . . 33% - 49% 38% - 69% 33% - 55% 38% - 47% 39% - 76% 35% - 49% Expected dividend . . . . . . . . 0% 0% 0% 0% 0% 0% Stock Repurchase Program Since the inception of our stock repurchase programs on May 13, 2003 through April 30, 2010, we have purchased a total of 104.3 million shares of our common stock at an average price of $28.06 per share for an aggregate purchase price of $2.9 billion. As of April 30, 2010, our Board of Directors had authorized the repurchase of up to $4.0 billion of common stock under various stock repurchase programs, and $1.1 billion remains available under these authorizations. The stock repurchase programs may be suspended or discontinued at any time. 88
  • 89.
    NETAPP, INC. NOTES TO CONSOLIDATED FINANCIAL STATEMENTS — (Continued) During fiscal 2010, we did not repurchase any shares of our common stock under the stock repurchase program. During fiscal 2009, we repurchased 17.0 million shares of our common stock at an aggregate cost of $400.0 million, or a weighted average price of $23.58 per share. During fiscal 2008, we repurchased 32.8 million shares of our common stock at an aggregate cost of $903.7 million, or a weighted average price of $27.58 per share. The repurchases were recorded as treasury stock and resulted in a reduction of stockholders’ equity. Preferred Stock Our Board of Directors has the authority to issue up to 5.0 million shares of preferred stock and to determine the price, rights, preferences, privileges, and restrictions, including voting rights, of those shares without any further vote or action by the stockholders. Comprehensive Income (Loss) Comprehensive income (loss) consists of net income and other comprehensive income (OCI), which is a separate component of stockholders’ equity and is disclosed within the consolidated statement of stockholders’ equity and comprehensive income. OCI includes foreign currency translation adjustments, unrealized gains and losses on derivatives and unrealized gains and losses on our available-for-sale securities, which includes a temporary impairment charge of $3.3 million, $7.0 million and $3.5 million in fiscal 2010, 2009 and 2008, respectively, associated with our auction rate securities. The components of accumulated other comprehensive income (loss), net of related tax effects, at the end of each fiscal year, were as follows (in millions): 2010 2009 2008 Accumulated translation adjustments. . . . . . . . . . . . . . . . . . . . . . . . . . . . . . . . . . . . . . $1.2 $(0.3) $ 4.4 Accumulated unrealized gain (loss) on available-for-sale investments . . . . . . . . . . . . . . 0.9 (4.4) (2.3) Accumulated unrealized gain (loss) on derivatives qualifying as cash flow hedges . . . . 0.7 (0.5) (1.3) Total accumulated other comprehensive income (loss) . . . . . . . . . . . . . . . . . . . . . . . . . $2.8 $(5.2) $ 0.8 12. Derivatives and Hedging Activities We use derivative instruments to manage exposures to foreign currency risk. Our primary objective in holding derivatives is to reduce the volatility of earnings and cash flows associated with changes in foreign currency. The program is not designated for trading or speculative purposes. Our derivatives expose us to credit risk to the extent that the counterparties may be unable to meet the terms of the agreement. We seek to mitigate such risk by limiting our counterparties to major financial institutions. In addition, the potential risk of loss with any one counterparty resulting from this type of credit risk is monitored on an ongoing basis. We also have in place a master netting arrangement to mitigate the credit risk of our counterparty and potentially to reduce our losses due to counterparty nonperformance. All contracts have a maturity of less than six months. Our major foreign currency exchange exposures and related hedging programs are described below: Balance Sheet. We utilize monthly foreign currency forward and options contracts to hedge exchange rate fluctuations related to certain foreign monetary assets and liabilities. These derivative instruments do not subject us to material balance sheet risk due to exchange rate movements because gains and losses on these derivatives are intended to offset gains and losses on the assets and liabilities being hedged and the net amount is included in earnings. Forecasted Transactions. We use currency forward contracts to hedge exposures related to forecasted sales denominated in certain foreign currencies. These contracts are designated as cash flow hedges and in general closely match the underlying forecasted transactions in duration. The contracts are carried on the balance sheet at 89
  • 90.
    NETAPP, INC. NOTES TO CONSOLIDATED FINANCIAL STATEMENTS — (Continued) fair value, and the effective portion of the contracts’ gains and losses is recorded as AOCI until the forecasted transaction occurs. When the forecasted transaction occurs, we reclassify the related gain or loss on the cash flow hedge to revenues. If the underlying forecasted transactions do not occur, or it becomes probable that they will not occur, the gain or loss on the related cash flow hedge is recognized immediately in earnings. We measure the effectiveness of hedges of forecasted transactions on a monthly basis by comparing the fair values of the designated currency forward contracts with the fair values of the forecasted transactions. Any ineffective portion of the derivative hedging gain or loss as well as changes in the fair value of the derivative’s time value (which are excluded from the assessment of hedge effectiveness) is recognized in current period earnings. Over the next twelve months, it is expected that $0.7 million of derivative net losses recorded in AOCI as of April 30, 2010 will be reclassified into earnings as an adjustment to revenues. The maximum length of time over which forecasted foreign denominated revenues are hedged is six months. The notional value of our outstanding currency forward contracts that were entered into to hedge forecasted foreign denominated sales and our balance sheet monetary asset and liability exposures consisted of the following (in millions): April 30, April 24, 2010 2009 Cash Flow Hedges Euro. . . . . . . . . . . . . . . . . . . . . . . . . . . . . . . . . . . . . . . . . . . . ........... $ 81.0 $ 40.0 British Pound Sterling. . . . . . . . . . . . . . . . . . . . . . . . . . . . . . . ........... 18.9 18.5 Balance Sheet Contracts Euro. . . . . . . . . . . . . . . . . . . . . . . . . . . . . . . . . . . . . . . . . . . . ........... 232.6 126.9 British Pound Sterling. . . . . . . . . . . . . . . . . . . . . . . . . . . . . . . ........... 57.0 49.8 Canadian Dollar . . . . . . . . . . . . . . . . . . . . . . . . . . . . . . . . . . . ........... 28.1 20.5 Australian Dollar . . . . . . . . . . . . . . . . . . . . . . . . . . . . . . . . . . ........... 23.0 24.9 Other . . . . . . . . . . . . . . . . . . . . . . . . . . . . . . . . . . . . . . . . . . . ........... 43.6 33.5 We net derivative assets and liabilities in the consolidated balance sheets to the extent that master netting arrangements meet the requirements of accounting guidance on balance sheet offsetting. The fair value of derivative instruments in our consolidated balance sheets as of April 30, 2010 was as follows (in millions): Fair Values of Derivative Instruments Asset Derivatives Liability Derivatives Balance Balance Sheet Sheet Location Fair Value Location Fair Value Derivatives designated as hedging instruments: Other current Other current Foreign exchange forward contracts . . . . . . . . . . . . . . assets $0.7 liabilities $ — Derivatives not designated as hedging instruments: Other current Other current Foreign exchange forward contracts . . . . . . . . . . . . . . assets 3.8 liabilities (3.5) Total derivatives. . . . . . . . . . . . . . . . . . . . . . . . . . . . . $4.5 $(3.5) 90
  • 91.
    NETAPP, INC. NOTES TO CONSOLIDATED FINANCIAL STATEMENTS — (Continued) The effect of derivative instruments designated as cash flow hedges on our consolidated statements of operations for fiscal 2010 and 2009 was as follows (in millions): Year Ended April 30, 2010 Year Ended April 24, 2009 Gain (Loss) Gain (Loss) Gain (Loss) Gain (Loss) Gain (Loss) Gain (Loss) Derivatives in Cash Flow Recognized in Reclassified from Recognized in Recognized Reclassified from Recognized in Hedging Relationships AOCI AOCI into Income Income in AOCI AOCI into Income Income Foreign exchange forward contracts. . . . . . . . . . . . . . . . . $(0.5) $(1.7) $— $3.3 $2.5 $(0.7) The effect of derivative instruments not designated as hedges on our consolidated statements of operations for the year ended April 30, 2010, and April 24, 2009 was as follows (in millions): Year Ended Location of Gain (Loss) April 30, 2010 April 24, 2009 Recognized in Derivatives Not Designated as Hedging Instruments Gain (Loss) Recognized Income Foreign exchange forward contracts . . . . . . . . . . . . . Other income $8.2 $21.6 (expense), net 13. Restructuring and Other Charges During fiscal 2010, 2009 and 2008, we recorded the restructuring expense primarily related to adjustments to future lease commitments and employee severance costs associated with our fiscal 2009 restructuring plan. Activities related to the restructuring reserves for fiscal 2010, 2009 and 2008 were as follows (in millions): Severance- Contract Fixed Related Cancellation Assets Intangible Charges Facilities Costs Other Write-off Write-off Total Reserve balance at April 27, 2007 . . . . . . . $ — $ 2.1 $ — $ — $ — $ — $ 2.1 Cash payments . . . . . . . . . . . . . . . . . . . . . — (0.6) — — — — (0.6) Restructuring charges . . . . . . . . . . . . . . . . — 0.4 — — — — 0.4 Reserve balance at April 25, 2008 . . . . . . . — 1.9 — — — — 1.9 Restructuring and other charges . . . . . . . . . 28.0 4.5 0.3 2.9 3.8 14.9 54.4 Cash payments . . . . . . . . . . . . . . . . . . . . . (17.6) (1.0) (0.1) (1.8) — — (20.5) Non-cash charges . . . . . . . . . . . . . . . . . . . — 0.3 — 0.1 (3.8) (14.9) (18.3) Foreign currency changes . . . . . . . . . . . . . (0.1) (0.2) — — — — (0.3) Reserve balance at April 24, 2009 . . . . . . . 10.3 5.5 0.2 1.2 — — 17.2 Adjustments to accrual and other charges . . 0.6 1.6 (0.1) 0.4 — — 2.5 Cash payments . . . . . . . . . . . . . . . . . . . . . (11.1) (3.3) (0.1) (1.5) — — (16.0) Foreign currency changes . . . . . . . . . . . . . 0.2 0.3 — (0.1) — — 0.4 Reserve balance at April 30, 2010 . . . . . . . $ — $ 4.1 $ — $ — $ — $ — $ 4.1 Fiscal 2009 Restructuring Plans In February 2009, we announced our decision to execute a worldwide restructuring program, which included a reduction in workforce, the closing or downsizing of certain facilities, and the establishment of a plan to outsource certain internal activities. In December 2008, we announced our decision to cease the development and availability of our SnapMirror» for Open Systems product, which was originally acquired through our acquisition of Topio in fiscal 2007. As part of this decision, we also announced the closure of our engineering facility in Haifa, Israel. 91
  • 92.
    NETAPP, INC. NOTES TO CONSOLIDATED FINANCIAL STATEMENTS — (Continued) As of April 30, 2010, we had approximately $3.6 million of facilities-related lease payments related to these activities and we expect to be substantially paid by January 2013. Fiscal 2002 Restructuring Plan As of April 30, 2010, we also have $0.5 million remaining in facility restructuring reserves established as part of a restructuring plan in fiscal 2002 related to future lease commitments on exited facilities, net of expected sublease income. We expect to substantially fulfill the remaining contractual obligations related to this facility restructuring reserve by fiscal 2011. Of the reserve balance at April 30, 2010, $2.3 million was included in other accrued liabilities, and the remaining $1.8 million was classified as other long-term obligations. 14. Income Taxes Income before income taxes is as follows (in millions): Year Ended April 30, April 24, April 25, 2010 2009 2008 Domestic . . . . . . . . . . . . . . . . . . . . . . . . . . . . . . . . . . . . . . . . . . . . . $ 60.2 $(250.9) $ 45.8 Foreign . . . . . . . . . . . . . . . . . . . . . . . . . . . . . . . . . . . . . . . . . . . . . . 386.8 259.2 336.9 Total . . . . . . . . . . . . . . . . . . . . . . . . . . . . . . . . . . . . . . . . . . . . . . $447.0 $ 8.3 $382.7 The provision for (benefit from) income taxes consists of the following (in millions): Year Ended April 30, April 24, April 25, 2010 2009 2008 Current: Federal . . . . . . . . . . . . . . . . . . . . . . . . . . . . . . . . . . . . . . . . . . . . $ 33.6 $ 16.2 $ 48.8 State . . . . . . . . . . . . . . . . . . . . . . . . . . . . . . . . . . . . . . . . . . . . . . 1.5 40.8 23.8 Foreign . . . . . . . . . . . . . . . . . . . . . . . . . . . . . . . . . . . . . . . . . . . . 22.8 11.2 17.8 Total current . . . . . . . . . . . . . . . . . . . . . . . . . . . . . . . . . . . . . . . . 57.9 68.2 90.4 Deferred: Federal . . . . . . . . . . . . . . . . . . . . . . . . . . . . . . . . . . . . . . . . . . . . (4.6) (78.7) 7.1 State . . . . . . . . . . . . . . . . . . . . . . . . . . . . . . . . . . . . . . . . . . . . . . (2.9) (52.0) (20.4) Foreign . . . . . . . . . . . . . . . . . . . . . . . . . . . . . . . . . . . . . . . . . . . . (3.8) 6.2 (4.1) Total deferred . . . . . . . . . . . . . . . . . . . . . . . . . . . . . . . . . . . . . . . (11.3) (124.5) (17.4) Provision for (benefit from) income taxes . . . . . . . . . . . . . . . . . $ 46.6 $ (56.3) $ 73.0 92
  • 93.
    NETAPP, INC. NOTES TO CONSOLIDATED FINANCIAL STATEMENTS — (Continued) The provision (benefit) for income taxes differs from the amount computed by applying the statutory federal income tax rate as follows (in millions): Year Ended April 30, April 24, April 25, 2010 2009 2008 Tax computed at federal statutory rate . . . . . . . . . . . . . . . . . . . . . . . $ 156.5 $ 2.9 $133.9 State income taxes, net of federal benefit . . . . . . . . . . . . . . . . . . . . . 2.6 (7.9) 2.2 Federal credits . . . . . . . . . . . . . . . . . . . . . . . . . . . . . . . . . . . . . . . . . (7.8) (9.2) (4.7) Stock-based compensation . . . . . . . . . . . . . . . . . . . . . . . . . . . . . . . . (2.6) 10.2 11.0 Foreign earnings in lower tax jurisdiction . . . . . . . . . . . . . . . . . . . . . (105.2) (51.0) (67.5) Other . . . . . . . . . . . . . . . . . . . . . . . . . . . . . . . . . . . . . . . . . . . . . . . 3.1 (1.3) (1.9) Provision for (benefit from) income taxes . . . . . . . . . . . . . . . . . . . . . $ 46.6 $(56.3) $ 73.0 The income tax benefits (charges) associated with dispositions from employee stock transactions were recognized as additional paid-in capital (in millions): Year Ended April 30, April 24, April 25, 2010 2009 2008 Income tax benefits (charges) . . . . . . . . . . . . . . . . . . . . . . . . . . . . . . $(0.9) $45.4 $48.2 The components of our deferred tax assets and liabilities are as follows (in millions): Year Ended April 30, April 24, 2010 2009 Deferred Tax Assets: Inventory reserves and capitalization . . . . . . . . . . . . . . . . . . . . . . ........... $ 5.1 $ 4.9 Reserves and accruals not currently deductible . . . . . . . . . . . . . . ........... 49.1 113.3 Net operating loss and credit carryforwards . . . . . . . . . . . . . . . . . ........... 75.3 63.6 Stock-based compensation . . . . . . . . . . . . . . . . . . . . . . . . . . . . . ........... 90.2 77.8 Deferred revenue . . . . . . . . . . . . . . . . . . . . . . . . . . . . . . . . . . . . ........... 168.7 154.3 Capitalized research and development expenditures . . . . . . . . . . . ........... 6.6 6.7 Investment losses . . . . . . . . . . . . . . . . . . . . . . . . . . . . . . . . . . . . ........... 2.4 2.3 Conditional royalty. . . . . . . . . . . . . . . . . . . . . . . . . . . . . . . . . . . ........... 13.6 13.5 Other . . . . . . . . . . . . . . . . . . . . . . . . . . . . . . . . . . . . . . . . . . . . . ........... 1.0 0.2 Gross deferred tax assets . . . . . . . . . . . . . . . . . . . . . . . . . . . . . . . . . . . . . . . . . 412.0 436.6 Valuation allowance . . . . . . . . . . . . . . . . . . . . . . . . . . . . . . . . . . . . . . . . . . . . . (28.3) (28.0) Total deferred tax assets . . . . . . . . . . . . . . . . . . . . . . . . . . . . . ........... 383.7 408.6 Deferred Tax Liabilities: Depreciation . . . . . . . . . . . . . . . . . . . . . . . . . . . . . . . . . . . . . . . ........... 8.0 (7.1) Acquisition intangibles . . . . . . . . . . . . . . . . . . . . . . . . . . . . . . . . ........... 8.5 15.0 Convertible Notes. . . . . . . . . . . . . . . . . . . . . . . . . . . . . . . . . . . . ........... 35.2 — Other . . . . . . . . . . . . . . . . . . . . . . . . . . . . . . . . . . . . . . . . . . . . . ........... (1.0) 15.7 Total deferred tax liabilities . . . . . . . . . . . . . . . . . . . . . . . . . . . . . . . . . . . . . 50.7 23.6 Net deferred tax assets . . . . . . . . . . . . . . . . . . . . . . . . . . . . . . . . . . . . . . . . . . . $333.0 $385.0 93
  • 94.
    NETAPP, INC. NOTES TO CONSOLIDATED FINANCIAL STATEMENTS — (Continued) Current and noncurrent net deferred tax assets for fiscal 2010 and 2009 are as follows (in millions): Year Ended April 30, April 24, 2010 2009 Current net deferred tax assets . . . . . . . . . . . . . . . . . . . . . . . . . . . . . . . . . . . . . $ 69.6 $207.1 Noncurrent deferred tax assets . . . . . . . . . . . . . . . . . . . . . . . . . . . . . . . . . . . . . 263.4 192.5 Noncurrent deferred tax liabilities . . . . . . . . . . . . . . . . . . . . . . . . . . . . . . . . . . . — (14.6) The valuation allowance increased by $0.3 million and $0.5 million in fiscal 2010 and 2009, respectively, primarily due to a change in the blended state tax rates. A reconciliation of the beginning and ending amount of unrecognized tax benefits is as follows (in millions): Year Ended April 30, April 24, April 25, 2010 2009 2008 Balance at beginning of period . . . . . . . . . . . . . . . . . . . . . . . . . .... $110.1 $ 97.8 $58.3 Additions based on tax positions related to the current year . . . .... 34.9 13.8 21.2 Additions for tax positions of prior years . . . . . . . . . . . . . . . . . .... 3.7 0.7 18.3 Decreases in tax positions of prior years . . . . . . . . . . . . . . . . . . .... (14.2) (2.2) — Balance at end of period . . . . . . . . . . . . . . . . . . . . . . . . . . . . . . . . . $134.5 $110.1 $97.8 Of the $134.5 million unrecognized tax benefits at April 30, 2010, $122.4 million has been recorded and included in other long-term liabilities, of which $96.3 million, if recognized, would affect our provision for income taxes. We recognize accrued interest and penalties related to unrecognized foreign tax benefits in the income tax provision. During the fiscal years ended 2005 through 2010, we recognized total accrued interest and penalties of approximately $0.8 million and have included this accrual in our liability for unrecognized tax benefits. During fiscal 2010, we recorded $32.1 million charge to additional paid in capital related to the establishment of a $26.1 million tax reserve to provide for the uncertainty relating to the tax treatment of the termination of the Lehman Brothers bond hedge, as well a $6.0 million deferred tax liability for related temporary tax return differences in the valuation of the convertible debt as a result of the transaction. We are subject to taxation in the United States, various states, and several foreign jurisdictions. The tax years that remain subject to examination for our major tax jurisdictions are shown below: Tax Years Subject to Examination for Major Tax Jurisdictions at April 30, 2010 2003 — 2009 . . . . . . . . . . . . . . . . . . . . . . .......... United States — federal income tax 2003 — 2009 . . . . . . . . . . . . . . . . . . . . . . .......... United States — state and local income tax 2004 — 2009 . . . . . . . . . . . . . . . . . . . . . . .......... Australia 2004 — 2009 . . . . . . . . . . . . . . . . . . . . . . .......... Germany 2005 — 2009 . . . . . . . . . . . . . . . . . . . . . . .......... India 2006 — 2009 . . . . . . . . . . . . . . . . . . . . . . .......... Japan 2005 — 2009 . . . . . . . . . . . . . . . . . . . . . . .......... The Netherlands 2004 — 2009 . . . . . . . . . . . . . . . . . . . . . . .......... United Kingdom 94
  • 95.
    NETAPP, INC. NOTES TO CONSOLIDATED FINANCIAL STATEMENTS — (Continued) In addition, we are effectively subject to federal tax examination adjustments for tax years ended on or after fiscal year 2000, in that we have net operating loss carryforwards from these years that could be subject to adjustment, if and when utilized. We are currently undergoing federal and state income tax audits in the United States and several foreign tax jurisdictions. The rights to some of our intellectual property (“IP”) are owned by certain of our foreign subsidiaries, and payments are made between foreign and U.S. tax jurisdictions relating to the use of this IP in a qualified cost sharing arrangement. Recently, several other U.S. companies have had their foreign IP arrangements challenged as part of IRS examinations, which have resulted in material proposed assessments and/or pending litigation. Effective September 27, 2007, the IRS’s Large and Mid-Sized Business Division (“LMSB”) released a Coordinated Issues Paper (“CIP”) with respect to qualified cost sharing arrangements (“CSAs”). Specifically, this CIP provides guidance to IRS personnel concerning methods that may be applied to evaluate the arm’s length charge (buy-in payment) for internally developed (pre-existing) as well as acquisition-related intangible property that is made available to a qualified CSA. During fiscal year 2009 we received Notices of Proposed Adjustments from the IRS in connection with a federal income tax audit of our fiscal 2003 and 2004 tax year tax returns. We recently filed a protest with the IRS in response to the Notices of Proposed Adjustments. The Notices of Proposed Adjustments focus primarily on issues of the timing and the amount of income recognized and deductions taken during the audit years and on the level of cost allocations made to foreign operations during the audit years. If upon the conclusion of these audits the ultimate determination of our taxes owed in any of these tax jurisdictions is for an amount in excess of the tax provision we have recorded in the applicable period or subsequently reserved for, our overall tax provision and effective tax rate may be adversely impacted. It is reasonably possible the company will reach a final settlement with the IRS on the 2003 — 2004 audit within the next twelve months. On March 22, 2010, the United States Court of Appeals for the Ninth Circuit held in Xilinx Inc. v. Commissioner that pre-2004 cost sharing regulations do not require stock-based compensation to be included in the research and development cost base of companies that have entered into a CSA and, therefore, the stock-based compensation does not have to be allocated among the participants. The Court’s ruling impacts our estimate of tax benefits required to be recognized under accounting guidance. As a result of the revised ruling, we released the liability established in our first quarter of fiscal 2010 of $38.6 million in the fourth quarter of fiscal 2010. For fiscal 2010, there was no net income tax expense impact. We do not include unrealized stock option attributes as components of our gross deferred tax assets and corresponding valuation allowance disclosures. The tax effected amounts of gross unrealized net operating loss and business tax credit carryforwards, and their corresponding valuation allowance have been excluded as of April 30, 2010 are $358.6 million, which will result in additional paid in capital if and when realized as a reduction in taxes otherwise paid. As of April 30, 2010, the amount of accumulated unremitted earnings from our foreign subsidiaries is approximately $1,181.0 million. Network Appliance Systems India Pvt. Ltd., our Indian subsidiary, received a tax holiday from the Indian tax authorities attributed to its call center and research and development activities effective June 6, 2003. These activities qualify under the Software Technology Park of India (“STPI”) incentive for the development and manufacture of computer software and information technology enabled services. Under this tax holiday, net taxable income derived from call center and research and development activities is exempt from Indian taxation. This tax holiday is set to expire on March 31, 2011. Notwithstanding qualification for this tax holiday, minimum alternate tax rules in India effective for us as of fiscal 2009 override the full tax exemption. For fiscal 2010, we were subject to a minimum alternate tax on this income in India at a rate of 16.99%. The minimum alternate tax paid is eligible for credit against regular tax paid in future years. The credits may be carried forward for ten years. 95
  • 96.
    NETAPP, INC. NOTES TO CONSOLIDATED FINANCIAL STATEMENTS — (Continued) In April 2010 our Dutch subsidiary received a favorable tax ruling from the Dutch tax authorities effective May 1, 2010 that replaces the previous Dutch tax ruling that expired on April 30, 2010. This ruling results in both a lower level of earnings subject to tax in the Netherlands and an extension of the expiration date to April 30, 2015. As of April 30, 2010, the federal, and state net operating loss carryforwards for income tax purposes were approximately $793.5 million and $170.0 million, respectively. The federal net operating loss carryforwards will begin to expire in fiscal 2021. State net operating losses of $6.4 million will expire in fiscal years 2011 through 2013; $10.6 million will expire in fiscal year 2014 while the remaining $152.9 million will expire in fiscal years 2015 through 2030. As of April 30, 2010, we had federal and state tax credit carryforwards of approximately $90.1 million and $82.0 million, respectively, available to offset future income tax liabilities. Federal tax credit carryforwards of $49.6 million will begin to expire in fiscal years 2015 through 2022, while the remaining $40.4 million will expire in fiscal years beginning 2023. State tax credits of $0.04 million will expire in fiscal years 2011 through 2013, while the remaining $81.9 million is available indefinitely to reduce cash taxes otherwise payable. As discussed above, most of the net operating loss and tax credit carryovers, if realized, will be recognized as additional paid in capital in that they are employee stock option tax attributes. 15. Net Income per Share The following is a calculation of basic and diluted net income per share for the periods presented (in millions): Year Ended April 30, April 24, April 25, 2010 2009 2008 Net Income. . . . . . . . . . . . . . . . . . . . . . . . . . . . . . . . . . . . . . . . . . . $400.4 $ 64.6 $309.7 Weighted average shares: Weighted average common shares outstanding . . . . . . . . . . . . . . . 339.7 330.4 351.9 Weighted average common shares outstanding subject to repurchase . . . . . . . . . . . . . . . . . . . . . . . . . . . . . . . . . . . . . . . . (0.1) (0.1) (0.2) Shares used in basic computation . . . . . . . . . . . . . . . . . . . . . . . . . 339.6 330.3 351.7 Weighted average common shares outstanding subject to repurchase . . . . . . . . . . . . . . . . . . . . . . . . . . . . . . . . . . . . . . . . 0.1 0.1 0.2 Dilutive potential shares related to employee equity award plans . . 13.2 4.2 9.2 Dilutive impact of assumed conversion of Notes . . . . . . . . . . . . . . 0.3 — — Shares used in diluted computation . . . . . . . . . . . . . . . . . . . . . . . . 353.2 334.6 361.1 Net Income per Share: Basic . . . . . . . . . . . . . . . . . . . . . . . . . . . . . . . . . . . . . . . . . . . . . . $ 1.18 $ 0.20 $ 0.88 Diluted . . . . . . . . . . . . . . . . . . . . . . . . . . . . . . . . . . . . . . . . . . . . $ 1.13 $ 0.19 $ 0.86 The following potential weighted average common shares have been excluded from the diluted net income per share calculations, as their effect would have been antidilutive (in millions): Year Ended April 30, April 24, April 25, 2010 2009 2008 Options and RSUs . . . . . . . . . . . . . . . . . . . . . . . . . . . . . . . . . . . . . . 19.3 61.1 39.3 96
  • 97.
    NETAPP, INC. NOTES TO CONSOLIDATED FINANCIAL STATEMENTS — (Continued) Dilutive shares outstanding for fiscal years 2010 and 2009 do not include any effect resulting from the warrants issued in June 2008, and for fiscal year 2009 do not include any effect resulting from assumed conversion of the Notes, as their impact would be anti-dilutive. 16. Segment, Geographic, and Significant Customer Information We operate in one reportable industry segment: the design, manufacturing, marketing, and technical support of high-performance networked storage solutions. Our company conducts business globally and is primarily managed on a geographic basis. Our management reviews financial information presented on a consolidated basis, accompanied by disaggregated information it receives from its internal management system about revenues by geographic region, based on the location from which the customer relationship is managed, for purposes of allocating resources and evaluating financial performance. We do not allocate costs of revenues, research and development, sales and marketing, or general and administrative expenses to our geographic regions in this internal management system because management does not review operations or operating results, or make planning decisions, below the consolidated entity level. Summarized revenues by geographic region for fiscal 2010, 2009 and 2008, based on the our internal management system and as utilized by our Chief Executive Officer, who is considered our Chief Operating Decision Maker (CODM), is as follows (in millions): Year Ended April 30, April 24, April 25, 2010 2009 2008 Americas (United States, Canada and Latin America)* . . . . . . . . . $2,208.1 $1,805.2 $1,829.4 Europe, Middle East and Africa . . . . . . . . . . . . . . . . . . . . . . . . . 1,329.1 1,213.3 1,083.8 Asia Pacific and Japan . . . . . . . . . . . . . . . . . . . . . . . . . . . . . . . . 394.2 387.9 390.0 Net revenues . . . . . . . . . . . . . . . . . . . . . . . . . . . . . . . . . . . . . . $3,931.4 $3,406.4 $3,303.2 * Sales to the United States accounted for 89%, 90% and 91% of Americas’ revenues in fiscal 2010, 2009 and 2008, respectively. The majority of our assets, excluding cash and cash equivalents and investments and accounts receivable, as of April 30, 2010 and April 24, 2009 were attributable to our U.S. operations. Our total cash and cash equivalents and investments held outside of the United States in various foreign subsidiaries was $1.7 billion and $1.3 billion as April 30, 2010 and April 24, 2009, respectively, and the remaining $2.1 billion and $1.4 billion at the respective year ends was held in the United States. With the exception of property and equipment, we do not identify or allocate our long-lived assets by geographic area. The following table presents property and equipment information for geographic areas based on the physical location of the assets (in millions): Year Ended April 30, April 24, 2010 2009 United States . . . . . . . . . . . . . . . . . . . . . . . . . . . . . . . . . . . . . . . . . . . . . . . . . . $735.0 $767.9 International . . . . . . . . . . . . . . . . . . . . . . . . . . . . . . . . . . . . . . . . . . . . . . . . . . . 69.4 40.0 Total property and equipment . . . . . . . . . . . . . . . . . . . . . . . . . . . . . . . . . . . . $804.4 $807.9 No single foreign country represented more than 10% of total property and equipment. 97
  • 98.
    NETAPP, INC. NOTES TO CONSOLIDATED FINANCIAL STATEMENTS — (Continued) International sales to single foreign countries which accounted for ten percent or more of net revenues were as follows (in millions, except percentages): Year Ended April 30, % of April 24, % of 2010 Revenues 2009 Revenues Germany . . . . . . . . . . . . . . . . . . . . . . . . . . . . . . . . . . . . $441.1 11% $380.2 11% No single foreign country accounted for ten percent or more of net revenues in fiscal 2008. Sales to customers, who are distributors, for fiscal 2010 and 2009, were as follows (in millions, except percentages): Year Ended April 30, % of April 24, % of 2010 Revenues 2009 Revenues Arrow . . . . . . . . . . . . . . . . . . . . . . . . . . . . . . . . . . . . . . $550.7 14% $360.3 11% Avnet . . . . . . . . . . . . . . . . . . . . . . . . . . . . . . . . . . . . . . 444.0 11% 356.4 10% No customer accounted for ten percent or more of our net revenues during fiscal 2008. The following customers accounted for ten percent or more of net accounts receivable as of April 30, 2010 (in millions): % of April 30, Accounts 2010 Receivable Arrow . . . . . . . . . . . . . . . . . . . . . . . . . . . . . . . . . . . . . . . . . . . . . . . . . . . . . . $48.7 10% No customer accounted for ten percent or more of net accounts receivable as of April 24, 2009. 17. Employee Benefits and Deferred Compensation Employee 401(k) Plans We have established a 401(k) tax-deferred savings plan. Employees meeting the eligibility requirements, as defined, may contribute specified percentages of their salaries. In 2010, 2009 and 2008, we matched 50% of the employee’s contribution up to a total of 6% of the employee’s annual salary, and the matched contributions are vested over 3 years. The amounts we contributed to this plan were as follows (in millions): Year Ended April 30, April 24, April 25, 2010 2009 2008 401(k) contributions. . . . . . . . . . . . . . . . . . . . . . . . . . . . . . . . . . . . . $9.2 $13.6 $12.2 Deferred Compensation Plans We have a non-qualified deferred compensation plan that allows a group of employees within the United States to contribute base salary and/or incentive compensation on a tax deferred basis in excess of the IRS limits imposed on 401(k) plans. The amounts of the marketable securities related to investments in debt and equity securities that 98
  • 99.
    NETAPP, INC. NOTES TO CONSOLIDATED FINANCIAL STATEMENTS — (Continued) are held in a rabbi trust under non-qualified deferred compensation plans and the related deferred compensation liability under this plan, which are recorded primarily in other long-term liabilities were as follows (in millions): Year Ended April 30, April 24, 2010 2009 Marketable securities . . . . . . . . . . . . . . . . . . . . . . . . . . . . . . . . . . . . . . . . . . . . $12.6 $7.9 Deferred compensation liabilities reported as: Other current liabilities . . . . . . . . . . . . . . . . . . . . . . . . . . . . . . . . . . . . . . . . . . . 2.3 0.9 Other long-term liabilities . . . . . . . . . . . . . . . . . . . . . . . . . . . . . . . . . . . . . . . . . 10.3 7.0 Postretirement Health Care Plan We maintain a plan to provide postretirement health and welfare benefits to certain executives who meet certain age and service requirements. Coverage continues through the duration of the lifetime of the retiree or the retiree’s spouse, whichever is longer. There is no funding requirement associated with the plan and none of the benefit obligation was funded as of April 30, 2010. The accumulated postretirement benefit obligation of $4.8 million as of April 30, 2010 has been classified in other long term liabilities in the accompanying consolidated balance sheets. Assumed health care cost trend rates have a significant effect on the amounts reported for the health care plan. 18. Commitments and Contingencies Operating Leases — We lease office space in several U.S. locations. Outside the United States, larger leased sites include sites in The Netherlands, Australia, Belgium, France, Germany, India, Japan, and the United Kingdom. We also lease equipment and vehicles. As of April 30, 2010, we have four leasing arrangements (Leasing Arrangements 1, 2, 3 and 4) for facilities in Sunnyvale, California with BNPPLC which require us to lease certain of our land to BNPPLC for a period of 99 years, and to lease approximately 0.6 million square feet of office space for our headquarters in Sunnyvale costing up to $149.6 million. Under these leasing arrangements, we pay BNPPLC minimum lease payments, which vary based on LIBOR plus a spread or a fixed rate on the costs of the facilities on the respective lease commencement dates. We make payments for each of the leases for a term of five years. We have the option to renew each of the leases for two consecutive five-year periods upon approval by BNPPLC. Upon expiration (or upon any earlier termination) of the lease terms, we must elect one of the following options: (i) purchase the buildings from BNPPLC at cost; (ii) if certain conditions are met, arrange for the sale of the buildings by BNPPLC to a third party for an amount equal to at least 85% of the costs (residual guarantee), and be liable for any deficiency between the net proceeds received from the third party and such amounts; or (iii) pay BNPPLC supplemental payments for an amount equal to at least 85% of the costs (residual guarantee), in which event we may recoup some or all of such payments by arranging for a sale of each or all buildings by BNPPLC during the ensuing two-year period. The following table summarizes the costs, the residual guarantee, the applicable LIBOR plus spread or fixed rate at April 30, 2010, and the date we began to make payments for each of our leasing arrangements (in millions): LIBOR Plus Lease Leasing Residual Spread or Commencement Arrangements Cost Guarantee Fixed Rate Date Term 1 $48.5 $41.2 3.99% January 2008 5 years 2 $80.0 $68.0 1.08% December 2007 5 years 3 $10.5 $ 8.9 3.97% December 2007 5 years 4 $10.6 $ 9.0 3.99% December 2007 5 years 99
  • 100.
    NETAPP, INC. NOTES TO CONSOLIDATED FINANCIAL STATEMENTS — (Continued) These leases require us to maintain specified financial covenants with which we were in compliance as of April 30, 2010. Such financial covenants include a maximum ratio of Total Debt to Earnings before Interest, Taxes, Depreciation and Amortization and a minimum amount of Unencumbered Cash and Short-Term Investments. Future annual minimum lease payments under all noncancelable operating leases with an initial term in excess of one year as of April 30, 2010 are as follows (in millions): 2011 2012 2013 2014 2015 Thereafter Total Office operating lease payments . . . . . . . . $26.7 $22.3 $ 17.8 $15.1 $13.0 $20.4 $115.3 Real estate lease payments . . . . . . . . . . . . 3.6 3.6 129.5 — — — 136.7 Equipment operating lease payments . . . . 24.3 10.7 4.6 0.4 — — 40.0 Less: Sublease income . . . . . . . . . . . . . . . (5.8) (0.8) (0.6) (0.4) (0.2) — (7.8) Total lease commitments . . . . . . . . . . . . . $48.8 $35.8 $151.3 $15.1 $12.8 $20.4 $284.2 Included in real estate lease payments pursuant to four financing arrangements with BNP Paribas Leasing Corporation (BNPPLC) are (i) lease commitments of $3.6 million in each of the fiscal years 2011 and 2012; $2.4 million in fiscal 2013, which are based on the LIBOR rate at April 30, 2010 plus a spread or a fixed rate, for terms of five years; and (ii) at the expiration or termination of the lease, a supplemental payment obligation equal to our minimum guarantee of $127.1 million in the event that we elect not to purchase or arrange for sale of the buildings. In fiscal 2010, we determined that it was probable that the fair value of the properties under synthetic lease would be below the guaranteed residual at the end of the initial lease terms. Our current estimate of this shortfall is $36.9 million. We are accruing for this deficiency over the remaining initial terms of the respective leases of thirty- two months. Rent expense in fiscal 2010, 2009 and 2008 was as follows (in millions): Year Ended April 30, April 24, April 25, 2010 2009 2008 Facilities rent expense . . . . . . . . . . . . . . . . . . . . . . . . . . . . . . . . . . . $ 43.2 $ 40.6 $33.7 Equipment rent expense . . . . . . . . . . . . . . . . . . . . . . . . . . . . . . . . . . 23.4 25.3 16.4 $ 66.6 $ 65.9 $50.1 Less: sublease income . . . . . . . . . . . . . . . . . . . . . . . . . . . . . . . . . . . (12.5) (11.8) (4.1) Net rent expense . . . . . . . . . . . . . . . . . . . . . . . . . . . . . . . . . . . . . . . $ 54.1 $ 54.1 $46.0 Purchase Orders and Other Commitments In the normal course of business we make commitments to our third party contract manufacturers, to manage manufacturer lead times and meet product forecasts, and to other parties, to purchase various key components used in the manufacture of our products. We establish accruals for estimated losses on purchased components for which we believe it is probable that they will not be utilized in future operations. To the extent that such forecasts are not achieved, our commitments and associated accruals may change. We had $148.0 million in non-cancelable purchase commitments with our contract manufacturers as of April 30, 2010. In addition, were recorded a liability for firm non-cancelable and unconditional purchase commitments with contract manufacturers for quantities in excess of our future demand forecasts. As of April 30, 2010 and April 24, 2009, such liability amounted to $3.8 million and $3.2 million, respectively, and is included in other current liabilities in the consolidated balance sheets. 100
  • 101.
    NETAPP, INC. NOTES TO CONSOLIDATED FINANCIAL STATEMENTS — (Continued) In addition to commitments with contract manufacturers and component suppliers, we have open purchase orders and contractual obligations associated with our ordinary course of doing business for which we have not received goods or services. We had $63.3 million in purchase commitments as of April 30, 2010. During the ordinary course of business, we provide standby letters of credit or other guarantee instruments to third parties as required for certain transactions initiated either by us or our subsidiaries. As of April 30, 2010, our financial guarantees of $5.1 million that were not recorded on our balance sheet consisted of standby letters of credit related to workers’ compensation, a customs guarantee, a corporate credit card program, foreign rent guarantees and surety bonds. Product Warranties We provide customers a warranty on software of ninety days and a warranty on hardware with terms ranging from one to three years. Following is an analysis of our warranty reserves (in millions): Year Ended April 30, April 24, 2010 2009 Warranty reserve at beginning of period . . . . . . . . . . . . . . . . . . . . . . . . . . . . . . $ 42.3 $ 42.8 Expense accrued during the period . . . . . . . . . . . . . . . . . . . . . . . . . . . . . . . . . . 16.0 25.9 Warranty costs incurred . . . . . . . . . . . . . . . . . . . . . . . . . . . . . . . . . . . . . . . . . . (26.4) (26.4) Warranty reserve at end of period . . . . . . . . . . . . . . . . . . . . . . . . . . . . . . . . . . . $ 31.9 $ 42.3 Financing Guarantees We have both nonrecourse and recourse lease financing arrangements with third-party leasing companies through new and preexisting relationships with customers. In addition, from time to time we provide guarantees for a portion of other financing arrangements under which we could be called upon to make payments to our third-party funding companies in the event of nonpayment by end-user customers. Under the terms of the nonrecourse leases, we do not have any continuing obligations or liabilities to the third-party leasing companies. Under the terms of the recourse leases, which are generally three years or less, we remain liable for the aggregate unpaid remaining lease payments to the third-party leasing companies in the event of end-user customer default. These arrangements are generally collateralized by a security interest in the underlying assets. Where we provide a guarantee, we defer the revenues associated with the end-user financing arrangement in accordance with our revenue recognition policies. As of April 30, 2010, the maximum guaranteed payment contingencies under our financing arrangements totaled approximately $76.7 million; and the related deferred revenue and cost of revenues totaled approximately $81.5 million and $9.7 million, respectively. To date, we have not experienced material losses under our lease financing programs or other financing arrangements. Indemnification Agreements We enter into standard indemnification agreements in the ordinary course of business. Pursuant to these agreements, we agree to defend and indemnify other parties, primarily our customers or business partners or subcontractors, for damages and reasonable costs incurred in any suit or claim brought against them alleging that our products sold to them infringe any U.S. patent, copyright, trade secret, or similar right. If a product becomes the subject of an infringement claim, we may, at our option: (i) replace the product with another noninfringing product that provides substantially similar performance; (ii) modify the infringing product so that it no longer infringes but remains functionally equivalent; (iii) obtain the right for the customer to continue using the product at our expense and for the reseller to continue selling the product; (iv) take back the infringing product and refund to customer the purchase price paid less depreciation amortized on a straight-line basis. We have not been required to make material payments pursuant to these provisions historically. We have not recorded any liability at April 30, 2010 related to 101
  • 102.
    NETAPP, INC. NOTES TO CONSOLIDATED FINANCIAL STATEMENTS — (Continued) these guarantees since the maximum amount of potential future payments under such guarantees, indemnities and warranties is not determinable, other than as described above. Legal Contingencies We are subject to various legal proceedings and claims which may arise in the normal course of business. On September 5, 2007, we filed a patent infringement lawsuit in the Eastern District of Texas seeking compensatory damages and a permanent injunction against Sun Microsystems. On October 25, 2007, Sun Microsystems filed a counter claim against us in the Eastern District of Texas seeking compensatory damages and a permanent injunction. On October 29, 2007, Sun filed a second lawsuit against us in the Northern District of California asserting additional patents against us. The Texas court granted a joint motion to transfer the Texas lawsuit to the Northern District of California on November 26, 2007. On March 26, 2008, Sun filed a third lawsuit in federal court that extends the patent infringement charges to storage management technology we acquired in January 2008. In January 2010, Oracle acquired Sun. The three lawsuits are currently in the discovery and motion phase and no trial dates have been set, so we are unable at this time to determine the likely outcome of these various patent litigations. Since we are unable to reasonably estimate the amount or range of any potential settlement, no accrual has been recorded as of April 30, 2010. 19. Selected Quarterly Financial Data (Unaudited) Year Ended April 30, 2010 Q1 Q2 Q3 Q4 Net revenues . . . . . . . . . . . . . . . . . . . . . . . . . . . . . . . . . $838.0 $910.0 $1,011.7 $1,171.7 Gross profit . . . . . . . . . . . . . . . . . . . . . . . . . . . . . . . . . . 522.5 606.7 641.5 748.5 Net income . . . . . . . . . . . . . . . . . . . . . . . . . . . . . . . ... 51.7 95.7 107.9 145.1 Net income per share, basic . . . . . . . . . . . . . . . . . . . ... 0.15 0.28 0.32 0.42 Net income per share, diluted . . . . . . . . . . . . . . . . . . ... 0.15 0.27 0.30 0.40 Year Ended April 24, 2009 Q1 Q2 Q3 Q4 Net revenues . . . . . . . . . . . . . . . . . . . . . . . . . . . . . . . . . . . . $868.8 $911.6 $746.3 $879.7 Gross profit . . . . . . . . . . . . . . . . . . . . . . . . . . . . . . . . . . . . . 516.6 546.2 393.2 533.9 Net income (loss) . . . . . . . . . . . . . . . . . . . . . . . . . . . . . . . . 34.7 43.1 (81.6) 68.4 Net income (loss) per share, basic . . . . . . . . . . . . . . . . . . . . 0.10 0.13 (0.25) 0.21 Net income (loss) per share, diluted . . . . . . . . . . . . . . . . . . . 0.10 0.13 (0.25) 0.21 20. Subsequent Event On May 13, 2010, we completed the acquisition of Bycast Inc., a privately held company headquartered in Vancouver, British Columbia, Canada, for approximately $80 million in cash. This acquisition will extend our leadership position in unified storage by adding an object-based storage software offering which simplifies the task of large-scale object storage while improving the ability to quickly search and locate data objects. As of April 30, 2010, we had incurred $1.2 million in related expenses which is included in acquisition related income, net in our consolidated statements of operations. 102
  • 103.
    Item 9. Changesin and Disagreements with Accountants on Accounting and Financial Disclosure None. Item 9A. Controls and Procedures (a) Evaluation of Disclosure Controls and Procedures Disclosure Controls are procedures designed to ensure that information required to be disclosed in our reports filed under the Exchange Act, such as this Annual Report, is recorded, processed, summarized and reported within the time periods specified in the U.S. Securities and Exchange Commission’s rules and forms. Disclosure Controls are also designed to ensure that such information is accumulated and communicated to our management, including the CEO and CFO, as appropriate to allow timely decisions regarding required disclosure. Under the supervision and with the participation of our management, including our principal executive officer and principal financial officer, we conducted an evaluation of the effectiveness of the design and operation of our disclosure controls and procedures, as defined in Rules 13a-15(e) and 15d-15(e) under the Securities Exchange Act of 1934, as amended, as of the end of the period covered by this report (the “Evaluation Date”). Based on this evaluation, our principal executive officer and principal financial officer concluded as of the Evaluation Date that our disclosure controls and procedures were effective such that the information relating to NetApp, including our consolidated subsidiaries, required to be disclosed in our Securities and Exchange Commission (“SEC”) reports (i) is recorded, processed, summarized and reported within the time periods specified in SEC rules and forms, and (ii) is accumulated and communicated to NetApp’s management, including our principal executive officer and principal financial officer, as appropriate to allow timely decisions regarding required disclosure. (b) Management’s Report on Internal Control Over Financial Reporting Our management is responsible for establishing and maintaining adequate internal control over financial reporting, as such term is defined in Exchange Act Rule 13a-15(f). Our internal control over financial reporting is a process designed to provide reasonable assurance regarding the reliability of financial reporting and the preparation of financial statements for external purposes in accordance with generally accepted accounting principles. Because of its inherent limitations, internal control over financial reporting may not prevent or detect misstatements. Also, projections of any evaluation of effectiveness to future periods are subject to the risk that controls may become inadequate because of changes in conditions, or that the degree of compliance with the policies or procedures may deteriorate. Under the supervision and with the participation of our management, including our principal executive officer and principal financial officer, we conducted an evaluation of the effectiveness of our internal control over financial reporting based on the criteria established in Internal Control — Integrated Framework issued by the Committee of Sponsoring Organizations of the Treadway Commission (COSO). Based on this assessment, our management concluded that, as of April 30, 2010, our internal control over financial reporting was effective based on those criteria. The effectiveness of our internal control over financial reporting as of April 30, 2010 has been audited by Deloitte & Touche LLP, an independent registered public accounting firm, as stated in their report which is included herein. (c) Changes in Internal Control Over Financial Reporting There were no changes in our internal control over financial reporting (as defined in Rule 13a-15(f) under the Exchange Act) identified in connection with management’s evaluation during our last fiscal quarter that have materially affected, or are reasonably likely to materially effect, our internal control over financial reporting. 103
  • 104.
    (d) Report of Independent Registered Public Accounting Firm REPORT OF INDEPENDENT REGISTERED PUBLIC ACCOUNTING FIRM To the Board of Directors and Stockholders of NetApp, Inc. Sunnyvale, California We have audited the internal control over financial reporting of NetApp, Inc. and subsidiaries (collectively, the “Company”) as of April 30, 2010, based on criteria established in Internal Control — Integrated Framework issued by the Committee of Sponsoring Organizations of the Treadway Commission. The Company’s management is responsible for maintaining effective internal control over financial reporting and for its assessment of the effectiveness of internal control over financial reporting, included in the accompanying Management’s Report on Internal Control over Financial Reporting. Our responsibility is to express an opinion on the Company’s internal control over financial reporting based on our audit. We conducted our audit in accordance with the standards of the Public Company Accounting Oversight Board (United States). Those standards require that we plan and perform the audit to obtain reasonable assurance about whether effective internal control over financial reporting was maintained in all material respects. Our audit included obtaining an understanding of internal control over financial reporting, assessing the risk that a material weakness exists, testing and evaluating the design and operating effectiveness of internal control based on the assessed risk, and performing such other procedures as we considered necessary in the circumstances. We believe that our audit provides a reasonable basis for our opinion. A company’s internal control over financial reporting is a process designed by, or under the supervision of, the company’s principal executive and principal financial officers, or persons performing similar functions, and effected by the company’s board of directors, management, and other personnel to provide reasonable assurance regarding the reliability of financial reporting and the preparation of financial statements for external purposes in accordance with generally accepted accounting principles. A company’s internal control over financial reporting includes those policies and procedures that (1) pertain to the maintenance of records that, in reasonable detail, accurately and fairly reflect the transactions and dispositions of the assets of the company; (2) provide reasonable assurance that transactions are recorded as necessary to permit preparation of financial statements in accordance with generally accepted accounting principles, and that receipts and expenditures of the company are being made only in accordance with authorizations of management and directors of the company; and (3) provide reasonable assurance regarding prevention or timely detection of unauthorized acquisition, use, or disposition of the company’s assets that could have a material effect on the financial statements. Because of the inherent limitations of internal control over financial reporting, including the possibility of collusion or improper management override of controls, material misstatements due to error or fraud may not be prevented or detected on a timely basis. Also, projections of any evaluation of the effectiveness of the internal control over financial reporting to future periods are subject to the risk that the controls may become inadequate because of changes in conditions, or that the degree of compliance with the policies or procedures may deteriorate. In our opinion, the Company maintained, in all material respects, effective internal control over financial reporting as of April 30, 2010, based on the criteria established in Internal Control — Integrated Framework issued by the Committee of Sponsoring Organizations of the Treadway Commission. We have also audited, in accordance with the standards of the Public Company Accounting Oversight Board (United States), the consolidated financial statements and financial statement schedule as of and for the year ended April 30, 2010 of the Company and our report dated June 18, 2010 expressed an unqualified opinion on those financial statements and financial statement schedule. /s/ DELOITTE & TOUCHE LLP San Jose, California June 18 2010 104
  • 105.
    Item 9B. OtherInformation None. PART III Item 10. Directors and Executive Officers of the Registrant The information required by this Item with respect to the Company’s executive officers is incorporated herein by reference from the information under Item 1 of Part I of this Annual Report on Form 10-K under the section entitled “Executive Officers.” The information required by this Item with respect to the Company’s directors is incorporated herein by reference from the information provided under the heading “Election of Directors” in the Proxy Statement for the 2010 Annual Meeting of Stockholders which will be filed with the Securities and Exchange Commission. The information required by Item 405 of Regulation S-K is incorporated herein by reference from the information provided under the heading “Section 16(a) Beneficial Ownership Reporting Compliance” in the Proxy Statement for the 2010 Annual Meeting of Stockholders. We have adopted a written code of ethics that applies to our Board of Directors and all of our employees, including our principal executive officer, principal financial officer and principal accounting officer. A copy of the code is available on our website at www.netapp.com. We will post any amendments to or waivers from the provisions of our code of ethics on our website. Item 11. Executive Compensation Information regarding the compensation of executive officers and directors of the Company is incorporated by reference from the information under the heading “Executive Compensation and Related Information” in our Proxy Statement for the 2010 Annual Meeting of Stockholders. Item 12. Security Ownership of Certain Beneficial Owners and Management Information regarding security ownership of certain beneficial owners and management is incorporated by reference from the information under the heading “Security Ownership of Certain Beneficial Owners and Management” in our Proxy Statement for the 2010 Annual Meeting of Stockholders. Item 13. Certain Relationships and Related Transactions Information regarding certain relationships and related transactions is incorporated by reference from the information under the caption “Employment Contracts, Termination of Employment and Change-In-Control Agreements” in our Proxy Statement for the 2010 Annual Meeting of Stockholders. Item 14. Principal Accountant Fees and Services The information required by this item is incorporated by reference from the information under the caption “Audit Fees” in our Proxy Statement for the 2010 Annual Meeting of Stockholders. With the exception of the information incorporated in Items 10, 11, 12, 13, and 14 of this Annual Report on Form 10-K, NetApp’s Proxy Statement is not deemed “filed” as part of this Annual Report on Form 10-K. PART IV Item 15. Exhibits and Financial Statement Schedules See the Exhibit Index immediately following Schedule II of this Annual Report on Form 10-K. 105
  • 106.
    SIGNATURES Pursuant to the requirements of Section 13 or 15(d) of the Securities Exchange Act of 1934, the Company has duly caused this report to be signed on its behalf by the undersigned, thereunto duly authorized, on June 18, 2010. NETAPP, INC. By: /s/ THOMAS GEORGENS Thomas Georgens Chief Executive Officer, President and Director, (Principal Executive Officer and Principal Operating Officer) POWER OF ATTORNEY KNOW ALL MEN BY THESE PRESENTS, that each person whose signature appears below constitutes and appoints Thomas Georgens and Steven J. Gomo, and each of them, as his true and lawful attorneys-in-fact and agents, with full power of substitution and resubstitution, for him and in his name, place and stead, in any and all capacities, to sign any and all amendments (including post-effective amendments) to this Annual Report on Form 10-K, and to file the same, with all exhibits thereto, and other documents in connection therewith, with the Securities and Exchange Commission, granting unto said attorneys-in-fact and agents, and each of them, full power and authority to do and perform each and every act and thing requisite and necessary to be done in connection therewith, as fully to all intents and purposes as he might or could do in person, hereby ratifying and confirming all that said attorneys-in-fact and agents, or any of them, or their or his substitutes, may lawfully do or cause to be done by virtue thereof. Pursuant to the requirements of the Securities Exchange Act of 1934, this report has been signed below by the following persons on behalf of the Company and in the capacities and on the dates indicated: Signature Title Date /s/ THOMAS GEORGENS Chief Executive Officer, President and June 18, 2010 Thomas Georgens Director, (Principal Executive Officer and Principal Operating Officer) /s/ NICHOLAS G. MOORE Lead Independent Director June 18, 2010 Nicholas G. Moore /s/ STEVEN J. GOMO Executive Vice President of Finance and June 18, 2010 Steven J. Gomo Chief Financial Officer (Principal Financial Officer and Principal Accounting Officer) /s/ DANIEL J. WARMENHOVEN Executive Chairman of the Board June 18, 2010 Daniel J. Warmenhoven /s/ ALAN EARHART Director June 18, 2010 Alan Earhart Director Donald T. Valentine 106
  • 107.
    Signature Title Date /s/ MARK LESLIE Director June 18, 2010 Mark Leslie /s/ ROBERT T. WALL Director June 18, 2010 Robert T. Wall Director George T. Shaheen /s/ JEFFRY R. ALLEN Director June 18, 2010 Jeffry R. Allen /s/ T. MICHAEL NEVENS Director June 18, 2010 T. Michael Nevens /s/ GERALD HELD Director June 18, 2010 Gerald Held 107
  • 108.
    SCHEDULE II. NETAPP, INC. VALUATION AND QUALIFYING ACCOUNTS Years Ended April 30, 2010, April 24, 2009, and April 25, 2008 Additions Charged Balance at (Credited) to Balance Beginning Costs and Reductions at End of Description of Period Expenses and Write-offs Period Allowance for doubtful accounts: 2010. . . . . . . . . . . . . . . . . . . . . . . . . . . . . . . . . . . . . . $3.1 $— $1.5 $1.6 2009. . . . . . . . . . . . . . . . . . . . . . . . . . . . . . . . . . . . . . $2.4 $1.1 $0.4 $3.1 2008. . . . . . . . . . . . . . . . . . . . . . . . . . . . . . . . . . . . . . $2.6 $0.8 $1.0 $2.4 108
  • 109.
    EXHIBIT INDEX Exhibit No Description 2.1(3) Agreement and Plan of Merger, dated as of November 3, 2003, by and among NetApp, Inc., Nagano Sub, Inc., and Spinnaker Networks, Inc. 2.2(7) Agreement and Plan of Merger and Reorganization, dated as of June 15, 2005, by and among NetApp Inc., Dolphin Acquisition Corp., and Decru, Inc. 2.3(23)† Agreement and Plan of Merger, dated as of May 20, 2009, by and among the Company, Kentucky Merger Sub One Corporation, Derby Merger Sub Two LLC and Data Domain, Inc. 2.4(23) Amendment No. 1 to Agreement and Plan of Merger, dated June 3, 2009, by and among the Company, Kentucky Merger Sub One Corporation, Derby Merger Sub Two LLC and Data Domain, Inc. 2.5(24) Termination Notice to the Merger Agreement, dated July 8, 2009, by and among NetApp, Inc., Data Domain, Inc., Kentucky Merger Sub One Corporation, a direct, wholly owned subsidiary of NetApp, Inc., and Derby Merger Sub Two LLC, a direct, wholly owned subsidiary of NetApp, Inc. 3.1(18) Certificate of Incorporation of the Company, as amended. 3.2(28) Bylaws of the Company, as amended. 4.1(20) Indenture for 1.75% Convertible Senior Notes Due 2013, dated as of June 10, 2008, by and between U.S. Bank National Association, as Trustee, and the Company. 4.2(20) Registration Rights Agreement, dated as of June 10, 2008, by and among Goldman, Sachs & Co., Morgan Stanley & Co. Incorporated and the Company. 10.1(28)* Revised Form of Indemnification Agreement, dated December 17, 2009, by and between the Company and each of its directors and officers. 10.2(26)* The Company’s Amended and Restated Change of Control Severance Agreement (CEO) 10.3(26)* The Company’s Amended and Restated Change of Control Severance Agreement (Executive Chairman). 10.4(19)* Form of Change of Control Severance Agreements (Non-CEO Executives) 10.5(25)* The Company’s Amended and Restated Executive Compensation Plan. 10.6(6)* The Company’s Deferred Compensation Plan. 10.7(25)* The Company’s Amended and Restated Employee Stock Purchase Plan. 10.8(1)* The Company’s Amended and Restated 1995 Stock Incentive Plan. 10.9(11) Form of Stock Option Agreement approved for use under the Company’s amended and restated 1995 Stock Option Plan 10.10(11) Form of Stock Option Agreement approved for use under the Company’s amended and restated 1995 Stock Option Plan (Restricted Stock Agreement). 10.11(11) Form of Stock Option Agreement approved for use under the Company’s amended and restated 1995 Stock Option Plan (Chairman of the Board or any Board Committee Chairperson). 10.12(25)* The Company’s Amended and Restated 1999 Stock Option Plan. 10.13(11) Form of Stock Option Agreement approved for use under the Company’s amended and restated 1999 Stock Option Plan. 10.14 Form of Restricted Stock Unit Agreement approved for use under the Company’s amended and restated 1999 Stock Option Plan Employees. 10.15(11) Form of Stock Option Agreement approved for use under the Company’s amended and restated 1999 Stock Option Plan (Non-Employee Director Automatic Stock Option — Initial). 10.16(11) Form of Stock Option Agreement approved for use under the Company’s amended and restated 1999 Stock Option Plan (Non-Employee Director Automatic Stock Option — Annual). 10.17 Form of Restricted Stock Unit Agreement approved for use under the Company’s amended and restated 1999 Stock Option Plan (Non-Employees Directors). 10.18(11) Form of Stock Option Agreement approved for use under the Company’s amended and restated 1999 Stock Option Plan (China). 10.19(11) Form of Stock Option Agreement approved for use under the Company’s amended and restated 1999 Stock Option Plan (France).
  • 110.
    Exhibit No Description 10.20(11) Form of Stock Option Agreement approved for use under the Company’s amended and restated 1999 Stock Option Plan (India). 10.21(11) Form of Stock Option Agreement approved for use under the Company’s amended and restated 1999 Stock Option Plan (United Kingdom). 10.22(18) Form of Stock Option Agreement approved for use under the Company’s amended and restated 1999 Stock Option Plan (Israel). 10.23(22)* WebManage Technologies, Inc. 1999 Stock Option Plan. 10.24 (4)* Spinnaker Networks, Inc. 2000 Stock Plan. 10.25 (5)* Alacritus, Inc. 2005 Stock Plan. 10.26(8) Form of Stock Option Grant Notice and Option Agreement under the Decru, Inc. Amended and Restated 2001 Equity Incentive Plan and the 2001 Equity Incentive Plan filed under Attachment II. 10.27(8) Form of Stock Option Grant Notice and Option Agreement under the Decru, Inc. 2001 Equity Incentive Plan and the 2001 Equity Incentive Plan filed under Attachment II. 10.28(8) Form of Restricted Stock Bonus Grant Notice and Agreement under the Decru, Inc. 2001 Equity Incentive Plan. 10.29 (13)* SANPro Systems, Inc. 2001 U.S. Stock Option Plan. 10.30 (17)* Onaro, Inc. Amended and Restated 2002 Stock Option and Incentive Plan (including Appendix — Israeli Taxpayers). 10.31(2) Patent Cross License Agreement, dated as of October 1, 2000, by and between Intel Corporation and the Company. 10.32 (9) Asset Purchase Agreement, dated June 20, 2003, by and between Auspex Systems, Inc. and the Company. 10.33(10) Purchase and Sale Agreement, dated July 27, 2004 by and between Cisco Systems, Inc. and the Company. 10.34(14) Master Confirmation, dated March 19, 2007, by and between JP Morgan Securities Inc. and the Company. 10.35(15) Master Confirmation, dated August 13, 2007, by and between Bank of America, N.A. and the Company. 10.36(18) Amended and Restated Closing Certificate and Agreement (Building 7), dated November 29, 2007, by and between BNP Paribas Leasing Corporation and the Company. 10.37(18) Amended and Restated Construction Agreement (Building 7), dated November 29, 2007, by and between BNP Paribas Leasing Corporation and the Company. 10.38(18) Amended and Restated Lease Agreement (Building 7), dated November 29, 2007, by and between BNP Paribas Leasing Corporation and the Company. 10.39(18) Amended and Restated Common Definitions and Provisions Agreement (Building 7), dated November 29, 2007, by and between BNP Paribas Leasing Corporation and the Company. 10.40(18) Amended and Restated Purchase Agreement (Building 7), dated November 29, 2007, by and between BNP Paribas Leasing Corporation and the Company. 10.41(18) Amended and Restated Ground Lease (Building 7), dated November 29, 2007, by and between BNP Paribas Leasing Corporation and the Company. 10.42(18) First Modification Agreement (Building 7), dated as of April 9, 2008, by and between BNP Paribas Leasing Corporation and the Company. 10.43(16) Closing Certificate and Agreement (Moffett Business Center), dated November 29, 2007, by and between BNP Paribas Leasing Corporation and the Company. 10.44(16) Lease Agreement (Moffett Business Center), dated November 29, 2007, by and between BNP Paribas Leasing Corporation and the Company. 10.45(16) Common Definitions and Provisions Agreement (Moffett Business Center), dated November 29, 2007, by and between BNP Paribas Leasing Corporation and the Company. 10.46(16) Purchase Agreement (Moffett Business Center), dated November 29, 2007, by and between BNP Paribas Leasing Corporation and the Company.
  • 111.
    Exhibit No Description 10.47(18) First Modification Agreement (Moffett Business Center), dated as of April 9, 2008, by and between BNP Paribas Leasing Corporation and the Company. 10.48(16) Closing Certificate and Agreement (1299 Orleans), dated November 29, 2007, by and between BNP Paribas Leasing Corporation and the Company. 10.49(16) Lease Agreement (1299 Orleans), dated November 29, 2007, by and between BNP Paribas Leasing Corporation and the Company. 10.50(16) Common Definitions and Provisions Agreement (1299 Orleans), dated November 29, 2007, by and between BNP Paribas Leasing Corporation and the Company. 10.51(16) Purchase Agreement (1299 Orleans), dated November 29, 2007, by and between BNP Paribas Leasing Corporation and the Company. 10.52(18) First Modification Agreement (1299 Orleans), dated as of April 9, 2008, by and between BNP Paribas Leasing Corporation and the Company. 10.53(27) Agreement to Sell, dated as of November 18, 2009, by and between Bhoruka Financial Services Limited, as Seller, and NetApp India Private Limited, as Buyer. 10.54(20) Form of Convertible Bond Hedge Confirmation. 10.55(20) Form of Warrant Confirmation. 10.56(20) Form of Amendment to Warrant Confirmation. 10.57(21) Settlement Agreement entered into among the U.S.A, acting through the United States Department of Justice and on behalf of the General Services Administration, the Company and Igor Kapuscinski. 21.1 Subsidiaries of the Company. 23.1 Consent of Independent Registered Public Accounting Firm. 24.1 Power of Attorney (see signature page). 31.1 Certification of the Chief Executive Officer pursuant to Section 302(a) of the Sarbanes-Oxley Act of 2002. 31.2 Certification of the Chief Financial Officer pursuant to Section 302(a) of the Sarbanes-Oxley Act of 2002. 32.1 Certification of Chief Executive Officer pursuant to 18 U.S.C. Section 1350, as adopted pursuant to section 906 of the Sarbanes-Oxley Act of 2002. 32.2 Certification of Chief Financial Officer pursuant to 18 U.S.C. Section 1350, as adopted pursuant to section 906 of the Sarbanes-Oxley Act of 2002. (1) Previously filed as an exhibit to the Company’s Proxy Statement dated August 21, 1998. (2) Previously filed as an exhibit to the Company’s Quarterly Report on Form 10-Q dated March 12, 2001. (3) Previously filed as an exhibit to the Company’s Current Report on Form 8-K dated February 27, 2004. (4) Previously filed as an exhibit to the Company’s Form S-8 registration statement dated March 1, 2004. (5) Previously filed as an exhibit to the Company’s Form S-8 registration statement dated June 2, 2005. (6) Previously filed as an exhibit to the Company’s Current Report on Form 8-K dated July 7, 2005. (7) Previously filed as an exhibit to the Company’s Quarterly Report on Form 10-Q dated September 2, 2005. (8) Previously filed as an exhibit to the Company’s Form S-8 registration statement dated September 2, 2005. (9) Previously filed as an exhibit to the Company’s Quarterly Report on Form 10-Q dated September 3, 2003. (10) Previously filed as an exhibit to the Company’s Quarterly Report on Form 10-Q dated August 31, 2004. (11) Previously filed as an exhibit to the Company’s Annual Report on Form 10-K dated July 8, 2005. (12) Previously filed as an exhibit to the Company’s Annual Report on Form 10-K dated July 12, 2006. (13) Previously filed as an exhibit to the Company’s Form S-8 registration statement dated January 5, 2007. (14) Previously filed as an exhibit to the Company’s Annual Report on Form 10-K dated June 26, 2007. (15) Previously filed as an exhibit to the Company’s Quarterly Report on Form 10-Q dated December 4, 2007.
  • 112.
    (16) Previously filedas an exhibit to the Company’s Quarterly Report on Form 10-Q dated March 5, 2008. (17) Previously filed as an exhibit to the Company’s Form S-8 registration statement dated February 25, 2008. (18) Previously filed as an exhibit to the Company’s Annual Report on Form 10-K dated June 24, 2008. (19) Previously filed as an exhibit to the Company’s Quarterly Report on Form 10-Q dated September 3, 2008. (20) Previously filed as an exhibit to the Company’s Current Report on Form 8-K dated June 10, 2008. (21) Previously filed as an exhibit to the Company’s Annual Report on Form 10-K dated June 17, 2009. (22) Previously filed as an exhibit to the Company’s S-8 registration statement dated January 16, 2001. (23) Previously filed as an exhibit to Registration Statement on Form S-4, as filed with the SEC on June 4, 2009. (24) Previously filed as an exhibit to the Company’s Quarterly Report on Form 10-Q dated September 4, 2009. (25) Previously filed as exhibits to the Company’s Proxy Statement dated August 20, 2009. (26) Previously filed as an exhibit to the Company’s Quarterly Report on Form 10-Q dated December 2, 2009. (27) Previously filed as an exhibit to the Company’s Current Report on Form 8-K dated November 25, 2009. (28) Previously filed as an exhibit to the Company’s Quarterly Report on Form 10-Q dated March 1, 2010. * Identifies management plan or compensatory plan or arrangement. † The schedules and other attachments to this exhibit have been omitted. The Company agrees to furnish a copy of any omitted schedules or attachments to the SEC upon request.
  • 113.
    TRADEMARKS ·Copyright 2010 NetApp, Inc. All rights reserved. No portions of this document may be reproduced without prior written consent of NetApp, Inc. NetApp, the NetApp logo, Go further, faster, DataFabric, Data ONTAP, FAServer, FilerView, FlexCache, FlexClone, FlexShare, FlexVol, MultiStore, NearStore, Network Appliance, SecureShare, SnapDrive, SnapLock, SnapManager, SnapMirror, SnapRestore, Snapshot, SnapVault, and WAFL are trademarks or registered trademarks of NetApp, Inc. in the United States and/or other countries. Windows is a registered trademark of Microsoft Corporation. Linux is a registered trademark of Linus Torvalds. UNIX is a registered trademark of The Open Group. All other brands or products are trademarks or registered trademarks of their respective holders and should be treated as such.