Beginners Guide to TikTok for Search - Rachel Pearson - We are Tilt __ Bright...
Ncaer top cities 2008
1. future capital research
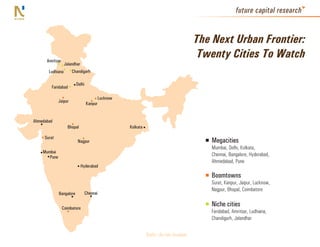
The Next Urban Frontier:
Amritsar
Twenty Cities To Watch
Jalandhar
Ludhiana Chandigarh
Delhi
Faridabad
Lucknow
Jaipur
Kanpur
Ahmedabad
Bhopal Kolkata
Surat
Nagpur Megacities
Mumbai, Delhi, Kolkata,
Mumbai
Pune Chennai, Bangalore, Hyderabad,
Ahmedabad, Pune
Hyderabad
Boomtowns
Surat, Kanpur, Jaipur, Lucknow,
Nagpur, Bhopal, Coimbatore
Bangalore Chennai
Coimbatore
Niche cities
Faridabad, Amritsar, Ludhiana,
Chandigarh, Jalandhar
Draft—do not circulate
2. future capital research
The top twenty cities make up less than 10% of India’s population,
but generate more than 30% of income
Urban
Share of total (%) Rural All India
Megacities Boomtowns Niche cities Other cities Total urban
Households 69.3 8.1 1.9 0.7 20.1 30.7 100.0
Population 70.5 7.4 1.8 0.7 19.7 29.5 100.0
Income 56.0 24.6 4.5 1.7 13.1 44.0 100.0
Expenditure 63.9 16.4 3.4 1.3 15.0 36.1 100.0
Surplus income 32.5 49.0 7.9 2.9 7.7 67.5 100.0
Source: NCAER/FCR
01
Draft—do not circulate
3. future capital research
Boomtowns register the fastest economic growth
Household Income Growth (2004-8,%yoy)
18 Household Income Growth (2004-8,%yoy)
16
14
12
10
8
6
4
2
0
Ch h
Ja nai
me r
d
Ba ana
All alore
Mu ur
Hy ndia
Lu ai
an i
ad
Na t
Lu ow
Am es
Fa DIA
of e
Ko d
im a
e
al
ar
Bh r
ar
Ch Delh
Ah gpu
ra
u
Re Pun
Co lkat
tor
ba
ar
a
mb
op
rits
dh
ip
np
i
ab
rab
cit
Su
en
ckn
dig
i
da
IN
Ja
ba
dh
I
lan
Ka
rid
ng
de
20
st
Source: NCAER/FCR
02
Draft—do not circulate
4. future capital research
Surat is a standout
2007-8 Average Household Income, 2007-8 Average Household Income (Rs/household),
(Rs/household) Adjusted for Cost of Living
Chandigarh 484,775 Surat 457,671
Mumbai 459,457 Chandigarh 422,503
Surat 431,201 Mumbai 403,059
Delhi 408,237 Delhi 337,678
Chennai 337,059 Ahmedabad 328,267
Ahmedabad 317,856 Jaipur 325,254
Nagpur 308,625 Jalandhar 323,181
Bangalore 300,678 Chennai 319,759
Jaipur 300,374 Bangalore 302,371
Jalandhar 296,651 Nagpur 298,598
Kolkata 287,199 Amritsar 290,939
Lucknow 280,393 Lucknow 289,020
Hyderabad 273,353 Ludhiana 288,753
Ludhiana 271,514 Hyderabad 275,408
Amritsar 267,056 Kolkata 262,247
Faridabad 252,558 Faridabad 246,129
Coimbatore 219,846 Coimbatore 231,963
Pune 210,458 Pune 191,520
Bhopal 165,210 Kanpur 164,677
Kanpur 159,761 Bhopal 157,847
Source: NCAER/FCR 03
Draft—do not circulate
5. future capital research
More than half of households will be middle class by 2016
Low Income Aspirants
% of total population Middle Class High Income
100
80
60
40
20
0
1998-99 2001-2 2004-5 2007-8 (E) 2015-16 (E)
Source: NCAER/FCR 04
Draft—do not circulate
6. future capital research
The high-income segment will triple by 2016, quadruple in boomtowns
Number of Households (thousands)
16,000 2007-8
2015-16
14,000
12,000
10,000
8,000
6,000
4,000
2,000
0
Low Income Aspirants Middle Class High Income
Source: NCAER/FCR
05
Draft—do not circulate
7. future capital research
Middle class ownership patterns vary across cities
Middle Class Penetration Rates (% of middle class households) Megacities Boomtowns Niche cities
Car 57.48 43.45 46.79
Motorcycle 47.08 60.85 43.66
Mobile phone 76.81 79.05 76.23
Television 90.46 87.42 85.78
DVD Player 63.13 63.19 59.16
Computer 16.76 20.12 16.80
Refrigerator 90.20 89.52 91.34
Washing Machine 65.98 55.28 62.03
Microwave Oven 13.68 14.12 14.30
Air Conditioner 9.95 14.19 9.80
Source: NCAER/FCR
06
Draft—do not circulate
8. future capital research
Product ownership by income: All twenty cities
High Income Middle Class Aspirants Low Income
Share of total ownership (%)
100
80
60
40
20
0
Washing Machine
Mobile Phone
Refrigerator
Microwave Oven
DVD Player
AC
Car
Motorcycle
Computer
TV
Source: NCAER/FCR
07
Draft—do not circulate
9. future capital research
Changes in asset ownership patterns across cities:
Car / Mobile distribution by income group
High Income Middle Aspirants Low Income
Share of total ownership (%)
100
80
60
40
20
0
Megacities
Niche cities
Megacities
Niche cities
All 20 cities
Boomtowns
All 20 cities
Boomtowns
Car Mobile Phone
Source: NCAER/FCR 08
Draft—do not circulate
10. future capital research
Spending propensities span a dramatic range
Household consumption expenditure as a share of income, %
90 Spending Propensities
80
70
60
50
40
30
20
10
0
al
ar
Hy lore
arh
Fa re
Am d
Lu d
a
i
d
Co npur
ta
ne
ur
Ba pur
ar
ow
Lu hi
me i
Ch urat
na
Ah mba
ian
a
a
ba
op
l
dh
to
lka
rits
gp
De
ab
Pu
rab
en
ckn
dig
i
da
a
Ja
ba
S
dh
Bh
lan
Ka
Na
rid
Mu
Ko
ng
Ch
de
an
im
Ja
Source: NCAER/FCR
09
Draft—do not circulate
11. future capital research
Composition of household expenditure
% of total consumption expenditure
100 2.9% 3.1% 2.9% Communication
90 14.3% 16.0%
10.0% Household and personal products
5.5% Education and recreation
80 4.6%
5.2% 5.3% Apparel
5.9%
7.4% 8.8%
Health care
70 7.0% Housing and utilities
7.6%
13.1%
Transportation
60 10.4%
Food, beverages and tobacco
8.0%
50
20.3% 20.1%
21.3%
40
30
20 34.6% 34.4%
31.5%
10
0
Megacities Boomtowns Niche cities
Source: NCAER/FCR 10
Draft—do not circulate
12. future capital research
Megacity households spend the least on average on education and recreation
Rs/household/annum
70,000 Megacities Boomtowns Niche cities
2007-8 estimates
60,000
50,000
40,000
30,000
20,000
10,000
0
Food/ Transport Household/ Housing Health Apparel Education/ Communication
Beverage personal care Recreation
Source: NCAER/FCR
11
Draft—do not circulate
13. future capital research
Surplus income rates in the top cities are nearly double the national average
Surplus Income Rate (% of household income)
60
50
40
30
20
10
0
All 20 Cities Megacities Boomtowns Niche cities Urban Rural All India
Source: NCAER/FCR
12
Draft—do not circulate
14. future capital research
19% of households prefer to keep surplus income at home
Keep at home Deposit in bank Deposit in post office
Deposit in co-operative society Purchase insurance policies Others
% of households
100
80
60
40
20
0
Megacities Niche cities Boomtowns All 20 cities
Source: NCAER/FCR
13
Draft—do not circulate
15. future capital research
Households overwhelmingly draw on savings to cope with shocks
% of households who faced economic shock
90 Death of chief earner
Major sickness of any household member
80 Household/business loss
70
60
50
40
30
20
10
0
Using own Loan from Loan from Selling Financial Others
savings friends/relatives employer land/jewellery institutions/Bank
Source: NCAER/FCR
14
Draft—do not circulate
16. future capital research
Niche cities have the highest asset penetration, but lowest financial penetration
% of households
50 Boomtowns Megacities Niche cities
45
40
35
30
25
20
15
10
5
0
Life Insurance Loans Credit Card
Source: NCAER/FCR 15
Draft—do not circulate
17. future capital research
Nagpur leads in insurance penetration
Life Insurance penetration (% of households)
80
70
60
50
40
30
20
10
0
re
Ah abad
Hy nai
Ba pur
ne
ta
Ja ur
e
Mu i
Fa bai
Lu al
a
Ch urat
arh
Co dhar
d
Lu ur
ow
Am d
ar
lh
ian
tor
ba
a
op
alo
lka
rits
ip
np
De
Pu
rab
en
m
ckn
dig
g
da
Ja
ba
S
dh
Bh
lan
Na
Ka
rid
Ko
ng
Ch
de
me
an
im
Source: NCAER/FCR
16
Draft—do not circulate
18. future capital research
Coimbatore and Jaipur have the highest credit card penetration
Credit card penetration (% of households)
14
12
10
8
6
4
2
0
i
Ja ana
Hy dhar
Ch r
Lu ad
al
e
Na i
Mu r
re
20 i
Ba ities
me t
d
Fa ne
Ko d
Ch lkata
arh
Am ur
Lu ar
ow
na
lh
All mba
ipu
u
Ah Sura
tor
ba
a
op
alo
rits
gp
np
De
Pu
ab
rab
en
ckn
dig
i
da
Ja
ba
c
dh
Bh
lan
Ka
rid
ng
de
an
im
Co
Source: NCAER/FCR
17
Draft—do not circulate