Stochastic Models of Noncontractual Consumer Relationships
•
2 likes•2,482 views

Master thesis, which introduces a newly derived stochastic prediction model for customer lifetime values, that is able to incorporate regularities within the transaction timings of the customer base.

Recommended
More Related Content
What's hot
Similar to Stochastic Models of Noncontractual Consumer Relationships
Similar to Stochastic Models of Noncontractual Consumer Relationships (20)
More from MOSTLY AI
More from MOSTLY AI (10)
Recently uploaded
Recently uploaded (20)
Stochastic Models of Noncontractual Consumer Relationships
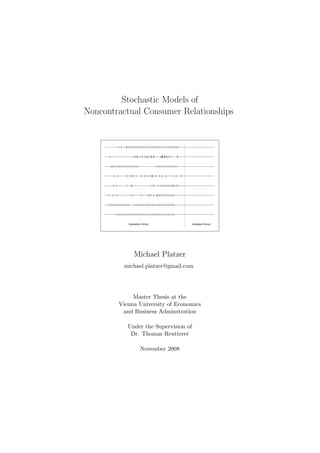
- 1. Stochastic Models of Noncontractual Consumer Relationships | | || | | | | | | | | | | | | | | | | | | | | | | | | | | | | | | | || | | | | | | || || | ||| | | | | | || || | | | | | | | | | | | | | | | | | | | | | | | | | | | | | | || | | | | | || | | | | | | | | | | || | | | | | | | | | | | | | | | | | | | | || | || | | | | | | | | | | | | | | | | | | | | | | | | | | | | | | | | | | | | | | | | | | | | | | | | | | | | | | | | | | | | | | | | | | | | | | | | | | | | | Calibration Period Validation Period Michael Platzer michael.platzer@gmail.com Master Thesis at the Vienna University of Economics and Business Adminstration Under the Supervision of Dr. Thomas Reutterer November 2008
- 2. Dedicated to my Mom & Dad
- 3. Abstract The primary goal of this master thesis is to evaluate several well-established probabilistic models for forecasting customer behavior in noncontractual set- tings on an individual level. This research has been carried out with the particular purpose of participating in a lifetime value competition that has been organized by the Direct Marketing Educational Foundation throughout fall 2008. First, an in-depth exploratory analysis of the provided contest data set is undertaken, with its key characteristics being displayed in several in- formative visualizations. Subsequently, the NBD (Ehrenberg, 1959), the Pareto/NBD (Schmittlein et al., 1987), the BG/NBD (Fader et al., 2005a) and the CBG/NBD (Hoppe and Wagner, 2007) model are applied on the data. Since the data seems to violate the Poisson assumption, which is a prevalent assumption regarding the random nature of the transaction timing process, the presented models produce rather mediocre results. This becomes apparent as we will show that a simple linear regression model outperforms these probabilistic models for the contest data. As a consequence a new variant based on the CBG/NBD model, namely the CBG/CNBD-k model, is being developed. This model is able to take a certain degree of regularity in the timing process into account by modeling Erlang-k intertransaction times, and thereby delivers considerably better predictions for the data set at hand. Out of 25 participating teams at the contest the model finished at second place, only marginally behind the winning model. A result that demonstrates that under certain conditions this newly developed variant is able to outperform numerous other existent, in particular stochastic models. Keywords: marketing, consumer behavior, lifetime value, stochastic predic- tion models, customer base analysis, Pareto/NBD, regularity i
- 4. Contents Abstract i 1 Introduction 1 1.1 Background . . . . . . . . . . . . . . . . . . . . . . . . . . . . . 1 1.2 Problem Scope . . . . . . . . . . . . . . . . . . . . . . . . . . . . 2 1.3 Discussed Models . . . . . . . . . . . . . . . . . . . . . . . . . . 3 1.4 Usage Scenarios . . . . . . . . . . . . . . . . . . . . . . . . . . . 4 2 DMEF Competition 6 2.1 Contest Details . . . . . . . . . . . . . . . . . . . . . . . . . . . 6 2.2 Data Set . . . . . . . . . . . . . . . . . . . . . . . . . . . . . . . 7 2.3 Game Plan . . . . . . . . . . . . . . . . . . . . . . . . . . . . . . 8 3 Exploratory Data Analysis 11 3.1 Key Summary . . . . . . . . . . . . . . . . . . . . . . . . . . . . 11 3.2 Distribution of Individual Donation Behavior . . . . . . . . . . 13 3.3 Trends on Aggregated Level . . . . . . . . . . . . . . . . . . . . 15 3.4 Distribution of Intertransaction Times . . . . . . . . . . . . . . 19 4 Forecast Models 21 4.1 NBD Model . . . . . . . . . . . . . . . . . . . . . . . . . . . . . 21 4.2 Pareto/NBD Model . . . . . . . . . . . . . . . . . . . . . . . . . 28 4.3 BG/NBD Model . . . . . . . . . . . . . . . . . . . . . . . . . . . 33 4.4 CBG/NBD Model . . . . . . . . . . . . . . . . . . . . . . . . . . 37 ii
- 5. CONTENTS iii 5 Model Comparison 41 5.1 Parameter Interpretation . . . . . . . . . . . . . . . . . . . . . . 41 5.2 Data Fit . . . . . . . . . . . . . . . . . . . . . . . . . . . . . . . 42 5.3 Forecast Accuracy . . . . . . . . . . . . . . . . . . . . . . . . . . 44 5.4 Simple Forecast Benchmarks . . . . . . . . . . . . . . . . . . . 51 5.5 Error Composition . . . . . . . . . . . . . . . . . . . . . . . . . 52 6 CBG/CNBD-k Model 56 6.1 Regularity . . . . . . . . . . . . . . . . . . . . . . . . . . . . . . 56 6.2 Assumptions . . . . . . . . . . . . . . . . . . . . . . . . . . . . . 61 6.3 Comparison of Models . . . . . . . . . . . . . . . . . . . . . . . 64 6.4 Final Model . . . . . . . . . . . . . . . . . . . . . . . . . . . . . 69 7 Conclusion 72 A Derivation of CBG/CNBD-k 74 A.1 Assumptions . . . . . . . . . . . . . . . . . . . . . . . . . . . . . 74 A.2 Erlang-k . . . . . . . . . . . . . . . . . . . . . . . . . . . . . . . 75 A.3 Individual Likelihood . . . . . . . . . . . . . . . . . . . . . . . . 76 A.4 Aggregate Likelihood . . . . . . . . . . . . . . . . . . . . . . . . 77 A.5 Parameter Estimation . . . . . . . . . . . . . . . . . . . . . . . 79 A.6 Probability Distribution of Purchase Frequencies . . . . . . . . 79 A.7 Probability of Being Active . . . . . . . . . . . . . . . . . . . . 81 A.8 Expected Number of Transactions . . . . . . . . . . . . . . . . 83 A.9 Concluding Remarks . . . . . . . . . . . . . . . . . . . . . . . . 88 Bibliography 89
- 6. Chapter 1 Introduction 1.1 Background Over 80% of those companies that participated in a German study on the usage of information instruments in retail controlling regarded the concept of customer lifetime value as useful (Schr¨der et al., 1999, p. 9). But only less o than 10% actually had a working implementation at that time. No other con- sumer related information, for example customer satisfaction, penetration or sociodemographic variables, showed such a big discrepancy between assessed usefulness and actual usage. Therefore, accurate lifetime value models can be expected to become, despite but also because of their inherent challenging complexity, a crucial information advance in highly competitive markets. Typical fundamental managerial questions that arise, are (Schmittlein et al., 1987; Morrison and Schmittlein, 1988): • How much is my current customer base worth? • How many purchases, and which sales volume can I expect from my client`le in the future? e • How many customers are still active customers? Who has already, and who will likely defect? • Who will be my most, respectively my least profitable customers? • Who should we target with a specific marketing activity? • How much of the sales volume has been attributed to such a marketing activity? 1
- 7. CHAPTER 1. INTRODUCTION 2 And a key part for finding answers to those questions is the accurate assess- ment of lifetime value on an aggregated as well as on an individual level. Hardly any organization can afford to make budget plans for the upcoming period without making careful estimations regarding the future sales. Such estimates on the aggregate level are therefore widely common and numerous methods exist which range from simple managerial heuristics to advanced time series analyses. Fairly more challenging is the prediction of future sales broken down between trial and repetitive customers. And, considering how little information we have on an individual level, an even more demanding task is the accurate forecasting for each single client. Nevertheless, the increasing prevalence of computerized transaction systems and the drop in data storage costs, which we have seen over the past decade, provide more and more companies with customer databases coupled with large records of transaction history (‘Who bought which product at what price at what time?’). But the sheer data itself is no good unless models and tools are implemented that condense the desired characteristics, trends and forecasts out of the data. Such tools are nowadays commonly provided as part of customer relationship management software, which enables the orga- nizations to act and react individually to each customer. The heterogeneity in one’s customer base is thereby taken into account and this allows a further optimization of marketing activities and their efficiency.1 And one essential information bit for CRM implementations is the (monetary) valuation of an individual customer (Rosset et al., 2003, p. 321). 1.2 Problem Scope The primary focus of this thesis is the evaluation and implementation of sev- eral probabilistic models for forecasting customer behavior in noncontractual settings on an individual level. This research has been carried out with the main focus on participating in a lifetime value competition which has been organized by the Direct Marketing Educational Foundation in fall 2008. The limitations of the research scope in this thesis are fairly well defined by the main task of the competition, which is the estimation of the future pur- chase amount for an existent customer base on a disaggregated level based 1 Clustering a customer base into segments can be seen as a first step in dealing with heterogeneity. But one-to-one marketing, as it is described here, is the consequent contin- uation of this approach.
- 8. CHAPTER 1. INTRODUCTION 3 upon transaction history. Therefore, we will not provide a complete overview of existing lifetime value models (see Gupta et al. (2006) for such an overview) but will rather focus on models that can make such accurate future predic- tions on an individual level. Due to the large amount of one-time purchases and the long time span of the data, we have to use models that can also incorporate the defection of customers in addition to modeling the purchase frequency. Furthermore, we are faced with noncontractual consumer relationships, a characteristic that is widely common but which unfortunately adds considerably some complexity to the forecasting task (Reinartz and Kumar, 2000). The difficulty arises because no definite information regarding the status of a customer-firm rela- tionship is available. Neither now nor later. This means that it is impossible to tell whether a specific customer is still active or whether he/she has already defected. On the contrary to that, in a contractual setting2 , such as the client base of a telecommunication service provider, it is known when a customer cancels his/her contract and is therefore lost for good.3 In a noncontractual setting, such as retail shoppers, air carrier passengers or donors for a NPO, we cannot observe the current status of a customer-firm relationship (i.e. it is a latent variable), but rather rely on other data, such as the transaction history to make proper judgments. Therefore we will limit our research to models that can handle this kind of uncertainty. Further, because the data set only provides transaction records,4 the empha- sis is put on models that extract the most out of the transaction history and do not rely on incorporating other covariates, such as demographic variables, competition activity or other exogenous variables. 1.3 Discussed Models Table 1.1 displays an overview of the probabilistic models that are being evaluated and applied upon the competition data within this thesis. Firstly, the seminal work by Ehrenberg who proposed the negative binomial 2 Also known as subscription-based setting. 3 Models that explicitly model churn rates are, among others, logistic regression models and survival models. See Rosset et al. (2003) and Mani et al. (1999) for examples of the latter kind of models. 4 Actually it also includes detailed records of direct marketing activities, but we neglect this data, as such data is not available for the target period. See section 2.3 for a further reasoning.
- 9. CHAPTER 1. INTRODUCTION 4 Model Author(s) Year NBD Ehrenberg 1959 Pareto/NBD Schmittlein, Morrison, and Colombo 1987 BG/NBD Fader, Hardie, and Lee 2005 CBG/NBD Hoppe and Wagner 2007 CBG/CNBD-k Platzer 2008 Table 1.1: Overview of Presented Models distribution (NBD) in 1959 as a model for repeated buying is investigated in detail in section 4.1. Further, we will evaluate the well-known Pareto/NBD model (section 4.2) and two of its variants, the BG/NBD (section 4.3) and the CBG/NBD (section 4.4) model, which are all extensions of the NBD model but make additional assumptions regarding the defection process and its heterogeneity among customer. In order to get a feeling for the forecast accuracy of these probabilistic models, we will subsequently also benchmark them against a simple linear regression model. Finally, the CBG/CNBD-k model, which is a new variant of the CBG/NBD model, will be introduced in chapter 6. This model makes differing assump- tions regarding the timing of purchases, in particular it considers a certain extent of regularity and thereby will improve forecast quality considerably for the competition data set. Detailed derivations for this model are provided in appendix A. 1.4 Usage Scenarios But before diving into the details of the present models, we try to further increase the reader’s motivation by providing some common usage scenarios of noncontractual relations with repeated transactions. The following list contains usage scenarios which have already been studied in various articles and which should give an idea of the broad field of applications for such models. • Customers of the online music store CDNOW (Fader et al., 2005a). This data set is also publicly available at http://brucehardie.com/ notes/008/, and has been used in numerous other articles (Abe, 2008; Hoppe and Wagner, 2007; Batislam et al., 2007; Fader et al., 2005c;
- 10. CHAPTER 1. INTRODUCTION 5 Fader and Hardie, 2001; W¨bben and von Wangenheim, 2008) to bench- u mark the quality of various models. • Clients of a financial service broker (Schmittlein et al., 1987). • Members of a frequent shopper program at a department store in Japan (Abe, 2008). • Consumers buying at a grocery store (Batislam et al., 2007). Individual data can be collected by providing client-cards that are being combined with some sort of loyalty program. • Business customers of an office supply company (Schmittlein and Pe- terson, 1994). • Clients of a catalog retailer (Hoppe and Wagner, 2007). But, citing W¨bben and von Wangenheim (2008, p. 82), whenever ‘a cus- u tomer purchases from a catalog retailer, walks off an aircraft, checks out of a hotel, or leaves a retail outlet, the firm has no way of knowing whether and how often the customer will conduct business in the future’. And as such the usage scenarios are practically unlimited. One other example from the author’s own business experience is the challenge to assess the number of active users of a free webservice, such as a blogging platform. Users can be uniquely identified by a permanent cookie stored in the browser client, when they access the site. Each posting of a new blog entry could be seen as a transaction, and therefore these models could also provide answers to questions like ‘How many of the registered users are still active?’ and ‘How many blog entries will be posted within the next month by each one of them?’. This thesis should shed some light on how to find accurate answers to ques- tions of this kind.
- 11. Chapter 2 DMEF Competition 2.1 Contest Details The Direct Marketing Educational Foundation1 (DMEF) is a US based non- profit organization with the mission ‘to attract, educate, and place top college students by continuously improving and supporting the teaching of world- class direct / interactive marketing’2 . The DMEF is an affiliate of the Direct Marketing Association Inc.3 and it is also founder and publisher of the Jour- nal of Interactive Marketing4 . The DMEF organized a contest in 2008, with ‘the purpose [..] to compare and improve the estimation methods and applications for [lifetime value and customer equity modeling]’ which ‘have attracted widespread attention from marketing researchers [..] over the past 15 years’ (May, Austin, Bartlett, Malthouse, and Fader, 2008). The participating teams were provided with a data set from a leading US nonprofit organization, whose name remained undisclosed, containing detailed transaction and contact history of a cohort of 21.166 donors over a period of 4 years and 8 months. The transaction records included a unique donor ID, the timing, and the amount of each single donation together with a (rather cryptic) code for the type of contact. The contact data included records of each single contact together with the contacted donor, the timing, the type of contact, and the implied costs of that contact. 1 cf. http://www.directworks.org/ 2 http://www.directworks.org/About/Default.aspx?id=386, retrieved on Oct. 9, 2008 3 cf. http://www.the-dma.org/ 4 cf. https://www.directworks.org/Educators/Default.aspx?id=220 6
- 12. CHAPTER 2. DMEF COMPETITION 7 The first phase of the competition consisted of three separate estimation tasks for a target period of two years: 1. Estimate the donation sum on an aggregated level. 2. Estimate the donation sum on an individual level. 3. Estimate which donors, who have made their last donation before Sep. 1, 2004, will be donating at all during the target period. An error measure for all 3 tasks was defined by the contest organizing com- mittee in order to evaluate and compare the submitted calculations by the participating teams. Closeness on an aggregated level (task 1) was simply defined as the absolute deviation from the actual donation amount, and for task 3 it was the percentage of correctly classified cases. The error measure for task 2 was defined as the mean squared logarithmic error: MSLE = (log(yi + 1) − log(ˆi + 1))2 /21.166, y i with the 1 added to avoid taking the logarithm of 0, and with 21.166 being the size of the cohort. The deadline for submitting calculations for phase 1 (task 1 to 3) was Sep. 15, 2008. The results for the participating teams were announced couple of weeks afterwards and were discussed at the DMEF’s Research Summit in Las Vegas.5 2.2 Data Set The data set contains records of 53,998 donations for 21,166 distinct donors, starting from Jan. 2, 2002, until Aug. 31, 2006. Each of these donors made their initial donation during the first half of 2002, as this is the criteria for donors for being included into the cohort. The record of each donation contains a unique identifier of the donor, and the date and dollar amount of that donation. Additionally, the type of contact that can be linked with this transaction is given. See table 2.1 for a sample of the transaction records. Furthermore, detailed contact records with their related costs were provided. These 611,188 records range from Sep. 10, 1999, until Aug. 28, 2006. Each 5 cf. http://www.researchsummit.org/
- 13. CHAPTER 2. DMEF COMPETITION 8 id date amt source 8128357 2002-02-22 5 02WMFAWUUU 9430679 2002-01-10 50 01ZKEKAPAU 9455908 2002-04-19 25 02WMHAWUUU 9652546 2002-04-02 100 01RYAAAPBA 9652546 2003-01-06 100 02DEKAAGBA 9652546 2004-01-05 100 04CHB1AGCB .. .. .. .. 13192422 2005-02-11 50 05HCPAAICD 13192422 2005-02-16 50 05WMFAWUUU Table 2.1: Transaction Records contact record contains an identifier of the contacted donor, the date of contact, the type of contact and the associated costs for the contact. See table 2.2 for a sample of these contact records. id date source cost 9652546 2000-07-20 00AKMIHA28 0.2800000 9430679 2000-07-07 00AXKKAPAU 0.3243999 9455908 2000-07-07 00AXKKAPAU 0.3243999 11303542 2000-07-07 00AXKKAPAU 0.3243999 11305422 2000-01-14 00CS31A489 0.2107999 11261005 2000-01-14 00CS31A489 0.2107999 .. .. .. .. 11335783 2005-09-01 06ZONAAMGE 0.4068198 11303930 2005-09-01 06ZONAAMGE 0.4068198 Table 2.2: Contact Records According to May et al. (2008), ‘the full data set, including 1 million cus- tomers, 17 years of transaction and contact history, and contact costs, will be released for general research purposes’, and should become available at https://www.directworks.org/Educators/Default.aspx?id=632. The compe- tition data set represents therefore only a small subset of the complete avail- able data that has been provided by the NPO after the competition. 2.3 Game Plan Before starting out with the model building, an in-depth exploratory analysis of the data set is performed, in order to gain a deeper understanding of its
- 14. CHAPTER 2. DMEF COMPETITION 9 key characteristics. Various visualizations provide a comprehensive overview of these characteristics and help comprehend the outcomes of the modeling process. As mentioned above, our main emphasis is on winning task 2, i.e. on finding the ‘best’ forecast model that will subsequently provide the lowest MSLE for the target period. But of course no data for the target period is available before the deadline of the competition, and therefore we have to split the provided data into a training period and a validation period. The training data is used for calibrating the model and its parameters, whereas the valida- tion data enables us to compare the forecast accuracy among the models. By choosing several different lengths of training periods, as has also been done by Schmittlein and Peterson (1994), Batislam et al. (2007) and Hoppe and Wagner (2007), we can further improve the robustness of our choice. After picking a certain model for the competition, the complete provided data set is used for the final calibration of the model. Despite the fact that a strong causal relation between contacts and actual donations can be assumed, we will not include the contact data into our model building. The main reason is that such data is not available for the target period and also cannot be reliably estimated. Therefore, we implic- itly assume that direct marketing activities will have a similar pattern as in the past and simply disregard this information. The same assumption is being made regarding all other possible exogenous influences, such as com- petition, advertisement, public opinion, and so forth, due to the absence of such information. All the probabilistic models under investigation try to model the purchase opportunity as opposed to the actual purchase amount.6 The amount per donor is estimated in a separate step and is simply multiplied with the es- timated number of future purchases (see section 6.4.1). This approach is feasible, if we assume independence between purchase amount and purchase rate, respectively between purchase amount and defection rate (Schmittlein and Peterson, 1994, p. 49). Providing an estimate for task 3 is directly derived from task 2. This is done by assuming that any customer with an estimated number of purchases of 0.5 or higher will actually make a purchase within the target period. Task 1 could be deduced from task 2 as well by simply building the sum over all individual estimates. 6 Donations and purchases as well as donors and consumers or clients will be referred to as synonymously within this thesis.
- 15. CHAPTER 2. DMEF COMPETITION 10 All of our following calculations and visualizations are carried out with the statistical programming environment R (R Development Core Team, 2008), which is freely available, well documented, widely used in academic research, and which further provides a large repository of additional libraries. Unfor- tunately, the presented probabilistic models are not yet part of an existent library. Hence, the programming of these models needs to be done by our- selves. But thanks to the published estimates regarding the CDNOW data set7 within the originating articles we are able to verify the correctness of our implementations. 7 http://brucehardie.com/notes/008/
- 16. Chapter 3 Exploratory Data Analysis In this chapter an in-depth descriptive analysis of the contest data set is undertaken. Several key characteristics are being outlined and concisely vi- sualized. These findings will provide valuable insight into the succeeding model fitting process in chapter 4. 3.1 Key Summary No. of donors 21,166 Cohort time length 6 months Available time frame 4 years 8 months Available time units days No. of zero repeaters: absolute; relative 10,626; 50.2% No. of rep. donations: mean; sd; max 1.55; 2.93; 55 Donation amount: mean; sd; max $39.31; $119.32; $10,000 Time between donations: mean; sd; max 296 days; 260 days; 1626 days Time until last donation: mean; sd 460 days; 568 days Table 3.1: Descriptive Statistics The data set consists of a rather large, heterogeneous cohort of donors. Heterogeneity can be observed in the donation frequency, in the donation amount, in the time laps between succeeding donations, and in the overall recorded lifetime. 11
- 17. CHAPTER 3. EXPLORATORY DATA ANALYSIS 12 On the one hand, the majority (50.2%) did not donate at all after their initial donation. On the other hand, some individuals donated very frequently, up to 55 times. The amount per transaction ranges from as little as a quarter of a dollar up to $10,000. And the observed standard deviation of the amount is 3 times larger than its mean. These simple statistics already make it clear that any model that is being considered to fit the data should be able to account for such a kind of heterogeneity. It can also be noted that the covered time span of the records is considerably long (like is the target period of 2 years). This implies that people who are still active at the end of the 4 year and 8 month period are rather loyal, long- term customers. But it also means that assuming stationarity regarding the underlying mechanism and thereby regarding the model parameters might not prove true. Various Timing Patterns 11382546 | | | | | 11371770 | | | || | | | | | | | | | | | 11359536 | | | 11343894 | | 11329984 | Donor ID 11317401 | 11303989 | 11292547 | | 11281342 | | | | | | | 11270451 | 11259736 | 10870988 |||||||||||||||||||||||||||||||||||||||||||| 2002 2003 2004 2005 2006 Time Scale Figure 3.1: Timing Patterns for 12 Randomly Selected Donors An important feature of the data set is that donation (as well as contact) records are given with their exact timing, and they are neither aggregated to longer time spans nor condensed to simple frequency numbers. Therefore the information of the exact timing of the donations can and also should be used for our further analysis. A first ad-hoc visualization (see figure 3.1) of 12 randomly selected donors already displays some of the differing charac- teristic timing patterns. These patterns range from single-time donors (e.g.
- 18. CHAPTER 3. EXPLORATORY DATA ANALYSIS 13 ID 11259736), over sporadic donors (e.g. ID 11359536) to regular donors who have already defected (see ID 10870988 at the bottom of the chart). Thus, the high number of single-time donors and also the observed defection of reg- ular donors suggests that models should be considered in particular which can also account for such a defection process. 3.2 Distribution of Individual Donation Be- havior Distribution of Numbers of Donations 12000 50.2% 8000 # Donors 4000 16.9% 10.8% 7.6% 6.3% 2.6% 3.9% 1.6% 0 1 2 3 4 5 6 7 8+ # Donations Figure 3.2: Histogram of Number of Donations per Donor Figure 3.2 displays once more the aforementioned 50.2% of single-time donors, i.e. donors who have never made any additional transaction after their initial donation in the first half of 2002. Aside from these single-time donors, a fur- ther large share of donors must be considered as ‘light’ users. In particular 42% donate less than 6 times which corresponds to an average frequency of about or even less than once a year. And only as little as 8% of the cus- tomer base (in total 1733 people) can be considered frequent donors, with 6 or more donations. However, these 8% actually account for over half of the transactions (51,5%) in the last year of the observation period, and therefore are of great importance for our estimates into the future. It it is important to point out that a low number of recorded donations can result from two different causes. Either this low number really stems from a (very) low donation frequency, i.e. people just rarely donate. Or this stems from the fact that people defected, i.e. turned away from the NPO and will
- 19. CHAPTER 3. EXPLORATORY DATA ANALYSIS 14 not donate at all anymore. An upcoming challenge will be to distinguish these two mechanism within the data. Distribution of Donation Amounts 0.30 25 0.25 10 0.20 Relative Frequency 0.15 50 20 0.10 15 5 100 0.05 0.00 0.25 1 2 3.5 6 10 18 32 57 110 235 500 1200 3000 10000 Donation Amount − logarithmic scale Figure 3.3: Histogram of Dollar Amount per Donation Figure 3.3 plots the observed donation amounts. These amounts vary tremen- dously, and range from as low as a quarter of a dollar up to a single generous donation of $10,000. A visual inspection of the figure indicates that the over- all distribution follows, at least to some extent, a log-normal distribution,1 but with its values being restricted to certain integers. Particularly 89% of the 53,998 donations are accounted by some very specific dollar amounts, namely $5, $10, $15, $20, $25, $50 and $100. The other donation amounts seem to play a minor role. Though, special attention should be directed to those few large donations, because the 3% of donations that exceed $100 actually sum up to 30% of the overall donation sum. In figure 3.4 a possible relation between the average amount of a single do- nation and the number of donations per individual is inspected.2 As we can see, single time donors as well as very active donors (7+) tend to spend a 1 The dashed gray line in the chart represents a kernel density estimation with a broad bandwidth. 2 Note: The widths of the drawn boxes in the chart are proportional to the square roots of the number of observations in the corresponding groups.
- 20. CHAPTER 3. EXPLORATORY DATA ANALYSIS 15 Conditional Distribution of Donation Amounts 100 80 Average Donation Amount 60 40 20 0 1 2 3 4 5 6 7 8+ # Donations Figure 3.4: Distribution of Average Donation Amounts grouped by Number of Donations per Donor little less money per donation. A result that seems plausible, as single time donors rather ‘cautiously try out the product’ and heavy donors spread their overall donation over several transactions. Nevertheless, the observed corre- lation between these two variables is minimal and will be neglected in the following. 3.3 Trends on Aggregated Level This section analyzes possible existing trends within the data on an aggre- gated level by examining time series. Most of the charts that are presented in the following share the same layout. The connected line represents the evolution of the particular figures for the quarters of a year, and the horizon- tal lines are the averages over 4 of these quarters at a time. The time series are aggregated to quarters instead of tracking the daily movements in order to reduce the noise within these figures and to help identify the long-term trends. The displayed percentage changes indicate the change from one year to the next, whereas these averages cover the second half of one year and the first half of the next year. This shifted year average has been chosen, since
- 21. CHAPTER 3. EXPLORATORY DATA ANALYSIS 16 the covered time range of the competition data ends slightly after the second quarter in 2006. Donation Sum 4e+05 2e+05 0e+00 +8% −24% −3% 2002 2003 2004 2005 2006 2007 Time Figure 3.5: Trend in Overall Donation Sum Inspecting the evolution of overall donation sums (figure 3.5) directly reveals various interesting properties. First of all, it is apparent that donations show a sharp decline immediately after the second quarter in 2002. This observed drop is plausible, if we recall that our cohort has actually been built by definition of new donors from the first half of 2002 and that on average only a few following donations are being made. Further, it can be stated that the data shows a strong seasonal fluctuation with the third quarter being the weakest, and the fourth and first quarter being the strongest periods. About twice as many donations occur during each of these strong quarters than during the third quarter. It also seems that there is a downward trend in donation sums. But the speed of this trend remains ambiguous, if a look at the corresponding percentage changes is taken. At the beginning an increase of 8% is recorded, then a sharp drop of 24%, which is followed by a moderate decrease of 3% over the last year. Task 1 of the competition is the estimation of the future trend of these aggregated donation sums for the next two years. Considering the erratic movements this is quite a challenge. The overall donation sum is the result of the multiplication of the number of donations with the average donation amount. Figure 3.6, which separates these two variables, provides some further insight into the decomposition of the overall trend. The time series for the number of donations also displays a strong seasonality, which has a peak around the Christmas holidays. The continuous downward trend (-13%, -15%, -14%) in the transaction numbers is considerably stable and hence predictable. A simple heuristic could, for example, assume a constant decreasing rate of 14% for the next two years. As has been noted in the preceding section, this downward trend can either be the result from a decreasing donation frequency for each donor or might
- 22. CHAPTER 3. EXPLORATORY DATA ANALYSIS 17 # Donations Avg Donation Amount 50 8000 40 30 4000 20 10 −13% −15% −14% +24% −10% +12% 0 0 2002 2004 2006 2002 2004 2006 Time Time Figure 3.6: Trend in Number of Donations and Average Donation Amount stem from an ongoing defection process. Figure 3.7 indicates that rather the latter of these two effects is dominant. The number of active donors is steadily decreasing,3 whereas the average number of donations per active donor is slightly increasing. Percentage of Donors Average # Donations who Have Donated Within that Year per Active Donor 0.5 2.0 0.4 1.51 1.55 1.46 1.5 1.42 27.8% 29.5% 0.3 23.5% 1.0 18.8% 0.2 0.5 0.1 0.0 0.0 2002 2003 2004 2005 2002 2003 2004 2005 Time Time Figure 3.7: Trend in Activity Due to the stable decline of donation numbers it can be concluded that the erratic movement of the overall sum stems from the up and downs in the average donation amounts. The chart on the right hand side of figure 3.6 surprisingly also shows seasonal fluctuation, and has no clear overall trend at all, which makes it hard to make predictions into the future. 3 Note that we disregard the initial donation for this chart as otherwise the share for 2002 would simply be 100%.
- 23. CHAPTER 3. EXPLORATORY DATA ANALYSIS 18 Donation Sum Contact Costs 4e+05 25000 2e+05 10000 0e+00 +8% −24% −3% +25% −16% −33% 0 2002 2003 2004 2005 2006 2007 2002 2003 2004 2005 2006 2007 Time Time # Contacts Avg Contact Cost 0.6 50000 0.4 20000 0.2 0.0 −3% −30% −7% +22% +19% −24% 0 2002 2003 2004 2005 2006 2007 2002 2003 2004 2005 2006 2007 Time Time Figure 3.8: Trend in Contacts A possible explanation for the observed trends and movements might be contained in the contact records which have been provided by the organizing committee. Each donation is linked to a particular contact, but certainly not each contact resulted in a donation. Therefore, it seems logical that the amount of contacts and the associated expenses have a strong influence on the donation sums. The displayed time series from figure 3.8 strongly support this assumption. And again, the same seasonal variations in the number of contacts as well as in their average costs can be detected as before. Furthermore, the increase in donation sums in 2003/2004 can now be linked to the tremendous increase of 25% in contact spending during that period. On the other hand, the NPO has been able to cut costs in 2005/2006 by 33% (mostly due to a 24% drop in average contact costs) without hurting the generated contributions. Unfortunately, it is not possible to take any advantage out of this detected relation between donations and contacts for the contest, because no informa- tion regarding the contact activities throughout the target period is available (see section 2.3 for the previous discussion).
- 24. CHAPTER 3. EXPLORATORY DATA ANALYSIS 19 3.4 Distribution of Intertransaction Times Overall Distribution of Intertransaction Times 4000 1 12 3000 Count 2000 1000 24 0 0 3 6 9 12 15 18 21 24 27 30 33 36 39 42 45 48 51 # Months in between Donations Figure 3.9: Histogram of Intertransaction Times in Months The disaggregated availability of transaction data on a day-to-day base allows an inspection of the observed intertransaction times, i.e. the lapsed time between two succeeding donations for an individual.4 Figure 3.9 depicts the overall distribution of this variable. The distribution contains two peaks, the first and also highest peak represents waiting times of one month and the second peak represents one year intervals. Further, we see that only very few times (1.4%) donations occur within a single month. It seems that there is a dead period of one month, which marks the time until a donor is willing to make another transaction. It is also interesting to note that in 5% of the cases we have a waiting period of more than 24 months and that there are even values higher than 4 years. This is an indicator that some customers can remain inactive for a very long period and nevertheless can still possibly be persuaded to make another donation. This particular characteristic of the data set will make it hard to model the defection process correctly in the following, as some long-living customers just never actually defect but are rather ‘hibernating’ and can be reactivated at anytime5 . Figure 3.10 shows that light and frequent donors have a differing distribution of intertransaction times, with the former one donating approximately every 4 Also commonly termed as interpurchase times or interevent times. 5 Compare further the lost-for-good versus always-a-share discussion in Rust, Lemon, and Zeithaml (2004, p. 112).
- 25. CHAPTER 3. EXPLORATORY DATA ANALYSIS 20 year, and the latter one donating regularly each month. As we will see, this particular observed regularity will play a major role in the upcoming modeling phase. Intertransaction Times for Light Donors (2, 3 or 4 Donations) 300 Yearly Donations (~8%) Count 8814 Donors , 18352 Donations 150 0 0 76 178 292 406 520 634 748 862 976 1103 1243 1383 1524 # Days in between Donations Interpurchase Times for Frequent Donors (5 or more Donations) Monthly Donations (~10%) Count 400 1733 Donors , 14480 Donations 0 0 76 178 292 406 520 634 749 870 994 1126 1385 # Days in between Donations Figure 3.10: Intertransaction Times Split by Frequency
- 26. Chapter 4 Forecast Models 4.1 NBD Model 4.1.1 Assumptions As early as 1959, Andrew Ehrenberg1 published his seminal article ‘The Pattern of Consumer Purchase’ (Ehrenberg, 1959), in which he suggested the negative binomial distribution (abbr. NBD) as a fit to aggregated count data of sales of non-durable consumer goods.2 Since then Ehrenberg’s paper has been cited numerous times in the marketing literature and various models have been derived based upon his work, proving that his assumptions are reasonable and widely applicable. Besides the sheer benefit that a well fitting probability distribution is found, Ehrenberg further provides a logical justification for choosing that particular distribution. He argues that each consumer purchases according to a Poisson process and that the associated purchase rates vary across consumers accord- ing to a Gamma distribution.3 Now, the negative binomial distribution is exactly the theoretical distribution that arises from such a Gamma-Poisson mixture. Table 4.1 summarizes the postulated assumptions of Ehrenberg’s model. 1 See http://www.marketingscience.info/people/Andrew.html for a brief summary of his major achievements in the field of marketing science. 2 In other words, a discrete distribution is proposed that is supposed to fit the data displayed in figure 3.2 on page 13. 3 Actually, he assumed a χ2 -distribution in Ehrenberg (1959) but this is simply a special case of the more general Gamma distribution. 21
- 27. CHAPTER 4. FORECAST MODELS 22 A1 The number of transactions follows a Poisson process with rate λ. A2 Heterogeneity in λ follows a Gamma distribution with shape parameter r and rate parameter α across cus- tomers. Table 4.1: NBD Assumptions In order to support the reader’s understanding of the postulated assump- tions, visualizations of the aforementioned distributions are provided in fig- ure 4.1, 4.2 and 4.3 for various parameter constellations. The Poisson distribution is characterized by the relation that its associated mean and also its variance are equal to the rate parameter λ. Further, it can be shown that assuming a Poisson distributed number of transactions is equivalent to assuming that the lapsed time between two succeeding transac- tions follows an exponential distribution. In other words, the Poisson process with rate λ is the respective count process for a timing process with indepen- dently exponential distributed waiting times with mean 1/λ (Chatfield and Goodhardt, 1973). The exponential distribution itself is a special case of the Gamma distribution with its shape parameter being set to 1 (see the middle chart in figure 4.3). An important property of exponentially distributed random variables is that it is memoryless. This means that any provided information about the time since the last event does not change the probability of an event occurring within the immediate future. P (T > s + t | T > s) = P (T > t) for all s, t ≥ 0. For the mathematical calculations such a property might be appealing, be- cause it simplifies some derivations. But applied on sales data, this implies that the timing of a purchase does not depend on how far in the past the last purchase took place. A conclusion that is quite contrary to common intuition which would rather suggest that nondurable consumer goods are purchased with certain regularity. If a consumer buys for example a certain good, such as a package of detergent, he/she will wait with the next purchase until that package is nearly consumed. But the memoryless property even further implies that the most likely time for another purchase is immediately after a purchase has just occurred (Morrison and Schmittlein, 1988, p. 148).4 4 This can also be depicted from the middle chart of figure 4.3, as the density function
- 28. CHAPTER 4. FORECAST MODELS 23 0.4 Negative Binomial Distribution 0.4 0.4 r=1 r=1 r=3 0.3 0.3 0.3 p = 0.4 p = 0.2 p = 0.5 0.2 0.2 0.2 0.1 0.1 0.1 0.0 0.0 0.0 0 1 2 3 4 5 6 7 8 9 0 1 2 3 4 5 6 7 8 9 0 1 2 3 4 5 6 7 8 9 Figure 4.1: Probability Mass Function of the Negative Binomial Distribution for Different Parameter Values Poisson Distribution 0.4 0.4 0.4 0.3 0.3 0.3 lambda = 0.9 lambda = 2.5 lambda = 5 0.2 0.2 0.2 0.1 0.1 0.1 0.0 0.0 0.0 0 1 2 3 4 5 6 7 8 9 0 1 2 3 4 5 6 7 8 9 0 1 2 3 4 5 6 7 8 9 Figure 4.2: Probability Mass Function of the Poisson Distribution for Different Parameter Values Gamma Distribution 0.5 0.5 0.5 shape = 0.5 shape = 1 shape = 2 0.4 0.4 0.4 rate = 0.5 rate = 0.5 rate = 0.5 0.3 0.3 0.3 0.2 0.2 0.2 0.1 0.1 0.1 0.0 0.0 0.0 0 2 4 6 8 10 0 2 4 6 8 10 0 2 4 6 8 10 Figure 4.3: Probability Density Function of the Gamma distribution for Different Parameter Values
- 29. CHAPTER 4. FORECAST MODELS 24 Nevertheless, the Poisson distribution has proven to be an accurate model for a wide range of applications, like the decay of radioactive particles, the occurrence of accidents or the arrival of customers in a queue. But in all these cases the memoryless property withstand basic face validity checks. It seems plausible for example that the particular arrival time of one customer in a queue is absolutely independent of the arrival of the next customer, as they both do not interact with each other. The fact that a customer has just arrived does not influence the arrival time of the next one. Therefore, it can be argued that queuing arrivals are indeed a memoryless process. But, as has been argued above, this is not the case for purchases of non- durable consumer goods for an individual customer. The regularity of con- sumption of a good does lead to a certain extent of regularity regarding its purchases. Ehrenberg has been aware of this defect (Ehrenberg, 1959, p. 30) but simply required that the observed periods should not be ‘too short, so that the purchases made in one period do not directly affect those made in the next’ (ibid., p. 34). Assumption A2 postulates a Gamma distribution for the distribution of pur- chase rates across customers, in order to account for heterogeneity. If the different possible shapes of this two-parameter continuous probability are be- ing considered, then it is safe to state that such an assumption adds some substantial flexibility to the model. But besides the added flexibility and its positive skewness no behavioral story is being provided in Ehrenberg (1959) in order to justify the choice of the Gamma distribution. Nevertheless, Ehrenberg applies a powerful trick by explicitly modeling het- erogeneity. He utilizes information of the complete customer base for model- ing on an individual level. He thereby takes advantage of the well-established regression to the mean phenomenon. ‘[We] can better predict what the per- son will do next if we know not only what that person did before, but what other people did’ (Greene, 1982, p. 130 reprinted from Hoppe and Wagner, 2007, p. 80). Schmittlein et al. (1987, p. 5) similarly stated that ‘while there is not enough information to reliably estimate [the purchase rate] for each person, there will generally be enough to estimate the distribution of [it] over customers. [..] This approach, estimating a prior distribution from the available data, is usually called an empirical Bayes method’. So, despite a possibly violated assumption A15 and a somewhat arbitrary assumption A2, the negative binomial distribution proves to fit empirical reaches its maximum for value zero. 5 See section 6.1 and also Herniter (1971) for some further empirical evidence.
- 30. CHAPTER 4. FORECAST MODELS 25 market data very well (Dunn et al., 1983; Wagner and Taudes, 1987; Chatfield and Goodhardt, 1973). 4.1.2 Empirical Results In the following the NBD model is applied on the data set from the DMEF competition. First, we will estimate the parameters, then analyze how well the model fits the data on an aggregated level, and finally we will calculate individual estimates.6 Ehrenberg suggests an estimation method for the parameters α and r that only requires the mean number of purchases m and the proportion share of non-buyers p0 (Ehrenberg, 1959). However, with modern computational power the calculation of a maximum likelihood estimation (abbr. MLE) does not pose a problem anymore. The MLE method tries to find those parameter values, for which the likelihood of the observed data is maximized. It can be shown that this method has the favorable property of being an asymptotically unbiased, asymptotically efficient and asymptotically normal estimator. The calculation of the likelihood for the NBD model requires two pieces of information per donor: The length of observed time T , and the number of transactions x within time interval (0, T ]. This time span differs from donor to donor, because the particular date of the first transaction varies across the cohort. It needs to be noted that x does not include the initial transaction, because that transaction occurred for each person of our cohort by definition. As we will see later on, the upcoming models will also require another piece of information for each donor, namely the recency, i.e. the timing tx of the last recorded transaction.7 The set of information consisting of recency, frequency and a monetary value is often referred to as RFM variables and is commonly (not only for probabilistic models) the condensed data base of many customer base analyses. The layout of the transformed data can be depicted from table 4.2. The displayed information is read as followed: The donor with the ID 10458867 made no additional transactions throughout the observed period of 1605 days after his initial donation of 25.42 dollars. Further, donor 9791641 made five donations (one initial and four repetitive ones) which sum up to 275 dollars during an observed time span of 1687 days, whereas the last donation occurred 1488 days after the initial one. That is, the donor did 6 Again note that we only model the number of donations for now, and make an assess- ment for the amount per donation in a separate step in section 6.4.1. 7 With this notation we closely follow the variable conventions used in Schmittlein et al. (1987) and Fader et al. (2005a).
- 31. CHAPTER 4. FORECAST MODELS 26 not donate during the last 199 days (= T −tx = 1687−1488) of the observation anymore. id x tx T amt 10458867 0 0 1605 25.42 10544021 1 728 1602 175.00 10581619 7 1339 1592 80.00 .. .. .. .. .. 9455908 0 0 1595 25 9652546 4 1365 1612 450 9791641 4 1488 1687 275 Table 4.2: DMEF Data Converted to RFM Applying the MLE method on the transformed data results in the following parameter estimates r = 0.475 = shape parameter, and α = 498.5 = rate parameter, for the DMEF data set, with both parameters being highly significant. The general shape of the resulting Gamma distribution can be depicted from the left chart of figure 4.3, i.e. it is reversed J-shaped. This implies that the majority of donors have a very low donation frequency, with the mode being at zero, the median being 0.00042 and the mean being 0.00095 (= r/α). In terms of average intertransaction times, which are simply the reciprocal val- ues of the frequencies, this result implies an average time period of 1,048 days (=2.9 years) between two succeeding donations, and that half of the donors are donating less often than every 2,406 days (=6.6 years).8 If we consider that the majority of donors has not redonated at all during the observation period, these long intertransaction times are obviously a consequence of the overall low observed donation frequencies. The next step is an analysis of the model’s capability to represent the data. For this purpose the actual observed number of donations are being compared with their theoretical counterparts that are calculated by the NBD model. Table 4.3 contains the result. As can be seen, a nearly perfect fit for the large share of non-repeaters is achieved. However, the deviations of the estimated group sizes increase for 8 The median of the Gamma distribution is approximated by generating a large ran- dom sample from the theoretical distribution and subsequently calculating the empirical median.
- 32. CHAPTER 4. FORECAST MODELS 27 0 1 2 3 4 5 6 7+ Actual 10,626 3,579 2,285 1,612 1,336 548 348 832 NBD 10,617 3,865 2,183 1,379 918 629 439 1,135 Table 4.3: Comparison of Actual vs. Theoretical Count Data the more frequent donors, which indicates that the model is not fully able to explain the observed data. Attention is now turned to the predictive accuracy of the NBD model on an individual level. For this purpose the overall observation period of 4 years and 8 months needs to be split into a calibration period of 3.5 years and a validation period of 1 year. Due to the shorter time range for the calibration, the estimate parameters (r = 0.53, α = 501) are now slightly different compared to our results from above. Subsequently, a conditional estimate is being calculated for each individual for a one year period. These estimates take their respective observed frequencies x and time spans T into account. Table 4.4 displays a small subset of such estimates with x365 being the actual number and x365Nbd being the estimated number of transactions. For example, the donor with ID 10581619 donated 6 times within the first 3.5 years but only made a single donation in the following year, whereas the NBD model predicted approximately 2.5 donations during that period.9 id x tx T x365 x365Nbd 10458867 0 0 1179.5 0 0.0011 10544021 1 728 1176.5 0 0.4226 10581619 6 1079 1166.5 1 2.5303 .. .. .. .. .. .. 9455908 0 0 1169.5 0 0.0011 9652546 3 1001 1186.5 1 1.2657 9791641 3 777 1261.5 1 1.2657 Table 4.4: Individual NBD Forecasts for a Data Split of 3.5 Years to 1 Year Table 4.5 contains these numbers in an aggregated form. It compares the actual with the average expected number of donations during the validation period split by the associated number of donations during the calibration period. For example, those people that did not donate at all within the first 3.5 years donated in average 0.038 times in the following year, whereas the NBD model only predicted an average of 0.001 donations. On the other hand, as can also be depicted from the table, the future donations of the frequent 9 Note that the model estimates are not restricted to integer numbers.
- 33. CHAPTER 4. FORECAST MODELS 28 donors are being vastly overestimated. Overall, the NBD model estimates 11,088 donations for the 21,166 donors, which is nearly twice as much as the observed 6,047 donations during the validation period. 0 1 2 3 4 5 6 7+ Actual 0.038 0.20 0.43 0.69 0.75 1.06 1.54 2.44 NBD 0.001 0.42 0.84 1.27 1.69 2.11 2.53 4.68 Table 4.5: Comparison of Actual vs. Theoretical Average Number of Donations per Donor during the Validation Period A possible explanation for the poor performance of the NBD model is the long overall time period, in combination with the assumption that all donors remain active. The upcoming section will present a model that explicitly takes a possible defection process into account. 4.2 Pareto/NBD Model 4.2.1 Assumptions In 1987, Schmittlein, Morrison, and Colombo introduced the Pareto/NBD model to the marketing science community (Schmittlein et al., 1987). It is nowadays a well known, and well studied stochastic purchase model for non- contractual settings and has even further ‘received growing attention among researchers and managers within recent years’ (Fader et al., 2005a, p. 275). Schmittlein et al. explicitly try to tackle the problem of a nonobservable defection process. For various reasons existing customers may decide to quit a business relation, e.g. stop purchasing a product or buying at a shop. The reasons can range from a change in personal taste or attitudes, over changes in personal circumstances, such as marriages, newborns, illnesses, or moving to other places, to the very definitive form of defection, namely death. But regardless of the actual cause, the fundamental problem in a noncontractual customer relationship is that the organization will generally not be notified of that defection. Hence the organization relies on other indicators to assess the current activity status. Building a stochastic model for a nonobservable dropout process on an in- dividual level is a challenging task. Especially if we consider that a drop out can only occur a single time per customer. And even then, it is still
- 34. CHAPTER 4. FORECAST MODELS 29 not possible to verify whether this event has really occurred. Looking at the various timing patterns (see figure 3.1 on page 12) gives an impression on the inherent difficulty of estimating which of these donors are still active after August 2006, let alone of building a stochastic parametric model. But the Pareto/NBD succeeds in solving this dilemma. It uses the same smart technique like the NBD model already does for modeling individual purchase frequencies (see end of section 4.1.1), and applies this trick to the defection process. In particular it assumes some sort of individual stochastic dropout process, and makes assumptions regarding the form of heterogene- ity across all customers at the same time. Thereby, the information of the complete customer base can be used for modeling the individual customer. The assumptions of the Pareto/NBD regarding consumer behavior are sum- marized in table 4.6.10 A1 While active, the number of transactions follows a Pois- son process with rate λ. A2 Heterogeneity in λ follows a Gamma distribution with shape parameter r and rate parameter α across cus- tomers. A3 Customer lifetime is exponentially distributed with death rate µ. A4 Heterogeneity in µ follows a Gamma distribution with shape parameters s and rate parameter β across cus- tomers. A5 The purchasing rate λ and the death rate µ are dis- tributed independently of each other. Table 4.6: Pareto/NBD Assumptions A1 and A2 are identical with the already presented NBD model and hence the same concerns regarding these assumptions apply again (see section 4.1.1). Assumption A3 now postulates an exponentially distributed lifetime with a 10 For consistency reasons the ordering and wording of the assumptions is changed com- pared to the originating paper in order to ease comparison with the other models presented within this chapter.
- 35. CHAPTER 4. FORECAST MODELS 30 certain ‘death’ rate µ for each customer. This assumption is justified by Schmittlein et al. because ‘the events that could trigger death (a move, a financial setback, a lifestyle change, etc.) may arrive in a Poisson manner’ (Schmittlein et al., 1987, p. 3). On the one hand, this seems entirely rea- sonable. On the other hand, it is also hard to verify because the event of defection is not observable. And even if the event was observable, defection just occurs a single time for a customer and therefore reveals hardly any information on the underlying death rate µ. But by making specific assump- tions regarding the distribution of µ across customers (A4) an estimation of the model for the complete customer base becomes feasible. Heterogene- ity is again assumed to follow the flexible Gamma distribution, but with two different parameters than for the purchase frequency. And because a Gamma-Exponential mixture results in the Pareto distribution, the overall model is termed Pareto/NBD model. Finally, assumption A5 requires independence between frequency and life- time. It is for example assumed that a heavy purchaser has neither a longer nor a shorter lifetime expectancy than less frequent buyers. This assumption is necessary in order to simplify the fairly complex mathematical derivations of the model. Schmittlein et al. provide some reasoning for this assumption and Abe (2008, p. 19) present some statistical evidence that λ and µ are indeed uncorrelated. 4.2.2 Empirical Results Again, we will apply the presented model to the DMEF data set and subse- quently evaluate its forecasting accuracy. Several different methods for estimating the four parameters r, α, s and β of our model are available. A two-step estimation method which tries to fit the observed moments is suggested in Schmittlein et al. (1987) and described in detail in Schmittlein and Peterson (1994, appendix A2). Nevertheless, the MLE method seems to be more reliable for a wide range of data constellations. But despite the ongoing increase in computational power, the computational burden for calculating the maximum likelihood estimates are still challenging (Fader et al., 2005a, p. 275). The bottleneck is the evaluation of the Gaussian Hypergeometric function, which is part of the likelihood function, and as such needs to be evaluated numerous times for each customer and for each step of the numerical optimization procedure. An efficient and fast implementation of that function is essential to make the estimation procedure complete in
- 36. CHAPTER 4. FORECAST MODELS 31 reasonable time11 . Estimating the model parameters requires another piece of information com- pared to the NBD model, which is the actual timing of the last transaction tx .12 Schmittlein et al. (1987) prove that tx is a sufficient information for the model and that the actual timing of the preceding transactions (t1 ,..,tx−1 ) is not required for calculating the likelihood. This is due to the memoryless property of the assumed Poisson process. The MLE method applied on the DMEF data set results in the following parameter estimates r = 0.659, α = 514.651, and s = 0.471, β = 766.603, with all four parameters being highly significant. The shape parameters for both Gamma distributions (r and s) are well below 1 and therefore the resulting distributions of the purchase rate λ and the death rate µ can again be depicted from the outer left chart of figure 4.3. The resulting average time √ between two transactions (α/r) is 781 days with a standard deviation (α/ r) of 634 days and a median of 1,395 days. The corresponding theoretical average lifetime (β/s) across the cohort is 1,629 days (=4.5 years) with a √ standard deviation (β/ s) of 1,117 days and a median of 3,785 days (=over 10 years). Comparing these numbers with the NBD results shows that due to the added defection possibility the intertransaction time has dropped from 1,024 days to 787 days. In other words, most of the active donor wait over two years until they make another donation. Further, the average donor has a life ex- pectancy of over 4 years, which is nearly as long as the provided time span. These estimates still seem too high in comparison with our findings from the exploratory data analysis. Assessing the theoretical standard deviations, it can further be concluded that the overall extent of heterogeneity is consid- erably high within the data set. In short, the estimated parameters suggest that we are dealing with a heterogeneous, long living, rarely donating cohort of donors. 11 Many thanks go to Dr. Hoppe, who provided us with a R wrapper package for the impressively fast Fortran-77 implementation of the Gaussian Hypergeometric function developed by Zhang et al. (1996). See http://jin.ece.uiuc.edu/routines/routines.html for their source code. It was this contribution that made the herewith presented calculations feasible for us. 12 By convention tx is set to 0, if no (re-)purchase has occurred within time span (0, T ].
- 37. CHAPTER 4. FORECAST MODELS 32 These conclusions indicate that the fitted model does not fully take advantage of the dropout possibility. According to the estimated model, 38.2% of the donors are still active in the mid of 2006, which is a high number compared to the 18.8% that actually made a donation in 2005 (see figure 3.7). On the other hand, figure 3.9 indicates that there are indeed some donors with intertransaction times of four years and more. In separate calculations, that are not being presented here, it could be verified that this rather small group of long-living, ‘hibernating’, ‘always-a-share’ donors has a significant effect on the estimated parameter values. This occurs because the overall model tries to fit the complete cohort including these outliers altogether.13 But, at what point does a customer finally defect? Maybe the postulated concept of activity, which is that a customer can be either active or is lost for good, is too shortsighted, too simple for the data set? Alternative approaches that allow customers to switch between several states of activity back and forth, such as Markov Chain models (cf. Jain and Singh, 2002, p. 39 for an overview), might be more appropriate, especially when we consider the long time span of the observation period. Figure 4.4 depicts the estimated distributions for the donation frequency λ as well as for the estimated death rate µ. The axes on top of the charts display the related average intertransaction times respectively the average lifetime, both being measured in number of days. The short vertical line segment at that top axis represents the corresponding mean value. Distribution of Purchase Frequency Distribution of Death Rate Inf 250 125 83.3 62.5 50 Inf 250 125 83.3 62.5 50 100 100 shape = 0.66 shape = 0.47 80 80 rate = 515 rate = 767 60 60 40 40 20 20 0 0 0.000 0.005 0.010 0.015 0.020 0.000 0.005 0.010 0.015 0.020 Figure 4.4: Estimated Distribution of λ and µ across Donors 13 Nevertheless, for our final chosen model, the CBG/CNBD-k, these outliers did not pose a relevant problem anymore and therefore we did not split up the data set in the following.
- 38. CHAPTER 4. FORECAST MODELS 33 Despite the lack of plausibility of the estimated parameters, the question that matters most for our purpose is: How well does the Pareto/NBD pre- dict future transactions for the DMEF data set? Did the forecast improve compared to the NBD model or did we possibly overfit the training data? For now, we will only reproduce the comparison on an aggregated level in table 4.7. These numbers reveal that for the large share of no-repeaters the Pareto/NBD surprisingly provides inferior results by making overly op- timistic forecasts. But for all other groups the model succeeds in providing a much closer fit to the actual transaction counts. 0 1 2 3 4 5 6 7+ Actual 0.038 0.20 0.43 0.69 0.75 1.06 1.54 2.44 NBD 0.001 0.42 0.84 1.27 1.69 2.11 2.53 4.68 Pareto/NBD 0.102 0.23 0.50 0.71 0.91 1.11 1.32 2.24 Table 4.7: Comparison of Actual vs. Theoretical Average Number of Donations per Donor during the Validation Period All further assessments of this model’s accuracy are deferred to chapter 5, which provides a detailed, extensive comparative analyses of all presented models. 4.3 BG/NBD Model 4.3.1 Assumptions 18 years after the introduction of the Pareto/NBD model, Fader, Hardie, and Lee (2005a) call attention to the discrepancy between the raised scientific interest in that model, measured in terms of citations, and the small numbers of actual implementations. They argue that it is the inherent mathematical complexity and the computational burden of the Pareto/NBD that keeps practitioners from applying it to real world data. As a solution Fader et al. introduce an alternative model which makes a slightly different assumption regarding the dropout and termed it the Beta- geometric/NBD (abbr. BG/NBD) model. They succeed in simplifying the mathematical key expressions of the model and further demonstrate that an implementation is nowadays even possible with standard spreadsheet appli-
- 39. CHAPTER 4. FORECAST MODELS 34 cations, such as MS Excel.14 Further, they show that despite this change in the assumptions, the accuracy of the resulting fit and the individual pre- dictive strength are for most of the possible scenarios very similar to the Pareto/NBD results. A1 While active, the number of transactions follows a Pois- son process with rate λ. A2 Heterogeneity in λ follows a Gamma distribution with shape parameter r and rate parameter α across cus- tomers. A3 Directly after each purchase there is a constant probabil- ity p that the customer becomes inactive. A4 Heterogeneity in p follows a Beta distribution with pa- rameters a and b across customers. A5 The transaction rate λ and the dropout probability p are distributed independently of each other. Table 4.8: BG/NBD Assumptions The assumed behavioral ‘story’ regarding the dropout process is modified by Fader et al. in that respect that an existent customer cannot defect at an arbitrary point in time but only right after a purchase is being made. This modification seems to be plausible to some extent, because the customer is most likely to have either a positive or a negative experience regarding the product or service right after the purchase. And this extent of satisfaction will have a strong influence on the future purchase decisions. Assumption A3 claims that the probability p of such a dropout remains con- stant throughout an individual customer lifetime. As such, lifetime measured in number of ‘survived’ transactions results in a geometric distribution. This distribution can be seen as the discrete analogue to the continuous expo- nential distribution since it is also characterized by being memoryless. This means that the number of already ‘survived’ transactions does not effect the drop out probability p for the upcoming transaction. This assumption also seems reasonable since it is possible to find arguments in favor of high early 14 The Microsoft Excel implementation of the BG/NBD model can be downloaded from http://www.brucehardie.com/notes/004/.
- 40. CHAPTER 4. FORECAST MODELS 35 drop out probabilities (e.g. customer is still trying out the product) as well as high drop out probabilities later on (e.g. customer becomes tired of a certain product and is more likely to switch for something new).15 A4 is an assumption regarding the heterogeneous distribution of the dropout rate. But as opposed to the death rate µ, the constant drop out probability p is bound between 0 and 1, and therefore the Beta distribution which shares the same property is considered. As can be depicted from figure 4.5, this dis- tribution is, like the Gamma distribution, also fairly flexible and is defined by two shape parameters. Aside from its provided flexibility no particular justification for the Beta distribution is being provided. The resulting mix- ture distribution is generally referred to as the Betageometric distribution (BG). Beta Distribution 2.5 2.5 2.5 a = 0.5 a=1 a=2 2.0 2.0 2.0 b = 0.7 b=3 b=5 1.5 1.5 1.5 1.0 1.0 1.0 0.5 0.5 0.5 0.0 0.0 0.0 0.0 0.2 0.4 0.6 0.8 1.0 0.0 0.2 0.4 0.6 0.8 1.0 0.0 0.2 0.4 0.6 0.8 1.0 2.5 2.5 2.5 a=1 a=1 a = 1.5 2.0 2.0 2.0 b=1 b = 1.5 b=2 1.5 1.5 1.5 1.0 1.0 1.0 0.5 0.5 0.5 0.0 0.0 0.0 0.0 0.2 0.4 0.6 0.8 1.0 0.0 0.2 0.4 0.6 0.8 1.0 0.0 0.2 0.4 0.6 0.8 1.0 Figure 4.5: Probability Density Function of the Beta distribution for Different Parameter Values Assumption A5 requires independence between the dropout probability and the purchase frequency. But attention should be paid to the result that the actual lifetime measured in days and not in number of survived purchases is, compared to the Pareto/NBD, not independent of the purchase frequency anymore. The more frequent a customer purchases, the more opportunities to defect he/she will have, and because of the independence of p are λ the 15 Note that the previously made critical remarks regarding the memoryless property re- ferred to the exponentially distributed intertransaction times and not to the exponentially distributed lifetimes of the Pareto/NBD model.
- 41. CHAPTER 4. FORECAST MODELS 36 sooner that customer will defect (Fader et al., 2005a, p. 278). Interestingly, this fundamentally different consequence of A5 does not seem to play an important role in the overall model accuracy. 4.3.2 Empirical Results The implementation of the BG/NBD model on top of R has been indeed fairly straightforward, in particular because of the provided MATLAB source code in Fader et al. (2005b) which simply had to be ‘translated’ from one statistical programming environment to another. Also the computation of the maxi- mum likelihood estimation itself finishes far faster than for the Pareto/NBD because the Gaussian Hypergeometric function is not part of the optimized likelihood function anymore.16 The MLE method produced the following parameter estimates: r = 0.397, α = 331.8, and a = 0.777, b = 6.262. In accordance with the statements of Fader et al. (2005a), the overall char- acteristic of the distribution of transaction frequency λ across donors is not much different from the Pareto/NBD model. The corresponding mean is slightly higher (858 days) and the standard deviation slightly lower (546 days) for our estimated BG/NBD model. The dropout probability p varies around its mean a/(a + b) of 11%. The 11% correspond to an average life time of 9.1 ‘survived’ donations. Considering that the average number of donations has been 1.55 times, the underlying data seems again to be represented rather poorly. Further, figure 4.6 depicts the estimated distributions of λ and p and reveals that hardly any of the donors has a lifetime of less than 5 donations. Again this result is quite contrary to our findings from the exploratory analysis in chapter 3. It is likely that the same concerns regarding those problematic long living customers, that have already been raised in section 4.2, apply here too. Additionally, the simulation results of Fader et al. (2005a, p. 279) show that the BG/NBD model has problems mimicking the Pareto/NBD model if the transaction rate is very low, like it is the case for the DMEF data set. The 16 It took about 15 seconds on the author’s personal laptop, which is powered by a Intel Centrino 1.6GHz chip, to complete the calculations for the DMEF data set of 21,166 donors.
- 42. CHAPTER 4. FORECAST MODELS 37 Distribution of Purchase Frequency Distribution of Drop Out Probability Inf 250 125 83.3 62.5 50 Inf 5 2.5 1.7 1.2 1 100 10 shape = 0.4 a = 0.77 80 8 rate = 332 b = 6.26 60 6 40 4 20 2 0 0 0.000 0.005 0.010 0.015 0.020 0.0 0.2 0.4 0.6 0.8 1.0 Figure 4.6: Estimated Distribution of λ and p across Donors upcoming model will present a variant of the BG/NBD which fortunately can solve this issue. 4.4 CBG/NBD Model 4.4.1 Assumptions The CBG/NBD is a modified variant of the BG/NBD model and has been developed by Daniel Hoppe and Udo Wagner (Hoppe and Wagner, 2007). This variant makes similar assumptions as before but inserts an additional dropout opportunity at time zero. By doing so it resolves the rather unre- alistic implication of the BG/NBD model that all customers that have not (re-)purchased at all after time zero are still active. Hoppe and Wagner also show that their modification results in a slightly better fit to the publicly free available CDNOW data set that has been already used by Fader et al. (2005a) as a benchmark. Aside from providing this new variant of the BG/NBD Hoppe and Wagner additionally contribute valuable insight by deriving their mathematic key expressions by focusing on counting processes instead of timing processes and thereby can reduce the inherent complexity in the derivations significantly. For this reason the article Hoppe and Wagner (2007) is a highly recommended reading also in terms of gaining a deeper understanding of the BG/NBD model. Around the same time as Hoppe and Wagner worked on their model, Batis-
- 43. CHAPTER 4. FORECAST MODELS 38 lam, Denizel, and Filiztekin developed the same modification of the BG/NBD and termed it MBG/CBG (Batislam et al., 2007), whereas the letter M stands for modified. Within this thesis we choose to use the abbreviation CBG/NBD instead of MBD/NBD when we refer to this kind of variant, because the term CBG adheres a deeper meaning as it abbreviates central variant of the Be- tageometric distribution. A1 While active, the number of transactions follows a Pois- son process with rate λ. A2 Heterogeneity in λ follows a Gamma distribution with shape parameter r and rate parameter α across cus- tomers. A3 At time zero and directly after each purchase there is a constant probability p that the customer becomes inac- tive. A4 Heterogeneity in p follows a Beta distribution with pa- rameters a and b across customers. A5 The transaction rate λ and the dropout probability p are distributed independently of each other. Table 4.9: CBG/NBD Assumptions As can be seen in table 4.9, assumptions A1, A2, A4, and A5 are identical to the corresponding assumptions of the BG/NBD model. Only assumption A3 is slightly modified. It now allows for the aforementioned immediate defect of a customer at time zero. The same constant probability p is used for this additional dropout opportunity. 4.4.2 Empirical Results The BG/NBD assumptions imply that all single-time donors, which repre- sent the majority of the data set, are still ‘active’ despite an inactivity period of over 4.5 years. Taking this implausible implication into account, it can be expected that the added dropout opportunity of the CBG/NBD model is necessary to fit our data structure appropriately.
- 44. CHAPTER 4. FORECAST MODELS 39 Our implementation on top of R results in the following parameter estimates: r = 1.113, α = 552.5, and a = 0.385, b = 0.668. The related estimated distributions of λ and p can be depicted from figure 4.7. Distribution of Purchase Frequency Distribution of Drop Out Probability Inf 250 125 83.3 62.5 50 Inf 5 2.5 1.7 1.2 1 100 10 shape = 1.11 a = 0.38 80 rate = 552 8 b = 0.67 60 6 40 4 20 2 0 0 0.000 0.005 0.010 0.015 0.020 0.0 0.2 0.4 0.6 0.8 1.0 Figure 4.7: Estimated Distribution of λ and p across Donors Comparing this with figure 4.6 from the previous section, we notice the fun- damentally different shape for the distribution of the dropout probability. It has one peak at 1, representing the single-time donors, and one peak at 0, representing those loyal, long-living donors which hardly defect at all. The mean number of repetitive donations is now 2.7 times, and seems much more realistic in comparison with the estimate of 9.1 donations made by the BG/NBD model. On the other hand, the detected level of heterogeneity within life time, measured in terms of the standard deviation of p, increased from 0.11 to 0.34 for the CBG/NBD model at the same time. Further, the average intertransaction time has dropped from 836 to 496 days with the standard deviation remaining at the high level of 524 days. This is a logical effect, since the single-timer donors are now allowed to defect im- mediately and do not bias the donation frequency anymore. The same con- sequence, a higher mean purchase rate together with a higher dropout prob- ability, has been diagnosed by Hoppe and Wagner (2007) for the CDNOW data set. If we observe the estimates for the number of active donors at the end of the observation period, then the difference between these models become