Dividend weekly 04 2013 By http://long-term-investments.blogspot.com
Etf Top 40 20 Jun2012
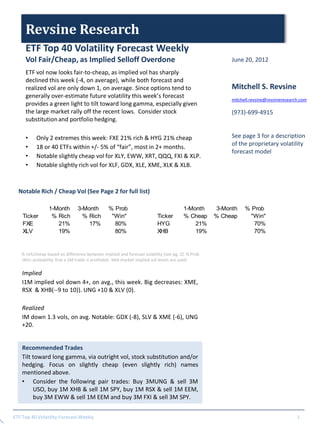
1. Revsine Research
ETF Top 40 Volatility Forecast Weekly
Vol Fair/Cheap, as Implied Selloff Overdone June 20, 2012
ETF vol now looks fair-to-cheap, as implied vol has sharply
declined this week (-4, on average), while both forecast and
realized vol are only down 1, on average. Since options tend to Mitchell S. Revsine
generally over-estimate future volatility this week’s forecast
mitchell.revsine@revsineresearch.com
provides a green light to tilt toward long gamma, especially given
the large market rally off the recent lows. Consider stock (973)-699-4915
substitution and portfolio hedging.
• Only 2 extremes this week: FXE 21% rich & HYG 21% cheap See page 3 for a description
of the proprietary volatility
• 18 or 40 ETFs within +/- 5% of “fair”, most in 2+ months.
forecast model
• Notable slightly cheap vol for XLY, EWW, XRT, QQQ, FXI & XLP.
• Notable slightly rich vol for XLF, GDX, XLE, XME, XLK & XLB.
Notable Rich / Cheap Vol (See Page 2 for full list)
1-Month 3-Month % Prob 1-Month 3-Month % Prob
Ticker % Rich % Rich "Win" Ticker % Cheap % Cheap "Win"
FXE 21% 17% 80% HYG 21% 70%
XLV 19% 80% XHB 19% 70%
% rich/cheap based on difference between implied and forecast volatility (see pg. 2). % Prob
:Win: probability that a 1M trade is profitable. Mid-market implied vol levels are used.
Implied
I1M implied vol down 4+, on avg., this week. Big decreases: XME,
RSX & XHB(--9 to 10)). UNG +10 & XLV (0).
Realized
IM down 1.3 vols, on avg. Notable: GDX (-8), SLV & XME (-6), UNG
+20.
Recommended Trades
Tilt toward long gamma, via outright vol, stock substitution and/or
hedging. Focus on slightly cheap (even slightly rich) names
mentioned above.
• Consider the following pair trades: Buy 3MUNG & sell 3M
USO, buy 1M XHB & sell 1M SPY, buy 1M RSX & sell 1M EEM,
buy 3M EWW & sell 1M EEM and buy 3M FXI & sell 3M SPY.
ETF Top 40 Volatility Forecast Weekly 1
3. Revsine Research
About the Stochastic Volatility Forecast Model
The proprietary volatility forecasting model referenced in this
note is a Stochastic Volatility model. It was developed by Triple 3
Partners, a specialized volatility investment and advisory group,
with whom Revsine Research has a close collaboration. Revsine
Research is the sole distributor for the model with respect to US
Equities.
The model has been developed and fully back tested, and has
been utilized for the past five years. Four of the world’s leading
global banks are clients of Triple 3 Partners, and subscribe to
volatility forecast research for FX and non-US Equity products. As
well, Triple 3 Partners has successfully traded the model signals
for the past 2 years, focused exclusively on VIX options,
For more information about Triple 3 Partners, the model or its
investment strategy, please contact: vol@triple3p.com or visit
them at: www.triple3p.com
Options Risk Disclosure
Options are not suitable for all investors. Prior to investing in listed
options investors should carefully read and understand the
Options Clearing Corporation Disclosure Document
(Characteristics and Risks of Standardized Options) at:
http://www.optionsclearing.com/publications/risks/riskstoc.pdf
Copyright Revsine Research 2012
ETF Top 40 Volatility Forecast Weekly 3