2016 R3 Jeff Kunz
•
0 likes•215 views

This document discusses managing single-stream recycling under a blended value pricing model. It provides background on a contract with Waste Management to process single-stream recyclables, defining key terms like blended value, net value, and composition audits. It also shows commodity price indices from 2012-2016 that illustrate declines in most recyclable material values. Finally, it presents an example calculation of the blended value per ton and net rebate for a community's recyclables based on current composition and pricing.

Recommended
More Related Content
Viewers also liked
More from MassRecycle .
More from MassRecycle . (20)
Recently uploaded
Recently uploaded (20)
2016 R3 Jeff Kunz
- 1. Managing Municipal Materials in a Difficult Market Topic: Managing Single Stream Recyclables Processing Under Blended Value Pricing Presentation by: Jeff Kunz Town of Braintree, Solid Waste Advisor Contract background: Vendor: Waste Management, Avon Inc. (WM) Term: 01/01/2015 – 06/30/2018 Pricing: Net value (“Blended Value”) of Single Stream Materials Pricing Guides/Definitions: Blended Value (BV) – total weighted value per ton of each recyclable and non-recyclable component (including negatively-valued recyclables and transfer and disposal costs of non- recyclables) for Single Stream materials delivered by or on behalf of customer to the designated facility – each commodity value is added together to obtain the BV/ton Net Value – amount paid to customer by the company or paid to the company by the customer, after subtracting any charges owed by customer from the customer’s Value Share (customer’s percentage of the Blended Value per contract terms) Composition Audit – basis upon which Single Stream materials are measured to determine the percentage of each recyclable and residue component – typically every six (6) months Vendor Composition – composition of all materials delivered to WM facility Commodity Value – values are calculated monthly based on commonly accepted published price guides or actual market values (contract Term Sheet) Initial Company Fee – contracted cost/ton based on WM determination of costs associated with running their business….may be adjusted annually using CPI price adjustment information (negotiable) Material Specifications – contractual Exhibit to any agreement to define acceptable and unacceptable materials (includes definitions of ‘residue’ materials)
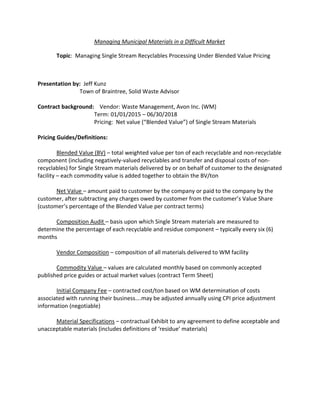
- 3. Material Commodity Index 2016 to 2012 change % YTY change % 2016 (YTD) 2015 Annual AVG 2014 Annual AVG 2013 Annual AVG 2012 Annual AVG Newspapers, magazines and inserts PPW ONP #8 -23% -1% 55.00$ 55.83$ 64.17$ 67.50$ 71.67$ Cardboard, and brown papers PPW OCC #11 -28% 0% 85.00$ 85.42$ 103.75$ 112.92$ 118.75$ Aluminum / beverage cans SMP for Aluminum Cans (Sorted, Baled, ¢/lb, delivered) -29% -15% 1,100.00$ 1,294.00$ 1,584.20$ 1,529.00$ 1,557.00$ Steel/Tin SMP for Steel Cans (Sorted, Densified, ($/Ton delivered) -76% -66% 30.00$ 89.10$ 120.00$ 120.00$ 124.80$ Plastic #1 SMP for PET (baled, ¢/lb. picked up) -63% -31% 180.00$ 261.20$ 382.80$ 401.80$ 481.40$ Plastic #2 Natural SMP for Natural HDPE (baled, ¢/lb. picked up) -9% -3% 590.00$ 607.40$ 975.80$ 715.40$ 650.60$ Plastic #2 Colored SMP for Colored HDPE (baled, ¢/lb. picked up) -14% -8% 440.00$ 480.80$ 594.20$ 446.20$ 509.00$ Glass (3 Mix) Actual -16% 6% (36.82)$ (39.35)$ (32.52)$ (16.59)$ (31.76)$ Note: All commodity index values expressed as a price per ton.
- 4. Blended Value Per Ton A B c D E Material Component Commodity Value Actual Value in$ff Composition Audit Percentage Blended Value Contribution C*D srr Newspapers, magazines and inserts PPW ONP #8 HS NE $ 55.00 46.5% $ 25.56 Cardboard, and brown papers PPW OCC#l 1 HS NE $ 85.00 18.6% $ 15.80 Mixed Paper PPW #2 Mixed Paper HS NE $ 45.00 0.0% $ - Aluminum I beverage cans SMP for Aluminum Cans (Sorted, Baled, ¢/lb, delivered) minus .25 ¢/lb $ 1,000.00 0.7% $ 7.23 Steel/Tin SMP for Steel Cans (Sorted, Densified, ($ffon delivered) minus $10 I Ton $ 20.00 1.7% $ 0.33 Plastic #1 SMP for PET (baled, ¢/lb. picked up) $ 180.00 3.1% $ 5.58 Plastic #2 Natural SMP for Natural HDPE ((baled, ¢/lb. picked up) $ 540.00 0.7% $ 3.90 Plastic #2 Colored SMP for Colored HDPE ((baled, ¢/lb. picked up) $ 350.00 1.0% $ 3.61 #3-#7 Plastics Actual Value $ 10.00 0.3% $ 0.03 Rigid Plastics Actual Value $ 60.00 0.5% $ 0.31 Glass Actual Value $ (34.18) 17.6% $ (6.00) Non-Recyclables Costs T & D $ (63.00) 9.1% $ (5.74) Scrap Metal Actual Va1ue $ 26.79 0.2% $ 0.06 Other (Insert) Actual Value 0.0% $ - Total Blended Value- (BV, MV, AMv, RS) 100.00% $ 50.68 BLENDED VALUE Feb-16 Processing Charge $ 78.00 Net Rebate - (Charge) $ (27.32)