1. Cost-Volume-Profit (CVP) Analysis
Cost –volume-profit analysis basically identifies the relationship between those three terms. Use for
profit planning process of the firm. Its most common application is break-even analysis.
Cost-Volume-Profit (CVP) – Assumptions
All cost can be separated in to fixed and variable.
Total fixed cost does not change over the given volume range.
Per unit selling price and per unit variable cost do not change
In the multi product situations, sales mix of the products does not change.
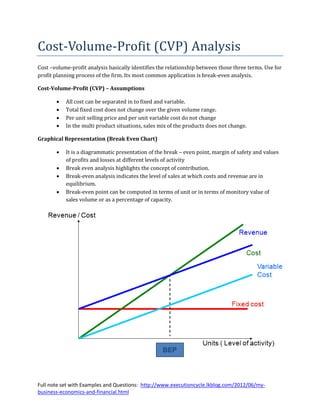
Graphical Representation (Break Even Chart)
It is a diagrammatic presentation of the break – even point, margin of safety and values
of profits and losses at different levels of activity
Break even analysis highlights the concept of contribution.
Break-even analysis indicates the level of sales at which costs and revenue are in
equilibrium.
Break-even point can be computed in terms of unit or in terms of monitory value of
sales volume or as a percentage of capacity.
Full note set with Examples and Questions: http://www.executioncycle.lkblog.com/2012/06/my-
business-economics-and-financial.html
2. The Profit/Volume Graph (P/V graph)
The P/V graph is another type of break-even chart which shows the profit or loss at
different levels of activity, usually in terms of sales
The profit/loss at a given level of activity is shown clearly in this diagram which could
be considered a further refinement of previous diagram
However variation of revenue and cost are lost sight of which is an inherent weakness
in this graph
Contribution Margin (CM)
The CVP model can be re-written as
Profit (P) = Contribution [(p-v)x] – Fixed Cost (f)
This equation implies that profit fluctuates with changes in contribution
Hence, profit is dependent on contribution
More specifically, profit is directly proportional to contribution
It is that level of activity (output or sales since production is assumed to equal sales) at
which the firm neither enjoys any profit nor incurs any loss
That is the level of output whose contribution margin just covers the fixed costs
Beyond the break-even point every unit sold brings in contribution, which is termed profit
Full note set with Examples and Questions: http://www.executioncycle.lkblog.com/2012/06/my-
business-economics-and-financial.html
3. Break –even point (BEP)
𝒇𝒊𝒙𝒆𝒅 𝒄𝒐𝒔𝒕
𝑩𝑬𝑷 𝒊𝒏 𝒖𝒏𝒊𝒕𝒔 =
𝒄𝒐𝒏𝒕𝒓𝒊𝒃𝒖𝒕𝒊𝒐𝒏 𝒑𝒆𝒓 𝒖𝒏𝒊𝒕𝒔
In order to find out the break-even point in revenue terms the break-even equation can
be multiplied by the price per unit on both sides
𝒇𝒊𝒙𝒆𝒅 𝒄𝒐𝒔𝒕
𝑩𝑬𝑷 𝒓𝒆𝒗𝒆𝒏𝒖𝒆 =
𝑪𝒐𝒏𝒕𝒓𝒊𝒃𝒖𝒕𝒊𝒐𝒏 𝒑𝒆𝒓 𝒓𝒖𝒑𝒆𝒆 𝒐𝒇 𝒓𝒆𝒗𝒆𝒏𝒖𝒆
The BEP tends to increase with increase of fixed cost or variable cost per unit
Further BEP tends to decrease with the decrease of fixed costs or variable cost per unit
or increase of selling price per unit
It is preferable for any organization to conduct its business with a low break-even point
The break – even point (units or revenue ) is a very useful summary statistic of the three
parameters
o Price
o Variable cost
o Fixed cost
Which enables the manager to judge whether a given product line or entire production
division will be profitable at a given level of activity or if not
Also when it will start generation profits
Margin of Safety (MS)
It is the excess of sales (assuming production equals sales) over the break-even level sales
It indicates the amount by which sales can drop before loss making will occur
MS (Rs) = Sales value – BE sales
The margin of safety can also be expressed as a percentage
MS (%) = MSx100/ Sales Value
It acts as a measure of safety towards a possible fluctuation of sales about the budget value
Margin of safety is the distance between the given level of activity and the break-even point
In P/V graph the margin of safety is the distance between the maximum given level of
activity and the break –even point
Safety of the firm depends on profitability. Profitability depends on margin of safety. Hire
the margin of safety higher the profitability.
𝑀𝑎𝑟𝑔𝑖𝑛 𝑜𝑓 𝑠𝑎𝑓𝑒𝑡𝑦
𝑀𝑎𝑟𝑔𝑖𝑛 𝑜𝑓 𝑠𝑎𝑓𝑒𝑡𝑦 𝑟𝑎𝑡𝑖𝑜 = 𝑇𝑜𝑡𝑎𝑙 𝑆𝑎𝑙𝑒𝑠 𝑥100
Full note set with Examples and Questions: http://www.executioncycle.lkblog.com/2012/06/my-
business-economics-and-financial.html
4. Break Even Chart – Uses
Determination of the break-even point and margin of safety
Estimation of profits associated with a given level of activity
Estimation of the level of activity at which a given profit/loss is recorded
Observation of the variation of costs and sales with level of activity
Break-even analysis under Multi-product situation
This example describe how we can do break-even analysis under multi-product situation
Limitations of CVP analysis
Sometimes it is difficult to separate cost in to fixed and variable components
Difficult to use break-even analysis for multi product firm.
This is a short run concept and limited use in long run planning.
Assumptions of constant selling price, unit variable cost and fixed cost is not valid
Full note set with Examples and Questions: http://www.executioncycle.lkblog.com/2012/06/my-
business-economics-and-financial.html

![The Profit/Volume Graph (P/V graph)
The P/V graph is another type of break-even chart which shows the profit or loss at
different levels of activity, usually in terms of sales
The profit/loss at a given level of activity is shown clearly in this diagram which could
be considered a further refinement of previous diagram
However variation of revenue and cost are lost sight of which is an inherent weakness
in this graph
Contribution Margin (CM)
The CVP model can be re-written as
Profit (P) = Contribution [(p-v)x] – Fixed Cost (f)
This equation implies that profit fluctuates with changes in contribution
Hence, profit is dependent on contribution
More specifically, profit is directly proportional to contribution
It is that level of activity (output or sales since production is assumed to equal sales) at
which the firm neither enjoys any profit nor incurs any loss
That is the level of output whose contribution margin just covers the fixed costs
Beyond the break-even point every unit sold brings in contribution, which is termed profit
Full note set with Examples and Questions: http://www.executioncycle.lkblog.com/2012/06/my-
business-economics-and-financial.html](data:image/gif;base64,R0lGODlhAQABAIAAAAAAAP///yH5BAEAAAAALAAAAAABAAEAAAIBRAA7)