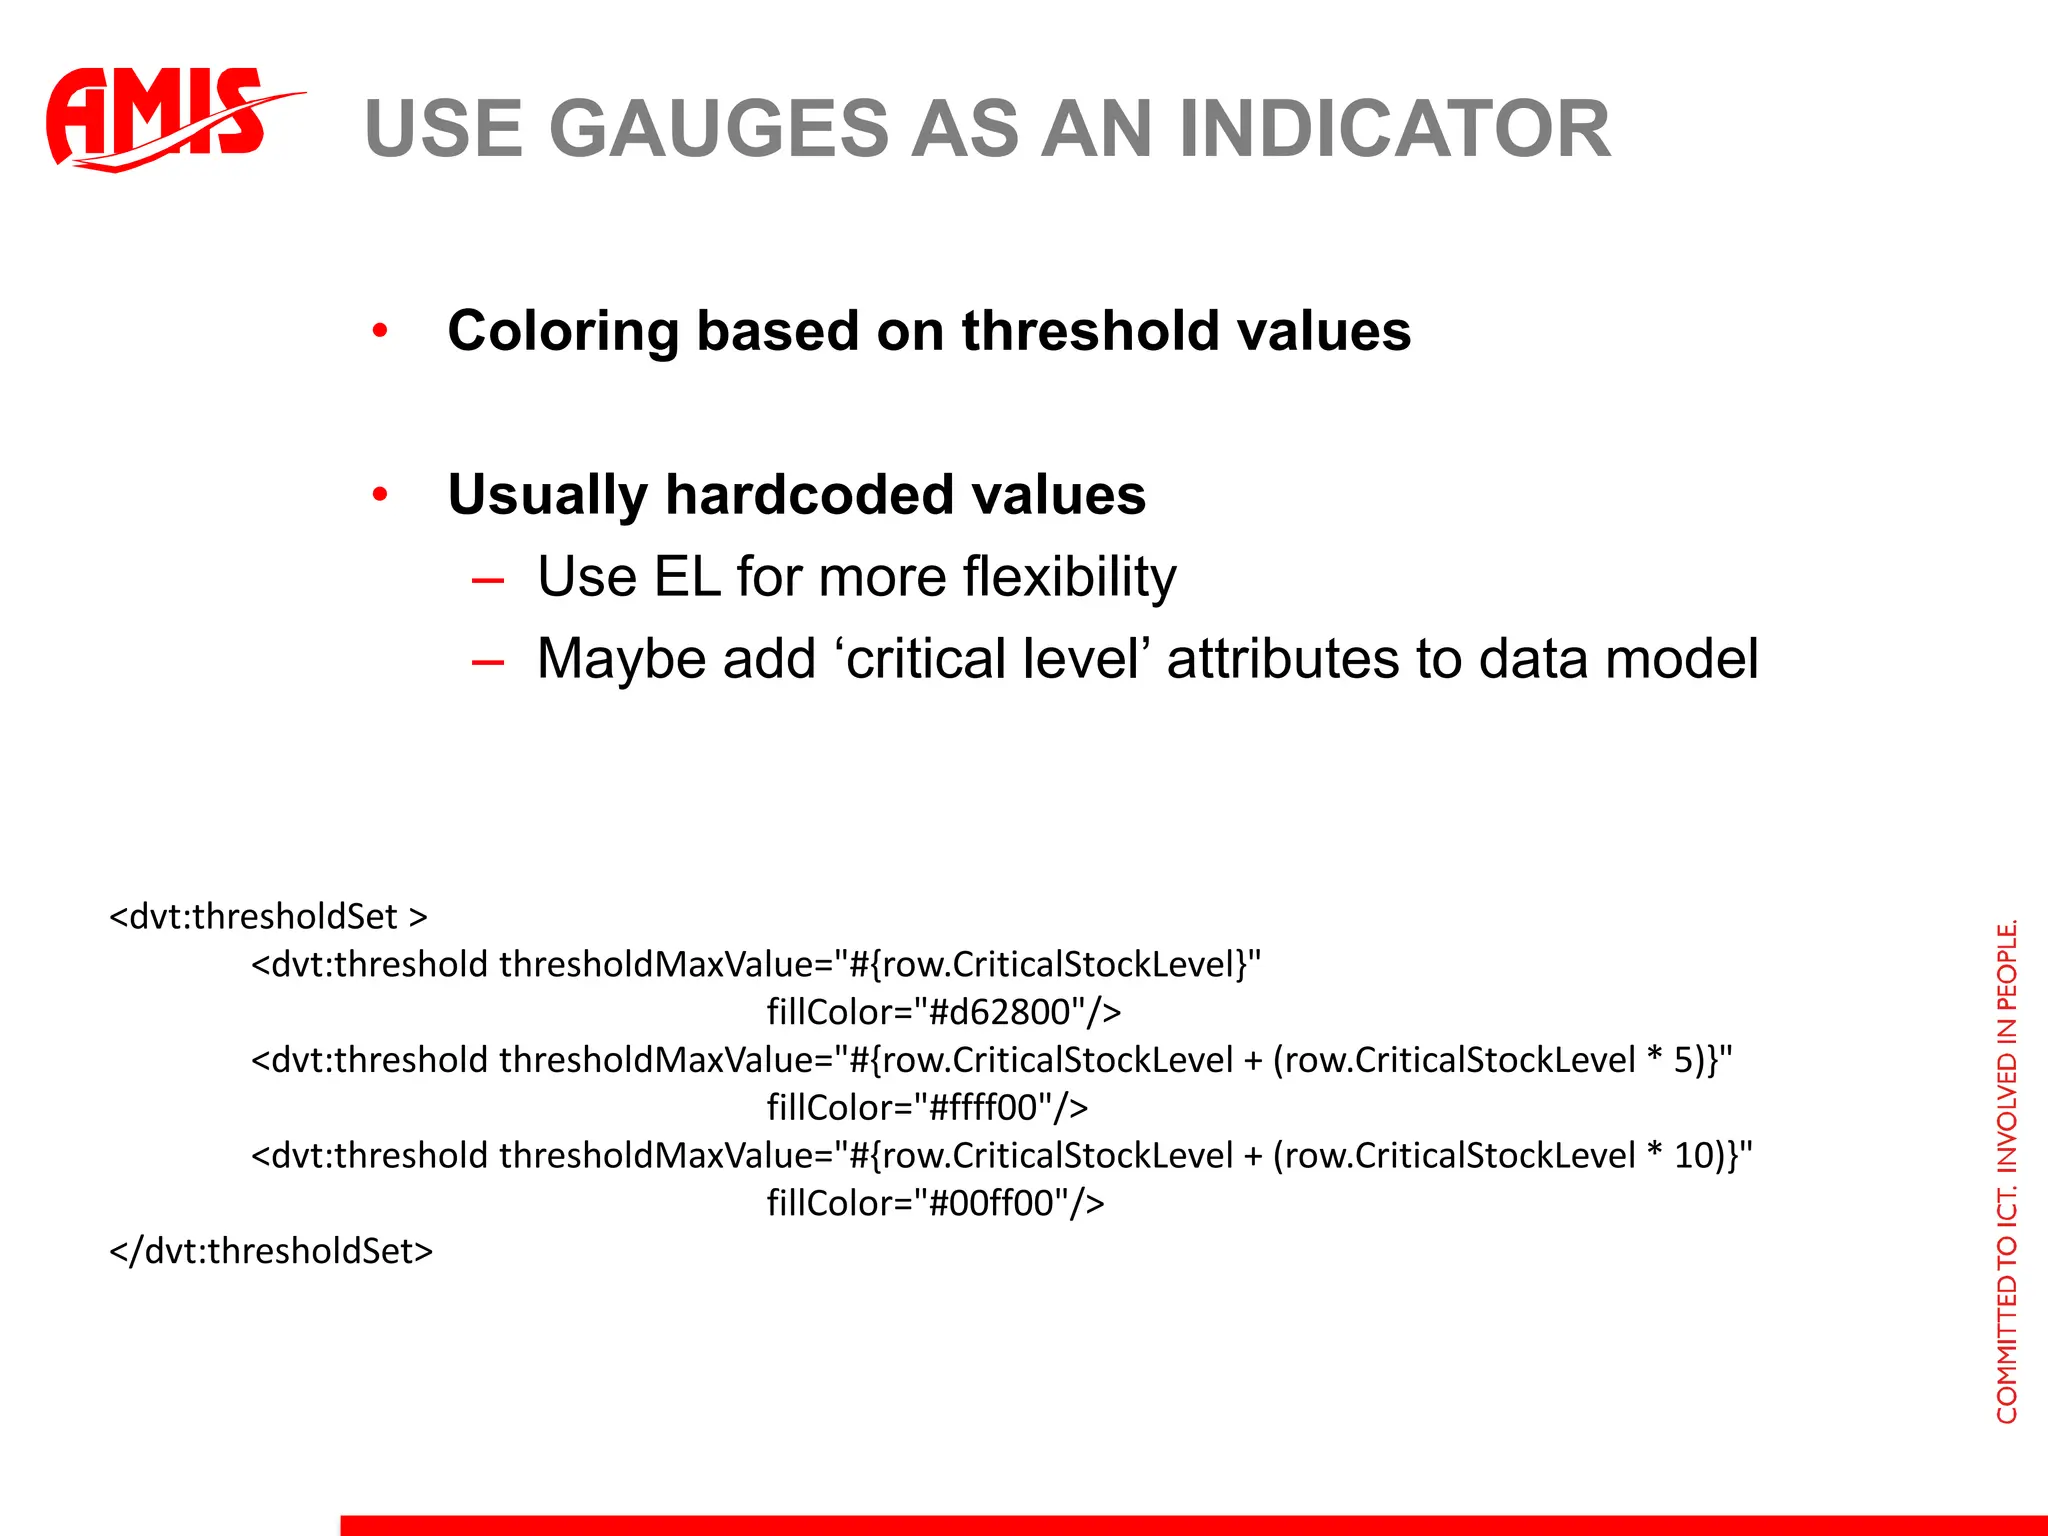
… ?Use Gaugesas an indicatorColoring based on threshold valuesUsually hardcoded valuesUse EL for more flexibilityMaybe add ‘critical level’ attributes to data model<dvt:thresholdSet > <dvt:thresholdthresholdMaxValue="#{row.CriticalStockLevel}" fillColor="#d62800"/> <dvt:thresholdthresholdMaxValue="#{row.CriticalStockLevel + (row.CriticalStockLevel * 5)}" fillColor="#ffff00"/> <dvt:thresholdthresholdMaxValue="#{row.CriticalStockLevel + (row.CriticalStockLevel * 10)}" fillColor="#00ff00"/></dvt:thresholdSet>
Bar Graphs :Beyond the DefaultsDefault coloring can be confusingDefault coloring can be uglyOverwrite Default colors<dvt:seriesSetdefaultColor="#0000ff">
… ?BarGraphs : Beyond the DefaultsTo add Selected Series HighlightingCreate Graph and Swap BarsUse a Custom ClickEvent
14.
Bar Graphs :Beyond the DefaultsUse a Custom ClickListenerIn Listener iterate, compare and highlightclickListener="#{backingBeanScope.barGraphBean.clickHandler}"//iterate over the row data for (inti = 0; i < rowCount; ++i) {// when row is found, color it REDbarGraph.getSeriesSet().getSeries(rwIndex, true).setColor(Color.RED);// when row is NOT found, color it BLUEbarGraph.getSeriesSet().getSeries(rwIndex, true).setColor(Color.BLUE);
15.
Bar Graphs :Beyond the Defaults250 !Stock level origin : Sales overviewWhy are these levels as they are ?Can we display actual ‘sales’ for the selected item in a bar graph ?
16.
Grouping Sales :Sales overview Create a graph based on a ‘read only’ viewObject that produces the query resultselect products_base.product_id, sum(quantity) total , product_nameprd, order_datedtfrom orders, order_items, products_basewhere ……….group by ……..
17.
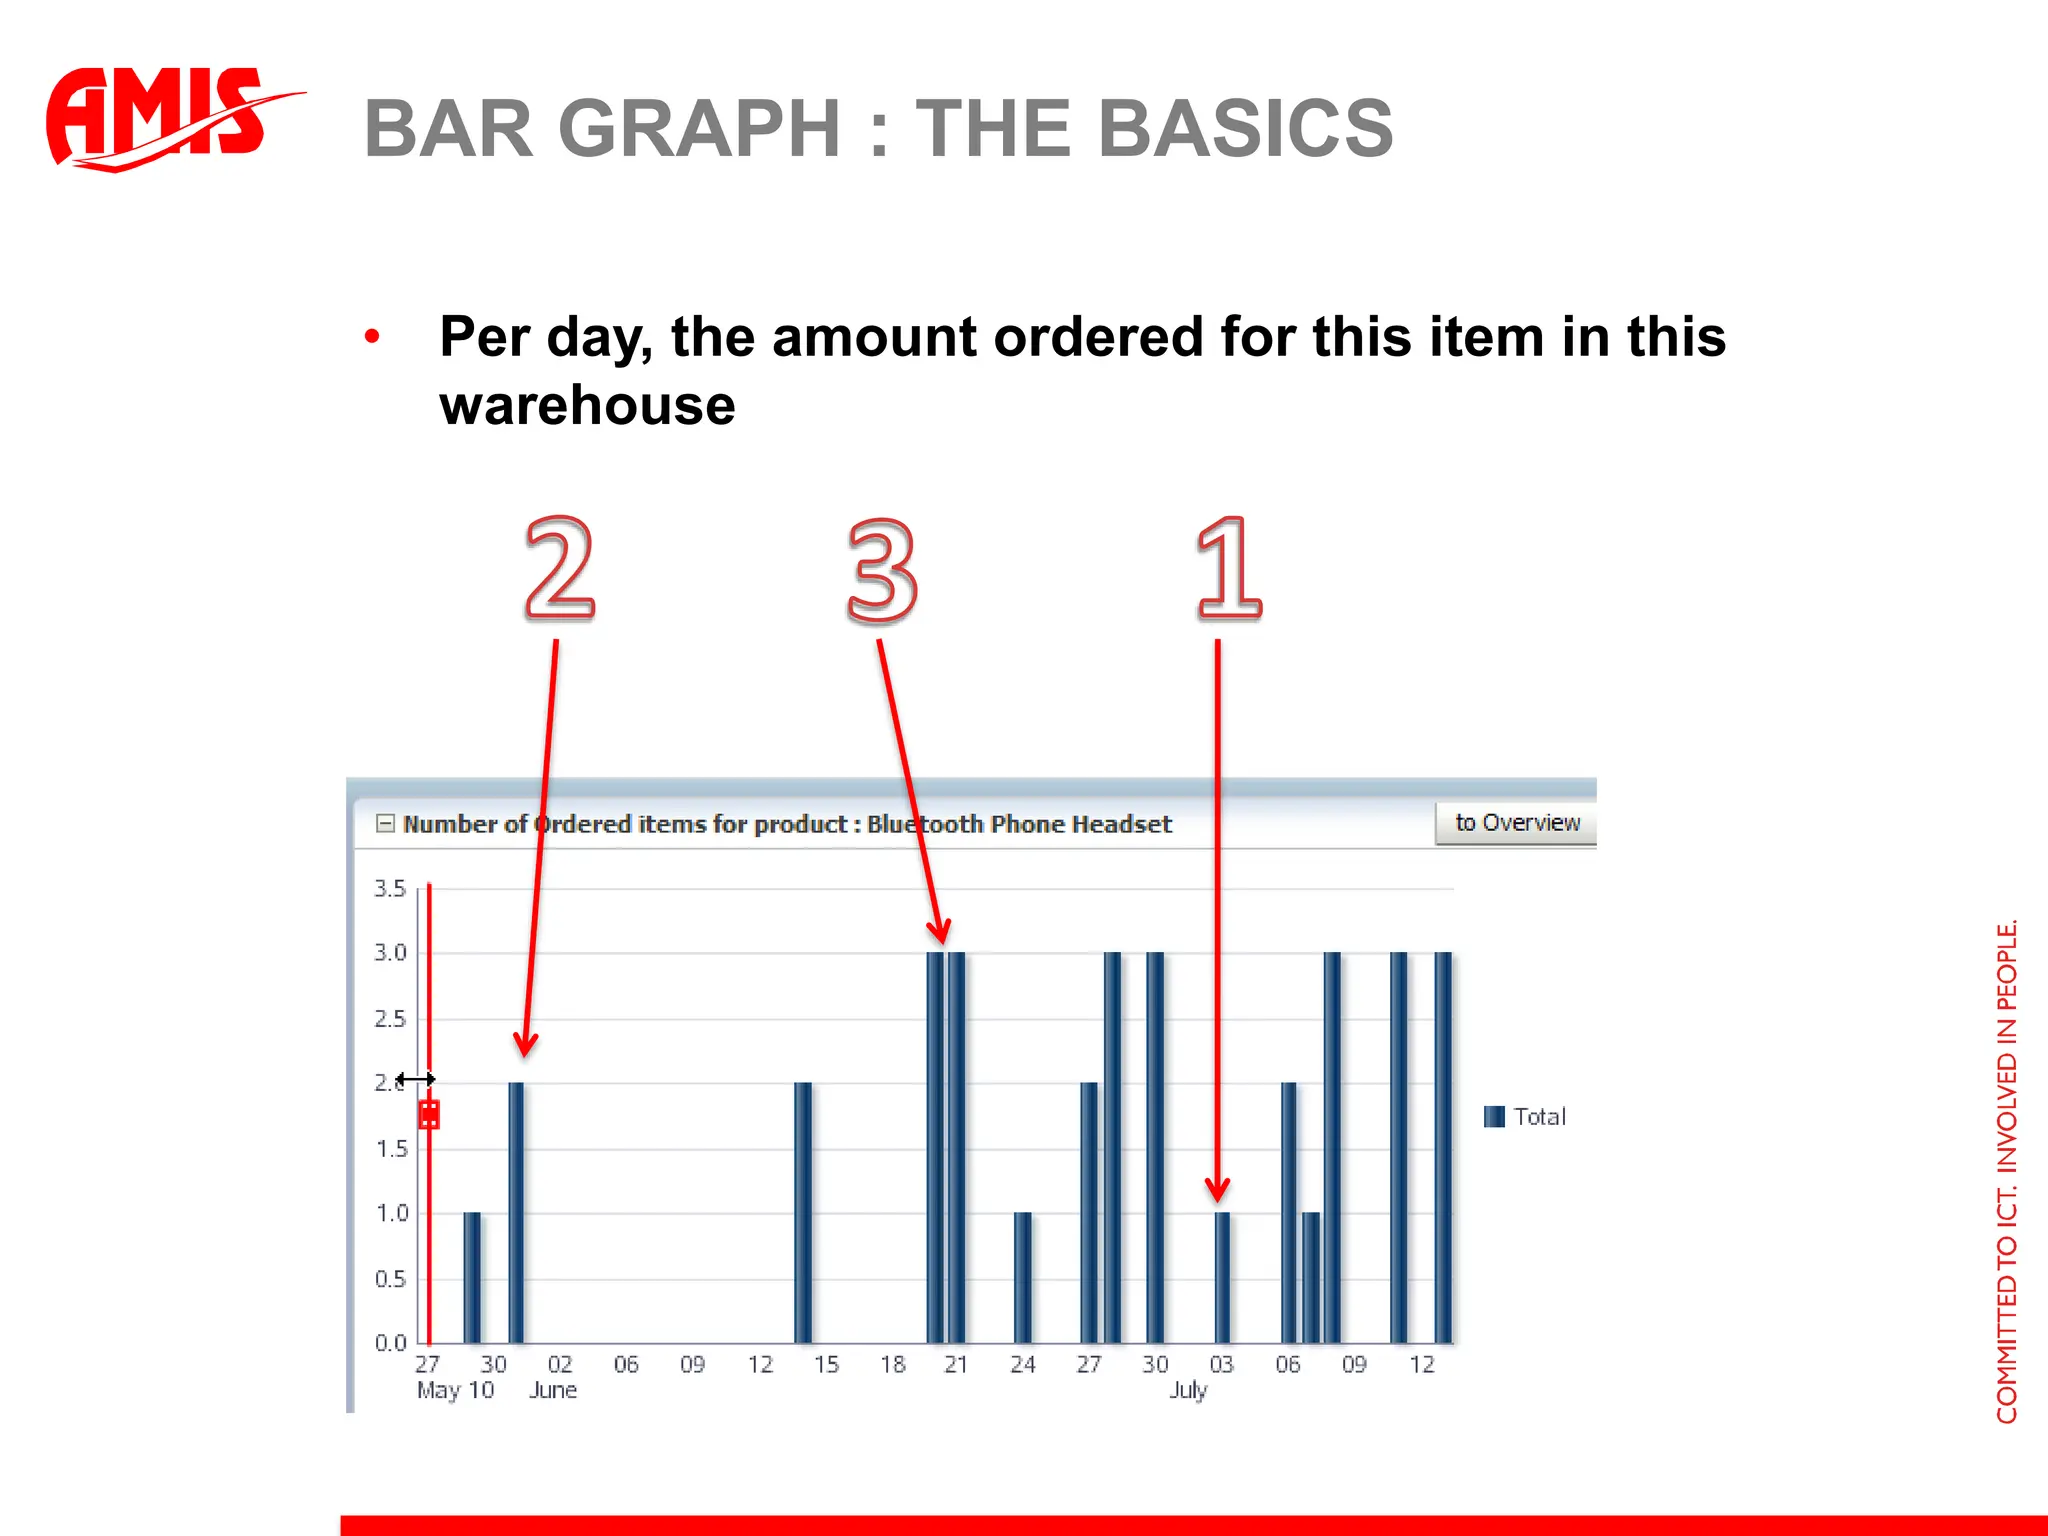
Bar Graph :the BasicsPer day, the amount ordered for this item in this warehouse213
18.
Grouping Sales :Sales overview Display sold items as percentage of totalWhat was the ‘percentage sold’ in a given week ?
19.
Grouping Sales :Sales overview Create a graph based on a ‘read only’ viewObject that produces the query resultselect sum(quantity) total , product_nameprdnam ,to_char(order_date, 'IW') weekfrom orders, order_items, products_baseWhere……group by …..
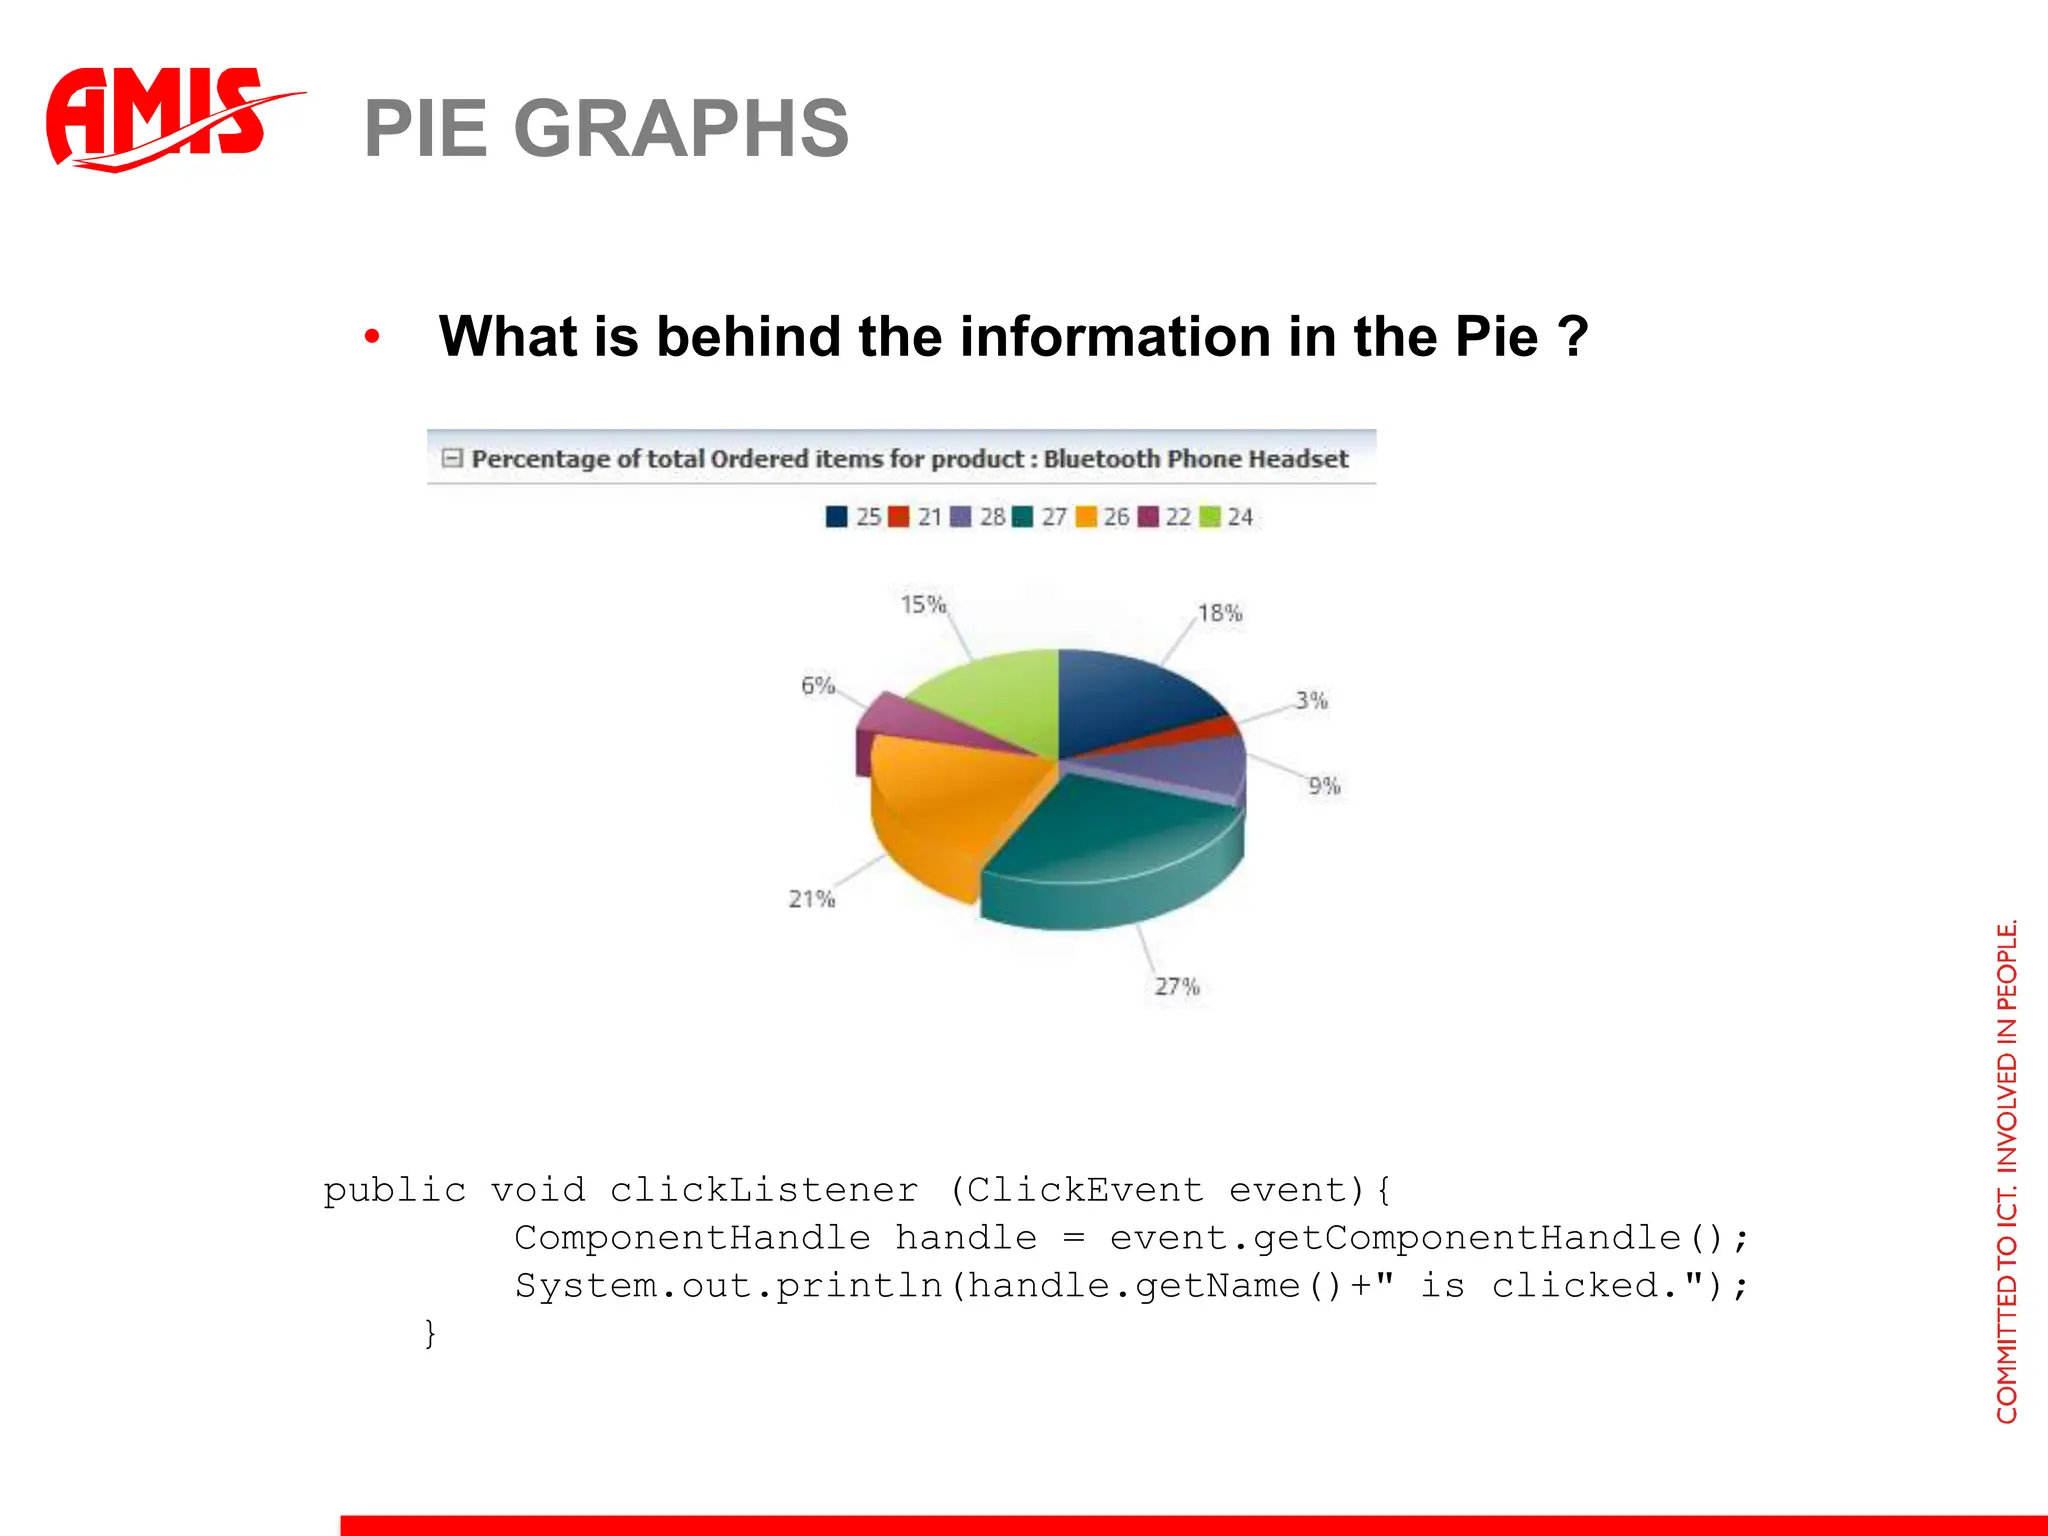
Pie GraphsWhat isbehind the information in the Pie ?public void clickListener (ClickEvent event){ComponentHandle handle = event.getComponentHandle();System.out.println(handle.getName()+" is clicked."); }
22.
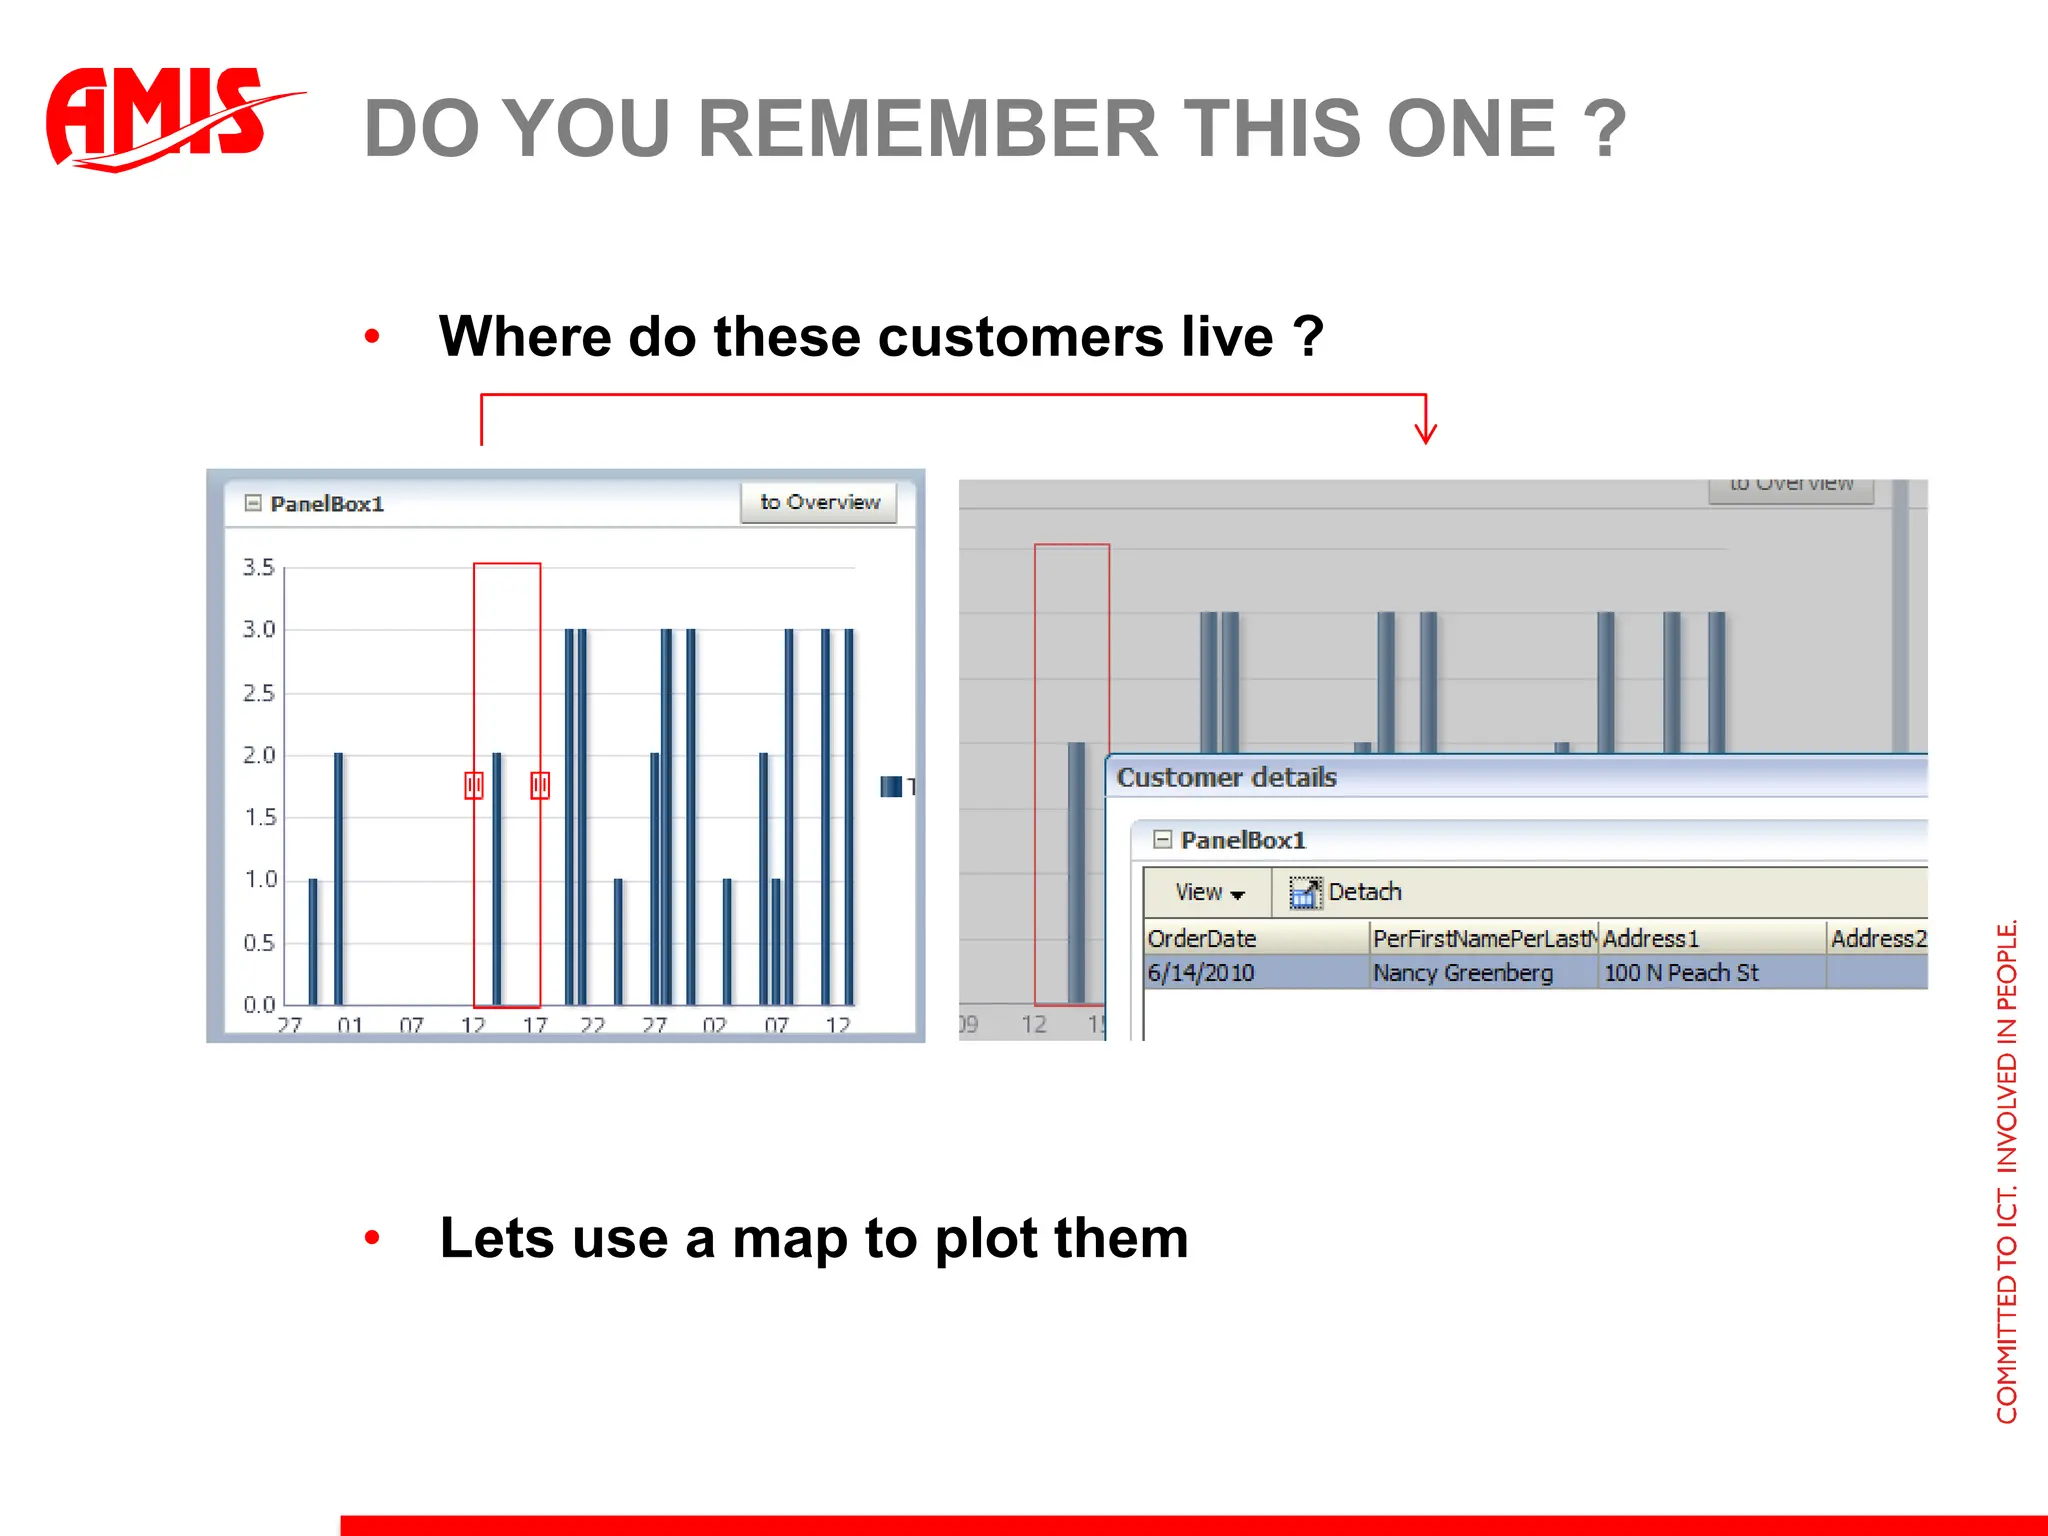
Do you rememberthis one ?Per day, the amount ordered for this item in this warehouseLet get some more detail here….
23.
Time Selector :Component infoUsing the TimeSelector Component to ‘drill down’TimeSelectorComponent can select date ranges in graphCan be difficult to use with existing datamodelsNeeds date range with no gapsOption: Create a view to fill in date gaps
24.
Time Selector :Example (1)Add timeSelector component to GraphUse the TimeSelectorListener, for instance to use start and end dates in a filter.<dvt:timeSelectortimeSelectorListener="#{timeSelectorBean.processTimeSelector}“explicitStart="#{timeSelectorBean.startDate} explicitEnd="#{timeSelectorBean.endDate}“ mode="EXPLICIT" fillColor="#ff7d7d“borderColor="#ff0000" id="tsl1“fillTransparent="true"/>public void processTimeSelector(TimeSelectorEventtimeSelectorEvent) { Date sdate = new Date(timeSelectorEvent.getStartTime()); Date edate = new Date(timeSelectorEvent.getEndTime()); // convert dates and use themOperationBinding ob = bindings.getOperationBinding("ExecuteWithParams"); Map params = ob.getParamsMap();params.put("b_startDate", Minorderdate);params.put("b_endDate", Maxorderdate);ob.execute();
25.
Time Selector :Example (2)Show what customers placed order in that particular time frame.
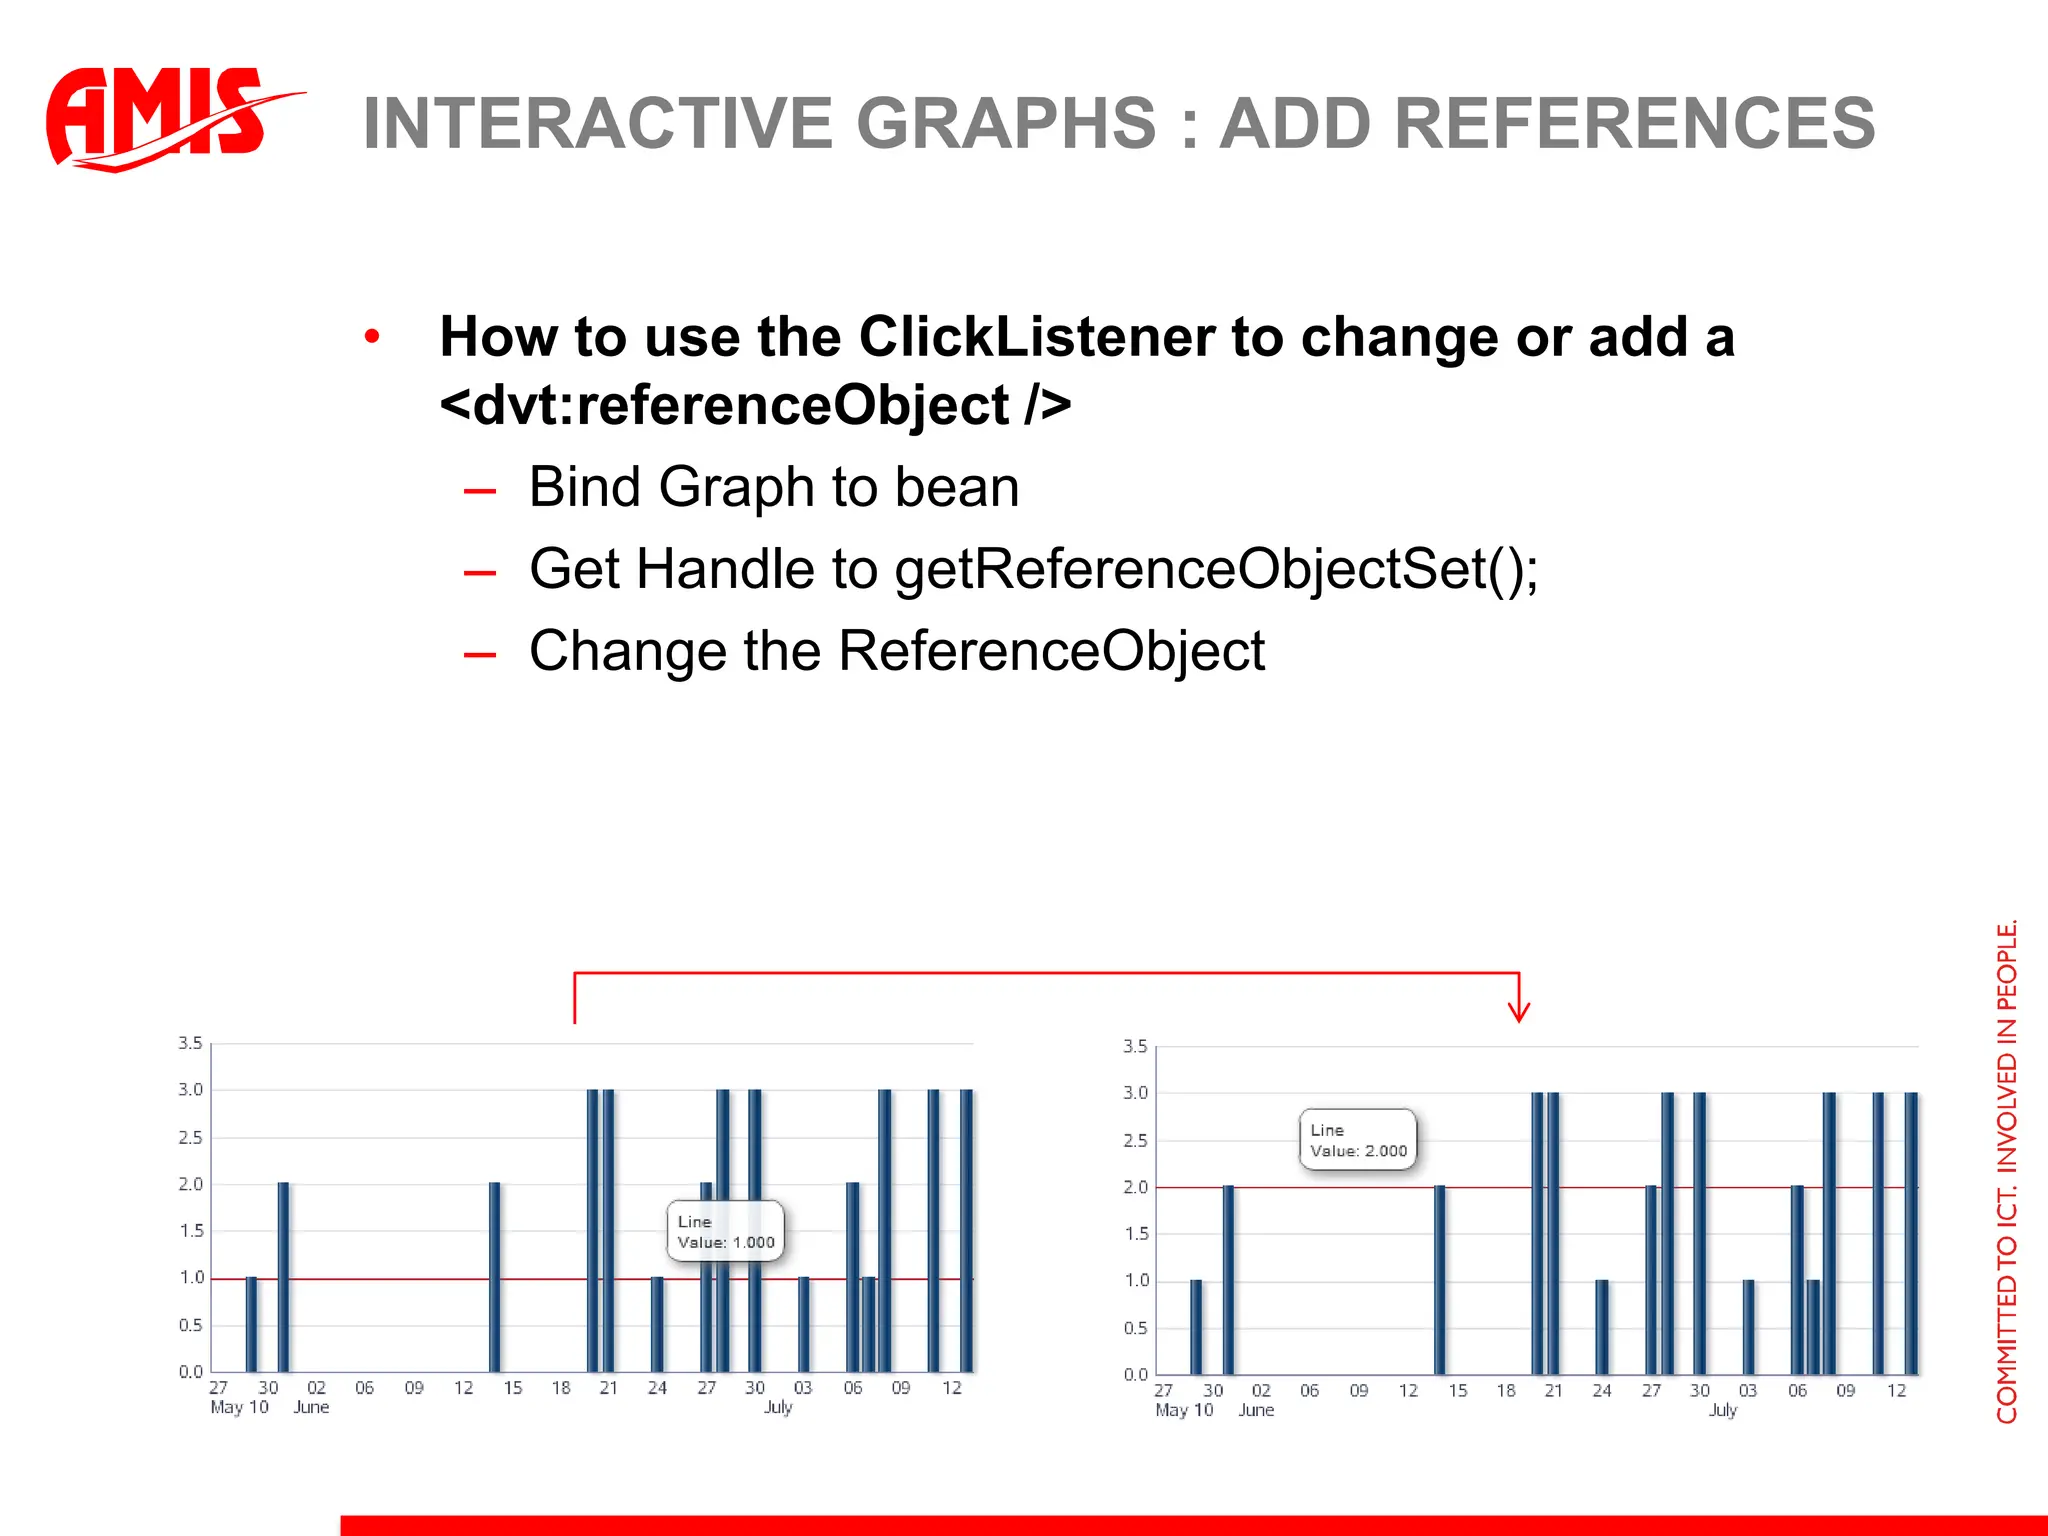
Interactive Graphs :add ReferencesHow to use the ClickListener to change or add a <dvt:referenceObject />Bind Graph to beanGet Handle to getReferenceObjectSet();Change the ReferenceObject
28.
Interactive Graphs :Update DataIn Click Listeners you can do almost anything you likeGet to the Data value (if needed)Display or…ProcessLong clickedValue = (Long)dhandle.getValue(DataComponentHandle.UNFORMATTED_VALUE);
29.
Interactive GraphsscrollbarPresenceGroupsZoomListener publicvoid zoomListener (ZoomEvent event){ double zoomMin = event.getAxisMin(ZoomEvent.Y1AXIS); double zoomMax = event.getAxisMax(ZoomEvent.Y1AXIS);intgroupStart = event.getAxisStartGroup(ZoomEvent.O1AXIS);intgroupCount = event.getAxisGroupCount(ZoomEvent.O1AXIS); System.out.println("Y1 Axis range "+Double.toString(zoomMin)+" to "+Double.toString(zoomMax));System.out.println("O1 Axis starting group index of "+Integer.toString(groupStart)+", and a group count of "+Integer.toString(groupCount)); }
30.
Lets take acloser look : ZoomingZoomListener public void zoomListener (ZoomEvent event){ double zoomMin = event.getAxisMin(ZoomEvent.Y1AXIS); double zoomMax = event.getAxisMax(ZoomEvent.Y1AXIS);intgroupStart = event.getAxisStartGroup(ZoomEvent.O1AXIS);intgroupCount = event.getAxisGroupCount(ZoomEvent.O1AXIS); System.out.println("Y1 Axis range "+Double.toString(zoomMin)+" to "+Double.toString(zoomMax));System.out.println("O1 Axis starting group index of "+Integer.toString(groupStart)+", and a group count of "+Integer.toString(groupCount)); }
31.
Interactive GraphsScrollListenerThe listenerinterface for receiving scroll events on the graph. The event triggers when an axis of a graph is scrolled. Here is an example of scrollListener implementation that displays the range of the Y1 Axis and the O1 Axis - public void scrollListener (ScrollEvent event){ double zoomMin = event.getAxisMin(ScrollEvent.Y1AXIS); double zoomMax = event.getAxisMax(ScrollEvent.Y1AXIS);intgroupStart = event.getAxisStartGroup(ScrollEvent.O1AXIS);intgroupCount = event.getAxisGroupCount(ScrollEvent.O1AXIS); System.out.println("Y1 Axis has a range from "+Double.toString(zoomMin)+" to "+Double.toString(zoomMax));System.out.println("O1 Axis has starting group index of "+Integer.toString(groupStart)+", and a group count of "+Integer.toString(groupCount)); }
32.
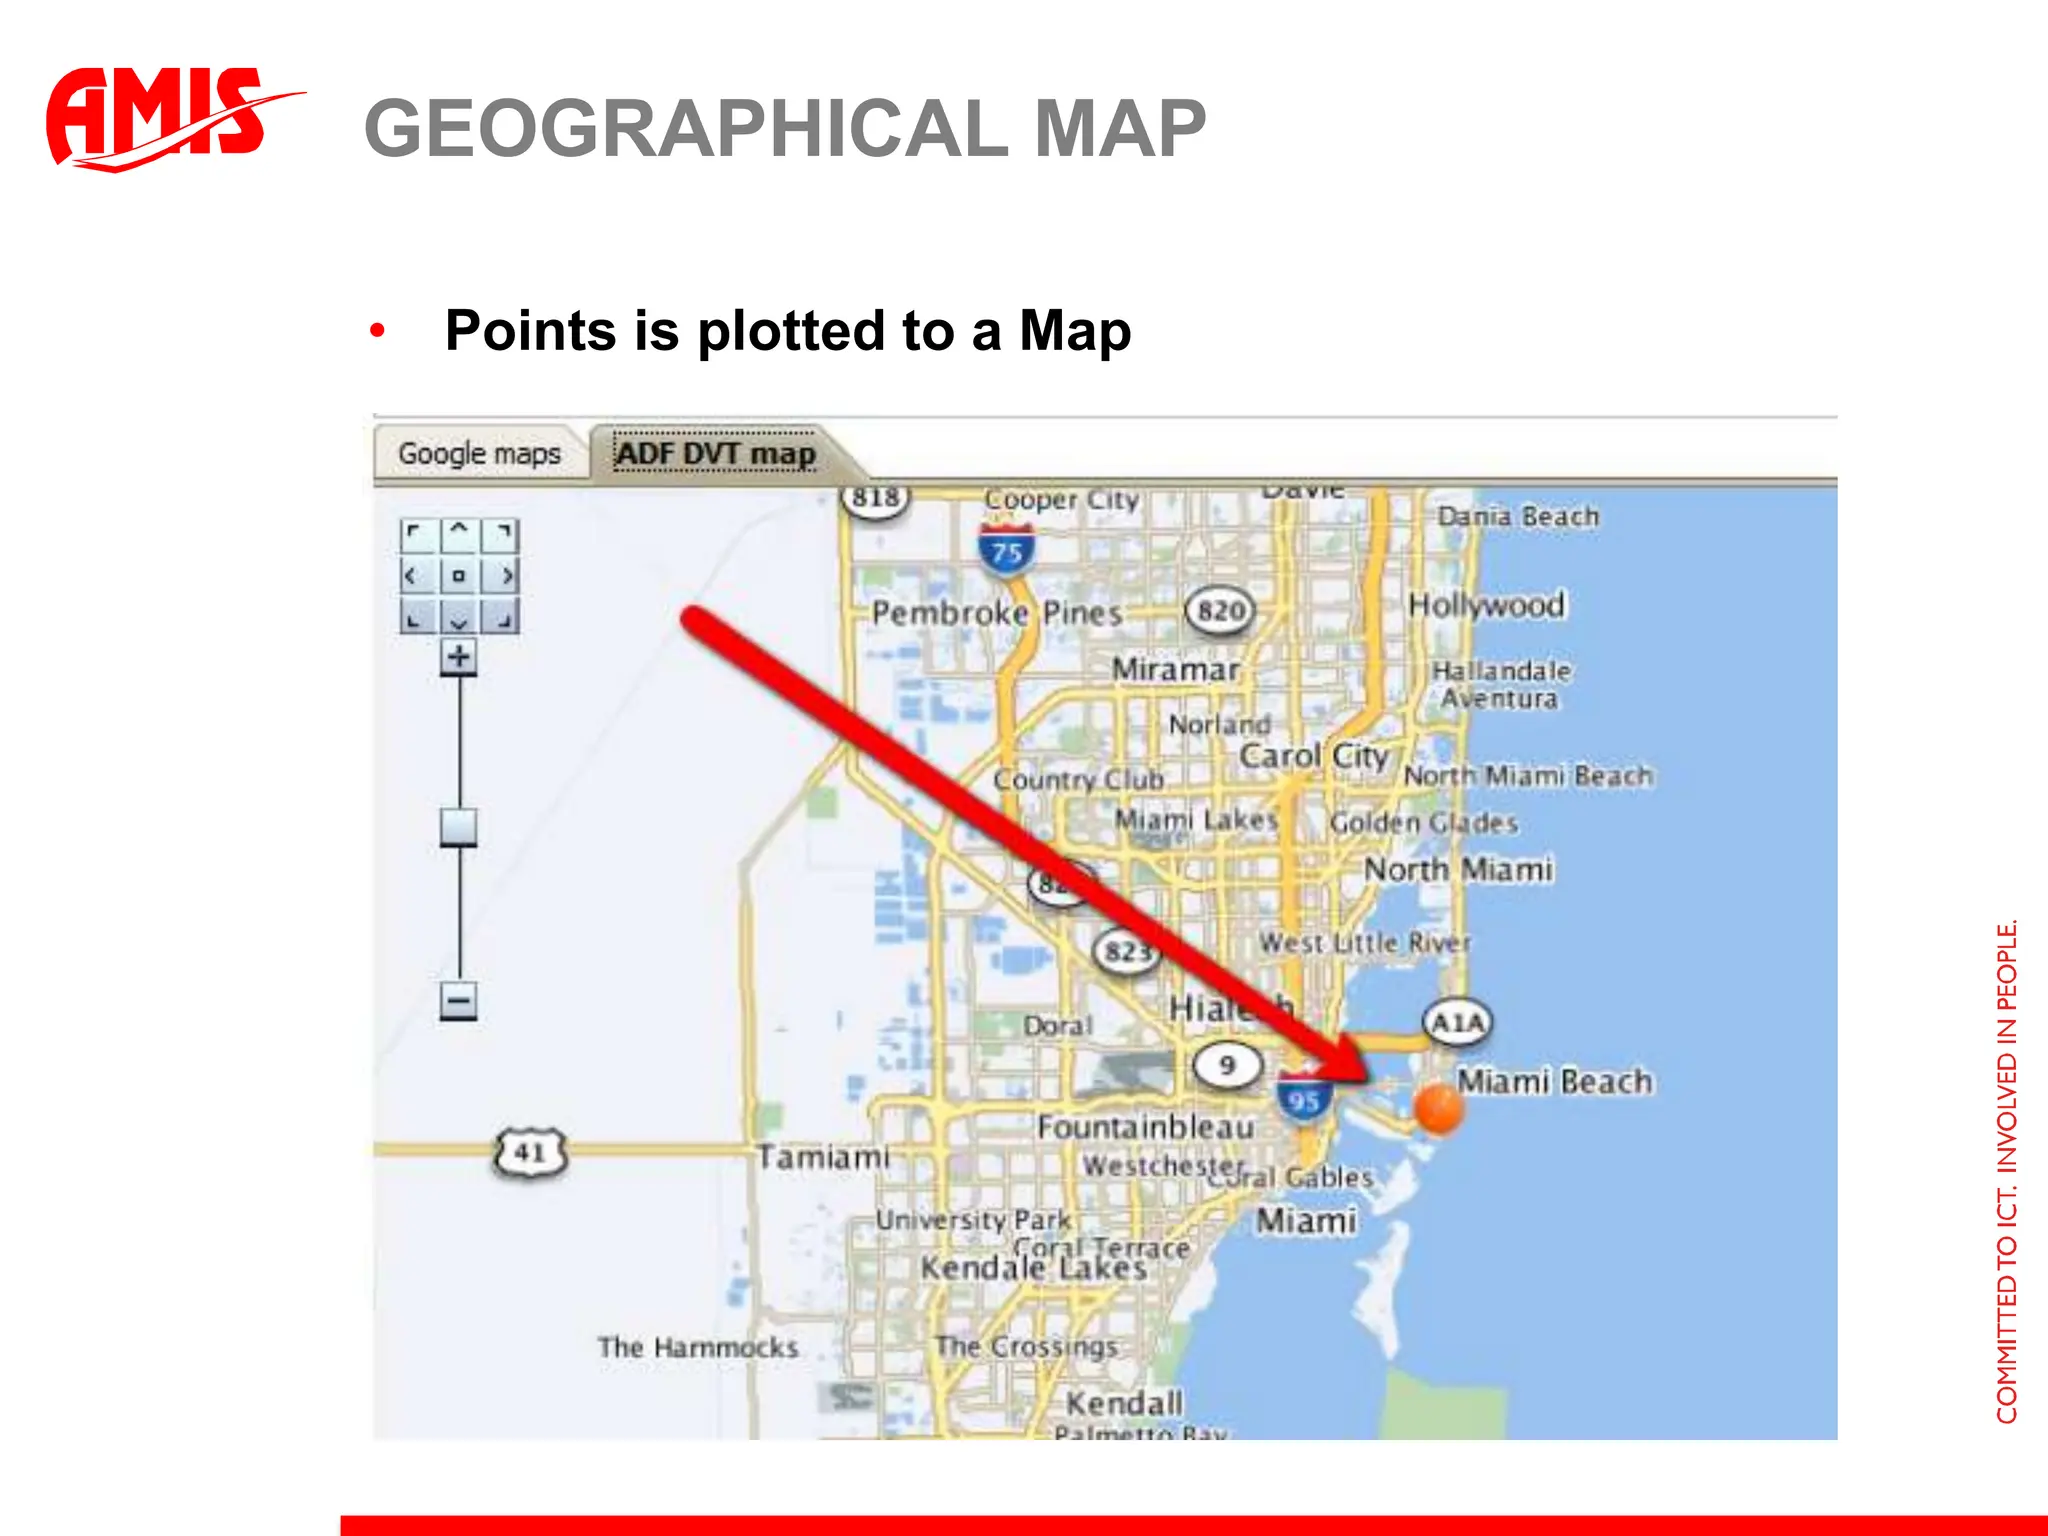
Do you rememberthis one ?Where do these customers live ? Lets use a map to plot them
33.
Geographical MapCreate aviewObject to provide the data. SELECT………….. adr.ADDRESS1, adr.CITY, ………….adr.POSTAL_CODE, adr.COUNTRY_ID, ord.ORDER_TOTAL ,………FROM ORDERS ord, PERSONS per, ADDRESSES adrWHERE
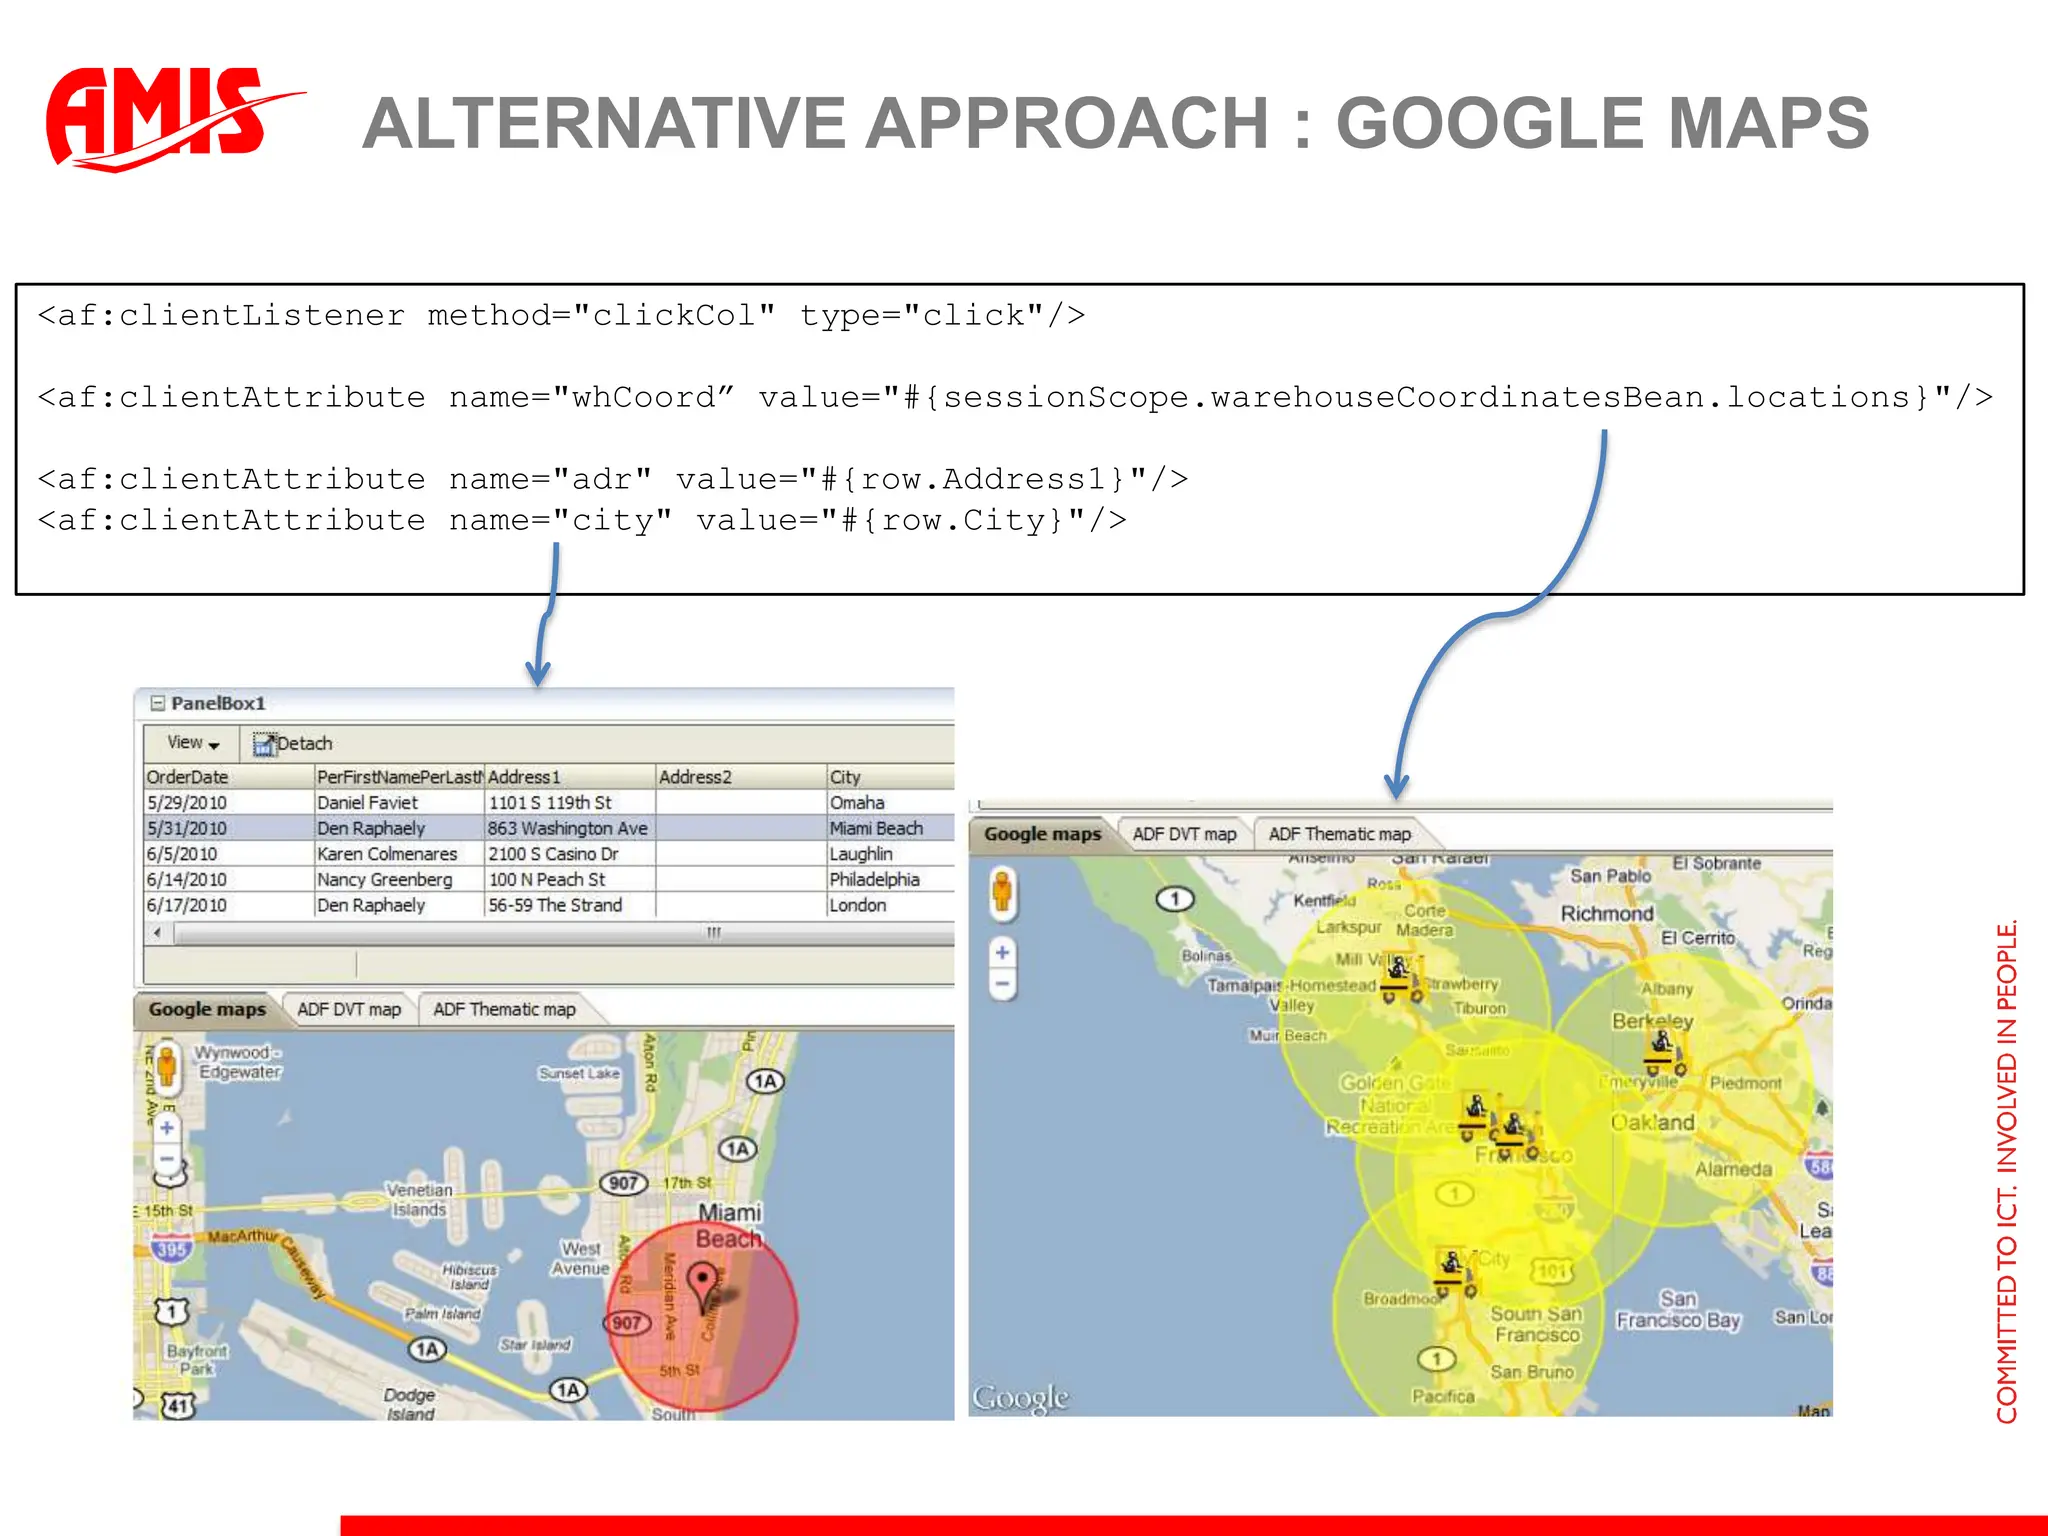
Geographical MapAdding CirclesUse MapviewerJavascript API combined with ADF Javescript APIThis is not documented. PM asked me to file ER for this !Alternative Approach : Google MapsConsider using Google Maps to have a more Rich API for Map integration and interaction.Google Maps API has good documentationUse ADF Javascript API to interact with Google MapsAlternative Approach : Google Maps<af:clientListener method="clickCol" type="click"/><af:clientAttribute name="whCoord” value="#{sessionScope.warehouseCoordinatesBean.locations}"/><af:clientAttribute name="adr" value="#{row.Address1}"/><af:clientAttribute name="city" value="#{row.City}"/>
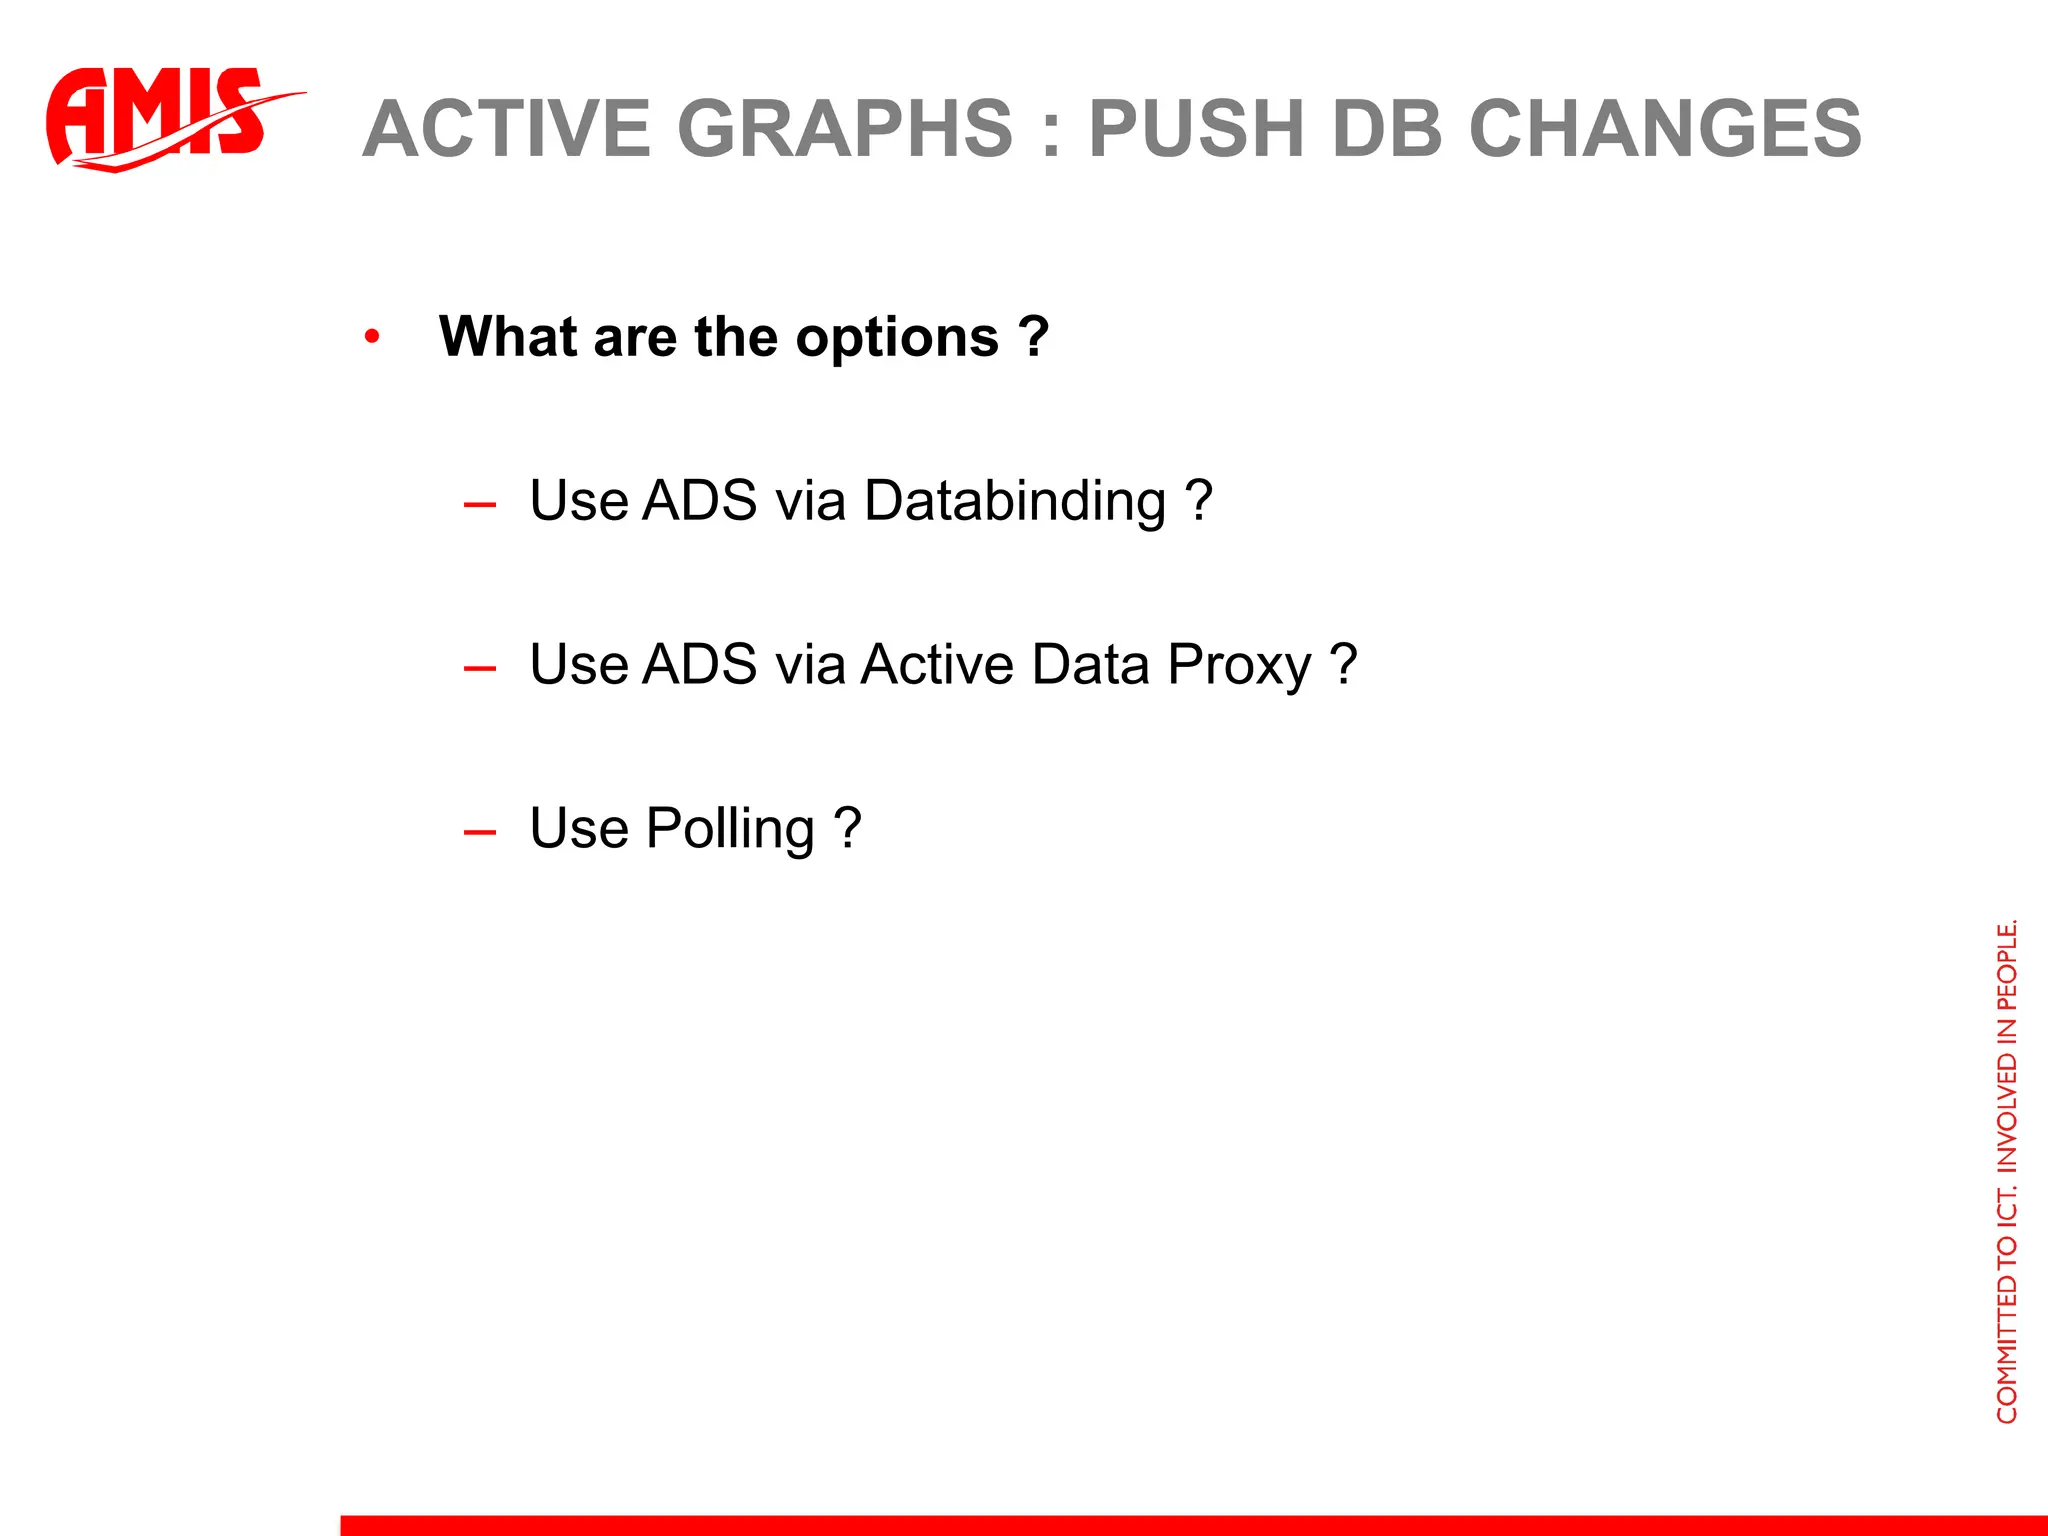
Feeding the graphsStockLevel changed by:Services ?Batch Process ?…. ?How to inform application ?
40.
Active Graphs :Push DB ChangesWhat are the options ?Use ADS via Databinding ?Use ADS via Active Data Proxy ?Use Polling ?
41.
Active Graphs :Push DB ChangesUse Database ChangeNotificationgrant change notification to <user>;Set AutoRefresh ‘true’ for ViewObjectUse Shared ApplicationModuleUse Poll component
Contextual EventsADF CodeCorner Example 17To Refresh a Region Based on A Graph Click Event in an other Regionpublic void handleEvent(Object payload){ //cast the payload to the ClickEvent. ClickEventclickEvent = (ClickEvent) payload; DataComponentHandledch = (DataComponentHandle)clickEvent.getComponentHandle(); //get the selected row key from the graph (click event) Key rwKey = (Key) dch.getValue(DataComponentHandle.ROW_KEY);
45.
SummaryGraphs not onlydisplay dataInteract with Graphs and MapsUse Graphs and Maps clever and whenever neededGet the best out of your Graphs and Maps
46.
Final NotesA PicturePaints a Thousand Words……..And even then there is more to tellContextual Events in GraphsSaving Graphs as ImageUse Graphs in Reports
47.
A Picture Paintsa 1000 WordsODTUG Kaleidoscope 2011 – Long Beach, CaliforniaPlease Fill Out Your EvaluationsLuc Bors, AMIS, The NetherlandsLuc.Bors@amis.nlLucBors@gmail.comFollow me on Twitter : @lucb_
#3 This session is all about clarifying data by means of ADF Data Visualization Components. You will learn how to present your data in a different way and you will learn to recognize when and how to use DVT components for data analysis. From pretty straightforward usage of gauges, graphs and maps, to more sophisticated features like time selectors, drill down functionality, data manipulation in DVT and real time update via server push. And finally this will all come together in a fancy interactive dashboard.After a short introduction explaining DVT and their place in the ADF overall architecture, the rest of the session will be all about DVT added value. You will see situations where ADF Data Visualization Components come to the rescue and how DVT add value to your application and business.
#4 Because of the overall ADF Architecture it is possible to base graphs on any dataset that can be made available via an ADF data control (ADFm JSR227). Binding to a standard rowset and binding to hierarchical data controls is supported. This means that graphs can be based on data from a database exposed via ADF Business Components, but also data from a BAM server or BI server. One can also use web services to provide graphs with data.It is easy to create a graph by dragging and dropping a collection from the data control palette, the same way that you create a databound form or table on a page. Data for a graph can also be provided via a managed bean. DVT components support both skinning and partial page refresh. DVT’s can be PPR targets, but they are also able to initiate a PPR event. It is also possible to dynamically change almost any property of a DVT component by means of EL.
#5 Data Visualization Components consist of over 50 different kinds of graphs. All graphs support animation (initial display and data change), zooming and scrolling, and some of them support a time selector window.
#6 This session is all about clarifying data by means of ADF Data Visualization Components. You will learn how to present your data in a different way and you will learn to recognize when and how to use DVT components for data analysis. From pretty straightforward usage of gauges, graphs and maps, to more sophisticated features like time selectors, drill down functionality, data manipulation in DVT and real time update via server push. And finally this will all come together in a fancy interactive dashboard.After a short introduction explaining DVT and their place in the ADF overall architecture, the rest of the session will be all about DVT added value. You will see situations where ADF Data Visualization Components come to the rescue and how DVT add value to your application and business.
#7 In the warehouse stock displayed on this sheet there are some products that are somewhat low on stock. Only if you know what the critical stocklevels of all product are, you will be able to determine exactly those products. An amount of 345 is indeed less then 600 or 1100, but you cannot tell is a stock of 345 is more critical then a stock of 600. We need a solution for that to start with. We want to see instantly where the pain is.
#10 Usually on cannot tell what is the currently selected bar in a bargraph, so you are not able to tell to what bar any displayed detail data belongs.The barGraph variable is an instance of the graph created through the graph component Binding property. It grants access to the ADF binding layer. The clickEvent provides the information about the bar (the series) the user clicked on.The bar's row representation is then set as current in the ADF binding layer.
#11 Usually on cannot tell what is the currently selected bar in a bargraph, so you are not able to tell to what bar any displayed detail data belongs.The barGraph variable is an instance of the graph created through the graph component Binding property. It grants access to the ADF binding layer. The clickEvent provides the information about the bar (the series) the user clicked on.The bar's row representation is then set as current in the ADF binding layer.
#12 To ensure master-detail correlation to happen when users click on a bar, check the Set current row for master-detail checkbox (1), which ensures the current row to be set in the ADF binding layer iterator. Press the Swap Bars with X-Axis button (2) to turn the product name entries into their own series, which is key for the color highlighting. The major change is between setting and not setting this option is that the product names are displayed in the graph's legend than beneath its bar. The barGraph variable is an instance of the graph created through the graph component Binding property. It grants access to the ADF binding layer. The clickEvent provides the information about the bar (the series) the user clicked on.The bar's row representation is then set as current in the ADF binding layer.
#13 The barGraph variable is an instance of the graph created through the graph component Binding property. It grants access to the ADF binding layer. The clickEvent provides the information about the bar (the series) the user clicked on.The bar's row representation is then set as current in the ADF binding layer.
#20 In this pie graph we can see the amount available in all warehouses.We can add extra info to the pie by means of :a) b)c)d) <dvt:pieGraph id="pieGraph1" value="#{bindings.OrderTotalsPie1.graphModel}"subType="PIE" threeDEffect="true"animationOnDisplay="flipLeft" animationDuration="2000"clickListener="#{pieClickListenerBean.processClick}"imageFormat="FLASH" seriesRolloverBehavior="RB_HIGHLIGHT"seriesEffect="SE_GRADIENT" dynamicResize="DYNAMIC_SIZE"interactiveSliceBehavior="explode" visualEffects="AUTO"> <dvt:background> <dvt:specialEffectsgradientDirection="GD_RADIAL"fillType="FT_GRADIENT" gradientNumStops="4"/> </dvt:background> <dvt:graphPieFrame/> <dvt:seriesSet> <dvt:series/> </dvt:seriesSet> <dvt:legendAreaautomaticPlacement="AP_NEVER" position="LAP_TOP"/> <dvt:sliceLabelautoPrecision="off" scaling="auto"textType="LD_PERCENT"/> <dvt:pieLabel rendered="false"/> </dvt:pieGraph>
#21 In this pie graph we can see the amount available in all warehouses.We can add extra info to the pie by means of :a) b)c)d)
#24 The timeselector listener enables you to respond to changes in the date range.Not only can you requery a collection based on the new date range, but you can also execute ant y kind of logic that you need.
#26 Use a click listener on <dvt:shapeAttributes /><dvt:barGraph > <dvt:shapeAttributesSet> <dvt:shapeAttributes component="GRAPH_TWODMARKER" clickable="true" clickListener="#{clickListener.processClick}"/> </dvt:shapeAttributesSet> </dvt:barGraph>
#28 public void click(ClickEvent event) {ComponentHandle handle = event.getComponentHandle();if (handle instanceofDataComponentHandle){DataComponentHandledhandle = (DataComponentHandle)handle;Long clickedValue =(Long)dhandle.getValue(DataComponentHandle.UNFORMATTED_VALUE);Use the clickedValue}}
#29 Give end users the ability to zoom in on and scroll through a data set that may be too large or complex to fit comfortably within the area allocated to the graph using the "zoomDirection" attribute. Zoom and scroll may be enabled for horizontal and or vertical axes. The "scrollbarPresenceGroups" attribute provides control over when a scroll bar appears for the group axis: the horizontal axis in Bar graphs, for instance. The "scrollbarPresenceX1", "scrollbarPresenceY1", and "scrollbarPresenceY2" attributes control the appearance of scroll bars for the various data axes.
#30 Give end users the ability to zoom in on and scroll through a data set that may be too large or complex to fit comfortably within the area allocated to the graph using the "zoomDirection" attribute. Zoom and scroll may be enabled for horizontal and or vertical axes. The "scrollbarPresenceGroups" attribute provides control over when a scroll bar appears for the group axis: the horizontal axis in Bar graphs, for instance. The "scrollbarPresenceX1", "scrollbarPresenceY1", and "scrollbarPresenceY2" attributes control the appearance of scroll bars for the various data axes.
#37 for (var level in markers) { for (vari = 0; i < markers[level].length; i++) { var details = markers[level][i]; markers[level][i] = new google.maps.Marker({ title: details.level, position: new google.maps.LatLng( details.location[0], details.location[1]), clickable: false, draggable: true, flat: true }); }
#46 public void handleEvent(Object payload){ //cast the payload to the ClickEvent. Note that the ctx event //handler could have used a typed argument instead of "Object", //in which case a) an error would be raised if the value in the //payload is of a wrong type and b) a casting in the method is //not required. //There are good arguments for the use of both approaches. The one //using an Object argument for example allows you to gracefully //handle possible type cast exceptions instead of handling it //using the configured ADF or ADFc exception handlers. ClickEventclickEvent = (ClickEvent) payload; //determine the area that the user clicked on if (clickEvent.getComponentHandle() instanceofDataComponentHandle){ DataComponentHandledch = (DataComponentHandle) clickEvent.getComponentHandle(); //get the selected row key from the graph (click event) Key rwKey = (Key) dch.getValue(DataComponentHandle.ROW_KEY);