SlideShare a Scribd company logo
1 of 8
Download to read offline
The Long & Foster ® Market Conditions Report
Hampton Roads Area - September 2013
Median Sales Price
$250,000

$230,000

$207,250

$169,825

$161,950

$160,000

$200,000

$100,000

$171,750

Current Month

$227,038

$250,000

$225,000

$300,000

$220,000

$350,000

$235,000

One Year Ago

$202,000

$215,000

$225,000

$225,000

$209,900

$199,900

$199,900

$192,765

$192,000

$200,000

$205,000

$200,000

$205,250

$211,000

$210,000

$211,000

$197,750

$194,900

$185,000

$171,600

$197,500

$191,700

$150,000

$188,000

$197,495

$200,000

$205,000

Median Sale Price
Of Top Five Counties/Cities Based on Total Units Sold

$150,000

$100,000
$50,000

$50,000

$0
Virginia Chesapeake Norfolk City Newport Suffolk City
Beach City
City
News City

$0

Median Sale Price
Percent Change Year/Year

2%

2%

1%

4%
1%

3%

7%

7%

6%

4%

1%

6%

5%

5%

5%

-15%

-5%
-8%

-11%

-10%

-6%

-5%

-2%

-1%

0%

-8%

● The current median sale price was 6%
lower than in August.

10%

-9%

● This September, the median sale price
was $202,000, a decrease of 2%
compared to last year.

8%

15%

7%

12%

Highlights

-20%
-25%

46
The Long & Foster ® Market Conditions Report
Hampton Roads Area - September 2013
Total Units Sold
2,500

100

500

122

89

200

140

177

300

126

267

400

263

499

446

1,651

500

Current Month

192

2,071

2,059

2,059
1,794

1,623

One Year Ago

600

1,358

1,255

1,449

1,493

1,486

1,474

1,915

1,833

1,751

1,556
1,284

1,093

1,467

1,282

1,000

1,379

1,473

1,500

1,600

1,965

2,000

2,113

Total Units Sold
Of Top Five Counties/Cities Based on Total Units
Sold

0
Virginia Chesapeake Norfolk City Newport Suffolk City
Beach City
City
News City

0

Total Units Sold
Percent Change Year/Year

12%
8%

5%

-1%

0%

4%

6%

8%

7%
0%

3%
0%

15%

18%
12%

15%

16%

16%

19%
15%
10%

10%

-1%

● There was a decrease of 20% in total
units sold in September compared to
August.

10%

20%

17%

● This month's total units sold was
higher than at this time last year, an
increase of 12% versus September 2012.

20%

30%

20%

Highlights

-10%

47
The Long & Foster ® Market Conditions Report
Hampton Roads Area - September 2013
Total Units Sold by Type
Detached

Total Units Sold by Type
Current Month

Attached

2,500

Detached

Attached

2,000

1,500

388
24%

1,000

500

1,263
76%

0

Total Units Sold by Price Range
< 150K

1,200

150K to < 300K

300K to < 450K

450K to < 600K

600K and up

Total Units Sold by Price Range
Current Month
< 150K
450K to < 600K

150K to < 300K
600K and up

300K to < 450K

1,000
800
600

247
15%

43
64
2%
4%
506
31%

400
200
0

791
48%

48
The Long & Foster ® Market Conditions Report
Hampton Roads Area - September 2013
Total Active Inventory

823

790

961

1,000

912

1,500

6,000

1,456

2,000

1,431

1,587

2,500

1,424

3,000

8,000

Current Month

2,527

2,500

One Year Ago

10,986

11,254

11,288

11,125

11,138

10,944

10,656

10,474

10,177

9,872

10,686

11,035

11,217

11,366

11,547

11,704

11,806

11,820

11,696

11,509

11,413

12,205

Of Top Five Counties/Cities Based on Total Units Sold

11,307

10,000

Total Active Inventory
12,532

12,000

13,003

14,000

500

4,000

0
Virginia Chesapeake Norfolk City Newport Suffolk City
Beach City
City
News City

2,000

0

Total Active Inventory

Highlights

-6%

-7%

-9%

-11%

-12%

-13%

-12%

-1%

-2%

-5%

-2%
-16%

-18%

-17%

-18%

-18%

-18%

-19%

-18%

-18%

-20%

-17%

-15%

-14%

-10%

-9%

-5%

-16%

● Active inventory this September was
2% lower than the previous month's
supply of available inventory.

0%

-17%

● Versus last September, the total
number of homes available this month
was lower by 231 units or 2%.

Percent Change Year/Year

-25%

49
The Long & Foster ® Market Conditions Report
Hampton Roads Area - September 2013
Total Active Inventory by Type
Detached

Total Active Inventory
by Type

Attached

Current Month

14,000

Detached

Attached

12,000
10,000

2,324
21%

8,000

6,000
4,000

8,662
79%

2,000

0

Total Active Inventory by Price Range
< 150K

14,000

150K to < 300K

300K to < 450K

450K to < 600K

Total Active Inventory by
Price Range
Current Month

600K and up

< 150K
450K to < 600K

150K to < 300K
600K and up

300K to < 450K

12,000
10,000
8,000
6,000

805
728 7%
7%

2,915
27%

1,874
17%

4,000
2,000

4,664
42%

0

50
The Long & Foster ® Market Conditions Report
Hampton Roads Area - September 2013
Sale Price as % of List Price

Average Sale Price as a Percent of List Price

Of Top Five Counties/Cities Based on Total Units
Sold

Days on Market
Current One Year
Month
Ago

95.0%

81

95

97.5%

105
105
100
95
90
85
80

104

106

107

98.4%

98.3%

97.3%

Up 0.6% Vs. Year Ago

by Price Range

108

100%
104

< 150K

150K to < 300K

300K to < 450K

450K to < 600K

600K and up

98%
101

98

96.9%

Average Sale Price as a Percent of List Price

Days on Market

110

96.7%

Avg Sale Price as % of List Price
Current
One Year
Month
Ago

Down -15% Vs. Year
Ago

110

96.8%

95.6%

Virginia Chesapeake Norfolk City Newport Suffolk City
Beach City
City
News City

95.5%

115

Current Month

98.6%

98.0%

97.4%

97.5%

97.6%

97.4%

100.0%
99.0%
98.0%
97.0%
96.0%
95.0%
94.0%
93.0%

96.5%

96.7%

96.7%

96.7%

97.1%

97.1%
96.8%

96.7%

96.9%

97.3%
96.9%

96.7%

96.6%

One Year Ago

96.3%

96.1%

96.2%

96.5%

96.2%

96.5%

96.3%

96.8%

97.0%

96.0%

97.5%

97.5%

97.4%

97.9%

98.0%

96

95
91

89

91

96 96

97
94

96%
94%

96

94

92%

90

90%

82

83 83

88%
81

86%
84%

51
The Long & Foster ® Market Conditions Report
Hampton Roads Area - September 2013
Total Dollar Volume Sold
In Thousands

Highlights

$100,000

$380,043

$507,758

$534,111

$489,189

$403,218

$379,016

$300,382

$269,970

$324,608

$346,175

$331,381

$340,493

$448,229

$464,160

$423,371

$357,581

$341,028

$271,427

$214,720

$331,083

$284,571

$200,000

$297,534

$300,000

$326,010

$400,000

$414,678

$500,000

$518,295

$600,000

● Total volume sold this September was
12% greater than the same month one
year ago.
● In September, there was 6.7 months of
supply available, compared to 7.6 in
September 2012. That was a decrease
of 13% versus a year ago.

$0

Months of Supply
Current Month's Active Inventory/Current Month's Unit Sales

Total Dollar Volume Sold
Current
One Year
Month
Ago

12

10.4

4

$340,492,514

Up 12% Vs. Year Ago
6.7
5.4

5.3

5.4

5.4

6.1

6.6

7.7

8.1
6.8

7.2

7.4

7.6
5.9

6.3

6.0

6.7

7.4

7.5

7.7
6

$380,043,330
9.0

9.5

9.1

8

8.8

10

Months of Supply
Current
One Year
Month
Ago
6.7

7.6

2

Down -13% Vs. Year Ago
0

52
The Long & Foster ® Market Conditions Report
Hampton Roads Area - September 2013
New Listings

New Listings & New Contracts

163

134

219

194

357

370

348

698

605

Virginia Chesapeake Norfolk City Newport Suffolk City
Beach City
City
News City

112

90

100
0

141

200

139

230

300

500

Current Month

145

248

One Year Ago

240

400

458

500

390

1,885

Of Top Five Counties/Cities Based on Total Units Sold
1,629

1,784

1,927

New Contracts

2,192

2,055

1,902

1,573

Current Month

343

3,013

1,000
800
600
400
200
0

2,521

3,153

2,825

3,294

3,215

2,938

2,680

2,865
1,586
1,470

1,223

1,375

1,557

1,367

1,806

1,706

One Year Ago

2,043

2,433

2,304

2,686

2,542

2,882
1,839

1,786

1,809

1,484

1,396

1,211

1,363

1,320

1,426

1,500

1,806

2,000

1,000

2,787

2,577

2,689

1,696

2,315

2,500

New Contracts (Under Active Contract Status)

2,185

3,000

2,466

3,500

2,934

3,099

New Listings

Of Top Five Counties/Cities Based on Total Units Sold

0

Virginia Chesapeake Norfolk City Newport Suffolk City
Beach City
City
News City

New Listings
Current One Year
Month
Ago
2,521

2,304

Up 9% Vs. Year Ago

New Contracts
Current One Year
Month
Ago
1,629

1,367

Up 19% Vs. Year Ago

Supply/Demand Ratio

Highlights
● Based on this month's amount of new
listings and new contracts, the ratio of
home supply (new listings) to current
home demand (new contracts) was 1.5,
a decrease of 8% from September 2012.

Number of New Listings to New Contracts
2.5

1.7 1.7

1.7 1.7
1.7
1.5

1.9

1.9

2.0

1.4

1.6 1.6 1.6

1.7
1.5 1.5

1.6

1.7
1.5

1.6 1.6
1.5
1.5 1.6 1.5 1.6

1.3

1.0

0.5

0.0

53

More Related Content

What's hot

Q2 2013 nest market report
Q2 2013 nest market reportQ2 2013 nest market report
Q2 2013 nest market report
Jeremy Hart
 
Hexter Fair Economic Forecast 021909 Allen
Hexter Fair Economic Forecast 021909 AllenHexter Fair Economic Forecast 021909 Allen
Hexter Fair Economic Forecast 021909 Allen
SheriStinson
 
Q3 2013 nest report
Q3 2013 nest reportQ3 2013 nest report
Q3 2013 nest report
Jeremy Hart
 
5 9 11 Lawrenceville Market Update
5 9 11 Lawrenceville Market Update5 9 11 Lawrenceville Market Update
5 9 11 Lawrenceville Market Update
John Cranstoun
 

What's hot (19)

Excel Dashboard for Analysis and Prediction
Excel Dashboard for Analysis and PredictionExcel Dashboard for Analysis and Prediction
Excel Dashboard for Analysis and Prediction
 
2017 Q1 Mission Bay
2017 Q1 Mission Bay2017 Q1 Mission Bay
2017 Q1 Mission Bay
 
Q2 2013 nest market report
Q2 2013 nest market reportQ2 2013 nest market report
Q2 2013 nest market report
 
July 2015 Home Sales Report
July 2015 Home Sales ReportJuly 2015 Home Sales Report
July 2015 Home Sales Report
 
Gbar monthly-market-insights-report-november20
Gbar monthly-market-insights-report-november20Gbar monthly-market-insights-report-november20
Gbar monthly-market-insights-report-november20
 
You need to be in Sevierville
You need to be in SeviervilleYou need to be in Sevierville
You need to be in Sevierville
 
Hexter Fair Economic Forecast 021909 Allen
Hexter Fair Economic Forecast 021909 AllenHexter Fair Economic Forecast 021909 Allen
Hexter Fair Economic Forecast 021909 Allen
 
Foreclosure and Short Sale- September 2010
Foreclosure and Short Sale- September 2010Foreclosure and Short Sale- September 2010
Foreclosure and Short Sale- September 2010
 
Monthly market-insight-report-oct20
Monthly market-insight-report-oct20Monthly market-insight-report-oct20
Monthly market-insight-report-oct20
 
Annie Williams 2016 Annual Real Estate Report
Annie Williams 2016 Annual Real Estate ReportAnnie Williams 2016 Annual Real Estate Report
Annie Williams 2016 Annual Real Estate Report
 
November 2015 Home Sales Report
November 2015 Home Sales ReportNovember 2015 Home Sales Report
November 2015 Home Sales Report
 
California Housing Market Update - Feb 2022 CAR
 California Housing Market Update - Feb 2022 CAR California Housing Market Update - Feb 2022 CAR
California Housing Market Update - Feb 2022 CAR
 
Meadows Market Sale Brochure V3
Meadows Market Sale Brochure V3Meadows Market Sale Brochure V3
Meadows Market Sale Brochure V3
 
Q3 2013 nest report
Q3 2013 nest reportQ3 2013 nest report
Q3 2013 nest report
 
Sacramento SDAT Project
Sacramento SDAT ProjectSacramento SDAT Project
Sacramento SDAT Project
 
July 2016 Home Sales Report
July 2016 Home Sales ReportJuly 2016 Home Sales Report
July 2016 Home Sales Report
 
November 2015 the woodlands market report
November 2015 the woodlands market reportNovember 2015 the woodlands market report
November 2015 the woodlands market report
 
August 2015 Redondo Beach Real Estate Market Trends Update
August 2015 Redondo Beach Real Estate Market Trends UpdateAugust 2015 Redondo Beach Real Estate Market Trends Update
August 2015 Redondo Beach Real Estate Market Trends Update
 
5 9 11 Lawrenceville Market Update
5 9 11 Lawrenceville Market Update5 9 11 Lawrenceville Market Update
5 9 11 Lawrenceville Market Update
 

Similar to Virginia Beach/Norfolk/Newport News Market Conditions Report

Similar to Virginia Beach/Norfolk/Newport News Market Conditions Report (20)

Philadelphia Metropolitan Market Conditions Report
Philadelphia Metropolitan Market Conditions ReportPhiladelphia Metropolitan Market Conditions Report
Philadelphia Metropolitan Market Conditions Report
 
Toronto Market Watch AUGUST 2016
Toronto Market Watch AUGUST 2016Toronto Market Watch AUGUST 2016
Toronto Market Watch AUGUST 2016
 
TREB Market Watch - August 2016
TREB Market Watch - August 2016TREB Market Watch - August 2016
TREB Market Watch - August 2016
 
TREB MARKET WATCH 2017
TREB MARKET WATCH 2017TREB MARKET WATCH 2017
TREB MARKET WATCH 2017
 
Market Report for August 2017 - Residential Resale
Market Report for August 2017 - Residential ResaleMarket Report for August 2017 - Residential Resale
Market Report for August 2017 - Residential Resale
 
October Market Watch is Here !
October Market Watch is Here !October Market Watch is Here !
October Market Watch is Here !
 
September 2021 Market Watch Report
September 2021 Market Watch ReportSeptember 2021 Market Watch Report
September 2021 Market Watch Report
 
August 2021 market watch
August 2021 market watchAugust 2021 market watch
August 2021 market watch
 
November 2021 Market Watch
November 2021 Market WatchNovember 2021 Market Watch
November 2021 Market Watch
 
Market Watch TORONTO 2015 SEPTEMBER
Market Watch TORONTO 2015 SEPTEMBERMarket Watch TORONTO 2015 SEPTEMBER
Market Watch TORONTO 2015 SEPTEMBER
 
Q1 2013 market report
Q1 2013 market reportQ1 2013 market report
Q1 2013 market report
 
TREB January 2017 Market Watch
TREB January 2017 Market WatchTREB January 2017 Market Watch
TREB January 2017 Market Watch
 
Toronto Real Estate Board's MARKET WATCH - JANUARY 2017
Toronto Real Estate Board's MARKET WATCH - JANUARY 2017Toronto Real Estate Board's MARKET WATCH - JANUARY 2017
Toronto Real Estate Board's MARKET WATCH - JANUARY 2017
 
Toronto Real Estate Board's MARKET WATCH - JANUARY 2017
Toronto Real Estate Board's MARKET WATCH - JANUARY 2017Toronto Real Estate Board's MARKET WATCH - JANUARY 2017
Toronto Real Estate Board's MARKET WATCH - JANUARY 2017
 
April 2016 Home Sales in Toronto and GTA
April 2016 Home Sales in Toronto and GTAApril 2016 Home Sales in Toronto and GTA
April 2016 Home Sales in Toronto and GTA
 
February 2017 Market Watch - JUST RELEASED
February 2017 Market Watch - JUST RELEASEDFebruary 2017 Market Watch - JUST RELEASED
February 2017 Market Watch - JUST RELEASED
 
April 2021 - TRREB Market Report
April 2021 - TRREB Market Report April 2021 - TRREB Market Report
April 2021 - TRREB Market Report
 
September 2020 - Market Report - Toronto & GTA Housing Sales
September 2020 - Market Report - Toronto & GTA Housing SalesSeptember 2020 - Market Report - Toronto & GTA Housing Sales
September 2020 - Market Report - Toronto & GTA Housing Sales
 
July 2021 - Market Report
July 2021 - Market Report July 2021 - Market Report
July 2021 - Market Report
 
May Market Watch 2021
May Market Watch 2021May Market Watch 2021
May Market Watch 2021
 

Recently uploaded

Call girls in Shakti Nagar Delhi~8447779280°/=@/ Short 1500 Night 6000}ESCORT...
Call girls in Shakti Nagar Delhi~8447779280°/=@/ Short 1500 Night 6000}ESCORT...Call girls in Shakti Nagar Delhi~8447779280°/=@/ Short 1500 Night 6000}ESCORT...
Call girls in Shakti Nagar Delhi~8447779280°/=@/ Short 1500 Night 6000}ESCORT...
asmaqueen5
 
Call girls In Rana Pratap Bagh {Delhi ↫8447779280↬Escort Service (Delhi)
Call girls In Rana Pratap Bagh {Delhi ↫8447779280↬Escort Service (Delhi)Call girls In Rana Pratap Bagh {Delhi ↫8447779280↬Escort Service (Delhi)
Call girls In Rana Pratap Bagh {Delhi ↫8447779280↬Escort Service (Delhi)
asmaqueen5
 
Bptp The Amaario Launch Luxury Project Sector 37D Gurgaon Dwarka Expressway...
Bptp The Amaario Launch  Luxury Project  Sector 37D Gurgaon Dwarka Expressway...Bptp The Amaario Launch  Luxury Project  Sector 37D Gurgaon Dwarka Expressway...
Bptp The Amaario Launch Luxury Project Sector 37D Gurgaon Dwarka Expressway...
ApartmentWala1
 
Cheap Rate ✨➥9582086666▻✨Call Girls In Gurgaon Sector 1 (Gurgaon)
Cheap Rate ✨➥9582086666▻✨Call Girls In Gurgaon Sector 1 (Gurgaon)Cheap Rate ✨➥9582086666▻✨Call Girls In Gurgaon Sector 1 (Gurgaon)
Cheap Rate ✨➥9582086666▻✨Call Girls In Gurgaon Sector 1 (Gurgaon)
delhi24hrs1
 
Acibadem Konaklari Uskudar - Listin Turkey
Acibadem Konaklari Uskudar - Listin TurkeyAcibadem Konaklari Uskudar - Listin Turkey
Acibadem Konaklari Uskudar - Listin Turkey
Listing Turkey
 
Listing Turkey - 2024 - May Featured Portfolio
Listing Turkey - 2024 - May Featured PortfolioListing Turkey - 2024 - May Featured Portfolio
Listing Turkey - 2024 - May Featured Portfolio
Listing Turkey
 
~Call Girls In Roop Nagar {8447779280}(Low Price) Escort Service In Delhi
~Call Girls In Roop Nagar {8447779280}(Low Price) Escort Service In Delhi~Call Girls In Roop Nagar {8447779280}(Low Price) Escort Service In Delhi
~Call Girls In Roop Nagar {8447779280}(Low Price) Escort Service In Delhi
asmaqueen5
 
Escort—>Call GiRls In Mori Gate Delhi —>8447779280—Service Escorts In South D...
Escort—>Call GiRls In Mori Gate Delhi —>8447779280—Service Escorts In South D...Escort—>Call GiRls In Mori Gate Delhi —>8447779280—Service Escorts In South D...
Escort—>Call GiRls In Mori Gate Delhi —>8447779280—Service Escorts In South D...
asmaqueen5
 
Cheap Rate ✨➥9711108085▻✨Call Girls In Connaught Place (Delhi)
Cheap Rate ✨➥9711108085▻✨Call Girls In Connaught Place (Delhi)Cheap Rate ✨➥9711108085▻✨Call Girls In Connaught Place (Delhi)
Cheap Rate ✨➥9711108085▻✨Call Girls In Connaught Place (Delhi)
delhi24hrs1
 
Low rate ↬Call girls in Sabzi Mandi Delhi | 8447779280}Escort Service In All ...
Low rate ↬Call girls in Sabzi Mandi Delhi | 8447779280}Escort Service In All ...Low rate ↬Call girls in Sabzi Mandi Delhi | 8447779280}Escort Service In All ...
Low rate ↬Call girls in Sabzi Mandi Delhi | 8447779280}Escort Service In All ...
asmaqueen5
 

Recently uploaded (20)

Call girls in Shakti Nagar Delhi~8447779280°/=@/ Short 1500 Night 6000}ESCORT...
Call girls in Shakti Nagar Delhi~8447779280°/=@/ Short 1500 Night 6000}ESCORT...Call girls in Shakti Nagar Delhi~8447779280°/=@/ Short 1500 Night 6000}ESCORT...
Call girls in Shakti Nagar Delhi~8447779280°/=@/ Short 1500 Night 6000}ESCORT...
 
Explore Dual Citizenship in Africa | Citizenship Benefits & Requirements
Explore Dual Citizenship in Africa | Citizenship Benefits & RequirementsExplore Dual Citizenship in Africa | Citizenship Benefits & Requirements
Explore Dual Citizenship in Africa | Citizenship Benefits & Requirements
 
Call girls In Rana Pratap Bagh {Delhi ↫8447779280↬Escort Service (Delhi)
Call girls In Rana Pratap Bagh {Delhi ↫8447779280↬Escort Service (Delhi)Call girls In Rana Pratap Bagh {Delhi ↫8447779280↬Escort Service (Delhi)
Call girls In Rana Pratap Bagh {Delhi ↫8447779280↬Escort Service (Delhi)
 
Prestige Sancoale Goa Residneces Brochure.pdf
Prestige Sancoale Goa Residneces Brochure.pdfPrestige Sancoale Goa Residneces Brochure.pdf
Prestige Sancoale Goa Residneces Brochure.pdf
 
Bptp The Amaario Launch Luxury Project Sector 37D Gurgaon Dwarka Expressway...
Bptp The Amaario Launch  Luxury Project  Sector 37D Gurgaon Dwarka Expressway...Bptp The Amaario Launch  Luxury Project  Sector 37D Gurgaon Dwarka Expressway...
Bptp The Amaario Launch Luxury Project Sector 37D Gurgaon Dwarka Expressway...
 
Top tourism places in Dubai - Inch & Brick Realty
Top tourism places in Dubai - Inch & Brick RealtyTop tourism places in Dubai - Inch & Brick Realty
Top tourism places in Dubai - Inch & Brick Realty
 
Cheap Rate ✨➥9582086666▻✨Call Girls In Gurgaon Sector 1 (Gurgaon)
Cheap Rate ✨➥9582086666▻✨Call Girls In Gurgaon Sector 1 (Gurgaon)Cheap Rate ✨➥9582086666▻✨Call Girls In Gurgaon Sector 1 (Gurgaon)
Cheap Rate ✨➥9582086666▻✨Call Girls In Gurgaon Sector 1 (Gurgaon)
 
Parksville 96 Surrey Floor Plans May 2024
Parksville 96 Surrey Floor Plans May 2024Parksville 96 Surrey Floor Plans May 2024
Parksville 96 Surrey Floor Plans May 2024
 
Acibadem Konaklari Uskudar - Listin Turkey
Acibadem Konaklari Uskudar - Listin TurkeyAcibadem Konaklari Uskudar - Listin Turkey
Acibadem Konaklari Uskudar - Listin Turkey
 
Real Estate Finance and Investments (2019).pdf
Real Estate Finance and Investments (2019).pdfReal Estate Finance and Investments (2019).pdf
Real Estate Finance and Investments (2019).pdf
 
SVN Live 5.6.24 Weekly Property Broadcast
SVN Live 5.6.24 Weekly Property BroadcastSVN Live 5.6.24 Weekly Property Broadcast
SVN Live 5.6.24 Weekly Property Broadcast
 
Listing Turkey - 2024 - May Featured Portfolio
Listing Turkey - 2024 - May Featured PortfolioListing Turkey - 2024 - May Featured Portfolio
Listing Turkey - 2024 - May Featured Portfolio
 
Vanam At Purva Soukhyam Guduvanchery.pdf.pdf
Vanam At Purva Soukhyam Guduvanchery.pdf.pdfVanam At Purva Soukhyam Guduvanchery.pdf.pdf
Vanam At Purva Soukhyam Guduvanchery.pdf.pdf
 
Rohan Harita Tathawade Pune Brochure.pdf
Rohan Harita Tathawade Pune Brochure.pdfRohan Harita Tathawade Pune Brochure.pdf
Rohan Harita Tathawade Pune Brochure.pdf
 
~Call Girls In Roop Nagar {8447779280}(Low Price) Escort Service In Delhi
~Call Girls In Roop Nagar {8447779280}(Low Price) Escort Service In Delhi~Call Girls In Roop Nagar {8447779280}(Low Price) Escort Service In Delhi
~Call Girls In Roop Nagar {8447779280}(Low Price) Escort Service In Delhi
 
Escort—>Call GiRls In Mori Gate Delhi —>8447779280—Service Escorts In South D...
Escort—>Call GiRls In Mori Gate Delhi —>8447779280—Service Escorts In South D...Escort—>Call GiRls In Mori Gate Delhi —>8447779280—Service Escorts In South D...
Escort—>Call GiRls In Mori Gate Delhi —>8447779280—Service Escorts In South D...
 
Best Interior Design Services in Haldwani
Best Interior Design Services in HaldwaniBest Interior Design Services in Haldwani
Best Interior Design Services in Haldwani
 
Cheap Rate ✨➥9711108085▻✨Call Girls In Connaught Place (Delhi)
Cheap Rate ✨➥9711108085▻✨Call Girls In Connaught Place (Delhi)Cheap Rate ✨➥9711108085▻✨Call Girls In Connaught Place (Delhi)
Cheap Rate ✨➥9711108085▻✨Call Girls In Connaught Place (Delhi)
 
Low rate ↬Call girls in Sabzi Mandi Delhi | 8447779280}Escort Service In All ...
Low rate ↬Call girls in Sabzi Mandi Delhi | 8447779280}Escort Service In All ...Low rate ↬Call girls in Sabzi Mandi Delhi | 8447779280}Escort Service In All ...
Low rate ↬Call girls in Sabzi Mandi Delhi | 8447779280}Escort Service In All ...
 
Kohinoor Teiko Hinjewadi Phase 2 Pune E-Brochure.pdf
Kohinoor Teiko Hinjewadi Phase 2 Pune  E-Brochure.pdfKohinoor Teiko Hinjewadi Phase 2 Pune  E-Brochure.pdf
Kohinoor Teiko Hinjewadi Phase 2 Pune E-Brochure.pdf
 

Virginia Beach/Norfolk/Newport News Market Conditions Report

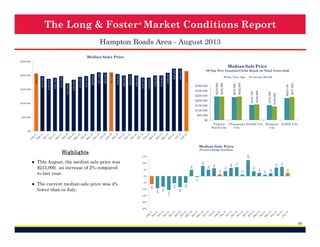
  • 1. The Long & Foster ® Market Conditions Report Hampton Roads Area - September 2013 Median Sales Price $250,000 $230,000 $207,250 $169,825 $161,950 $160,000 $200,000 $100,000 $171,750 Current Month $227,038 $250,000 $225,000 $300,000 $220,000 $350,000 $235,000 One Year Ago $202,000 $215,000 $225,000 $225,000 $209,900 $199,900 $199,900 $192,765 $192,000 $200,000 $205,000 $200,000 $205,250 $211,000 $210,000 $211,000 $197,750 $194,900 $185,000 $171,600 $197,500 $191,700 $150,000 $188,000 $197,495 $200,000 $205,000 Median Sale Price Of Top Five Counties/Cities Based on Total Units Sold $150,000 $100,000 $50,000 $50,000 $0 Virginia Chesapeake Norfolk City Newport Suffolk City Beach City City News City $0 Median Sale Price Percent Change Year/Year 2% 2% 1% 4% 1% 3% 7% 7% 6% 4% 1% 6% 5% 5% 5% -15% -5% -8% -11% -10% -6% -5% -2% -1% 0% -8% ● The current median sale price was 6% lower than in August. 10% -9% ● This September, the median sale price was $202,000, a decrease of 2% compared to last year. 8% 15% 7% 12% Highlights -20% -25% 46
  • 2. The Long & Foster ® Market Conditions Report Hampton Roads Area - September 2013 Total Units Sold 2,500 100 500 122 89 200 140 177 300 126 267 400 263 499 446 1,651 500 Current Month 192 2,071 2,059 2,059 1,794 1,623 One Year Ago 600 1,358 1,255 1,449 1,493 1,486 1,474 1,915 1,833 1,751 1,556 1,284 1,093 1,467 1,282 1,000 1,379 1,473 1,500 1,600 1,965 2,000 2,113 Total Units Sold Of Top Five Counties/Cities Based on Total Units Sold 0 Virginia Chesapeake Norfolk City Newport Suffolk City Beach City City News City 0 Total Units Sold Percent Change Year/Year 12% 8% 5% -1% 0% 4% 6% 8% 7% 0% 3% 0% 15% 18% 12% 15% 16% 16% 19% 15% 10% 10% -1% ● There was a decrease of 20% in total units sold in September compared to August. 10% 20% 17% ● This month's total units sold was higher than at this time last year, an increase of 12% versus September 2012. 20% 30% 20% Highlights -10% 47
  • 3. The Long & Foster ® Market Conditions Report Hampton Roads Area - September 2013 Total Units Sold by Type Detached Total Units Sold by Type Current Month Attached 2,500 Detached Attached 2,000 1,500 388 24% 1,000 500 1,263 76% 0 Total Units Sold by Price Range < 150K 1,200 150K to < 300K 300K to < 450K 450K to < 600K 600K and up Total Units Sold by Price Range Current Month < 150K 450K to < 600K 150K to < 300K 600K and up 300K to < 450K 1,000 800 600 247 15% 43 64 2% 4% 506 31% 400 200 0 791 48% 48
  • 4. The Long & Foster ® Market Conditions Report Hampton Roads Area - September 2013 Total Active Inventory 823 790 961 1,000 912 1,500 6,000 1,456 2,000 1,431 1,587 2,500 1,424 3,000 8,000 Current Month 2,527 2,500 One Year Ago 10,986 11,254 11,288 11,125 11,138 10,944 10,656 10,474 10,177 9,872 10,686 11,035 11,217 11,366 11,547 11,704 11,806 11,820 11,696 11,509 11,413 12,205 Of Top Five Counties/Cities Based on Total Units Sold 11,307 10,000 Total Active Inventory 12,532 12,000 13,003 14,000 500 4,000 0 Virginia Chesapeake Norfolk City Newport Suffolk City Beach City City News City 2,000 0 Total Active Inventory Highlights -6% -7% -9% -11% -12% -13% -12% -1% -2% -5% -2% -16% -18% -17% -18% -18% -18% -19% -18% -18% -20% -17% -15% -14% -10% -9% -5% -16% ● Active inventory this September was 2% lower than the previous month's supply of available inventory. 0% -17% ● Versus last September, the total number of homes available this month was lower by 231 units or 2%. Percent Change Year/Year -25% 49
  • 5. The Long & Foster ® Market Conditions Report Hampton Roads Area - September 2013 Total Active Inventory by Type Detached Total Active Inventory by Type Attached Current Month 14,000 Detached Attached 12,000 10,000 2,324 21% 8,000 6,000 4,000 8,662 79% 2,000 0 Total Active Inventory by Price Range < 150K 14,000 150K to < 300K 300K to < 450K 450K to < 600K Total Active Inventory by Price Range Current Month 600K and up < 150K 450K to < 600K 150K to < 300K 600K and up 300K to < 450K 12,000 10,000 8,000 6,000 805 728 7% 7% 2,915 27% 1,874 17% 4,000 2,000 4,664 42% 0 50
  • 6. The Long & Foster ® Market Conditions Report Hampton Roads Area - September 2013 Sale Price as % of List Price Average Sale Price as a Percent of List Price Of Top Five Counties/Cities Based on Total Units Sold Days on Market Current One Year Month Ago 95.0% 81 95 97.5% 105 105 100 95 90 85 80 104 106 107 98.4% 98.3% 97.3% Up 0.6% Vs. Year Ago by Price Range 108 100% 104 < 150K 150K to < 300K 300K to < 450K 450K to < 600K 600K and up 98% 101 98 96.9% Average Sale Price as a Percent of List Price Days on Market 110 96.7% Avg Sale Price as % of List Price Current One Year Month Ago Down -15% Vs. Year Ago 110 96.8% 95.6% Virginia Chesapeake Norfolk City Newport Suffolk City Beach City City News City 95.5% 115 Current Month 98.6% 98.0% 97.4% 97.5% 97.6% 97.4% 100.0% 99.0% 98.0% 97.0% 96.0% 95.0% 94.0% 93.0% 96.5% 96.7% 96.7% 96.7% 97.1% 97.1% 96.8% 96.7% 96.9% 97.3% 96.9% 96.7% 96.6% One Year Ago 96.3% 96.1% 96.2% 96.5% 96.2% 96.5% 96.3% 96.8% 97.0% 96.0% 97.5% 97.5% 97.4% 97.9% 98.0% 96 95 91 89 91 96 96 97 94 96% 94% 96 94 92% 90 90% 82 83 83 88% 81 86% 84% 51
  • 7. The Long & Foster ® Market Conditions Report Hampton Roads Area - September 2013 Total Dollar Volume Sold In Thousands Highlights $100,000 $380,043 $507,758 $534,111 $489,189 $403,218 $379,016 $300,382 $269,970 $324,608 $346,175 $331,381 $340,493 $448,229 $464,160 $423,371 $357,581 $341,028 $271,427 $214,720 $331,083 $284,571 $200,000 $297,534 $300,000 $326,010 $400,000 $414,678 $500,000 $518,295 $600,000 ● Total volume sold this September was 12% greater than the same month one year ago. ● In September, there was 6.7 months of supply available, compared to 7.6 in September 2012. That was a decrease of 13% versus a year ago. $0 Months of Supply Current Month's Active Inventory/Current Month's Unit Sales Total Dollar Volume Sold Current One Year Month Ago 12 10.4 4 $340,492,514 Up 12% Vs. Year Ago 6.7 5.4 5.3 5.4 5.4 6.1 6.6 7.7 8.1 6.8 7.2 7.4 7.6 5.9 6.3 6.0 6.7 7.4 7.5 7.7 6 $380,043,330 9.0 9.5 9.1 8 8.8 10 Months of Supply Current One Year Month Ago 6.7 7.6 2 Down -13% Vs. Year Ago 0 52
  • 8. The Long & Foster ® Market Conditions Report Hampton Roads Area - September 2013 New Listings New Listings & New Contracts 163 134 219 194 357 370 348 698 605 Virginia Chesapeake Norfolk City Newport Suffolk City Beach City City News City 112 90 100 0 141 200 139 230 300 500 Current Month 145 248 One Year Ago 240 400 458 500 390 1,885 Of Top Five Counties/Cities Based on Total Units Sold 1,629 1,784 1,927 New Contracts 2,192 2,055 1,902 1,573 Current Month 343 3,013 1,000 800 600 400 200 0 2,521 3,153 2,825 3,294 3,215 2,938 2,680 2,865 1,586 1,470 1,223 1,375 1,557 1,367 1,806 1,706 One Year Ago 2,043 2,433 2,304 2,686 2,542 2,882 1,839 1,786 1,809 1,484 1,396 1,211 1,363 1,320 1,426 1,500 1,806 2,000 1,000 2,787 2,577 2,689 1,696 2,315 2,500 New Contracts (Under Active Contract Status) 2,185 3,000 2,466 3,500 2,934 3,099 New Listings Of Top Five Counties/Cities Based on Total Units Sold 0 Virginia Chesapeake Norfolk City Newport Suffolk City Beach City City News City New Listings Current One Year Month Ago 2,521 2,304 Up 9% Vs. Year Ago New Contracts Current One Year Month Ago 1,629 1,367 Up 19% Vs. Year Ago Supply/Demand Ratio Highlights ● Based on this month's amount of new listings and new contracts, the ratio of home supply (new listings) to current home demand (new contracts) was 1.5, a decrease of 8% from September 2012. Number of New Listings to New Contracts 2.5 1.7 1.7 1.7 1.7 1.7 1.5 1.9 1.9 2.0 1.4 1.6 1.6 1.6 1.7 1.5 1.5 1.6 1.7 1.5 1.6 1.6 1.5 1.5 1.6 1.5 1.6 1.3 1.0 0.5 0.0 53