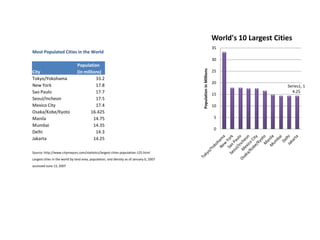
1. World's 10 Largest Cities
35
Most Populated Cities in the World
30
Population
Population in Millions
City (in millions) 25
Tokyo/Yokohama 33.2
20
New York 17.8 Series1, 1
Sao Paulo 17.7 4.25
15
Seoul/Incheon 17.5
Mexico City 17.4 10
Osaka/Kobe/Kyoto 16.425
Manila 14.75 5
Mumbai 14.35
0
Delhi 14.3
Jakarta 14.25
Source: http://www.citymayors.com/statistics/largest-cities-population-125.html
Largest cities in the world by land area, population, and density as of January 6, 2007
accessed June 13, 2007
2. CORONADO FOUNDRIES
Production and Scrap Report
June
Factory Units Produced Scrap Generated*
250
Production and Scrap Report
Colorado 7,259 110
Iowa 1 8,723 129
200
Iowa 2 10,548 245
Kansas 5,211 50
Units in Scrap
150
Nevada 4,527 45
Oklahoma 9,914 149
100
Texas 1 11,204 190
Texas 2 8,564 100
Texas 3 6,799 75
50
Utah 1 7,612 150
Utah 2 8,247 125 -
4,000 6,000 8,000 10,000 12,000
Total 88,608 1,368
Units Produced
*Scrap is generated during the manufacturing process.
3. What is your
favorite fast-food Number of Students
restaurant in
Maywood?
Macdonalds 1
Pollo Loco 2
Burger King 3
Jack in the Box 4
Chris's Hamburgers 7
King Taco 6
Denny's 0
Little Caesar 2
Pronto Pizza 4
Yum Yum Donuts 1
4. What is your
favorite fast-food Number of Students
restaurant in
Maywood?
Macdonalds 1
Pollo Loco 2
Burger King 3
Jack in the Box 4
Chris's Hamburgers 7
King Taco 6
Denny's 0 7
6
Little Caesar 2 Number of Students
5
Pronto Pizza 4 4
Yum Yum Donuts 1 3
2
1
0
5. $80,000 EDUACTION PAYS
Median Income
$60,000 Men Women
$40,000
$20,000
$-
No high school High school Some college or Bachelor's degree Graduate or
diploma diploma associate's professional
degree
Education Levels degree
Median Income by Education Level
Education Level Men Women
No high school diploma $ 22,138 $ 13,076
High school diploma $ 31,683 $ 20,179
Some college or associate's degree $ 39,601 $ 25,736
Bachelor's degree $ 53,693 $ 26,250
Graduate or professional degree $ 71,918 $ 47,319
Source: U.S. Census Bureau, 2005 American Community Survey
http://www.census.gov/prod/2006pubs/acs-02.pdf, page 13
6.
7.
8. Operating Expenses
Years ending June 30
(in millions) American Red Cross
Operating Expenses
Year Expenses $6,000.0
1997 $ 1,721.8
1998 $ 1,790.9 $5,000.0
1999 $ 2,062.7
$4,000.0
2000 $ 2,226.6
(in millions)
2001 $ 2,489.0
$3,000.0
2002 $ 3,259.8
2003 $ 3,071.0
$2,000.0
2004 $ 3,199.5
2005 $ 3,427.9 $1,000.0
2006 $ 5,628.1
$-
1997
1998
1999
2000
2001
2002
2003
2004
2005
2006
Source: Annual Reports of the American Red Cross
http://www.redcross.org
Year
9. 36
Running Times 35.5
10-Week Workout Program
35
Time in Minutes
Week Time
1 35.5 34.5
2 35.25
3 35.25
4 35 34
5 35.25
6 34.75
33.5
7 34.5
8 34.15
9 34.25 33
10 34 1 2 3 4 5 6 7 8 9 10
Week