The document discusses key biology skills needed for the ACT exam, including understanding scientific terminology related to data presentation, distinguishing between different types of graphs, and comprehending metric unit conversions. It defines quantitative and qualitative variables, independent and dependent variables, and describes three common types of graphs - line graphs, bar graphs, and pie charts. It also reviews the metric units for weight, liquids, length, and time, along with common prefixes and simple conversions between units.
1. s
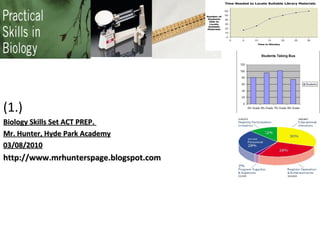
(1.)
Biology Skills Set ACT PREP.
Mr. Hunter, Hyde Park Academy
03/08/2010
http://www.mrhunterspage.blogspot.com
2. Mr. Hunter
Biology
• Objective
• SWBAT
• Understand basic scientific terminology in
relation to data presentation.
• Distinguish between three types of graphs of
data.
• Understand the relationship of metric unit
conversions
3. There are different types of variables in science
Variables -Data
(information being examined)
A. Quantitative data: information that can be
discretely counted (measured). Ex:
numbers, quantities, or amounts
B. Qualitative data: information that cannot
be directly measured. Ex: colors, moods,
shapes etc.
C. Independent variables: That information
which is subject to change in an experiment
– they are values that you can manipulate.
Ex: pH values, temperatures, additive
amounts, etc. (x-axis)
D. Dependent variables: That information
which is measured in an experiment. Ex:
distance, rates, number of items etc. It is
the observed result of the independent
variable being manipulated. (y-axis)
4. Data-variables can be displayed graphically
Graphical Representation
A. A line graph gives information among
discrete data points. One can determine if
relationships (correlations) exist among the
data. Lines constructed should be of “the
best fit” to the data. Line graphs are very
common in scientific research.
B. Bar graphs give information related to
quantities (amounts) – proportional values
taken over a period of time or different
conditions – usually for small data sets
C. A pie chart gives information on percentage
(%) relationships. Pie graphs are not
normally used for scientific data analysis.
5. Units and Conversions
Units of Measurements Metric Conversions
A. Weight: measured in grams (g)
B. Liquids: measured in liters (L) King Henry Doesn’t Usually Drink Chocolate Milk
C. Length measured in Meters (m)
D. Time: measured in seconds (s) K = Kilo Ex: 12.54km = x cm =1254000cm
Simple Conversions and prefixes H = Hecto
• Deci: 1/10 0.1 D = Deca
• U = Units Ex: 458ml = x hl = .00458 hl
Centi: 1/100 .01
D = Deci
• Mili: 1/1000 .001
C = Centi
• Micro: 1/1000000 .000001 M = Mili Ex: 10dg = x Kg = .0010 Kg
• Nano: 1/1000000000 .000000001
• Deca: 10 Conversion of Fahrenheit to Celsius:
• Hecto: 100 25(F) = (25-32) * 5 / 9
• Kilo: 1000 Celsius to Fahrenheit
• Mega: 1000000 45(C) = (45 * 9 ) / 5 + 32
6. Practice Problems
King Henry Doesn’t Usually Drink Chocolate Milk
1. 1000 ml = ______ L
2. 500 ml = ______ L
3. 4.4km = ________ cm
4. 25dg = _________ Kg
5. 45HL = __________ ml
7. Practice Problems Solutions
King Henry Doesn’t Usually Drink Chocolate Milk
1. 1000 ml = __1.0____ L
2. 500 ml = __.500____ L
3. 4.4km = __440,000______ cm
4. 25dg = _.0025________ Kg
5. 45HL = ____4,500,000______ ml
8. Graduated Cylinders, Tools of the Trade
Flasks and Beakers
A. Graduated cylinders, flasks or
beakers are used to measure
amounts of liquid.
B. The units for volume are
measured in liters.
C. To read the measured amounts of
volume locate the meniscus of the
liquid. Match the bottom portion
of the meniscus with the marked
measurements on the beaker or
the flask to determine the amount
of liquid.
9. Tools of The Trade
Scales
(Triple Beam Balances) A. The scale can be used to measure
how heavy an object is.
B. The unit of weight is the gram.
C. To determine the weight of an
object on a triple beam balance,
move the individual sliding scale
weights (masses) until the balance
mark is level.
D. Add the total masses of the sliding
scale weights to determine the total
weight of the object.
10. Tools of The Trade
Rulers (Meter Sticks)
A. The meter stick or ruler can be
used to measure the lengths of
objects.
B. The unit of length is the meter
(M) – which can be denoted in
smaller or larger increments
depending upon the size of the
object being measured.