1. Monthly Market Commentary December 7, 2009
MACDOUGALL, MACDOUGALL & MACTIER INC.
Service to Investors since 1849
MONTHLY MARKET COMMENTARY
INVESTMENT RESEARCH DECEMBER 2009
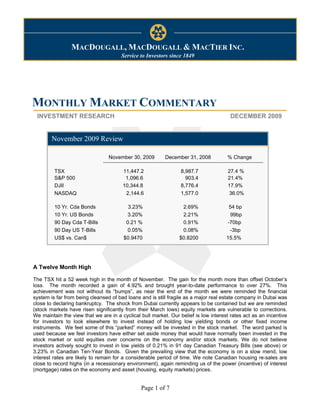
November 2009 Review
November 30, 2009 December 31, 2008 % Change
TSX 11,447.2 8,987.7 27.4 %
S&P 500 1,096.6 903.4 21.4%
DJII 10,344.8 8,776.4 17.9%
NASDAQ 2,144.6 1,577.0 36.0%
10 Yr. Cda Bonds 3.23% 2.69% 54 bp
10 Yr. US Bonds 3.20% 2.21% 99bp
90 Day Cda T-Bills 0.21 % 0.91% -70bp
90 Day US T-Bills 0.05% 0.08% -3bp
US$ vs. Can$ $0.9470 $0.8200 15.5%
A Twelve Month High
The TSX hit a 52 week high in the month of November. The gain for the month more than offset October’s
loss. The month recorded a gain of 4.92% and brought year-to-date performance to over 27%. This
achievement was not without its “bumps”, as near the end of the month we were reminded the financial
system is far from being cleansed of bad loans and is still fragile as a major real estate company in Dubai was
close to declaring bankruptcy. The shock from Dubai currently appears to be contained but we are reminded
(stock markets have risen significantly from their March lows) equity markets are vulnerable to corrections.
We maintain the view that we are in a cyclical bull market. Our belief is low interest rates act as an incentive
for investors to look elsewhere to invest instead of holding low yielding bonds or other fixed income
instruments. We feel some of this “parked” money will be invested in the stock market. The word parked is
used because we feel investors have either set aside money that would have normally been invested in the
stock market or sold equities over concerns on the economy and/or stock markets. We do not believe
investors actively sought to invest in low yields of 0.21% in 91 day Canadian Treasury Bills (see above) or
3.23% in Canadian Ten-Year Bonds. Given the prevailing view that the economy is on a slow mend, low
interest rates are likely to remain for a considerable period of time. We note Canadian housing re-sales are
close to record highs (in a recessionary environment), again reminding us of the power (incentive) of interest
(mortgage) rates on the economy and asset (housing, equity markets) prices.
Page 1 of 7
2. Monthly Market Commentary December 7, 2009
Currency Confusion:
Exchange rate movements are having dramatic effects on investor returns and economic prospects. For
example, the Dow Jones Industrial Index (U.S. equity index) has enjoyed a return of 18% for the 11 months
ended in November but the Canadian dollar has risen by over 15%, leaving a Canadian investor with a much
lower return for the year. The high Canadian dollar has also dampened the economic recovery in Canada.
We note in the latest economic release in Canada the third quarter gross domestic economy rose 0.4% for
the quarter, but a major drag on growth was from the trade sector. This is illustrated below in the graph on
the left side. All components contributed to the growth in Canada with the exception of imports. The high
Canadian dollar has encouraged the importation of various goods and services and lessened the appeal of
Canadian made goods, though exports did grow. The importation of goods has the effect of raising the Gross
Domestic Product of the country from which we import from while exports raise our Gross Domestic Product.
For the third quarter, Canadians imported goods worth $94.2 billion, while only exporting $90.3 billion.
Source: Statistics Canada
The effect of the high Canadian dollar can also be seen on the current account balance Canada runs with the
rest of the world. The current account is the difference in net exports (exports less imports) and net cash
receipts (cash payments to the rest of the world less cash payments from the rest of the world). From a cash
flow point of view the current account shows more money is leaving the country than coming in. The third
quarter continued the trend from the previous three quarters. As the above right graph illustrates, Canada
has, in recent years, run a surplus with the rest of the world. Starting in the fourth quarter of 2008 this surplus
became a deficit and for the nine months of 2009 the deficit was at a record level of $13.1 billion
predominately due to net exports turning negative.
Predicting Currency Movements: We reviewed the literature on currency movements to see if there are
critical variables one can use to predict where currencies trade versus each other. Economic differences
(such as inflation, trade balance, budget surplus/deficits) between countries have long been considered
critical determinants of a currency’s value. This complex issue has been extensively studied in economic
literature. Still, there are no definitive answers. No single approach provides a satisfactory explanation of
exchange rate movements, particularly short and medium term. Nevertheless, we feature two approaches to
predicting currency movements which are used for forecasting purposes. The first approach has been broadly
used and normally taught in economics 101 classes, while the latter one is a relatively new concept.
Page 2 of 7
3. Monthly Market Commentary December 7, 2009
1) The Purchasing Power Parity (PPP) approach. This concept follows from the law of one price. This
thesis holds that in a competitive market, exchange rates will adjust to equalize the relative purchasing
power of currencies. Identical goods should sell for the same price once adjusted for currency. For
example, an identical car should sell for the same price regardless of the country in which it is sold
adjusted for a country’s currency. In theory if a car is sold for $25,000 in one country the identical car
should sell for the same amount in another country. In the case of the U.S., if a car was priced at
US$25,000 then in Canada it should be priced at $26,250 (the month end exchange rate between
Canada and the U.S. is $1.05 Canadian per U.S.). In theory, should these prices not equilibrate,
entrepreneurs would have the incentive to buy autos in the cheaper location and sell them into the higher
price location until the prices match adjusted for currency. In a more light-hearted approach, the
magazine The Economist publishes the local prices of McDonald’s (MCD-NYSE) restaurant item the Big
Mac around the world and computes the Big Mac PPP. The magazine then publishes the “fair value” of
the currency to equalize the price paid by a U.S. consumer. Below we illustrate the Big Mac PPP using
the price of Big Macs around the world as at July 2009 and using November 2009 month-end exchange
rates.
The Hamburger Standard The Hamburger Standard
$6.00 45.0% $4.00 0.0%
40.0% $3.50 -10.0%
$5.00 $3.00
35.0% Big Mac at Current
$2.50 -20.0%
$4.00 30.0% Big Mac at Current Exchange Rate
Exchange Rate $2.00 -30.0%
25.0% Under-Valuation
$3.00 $1.50 -40.0%
20.0% Over-Valuation
$1.00
$2.00 15.0% $0.50 -50.0%
10.0% $0.00 -60.0%
$1.00
5.0%
ina
A
Ru d
ia
ala a
T h ia
$0.00 0.0%
an
US
si
ss
ys
Ch
ne
ail
do
USA Canada U.K. Euro Japan
M
In
The Hamburger Standard
$8.00 120.0%
$7.00 100.0%
$6.00 Big Mac at Current
$5.00 80.0%
Exchange Rate
$4.00 60.0%
$3.00 Over-Valuation
40.0%
$2.00
$1.00 20.0%
$0.00 0.0%
nd
ay
k
en
A
ar
la
S
w
ed
m
U
or
er
en
w
itz
N
S
D
w
S
We use the price of a Big Mac in the U.S. and Europe. In Europe, the Big Mac sells for 3.31 Euros. Using
the November month-end closing price of the U.S. dollar and Euro of US$1.51 per Euro the Big Mac
should sell for $5.00 ($3.31 multiplied by 1.51). The price in the U.S. is $3.57. This implies an
overvaluation of the Euro of some 40%.
Page 3 of 7
4. Monthly Market Commentary December 7, 2009
We find it difficult to believe some of the currencies are so over/undervalued using this approach. Is the Euro,
Norway and Switzerland that much over-valued? One can see the limitation of this approach as it assumes
goods are freely tradable; there are no transportation charges or cultural differences.
2) Fundamental Equilibrium Exchange Rates (FEER): This concept has been recently advocated by an
organization called The Peterson Institute of International Economics (www.petersoninstitute.org). The
basic premise to arrive at the fair value of a currency is the exchange rate at which a country would not
increase its foreign indebtedness as a percentage of its Gross Domestic Product. We illustrate their
estimate of the fair value (FEER) of various currencies relative to the U.S. dollar in the table below. We
show the exchange rate at the end of March 2009, this month’s closing exchange rate and the necessary
currency adjustment from November’s close to reach their calculated fair value.
Using the two measures (PPP and FEER) shows that many of the Asian countries (China, Malaysia and
Thailand) have undervalued currencies. We also note the large currency adjustment made since March.
The Canadian dollar is but one currency whose adjustment has been rapid and appears slightly over-
valued in both approaches.
3) There is an argument each country has its particular nuances and that a generalized model is not
applicable. The graph on the following page highlights the relationship between the Canadian/U.S. dollar
and commodity prices. The three commodities used in this forecast are gold, natural gas and oil. As
these three commodities have moved up in price, the Canadian dollar has also moved up. We note the
forecast ($0.956) is above the current spot price ($0.9406) of the Canadian dollar.
Page 4 of 7
5. Monthly Market Commentary December 7, 2009
Source: Dundee Wealth Economics.
Ian Nakamoto
Director of Research
Recommended Stocks:
Agrium Inc.(AGU-TSX)
Telus Corporation (T-TSX)
iShares MSCI All Country Asia ex-Japan (AAXJ-NASDAQ)
Absolute Software Corporation (ABT-TSX)
The Royal Bank of Canada (RY-TSX)
Bombardier Inc. (BBD.B-TSX)
Metro Inc.
Page 5 of 7
6. Monthly Market Commentary December 7, 2009
Important Disclosures
Company Ticker Disclosures
McDonalds Corporation MCD-NYSE -
Agrium Inc. AGU-TSX 1
Telus Corporation T-TSX -
iShares MSCI All Country Asia ex-Japan AAXJ-NASDAQ -
Absolute Software Corporation ABT-TSX -
The Royal Bank of Canada RY-TSX -
Bombardier Inc. BBD.B-TSX -
The research analyst (s) who authored this report certify that the views expressed therein accurately reflect their personal views and that no part of the analyst’s compensation will be related to those
views.
Conflict of Interest Policy for Analysts
1. Refers to share ownership of the company in question by the Analyst. In the disclaimer section of a report, the number 1 will indicate that the analyst or a member of the analyst’s family has
any position (equity, derivative or other) in the shares in question.
2. Refers to share ownership of the company in question by the Director of Research or Supervisory Analyst. In the disclaimer section of a report, the number 2 will appear if the Director of
Research or Supervisory Analyst has a position (equity, derivative or other) in the shares in question.
3. Refers to any relationship the Analyst, a member of the family thereof, or firm has with the company in question. A relationship includes anything except the simple trading of stock for the
company. In the disclaimer section of a report, the number 3 will appear if the analyst, a family member thereof or the firm has a relationship with the company in question.
4. Refers to whether Analysts have visited facilities and/or key operations of the company.
5. Refers to whether the company in question defrayed any of the costs of traveling to see the company in question’s facilities. In the disclaimer section of the report, the number 5 will appear if
the company has paid any portion of the analyst’s travel expenses related to viewing facilities.
6. Refers to MacDougall, MacDougall & MacTier Inc. having undertaken any underwriting business from the company in question. If, in the previous 18 months, MacDougall, MacDougall &
MacTier Inc. has acted as an underwriter to the company in question, it will be included in the disclaimer section of a report with footnote number 6.
7. Collective ownership by 3Macs and its affiliates of 1% or more of any class of the issuer’s equity shares for a period of 60 days preceding the issuance of the report.
Definition of Equity Research Ratings & Risk Ratings
Equity Research Ratings
The rating system for recommendations on research reports published by MacDougall, MacDougall & MacTier Inc. will be as follows:
BUY - will represent opportunities that potentially offer in excess of a 20% return on investment within a 12-18 month period.
HOLD - will represent opportunities that offer between 5% and 20% potential return on investment within a 12-18 month period.
SELL- will represent opportunities that offer less than 5% return on investment within a 12-18 month period.
Risk Ratings
MacDougall, MacDougall & MacTier Inc. employs two risk ratings with its research reports; Above Market Risk and Market Risk.
Above Market Risk denotes a company, which operates in an inherently speculative industry, or one that is more volatile than the market as measured by its beta. Above Market Risk may also
indicate weakness in the company’s balance sheet, low debt ratings, and the lack of a dividend, low liquidity or other deficiencies.
Market Risk denotes a company, which is expected to present, on average, the volatility present with the overall market, measured by its beta. Market Risk companies will generally have sound
balance sheets, will be established, large cap companies in industries generally regarded as stable and for the most part will pay a dividend.
MacDougall, MacDougall & MacTier Inc. Equity Research Ratings Distribution
100
90
80
70
60
50
40
30
20
10
0
BUY HOLD SELL
■ Percentage of companies covered by MacDougall, MacDougall & MacTier Inc. Equity Research within each rating category.
Page 6 of 7
7. Monthly Market Commentary December 7, 2009
Glossary of Terms:
EPS Earnings per Share
P/E Price to Earnings Ratio
EBITDA Earnings before Interest, Taxes, Depreciation and Amortization
Market Cap Total Shares Outstanding multiplied by Shares Price
Enterprise Value Fully Diluted Shares Outstanding
PEG P/E Multiple Divided by Growth Rate
ADR American Depository Receipt
WACC Weighted Average Cost of Capital
Risk Free Rate 10 Year Treasury bond
Yield Dividend divided by Share Price
ASP Average Price
DSOs Days Sales Outstanding
Capex Capital Expenditures
CPU Cost per Unit
EVA Economic value Added
EV / EBITDA Enterprise Value / Earnings before Interest, Taxes, Depreciation and Amortization
DCF Discounted Cash Flow
Holts DCF Holts Discounted Cash Flow
DYT Dividend Yield Target
Yield Yield
BSOPM Black Scholes Options Pricing Model
BETA Quantitative measure of the volatility of a stock, mutual fund, or portfolio, relative to the overall market
MF Mutual Fund
This research report has been prepared and circulated for general information only. It does not account for the specific investment objectives and financial situation of any person receiving this
report. Investors should seek professional advice regarding the appropriateness of investing in any securities discussed or recommended in this report and should recognize that statements
regarding future prospects may not be realized. This report is not to be construed as an offer to sell or as a solicitation for an offer to buy any securities.
The information presented in this report has been compiled from sources believed to be reliable but no guarantee is made as to its accuracy, completeness, or correctness. All opinions and estimates
contained in this report are provided in good faith and are subject to change without notice.
Montreal 514-394-3000 Quebec 418-656-1212 Toronto 416-597-7900 London 519-645-1110
Page 7 of 7