

Recommended
Recommended
More Related Content
What's hot
What's hot (20)
Viewers also liked
Viewers also liked (20)
Similar to Subsidy analysis
Similar to Subsidy analysis (20)
More from Gale Pooley
More from Gale Pooley (20)
Recently uploaded
Recently uploaded (20)
Subsidy analysis
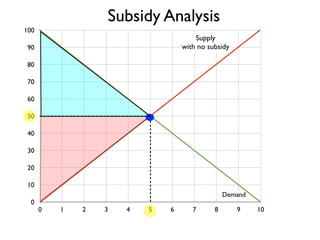
- 1. 100 90 80 70 60 50 40 30 20 10 0 Subsidy Analysis with no subsidy Demand Supply 0 1 2 3 4 5 6 7 8 9 10
- 2. 100 90 80 70 60 50 40 30 20 10 0 Subsidy Analysis with no subsidy Demand Supply 0 1 2 3 4 5 6 7 8 9 10 Subsidy to Seller with shift Supply curve down by the amount of the subsidy
- 3. 100 90 80 70 60 50 40 30 20 10 0 Subsidy Analysis with no subsidy Demand Supply Subsidy of 40 0 1 2 3 4 5 6 7 8 9 10 Subsidy to Seller with shift Supply curve down by the amount of the subsidy
- 4. 100 90 80 70 60 50 40 30 20 10 0 Subsidy Analysis with no subsidy Demand Supply Subsidy of 40 0 1 2 3 4 5 6 7 8 9 10 Subsidy to Seller with shift Supply curve down by the amount of the subsidy
- 5. 100 90 80 70 60 50 40 30 20 10 0 Supply with subsidy Subsidy Analysis with no subsidy Demand Supply Subsidy of 40 0 1 2 3 4 5 6 7 8 9 10 Subsidy to Seller with shift Supply curve down by the amount of the subsidy
- 6. 100 90 80 70 60 50 40 30 20 10 0 Supply with subsidy Subsidy Analysis with no subsidy Demand Supply Subsidy of 40 0 1 2 3 4 5 6 7 8 9 10 Subsidy to Seller with shift Supply curve down by the amount of the subsidy
- 7. 100 90 80 70 60 50 40 30 20 10 0 Supply with subsidy Subsidy Analysis with no subsidy Demand Supply Subsidy of 40 0 1 2 3 4 5 6 7 8 9 10 Subsidy to Seller with shift Supply curve down by the amount of the subsidy
- 8. 100 90 80 70 60 50 40 30 20 10 0 Supply with subsidy Subsidy Analysis with no subsidy Demand Supply Subsidy of 40 0 1 2 3 4 5 6 7 8 9 10 Subsidy to Seller with shift Supply curve down by the amount of the subsidy
- 9. 100 90 80 70 60 50 40 30 20 10 0 Supply with subsidy Subsidy Analysis with no subsidy Demand Supply Subsidy of 40 0 1 2 3 4 5 6 7 8 9 10 Subsidy to Seller with shift Supply curve down by the amount of the subsidy
- 10. 100 90 80 70 60 50 40 30 20 10 0 Supply with subsidy Subsidy Analysis with no subsidy Demand Supply Subsidy of 40 0 1 2 3 4 5 6 7 8 9 10 Subsidy to Seller with shift Supply curve down by the amount of the subsidy
- 11. 100 90 80 70 60 50 40 30 20 10 0 Supply with subsidy Subsidy Analysis with no subsidy Demand Supply Subsidy of 40 0 1 2 3 4 5 6 7 8 9 10 Subsidy to Seller with shift Supply curve down by the amount of the subsidy
- 12. 100 90 80 70 60 50 40 30 20 10 0 Supply with subsidy Subsidy Analysis with no subsidy Demand Supply Subsidy of 40 0 1 2 3 4 5 6 7 8 9 10 Subsidy to Seller with shift Supply curve down by the amount of the subsidy
- 13. 100 90 80 70 60 50 40 30 20 10 0 Supply with subsidy Subsidy Analysis with no subsidy Demand Supply Subsidy of 40 0 1 2 3 4 5 6 7 8 9 10 Subsidy to Seller with shift Supply curve down by the amount of the subsidy
- 14. 100 90 80 70 60 50 40 30 20 10 0 Supply with subsidy Subsidy Analysis with no subsidy Demand Supply Subsidy Subsidy of 40 0 1 2 3 4 5 6 7 8 9 10 Subsidy to Seller with shift Supply curve down by the amount of the subsidy
- 15. 100 90 80 70 60 50 40 30 20 10 0 Subsidy Analysis Sellers receive 70 Supply with subsidy with no subsidy Demand Supply Subsidy Subsidy of 40 0 1 2 3 4 5 6 7 8 9 10 Subsidy to Seller with shift Supply curve down by the amount of the subsidy
- 16. 100 90 80 70 60 50 40 30 20 10 0 Subsidy Analysis Sellers receive 70 Supply with subsidy with no subsidy Buyers pay 30 Demand Supply Subsidy Subsidy of 40 0 1 2 3 4 5 6 7 8 9 10 Subsidy to Seller with shift Supply curve down by the amount of the subsidy
- 17. 100 90 80 70 60 50 40 30 20 10 0 Subsidy Analysis Sellers receive 70 Government pays 40 in subsidy Subsidy Supply with subsidy with no subsidy Buyers pay 30 Demand Supply Subsidy of 40 0 1 2 3 4 5 6 7 8 9 10 Subsidy to Seller with shift Supply curve down by the amount of the subsidy
- 18. 100 90 80 70 60 50 40 30 20 10 0 Subsidy Analysis Sellers receive 70 Government pays 40 in subsidy Subsidy Supply with subsidy with no subsidy Buyers pay 30 Subsidy of 40 of 40 Demand Supply 0 1 2 3 4 5 6 7 8 9 10 Government spends 280 to get 240 gain Deadweight loss Subsidy to Seller with shift Supply curve down by the amount of the subsidy
- 19. 100 90 80 70 60 50 40 30 20 10 0 Subsidy Analysis 0 1 2 3 4 5 6 7 8 9 10
- 20. 100 90 80 70 60 50 40 30 20 10 0 Subsidy Analysis 0 1 2 3 4 5 6 7 8 9 10
- 21. 100 90 80 70 60 50 40 30 20 10 0 Subsidy Analysis 0 1 2 3 4 5 6 7 8 9 10
- 22. 100 90 80 70 60 50 40 30 20 10 0 Subsidy Analysis 0 1 2 3 4 5 6 7 8 9 10
- 23. 100 90 80 70 60 50 40 30 20 10 0 Subsidy Analysis 0 1 2 3 4 5 6 7 8 9 10
- 24. 100 90 80 70 60 50 40 30 20 10 0 Subsidy Analysis 0 1 2 3 4 5 6 7 8 9 10
- 25. 100 90 80 70 60 50 40 30 20 10 0 Subsidy Analysis 0 1 2 3 4 5 6 7 8 9 10
- 26. 100 90 80 70 60 50 40 30 20 10 0 Subsidy Analysis 0 1 2 3 4 5 6 7 8 9 10
- 27. 100 90 80 70 60 50 40 30 20 10 0 Subsidy Analysis 0 1 2 3 4 5 6 7 8 9 10
- 28. 100 90 80 70 60 50 40 30 20 10 0 Subsidy Analysis 0 1 2 3 4 5 6 7 8 9 10
- 29. 100 90 80 70 60 50 40 30 20 10 0 Subsidy Analysis 0 1 2 3 4 5 6 7 8 9 10
- 30. 100 90 80 70 60 50 40 30 20 10 0 Subsidy Analysis 0 1 2 3 4 5 6 7 8 9 10
- 31. 100 90 80 70 60 50 40 30 20 10 0 Subsidy Analysis 0 1 2 3 4 5 6 7 8 9 10
- 32. 100 90 80 70 60 50 40 30 20 10 0 Subsidy Analysis Deadweight Loss 0 1 2 3 4 5 6 7 8 9 10
- 33. 100 90 80 70 60 50 40 30 20 10 0 Subsidy Analysis Deadweight Loss 0 1 2 3 4 5 6 7 8 9 10
- 34. 100 90 80 70 60 50 40 30 20 10 0 Subsidy Analysis 0 1 2 3 4 5 6 7 8 9 10 Sellers increase surplus from 125 to 245 Buyers increase surplus from 125 to 245 Total increase from 250 to 490, or 240 gain Deadweight Loss
- 35. 100 90 80 70 60 50 40 30 20 10 0 Subsidy Analysis 0 1 2 3 4 5 6 7 8 9 10 Sellers increase surplus from 125 to 245 Buyers increase surplus from 125 to 245 Total increase from 250 to 490, or 240 gain Government pays 280 in subsidy Surplus increases by 240 Deadweight loss of 40 Deadweight Loss