More Related Content
Similar to Regional Operating Income Bridge 2002 (20)
Regional Operating Income Bridge 2002
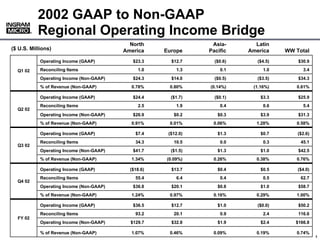
- 1. 2002 GAAP to Non-GAAP
Regional Operating Income Bridge
®
®
North Asia- Latin
($ U.S. Millions) America Europe Pacific America WW Total
Operating Income (GAAP) $23.3 $12.7 ($0.6) ($4.5) $30.9
Reconciling Items 1.0 1.3 0.1 1.0 3.4
Q1 02
Operating Income (Non-GAAP) $24.3 $14.0 ($0.5) ($3.5) $34.3
% of Revenue (Non-GAAP) 0.78% 0.80% (0.14%) (1.16%) 0.61%
Operating Income (GAAP) $24.4 ($1.7) ($0.1) $3.3 $25.9
Reconciling Items 2.5 1.9 0.4 0.6 5.4
Q2 02
Operating Income (Non-GAAP) $26.9 $0.2 $0.3 $3.9 $31.3
% of Revenue (Non-GAAP) 0.91% 0.01% 0.06% 1.28% 0.58%
Operating Income (GAAP) $7.4 ($12.0) $1.3 $0.7 ($2.6)
Reconciling Items 34.3 10.5 0.0 0.3 45.1
Q3 02
Operating Income (Non-GAAP) $41.7 ($1.5) $1.3 $1.0 $42.5
% of Revenue (Non-GAAP) 1.34% (0.09%) 0.26% 0.38% 0.76%
Operating Income (GAAP) ($18.6) $13.7 $0.4 $0.5 ($4.0)
Reconciling Items 55.4 6.4 0.4 0.5 62.7
Q4 02
Operating Income (Non-GAAP) $36.8 $20.1 $0.8 $1.0 $58.7
% of Revenue (Non-GAAP) 1.24% 0.97% 0.16% 0.29% 1.00%
Operating Income (GAAP) $36.5 $12.7 $1.0 ($0.0) $50.2
Reconciling Items 93.2 20.1 0.9 2.4 116.6
FY 02
Operating Income (Non-GAAP) $129.7 $32.8 $1.9 $2.4 $166.8
% of Revenue (Non-GAAP) 1.07% 0.46% 0.09% 0.19% 0.74%
000000_1
1