
Recommended
Recommended
More Related Content
What's hot
What's hot (19)
Viewers also liked
Viewers also liked (16)
Similar to U.S. Bancorp Reports Record Q3 Profits
Similar to U.S. Bancorp Reports Record Q3 Profits (20)
More from finance13
More from finance13 (20)
Recently uploaded
Recently uploaded (20)
U.S. Bancorp Reports Record Q3 Profits
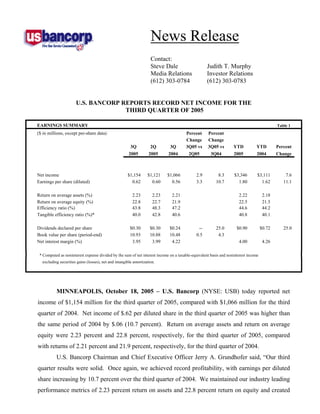
- 1. News Release Contact: Steve Dale Judith T. Murphy Media Relations Investor Relations (612) 303-0784 (612) 303-0783 U.S. BANCORP REPORTS RECORD NET INCOME FOR THE THIRD QUARTER OF 2005 EARNINGS SUMMARY Table 1 ($ in millions, except per-share data) Percent Percent Change Change 3Q 2Q 3Q 3Q05 vs 3Q05 vs YTD YTD Percent 2005 2005 2004 2Q05 3Q04 2005 2004 Change Net income $1,154 $1,121 $1,066 2.9 8.3 $3,346 $3,111 7.6 Earnings per share (diluted) 0.62 0.60 0.56 3.3 10.7 1.80 1.62 11.1 Return on average assets (%) 2.23 2.23 2.21 2.22 2.18 Return on average equity (%) 22.8 22.7 21.9 22.5 21.5 Efficiency ratio (%) 43.8 48.3 47.2 44.6 44.2 Tangible efficiency ratio (%)* 40.0 42.8 40.6 40.8 40.1 Dividends declared per share $0.30 $0.30 $0.24 -- 25.0 $0.90 $0.72 25.0 Book value per share (period-end) 10.93 10.88 10.48 0.5 4.3 Net interest margin (%) 3.95 3.99 4.22 4.00 4.26 * Computed as noninterest expense divided by the sum of net interest income on a taxable-equivalent basis and noninterest income excluding securities gains (losses), net and intangible amortization. MINNEAPOLIS, October 18, 2005 – U.S. Bancorp (NYSE: USB) today reported net income of $1,154 million for the third quarter of 2005, compared with $1,066 million for the third quarter of 2004. Net income of $.62 per diluted share in the third quarter of 2005 was higher than the same period of 2004 by $.06 (10.7 percent). Return on average assets and return on average equity were 2.23 percent and 22.8 percent, respectively, for the third quarter of 2005, compared with returns of 2.21 percent and 21.9 percent, respectively, for the third quarter of 2004. U.S. Bancorp Chairman and Chief Executive Officer Jerry A. Grundhofer said, “Our third quarter results were solid. Once again, we achieved record profitability, with earnings per diluted share increasing by 10.7 percent over the third quarter of 2004. We maintained our industry leading performance metrics of 2.23 percent return on assets and 22.8 percent return on equity and created
- 2. U.S. Bancorp Reports Third Quarter 2005 Results October 18, 2005 Page 2 positive operating leverage over the same quarter of 2004 and the second quarter of 2005. In today’s economic environment the low cost provider has a distinct advantage and we certainly demonstrated that we have that advantage in our industry with a tangible efficiency ratio of 40 percent in the third quarter. Finally, we returned 87 percent of our earnings in the quarter to our shareholders through dividends and share buybacks. “Average loans outstanding in the third quarter rose by a healthy 10.1 percent year-over- year and at an annualized growth rate of 12.4 percent over the second quarter of 2005. Net interest income increased slightly over the same quarter of 2004, despite a decline in the net interest margin. Net interest income increased at an annualized rate of 6.8 percent over the second quarter of 2005. Our fee-based businesses continued to grow, increasing by 9.7 percent over the third quarter of 2004. Fee income growth was led by our payment services-related businesses and deposit service charges, which grew year-over-year by 15.6 percent and 18.3 percent, respectively. “Credit quality remained stable again this quarter with total net charge-offs at just .46 percent of total average loans. In addition, nonperforming assets at the end of the quarter remained steady at $613 million. This is a direct result of our continuing commitment to reduce the overall risk profile of our Company. “We are delivering on our promise to maintain industry leading returns, while producing stable, high-quality revenue and earnings. We will continue to invest in distribution and scale to provide future growth opportunities, while striving to continuously improve our customer service. Further, since we began the current buyback program in the fourth quarter of 2003, we have returned 102 percent of our earnings to our shareholders, and we expect to continue to return a minimum of 80 percent going forward.” The Company’s results for the third quarter of 2005 improved over the same period of 2004, as net income rose by $88 million (8.3 percent), primarily due to growth in fee-based products and services and reduced credit costs. During the third quarter of 2005, the Company recognized $3 million of reparation in its mortgage servicing rights (“MSR”) asset, compared with an $87 million impairment charge in the third quarter of 2004, due to changing longer-term interest rates. Total net revenue on a taxable-equivalent basis for the third quarter of 2005 was $61 million (1.8 percent) higher than the third quarter of 2004, primarily reflecting 9.7 percent growth in fee-based revenue across the majority of fee categories and expansion in payment processing businesses. This (MORE)
- 3. U.S. Bancorp Reports Third Quarter 2005 Results October 18, 2005 Page 3 was partially offset by an $87 million unfavorable variance in securities gains (losses) due to gains recognized in the third quarter of 2004. Total noninterest expense in the third quarter of 2005 was $45 million (3.0 percent) lower than the third quarter of 2004, primarily reflecting the $90 million favorable change in the valuation of mortgage servicing rights, offset somewhat by incremental costs related to expanding the payment processing businesses and investments in in-store branches, affordable housing projects and other business initiatives. Provision for credit losses for the third quarter of 2005 was $145 million, a decrease of $21 million (12.7 percent) from the third quarter of 2004. The decrease in the provision for credit losses year-over-year reflected a decrease in total net charge-offs. Net charge-offs in the third quarter of 2005 were $156 million, compared with the second quarter of 2005 net charge-offs of $144 million and the third quarter of 2004 net charge-offs of $166 million. Net charge-offs in the third quarter of 2005 included a $12 million charge-off of a leveraged lease of a single airline entering bankruptcy during the quarter. This airline exposure was specifically considered in the Company’s allowance for credit losses in prior periods and reflects the continuing weakness in the airline and transportation industries. Total nonperforming assets were $613 million at September 30, 2005, relatively flat compared with $610 million at June 30, 2005, and a $192 million (23.9 percent) decline compared with $805 million at September 30, 2004. The ratio of the allowance for credit losses to nonperforming loans was 438 percent at September 30, 2005, compared with 441 percent at June 30, 2005, and 337 percent at September 30, 2004. (MORE)
- 4. U.S. Bancorp Reports Third Quarter 2005 Results October 18, 2005 Page 4 INCOME STATEMENT HIGHLIGHTS Table 2 (Taxable-equivalent basis, $ in millions, Percent Percent except per-share data) Change Change 3Q 2Q 3Q 3Q05 vs 3Q05 vs YTD YTD Percent 2005 2005 2004 2Q05 3Q04 2005 2004 Change Net interest income $1,791 $1,761 $1,782 1.7 0.5 $5,303 $5,340 (0.7) Noninterest income 1,576 1,541 1,524 2.3 3.4 4,499 4,084 10.2 Total net revenue 3,367 3,302 3,306 2.0 1.8 9,802 9,424 4.0 Noninterest expense 1,473 1,595 1,518 (7.6) (3.0) 4,399 4,206 4.6 Income before provision and income taxes 1,894 1,707 1,788 11.0 5.9 5,403 5,218 3.5 Provision for credit losses 145 144 166 0.7 (12.7) 461 605 (23.8) Income before income taxes 1,749 1,563 1,622 11.9 7.8 4,942 4,613 7.1 Taxable-equivalent adjustment 9 7 7 28.6 28.6 23 21 9.5 Applicable income taxes 586 435 549 34.7 6.7 1,573 1,481 6.2 Net income $1,154 $1,121 $1,066 2.9 8.3 $3,346 $3,111 7.6 Diluted earnings per share $0.62 $0.60 $0.56 3.3 10.7 $1.80 $1.62 11.1 Net Interest Income Third quarter net interest income on a taxable-equivalent basis was $1,791 million, compared with $1,782 million recorded in the third quarter of 2004. Average earning assets for the period increased over the third quarter of 2004 by $12.3 billion (7.3 percent), primarily driven by a $4.2 billion (28.6 percent) increase in residential mortgages, a $3.9 billion (10.0 percent) increase in total commercial loans and a $3.3 billion (7.8 percent) increase in total retail loans. The positive impact to net interest income from the growth in earning assets was offset somewhat by a lower net interest margin. The net interest margin in the third quarter of 2005 was 3.95 percent, compared with 4.22 percent in the third quarter of 2004. The decline in the net interest margin reflected the current lending environment, asset/liability management decisions and the impact of changes in the yield curve from a year ago. Since the third quarter of 2004, credit spreads have tightened by approximately 19 basis points across most lending products due to competitive pricing, growth in corporate payment card balances and a change in mix due to growth in lower-spread, fixed-rate credit products. The net interest margin also declined due to funding incremental growth with higher cost wholesale funding and asset/liability decisions designed to minimize the Company’s rate sensitivity position, including a 55 percent reduction in the net receive fixed swap position (MORE)
- 5. U.S. Bancorp Reports Third Quarter 2005 Results October 18, 2005 Page 5 since September 30, 2004. Increases in the margin benefit of deposits and net free funds helped to partially offset these factors. Net interest income in the third quarter of 2005 was higher than the second quarter of 2005 by $30 million (1.7 percent). Average earning assets grew quarter-over-quarter by $3.7 billion (2.1 percent). Growth in most loan categories drove the increase in average earning assets over the prior quarter. The positive impact to net interest income from the growth in earning assets and day basis was partially offset by a lower net interest margin. The net interest margin in the third quarter of 2005 was 4 basis points lower than the net interest margin of 3.99 percent recorded in the second quarter of 2005. The decline in the net interest margin from the second quarter of 2005 reflected tighter credit spreads (3 basis points) due to increased competition, in addition to growth in corporate payment card balances and changes in loan mix. Higher short-term rates and funding a higher percentage of earning asset growth with wholesale funding also contributed to the margin reduction. This was partially offset by the higher margin benefit of deposits and net free funds and loan fees. (MORE)
- 6. U.S. Bancorp Reports Third Quarter 2005 Results October 18, 2005 Page 6 NET INTEREST INCOME Table 3 (Taxable-equivalent basis; $ in millions) Change Change 3Q 2Q 3Q 3Q05 vs 3Q05 vs YTD YTD Percent 2005 2005 2004 2Q05 3Q04 2005 2004 Change Components of net interest income Income on earning assets $2,727 $2,572 $2,310 $155 $417 $7,741 $6,818 $923 Expense on interest-bearing liabilities 936 811 528 125 408 2,438 1,478 960 Net interest income $1,791 $1,761 $1,782 $30 $9 $5,303 $5,340 $(37) Average yields and rates paid Earning assets yield 6.01% 5.83% 5.47% 0.18% 0.54% 5.85% 5.44% 0.41% Rate paid on interest-bearing liabilities 2.49 2.23 1.55 0.26 0.94 2.23 1.46 0.77 Gross interest margin 3.52% 3.60% 3.92% (0.08%) (0.40%) 3.62% 3.98% (0.36%) Net interest margin 3.95% 3.99% 4.22% (0.04%) (0.27%) 4.00% 4.26% (0.26%) Average balances Investment securities $41,782 $42,341 $42,502 $(559) $(720) $42,308 $43,243 $(935) Loans 135,283 131,275 122,906 4,008 12,377 131,432 120,966 10,466 Earning assets 180,452 176,730 168,187 3,722 12,265 176,851 167,182 9,669 Interest-bearing liabilities 149,431 146,070 136,106 3,361 13,325 145,878 135,300 10,578 Net free funds* 31,021 30,660 32,081 361 (1,060) 30,973 31,882 (909) * Represents noninterest-bearing deposits, allowance for loan losses, unrealized gain (loss) on available-for-sale securities, non-earning assets, other noninterest-bearing liabilities and equity. (MORE)
- 7. U.S. Bancorp Reports Third Quarter 2005 Results October 18, 2005 Page 7 AVERAGE LOANS Table 4 ($ in millions) Percent Percent Change Change 3Q 2Q 3Q 3Q05 vs 3Q05 vs YTD YTD Percent 2005 2005 2004 2Q05 3Q04 2005 2004 Change Commercial $38,343 $37,595 $34,457 2.0 11.3 $37,348 $34,191 9.2 Lease financing 4,908 4,922 4,860 (0.3) 1.0 4,915 4,869 0.9 Total commercial 43,251 42,517 39,317 1.7 10.0 42,263 39,060 8.2 Commercial mortgages 20,341 20,156 20,231 0.9 0.5 20,255 20,420 (0.8) Construction and development 7,852 7,426 6,963 5.7 12.8 7,507 6,720 11.7 Total commercial real estate 28,193 27,582 27,194 2.2 3.7 27,762 27,140 2.3 Residential mortgages 18,741 17,198 14,569 9.0 28.6 17,266 14,079 22.6 Credit card 6,684 6,527 6,145 2.4 8.8 6,544 6,005 9.0 Retail leasing 7,467 7,314 6,842 2.1 9.1 7,328 6,507 12.6 Home equity and second mortgages 14,984 15,003 14,288 (0.1) 4.9 14,944 13,815 8.2 Other retail 15,963 15,134 14,551 5.5 9.7 15,325 14,360 6.7 Total retail 45,098 43,978 41,826 2.5 7.8 44,141 40,687 8.5 Total loans $135,283 $131,275 $122,906 3.1 10.1 $131,432 $120,966 8.7 Average loans for the third quarter of 2005 were $12.4 billion (10.1 percent) higher than the third quarter of 2004, driven by growth in average residential mortgages of $4.2 billion (28.6 percent) total commercial loans of $3.9 billion (10.0 percent) and total retail loans of $3.3 billion (7.8 percent). Total commercial real estate loans also increased year-over-year by $1.0 billion (3.7 percent). Average loans for the third quarter of 2005 were higher than the second quarter of 2005 by $4.0 billion (3.1 percent), reflecting growth in substantially all loan categories. Average investment securities in the third quarter of 2005 were $720 million (1.7 percent) lower than in the third quarter of 2004. Investment securities at September 30, 2005, were $1.9 billion higher than at September 30, 2004, but $783 million lower than the balance at June 30, 2005. The changes in the balance of the investment securities portfolio from a year ago principally reflected the net impact of repositioning the investment portfolio during 2004 as part of asset/liability risk management decisions to acquire variable-rate and shorter-term fixed-rate securities to minimize the Company’s rate sensitivity position. The decline from second quarter of (MORE)
- 8. U.S. Bancorp Reports Third Quarter 2005 Results October 18, 2005 Page 8 2005 primarily represented maturities and prepayments with the proceeds being utilized to partially fund loan growth. During the third quarter of 2005, the Company maintained a mix of approximately 41 percent variable-rate securities. AVERAGE DEPOSITS Table 5 ($ in millions) Percent Percent Change Change 3Q 2Q 3Q 3Q05 vs 3Q05 vs YTD YTD Percent 2005 2005 2004 2Q05 3Q04 2005 2004 Change Noninterest-bearing deposits $29,434 $29,148 $29,791 1.0 (1.2) $29,003 $29,807 (2.7) Interest-bearing deposits Interest checking 22,508 23,024 20,413 (2.2) 10.3 22,891 20,699 10.6 Money market accounts 28,740 29,563 31,854 (2.8) (9.8) 29,517 33,492 (11.9) Savings accounts 5,777 5,886 5,854 (1.9) (1.3) 5,876 5,896 (0.3) Savings products 57,025 58,473 58,121 (2.5) (1.9) 58,284 60,087 (3.0) Time certificates of deposit less than $100,000 13,263 13,152 12,869 0.8 3.1 13,132 13,168 (0.3) Time deposits greater than $100,000 21,262 20,459 14,535 3.9 46.3 20,133 13,085 53.9 Total interest-bearing deposits 91,550 92,084 85,525 (0.6) 7.0 91,549 86,340 6.0 Total deposits $120,984 $121,232 $115,316 (0.2) 4.9 $120,552 $116,147 3.8 Average noninterest-bearing deposits for the third quarter of 2005 were lower than the third quarter of 2004 by $357 million (1.2 percent). The year-over-year change in the average balance of noninterest-bearing deposits was impacted by product changes in the Consumer Banking business line. In late 2004, the Company migrated approximately $1.3 billion of noninterest-bearing deposit balances to interest checking accounts as an enhancement to its Silver Elite Checking product. Average branch-based noninterest-bearing deposits in the third quarter of 2005, excluding the migration of certain high-value customers to Silver Elite Checking, were higher by approximately $120 million (1.0 percent) over the same quarter of 2004, as net new checking accounts continue to grow. Average noninterest-bearing deposits in other areas, including commercial banking and Private Client, Trust and Asset Management, also increased year-over-year. These favorable variances were offset somewhat by expected declines in average noninterest-bearing deposits in corporate banking as these customers utilize their excess liquidity. (MORE)
- 9. U.S. Bancorp Reports Third Quarter 2005 Results October 18, 2005 Page 9 Average total savings products declined year-over-year by $1.1 billion (1.9 percent), due to reductions in average money market account balances and savings accounts, partially offset by higher interest checking balances. Average branch-based interest checking deposits increased by $2.3 billion (15.2 percent) over the same quarter of 2004 due to strong new account growth, as well as the $1.3 billion migration of the Silver Elite Checking product. This positive variance in branch- based interest checking account deposits was partially offset by reductions in other areas, principally corporate banking. Average money market account balances declined by $3.1 billion (9.8 percent) year-over-year, with the largest decline in the branches. The overall decrease in average money market account balances year-over-year was the result of the Company’s deposit pricing decisions. A portion of the money market balances have migrated to time deposits greater than $100,000 as rates increased on the time deposit products. Average time certificates of deposit less than $100,000 were higher in the third quarter of 2005 than the third quarter of 2004 by $394 million (3.1 percent). The Company experienced year-over- year growth in average time deposits greater than $100,000 of $6.7 billion (46.3 percent), most notably in corporate banking, as customers migrated balances to higher rate deposits. Average noninterest-bearing deposits for the third quarter of 2005 were $286 million (1.0 percent) higher than the second quarter of 2005. Average savings products declined by $1.4 billion (2.5 percent) in the current quarter from the second quarter of 2005. Average interest checking deposits declined $516 million (2.2 percent) primarily due to lower balances from corporate banking customers. Average money market account balances declined by $823 million (2.8 percent) reflecting customers’ preference for higher yielding products. Time certificates of deposit less than $100,000 increased modestly from the second quarter of 2005, while time deposits greater than $100,000 rose by $803 million (3.9 percent), primarily due to the migration of corporate banking customer balances to these products. (MORE)
- 10. U.S. Bancorp Reports Third Quarter 2005 Results October 18, 2005 Page 10 NONINTEREST INCOME Table 6 ($ in millions) Percent Percent Change Change 3Q 2Q 3Q 3Q05 vs 3Q05 vs YTD YTD Percent 2005 2005 2004 2Q05 3Q04 2005 2004 Change Credit and debit card revenue $185 $177 $164 4.5 12.8 $516 $465 11.0 Corporate payment products revenue 135 120 108 12.5 25.0 362 306 18.3 ATM processing services 64 57 45 12.3 42.2 168 132 27.3 Merchant processing services 200 198 188 1.0 6.4 576 494 16.6 Trust and investment management fees 251 253 240 (0.8) 4.6 751 740 1.5 Deposit service charges 246 234 208 5.1 18.3 690 595 16.0 Treasury management fees 109 117 118 (6.8) (7.6) 333 357 (6.7) Commercial products revenue 103 100 106 3.0 (2.8) 299 324 (7.7) Mortgage banking revenue 111 110 97 0.9 14.4 323 301 7.3 Investment products fees and commissions 37 39 37 (5.1) -- 115 119 (3.4) Securities gains (losses), net 1 1 88 -- (98.9) (57) (84) 32.1 Other 134 135 125 (0.7) 7.2 423 335 26.3 Total noninterest income $1,576 $1,541 $1,524 2.3 3.4 $4,499 $4,084 10.2 Noninterest Income Third quarter noninterest income was $1,576 million, an increase of $52 million (3.4 percent) from the same quarter of 2004, and $35 million (2.3 percent) higher than the second quarter of 2005. The increase in noninterest income over the third quarter of 2004 was driven by favorable variances in the majority of fee income categories, partially offset by an $87 million reduction in securities gains (losses). Credit and debit card revenue and corporate payment products revenue were both higher in the third quarter of 2005 than the third quarter of 2004 by $21 million and $27 million, or 12.8 percent and 25.0 percent, respectively. The growth in credit and debit card revenue was driven by higher transaction volumes and rate changes. The corporate payment products revenue growth reflected growth in sales, card usage, rate changes and the recent acquisition of a small fleet card business. ATM processing services revenue was higher by $19 million (42.2 percent) in the third quarter of 2005 than the same quarter of the prior year, primarily due to the expansion of the ATM business in May of 2005. Merchant processing services revenue was higher in the third quarter of 2005 than the same quarter of 2004 by $12 million (6.4 percent), reflecting an increase in sales volume, new business and higher equipment fees. Trust and investment management fees were higher by $11 million (4.6 percent) year-over-year, primarily due to (MORE)
- 11. U.S. Bancorp Reports Third Quarter 2005 Results October 18, 2005 Page 11 improved equity market conditions and account growth. Deposit service charges were higher year- over-year by $38 million (18.3 percent) due to account growth and transaction-related fees. Mortgage banking revenue was higher in the third quarter of 2005 than the same quarter of 2004 by $14 million (14.4 percent), due to higher production volumes and increased servicing income. Other income was higher by $9 million (7.2 percent), primarily due to higher income from equity and other insurance investments relative to the same quarter of 2004. Partially offsetting these positive variances, year-over-year, were reductions in treasury management fees and commercial products revenue, which declined by $9 million (7.6 percent) and $3 million (2.8 percent), respectively. The decrease in treasury management fees was primarily due to higher earnings credit on customers’ compensating balances relative to a year ago, reflecting rising interest rates. Commercial products revenue declined due to reductions in loan fees and international product revenue. Noninterest income was higher in the third quarter of 2005 than the second quarter of 2005 by $35 million (2.3 percent), due to increases in a majority of the fee income categories. Credit and debit card revenue and corporate payment products revenue rose by $8 million (4.5 percent) and $15 million (12.5 percent), respectively, reflecting higher sales volumes. ATM processing services revenue increased by $7 million (12.3 percent) primarily due to the acquisition of a processing business in the second quarter of 2005. Deposit service charges were higher by $12 million (5.1 percent) in the third quarter of 2005 compared with the second quarter of 2005, reflecting higher transaction-related fees and net new account growth. Offsetting these favorable variances was a decrease in treasury management fees from the second quarter of 2005. The $8 million (6.8 percent) decline in treasury management fees reflected seasonal tax-related processing revenue in the second quarter of 2005. (MORE)
- 12. U.S. Bancorp Reports Third Quarter 2005 Results October 18, 2005 Page 12 NONINTEREST EXPENSE Table 7 ($ in millions) Percent Percent Change Change 3Q 2Q 3Q 3Q05 vs 3Q05 vs YTD YTD Percent 2005 2005 2004 2Q05 3Q04 2005 2004 Change Compensation $603 $612 $564 (1.5) 6.9 $1,782 $1,673 6.5 Employee benefits 106 108 100 (1.9) 6.0 330 291 13.4 Net occupancy and equipment 162 159 159 1.9 1.9 475 468 1.5 Professional services 44 39 37 12.8 18.9 119 104 14.4 Marketing and business development 61 67 61 (9.0) -- 171 145 17.9 Technology and communications 118 113 110 4.4 7.3 337 314 7.3 Postage, printing and supplies 64 63 61 1.6 4.9 190 183 3.8 Other intangibles 125 181 210 (30.9) (40.5) 377 389 (3.1) Debt prepayment -- 54 5 nm nm 54 42 28.6 Other 190 199 211 (4.5) (10.0) 564 597 (5.5) Total noninterest expense $1,473 $1,595 $1,518 (7.6) (3.0) $4,399 $4,206 4.6 Noninterest Expense Third quarter noninterest expense totaled $1,473 million, a decrease of $45 million (3.0 percent) from the same quarter of 2004 and a $122 million (7.6 percent) decrease from the second quarter of 2005. The decrease in expense year-over-year was primarily driven by the $90 million favorable change in the valuation of mortgage servicing rights. Compensation expense was higher year-over- year by $39 million (6.9 percent), principally due to business expansion, including in-store branches, the Company’s payment processing businesses, and other growth initiatives. Employee benefits increased year-over-year by $6 million (6.0 percent), primarily as a result of higher payroll taxes. Professional services expense increased $7 million (18.9 percent) due to increases in legal, and other professional services related to business initiatives, technology development, and the integration of specific payment processing businesses. Technology and communications expense rose by $8 million (7.3 percent), reflecting technology investments that increased software expense, in addition to outside data processing expense. Other expense declined in the third quarter from the same quarter of 2004 by $21 million (10.0 percent), primarily due to lower litigation costs, operating losses and business integration costs related to payment processing businesses relative to a year ago. (MORE)
- 13. U.S. Bancorp Reports Third Quarter 2005 Results October 18, 2005 Page 13 Noninterest expense in the third quarter of 2005 was lower than the second quarter of 2005 by $122 million (7.6 percent). The decrease in noninterest expense in the third quarter of 2005 from the second quarter of 2005 was primarily driven by a $56 million favorable change in the MSR valuation quarter-over-quarter, as well as a $54 million charge taken in connection with the Company’s tender offer for certain debt securities in the second quarter of 2005. In addition, compensation expense was lower than the second quarter of 2005 by $9 million (1.5 percent), primarily due to lower incentives and stock-based compensation costs. Marketing and business development expense declined $6 million (9.0 percent) reflecting the timing of marketing programs and a decline in charitable contributions. Other expense declined in the third quarter from the second quarter of 2005 by $9 million (4.5 percent), primarily due to a reduction in write-downs associated with certain co-branding and lease arrangements recorded in the second quarter of 2005. Partially offsetting these favorable changes in noninterest expense were higher occupancy costs, professional services expense and technology costs. Professional services expense increased by $5 million (12.8 percent) as compared to the second quarter of 2005 due to integration and other business initiatives. Technology and communications expense rose by $5 million (4.4 percent) relative to the prior quarter primarily due to processing costs associated with recent acquisitions and business investments. (MORE)
- 14. U.S. Bancorp Reports Third Quarter 2005 Results October 18, 2005 Page 14 ALLOWANCE FOR CREDIT LOSSES Table 8 ($ in millions) 3Q 2Q 1Q 4Q 3Q 2005 2005 2005 2004 2004 Balance, beginning of period $2,269 $2,269 $2,269 $2,370 $2,370 Net charge-offs Commercial 7 9 14 8 2 Lease financing 16 6 13 10 19 Total commercial 23 15 27 18 21 Commercial mortgages 2 1 4 9 3 Construction and development (2) (3) 2 1 3 Total commercial real estate -- (2) 6 10 6 Residential mortgages 9 8 9 8 7 Credit card 63 64 65 61 65 Retail leasing 5 5 8 9 9 Home equity and second mortgages 14 16 17 18 18 Other retail 42 38 40 39 40 Total retail 124 123 130 127 132 Total net charge-offs 156 144 172 163 166 Provision for credit losses 145 144 172 64 166 Acquisitions and other changes -- -- -- (2) -- Balance, end of period $2,258 $2,269 $2,269 $2,269 $2,370 Components Allowance for loan losses $2,055 $2,082 $2,082 $2,080 $2,184 Liability for unfunded credit commitments 203 187 187 189 186 Total allowance for credit losses $2,258 $2,269 $2,269 $2,269 $2,370 Gross charge-offs $229 $222 $231 $235 $260 Gross recoveries $73 $78 $59 $72 $94 Net charge-offs to average loans (%) 0.46 0.44 0.55 0.52 0.54 Allowance as a percentage of: Period-end loans 1.65 1.70 1.76 1.80 1.90 Nonperforming loans 438 441 404 355 337 Nonperforming assets 368 372 341 303 294 (MORE)
- 15. U.S. Bancorp Reports Third Quarter 2005 Results October 18, 2005 Page 15 Credit Quality The allowance for credit losses was $2,258 million at September 30, 2005, compared with $2,269 million at June 30, 2005, and $2,370 million at September 30, 2004. The ratio of the allowance for credit losses to period-end loans was 1.65 percent at September 30, 2005, compared with 1.70 percent at June 30, 2005, and 1.90 percent at September 30, 2004. The ratio of the allowance for credit losses to nonperforming loans was 438 percent at September 30, 2005, compared with 441 percent at June 30, 2005, and 337 percent at September 30, 2004. Total net charge-offs in the third quarter of 2005 were $156 million, compared with the second quarter of 2005 net charge-offs of $144 million and the third quarter of 2004 net charge-offs of $166 million. Commercial and commercial real estate loan net charge-offs were $23 million for the third quarter of 2005, or .13 percent of average loans outstanding, compared with $13 million, or .07 percent of average loans outstanding, in the second quarter of 2005 and $27 million, or .16 percent of average loans outstanding, in the third quarter of 2004. The increase in net charge-offs reflected a $12 million charge-off of a leveraged lease of a single airline entering bankruptcy during the quarter. Retail loan net charge-offs of $124 million in the third quarter of 2005 were virtually flat as compared to the $123 million in the second quarter of 2005 and $8 million (6.1 percent) lower than the third quarter of 2004. Retail loan net charge-offs as a percent of average loans outstanding were 1.09 percent in the third quarter of 2005, compared with 1.12 percent and 1.26 percent in the second quarter of 2005 and third quarter of 2004, respectively. Lower levels of retail loan net charge-offs principally reflected the Company’s ongoing improvement in collection efforts and risk management. (MORE)
- 16. U.S. Bancorp Reports Third Quarter 2005 Results October 18, 2005 Page 16 CREDIT RATIOS Table 9 (Percent) 3Q 2Q 1Q 4Q 3Q 2005 2005 2005 2004 2004 Net charge-offs ratios* Commercial 0.07 0.10 0.16 0.09 0.02 Lease financing 1.29 0.49 1.07 0.82 1.56 Total commercial 0.21 0.14 0.27 0.18 0.21 Commercial mortgages 0.04 0.02 0.08 0.18 0.06 Construction and development (0.10) (0.16) 0.11 0.05 0.17 Total commercial real estate -- (0.03) 0.09 0.14 0.09 Residential mortgages 0.19 0.19 0.23 0.21 0.19 Credit card 3.74 3.93 4.11 3.82 4.21 Retail leasing 0.27 0.27 0.45 0.51 0.52 Home equity and second mortgages 0.37 0.43 0.46 0.49 0.50 Other retail 1.04 1.01 1.09 1.06 1.09 Total retail 1.09 1.12 1.22 1.18 1.26 Total net charge-offs 0.46 0.44 0.55 0.52 0.54 Delinquent loan ratios - 90 days or more past due excluding nonperforming loans** Commercial 0.04 0.05 0.06 0.05 0.05 Commercial real estate 0.01 0.01 0.02 -- 0.01 Residential mortgages 0.30 0.32 0.41 0.46 0.46 Retail 0.41 0.40 0.43 0.47 0.47 Total loans 0.19 0.19 0.22 0.23 0.23 Delinquent loan ratios - 90 days or more past due including nonperforming loans** Commercial 0.74 0.74 0.84 0.99 1.14 Commercial real estate 0.57 0.59 0.68 0.73 0.75 Residential mortgages 0.53 0.55 0.66 0.74 0.77 Retail 0.43 0.43 0.47 0.51 0.51 Total loans 0.57 0.58 0.66 0.74 0.80 * annualized and calculated on average loan balances ** ratios are expressed as a percent of ending loan balances (MORE)
- 17. U.S. Bancorp Reports Third Quarter 2005 Results October 18, 2005 Page 17 ASSET QUALITY Table 10 ($ in millions) Sep 30 Jun 30 Mar 31 Dec 31 Sep 30 2005 2005 2005 2004 2004 Nonperforming loans Commercial $265 $238 $254 $289 $348 Lease financing 35 60 70 91 91 Total commercial 300 298 324 380 439 Commercial mortgages 144 140 159 175 166 Construction and development 16 21 21 25 35 Commercial real estate 160 161 180 200 201 Residential mortgages 44 42 41 43 46 Retail 12 13 16 17 17 Total nonperforming loans 516 514 561 640 703 Other real estate 68 68 66 72 69 Other nonperforming assets 29 28 38 36 33 Total nonperforming assets* $613 $610 $665 $748 $805 Accruing loans 90 days or more past due $265 $258 $285 $294 $292 Nonperforming assets to loans plus ORE (%) 0.45 0.46 0.52 0.59 0.64 *does not include accruing loans 90 days or more past due Nonperforming assets at September 30, 2005, totaled $613 million, compared with $610 million at June 30, 2005, and $805 million at September 30, 2004. The ratio of nonperforming assets to loans and other real estate was .45 percent at September 30, 2005, compared with .46 percent at June 30, 2005, and .64 percent at September 30, 2004. (MORE)
- 18. U.S. Bancorp Reports Third Quarter 2005 Results October 18, 2005 Page 18 CAPITAL POSITION Table 11 ($ in millions) Sep 30 Jun 30 Mar 31 Dec 31 Sep 30 2005 2005 2005 2004 2004 Total shareholders' equity $19,864 $19,901 $19,208 $19,539 $19,600 Tier 1 capital 15,180 14,564 14,943 14,720 14,589 Total risk-based capital 23,283 22,362 23,099 23,352 21,428 Common equity to assets 9.6 % 9.8 % 9.7 % 10.0 % 10.2 % Tangible common equity to assets 6.2 6.1 6.2 6.4 6.4 Tier 1 capital ratio 8.4 8.1 8.6 8.6 8.7 Total risk-based capital ratio 12.8 12.5 13.3 13.1 12.7 Leverage ratio 7.7 7.5 7.9 7.9 7.9 Total shareholders’ equity was $19.9 billion at September 30, 2005, compared with $19.6 billion at September 30, 2004. The increase was the result of corporate earnings offset by share buybacks and dividends. Tangible common equity to assets was 6.2 percent at September 30, 2005, compared with 6.1 percent at June 30, 2005, and 6.4 percent at September 30, 2004. The Tier 1 capital ratio was 8.4 percent at September 30, 2005, compared with 8.1 percent at June 30, 2005, and 8.7 percent at September 30, 2004. The total risk-based capital ratio was 12.8 percent at September 30, 2005, compared with 12.5 percent at June 30, 2005, and 12.7 percent at September 30, 2004. The leverage ratio was 7.7 percent at September 30, 2005, compared with 7.5 percent at June 30, 2005, and 7.9 percent at September 30, 2004. All regulatory ratios continue to be in excess of stated “well capitalized” requirements. (MORE)
- 19. U.S. Bancorp Reports Third Quarter 2005 Results October 18, 2005 Page 19 COMMON SHARES Table 12 (Millions) 3Q 2Q 1Q 4Q 3Q 2005 2005 2005 2004 2004 Beginning shares outstanding 1,829 1,842 1,858 1,871 1,884 Shares issued for stock option and stock purchase plans, acquisitions and other corporate purposes 5 4 4 7 6 Shares repurchased (16) (17) (20) (20) (19) Ending shares outstanding 1,818 1,829 1,842 1,858 1,871 On December 21, 2004, the Board of Directors of U.S. Bancorp approved an authorization to repurchase up to 150 million shares of outstanding common stock during the following 24 months. This repurchase program replaced the Company’s previous program. During the third quarter of 2005, the Company repurchased 16 million shares of common stock. As of September 30, 2005, there were approximately 92 million shares remaining to be repurchased under the current authorization. (MORE)
- 20. U.S. Bancorp Reports Third Quarter 2005 Results October 18, 2005 Page 20 LINE OF BUSINESS FINANCIAL PERFORMANCE* Table 13 ($ in millions) Net Income Percent Change 3Q 2005 3Q 2Q 3Q 3Q05 vs 3Q05 vs YTD YTD Percent Earnings Business Line 2005 2005 2004 2Q05 3Q04 2005 2004 Change Composition Wholesale Banking $259 $266 $249 (2.6) 4.0 $781 $716 9.1 22 % Consumer Banking 473 454 384 4.2 23.2 1,333 1,085 22.9 41 Private Client, Trust and Asset Management 123 117 96 5.1 28.1 352 292 20.5 11 Payment Services 207 182 165 13.7 25.5 554 475 16.6 18 Treasury and Corporate Support 92 102 172 (9.8) (46.5) 326 543 (40.0) 8 Consolidated Company $1,154 $1,121 $1,066 2.9 8.3 $3,346 $3,111 7.6 100 % * preliminary data Lines of Business Within the Company, financial performance is measured by major lines of business, which include Wholesale Banking, Consumer Banking, Private Client, Trust and Asset Management, Payment Services, and Treasury and Corporate Support. These operating segments are components of the Company about which financial information is available and is evaluated regularly in deciding how to allocate resources and assess performance. Noninterest expenses incurred by centrally managed operations or business lines that directly support another business line’s operations are charged to the applicable business line based on its utilization of those services primarily measured by the volume of customer activities, number of employees or other relevant factors. These allocated expenses are reported as net shared services expense within noninterest expense. Designations, assignments and allocations change from time to time as management systems are enhanced, methods of evaluating performance or product lines change or business segments are realigned to better respond to our diverse customer base. During 2005, certain organization and methodology changes were made and, accordingly, prior period results have been restated and presented on a comparable basis. (MORE)
- 21. U.S. Bancorp Reports Third Quarter 2005 Results October 18, 2005 Page 21 Wholesale Banking offers lending, depository, treasury management and other financial services to middle market, large corporate and public sector clients. Wholesale Banking contributed $259 million of the Company’s net income in the third quarter of 2005, a 4.0 percent increase over the same period of 2004 and a 2.6 percent decrease from the second quarter of 2005. The increase in Wholesale Banking’s third quarter 2005 contribution over the same quarter of 2004 was primarily the result of favorable variances in total net revenue (3.2 percent) and total noninterest expense (1.9 percent). Partly offsetting these positive variances was a reduction in net recoveries (66.7 percent) reflected in the provision for credit losses. The favorable variance in total net revenue year-over-year was primarily the result of growth in net interest income (5.9 percent), as the business line’s noninterest income declined slightly. The increase in net interest income was driven by growth in average loans and deposits outstanding and wider deposit spreads, partially offset by tighter credit spreads. Total noninterest income declined $4 million year-over-year, as a decline in treasury management fees (6.1 percent) was somewhat offset by higher commercial products revenue and other revenue relative to the third quarter of 2004. The decrease in treasury management fees was primarily due to higher earnings credit on customers’ compensating balances relative to a year ago, reflecting rising interest rates. Wholesale Banking’s favorable variance in total noninterest expense year-over-year was the result of lower net shared services and other noninterest expense, partially offset by an increase in compensation and employee benefits. Net recoveries of $4 million in the current quarter, compared with net recoveries of $12 million in the third quarter of 2004, drove the unfavorable variance in the provision for credit losses year-over- year. The decrease in Wholesale Banking’s contribution to net income in the third quarter of 2005 from the second quarter of 2005 was the result of unfavorable variances in total net revenue (1.1 percent) and the provision for credit losses, partially offset by a decrease in total noninterest expense (3.8 percent). Total net revenue was lower on a linked quarter basis primarily due to tightening credit spreads, partially offset by the benefit from wider deposit spreads. The decrease in noninterest income on a linked quarter basis was primarily due to a decrease in treasury management fees (8.3 percent), which reflected seasonal tax-related processing revenue in the second quarter of 2005, and a decline in income related to equity investments. The decrease in total noninterest expense was principally due to lower net shared services expense related to transaction volumes for the seasonal tax receipt processing activities and other expense. Net recoveries of $4 million in the third quarter of 2005, compared with net recoveries of $16 million in the second (MORE)
- 22. U.S. Bancorp Reports Third Quarter 2005 Results October 18, 2005 Page 22 quarter of 2005, drove the unfavorable variance in the provision for credit losses quarter-over- quarter. Consumer Banking delivers products and services through banking offices, telephone servicing and sales, on-line services, direct mail and ATMs. It encompasses community banking, metropolitan banking, in-store banking, small business banking, including lending guaranteed by the Small Business Administration, small-ticket leasing, consumer lending, mortgage banking, consumer finance, workplace banking, student banking, 24-hour banking, and investment product and insurance sales. Consumer Banking contributed $473 million of the Company’s net income in the third quarter of 2005, a 23.2 percent increase over the same period of 2004 and a 4.2 percent increase over the prior quarter. The favorable increase year-over-year was the result of higher total net revenue (10.4 percent) and lower provision for credit losses (18.2 percent), partially offset by an increase in total noninterest expense (3.0 percent). Total net revenue was higher than the same quarter of 2004 due to increases in both net interest income (9.8 percent) and noninterest income (11.5 percent). Net interest income was higher year-over-year due to wider deposit spreads. Net interest income generated by growth in average loan balances was substantially offset by lower spreads on those assets given the competitive lending environment. Noninterest income improved in the third quarter of 2005 over the same period of 2004, principally due to growth in deposit service charges (18.4 percent) and mortgage banking revenue (14.3 percent). Total noninterest expense in the third quarter of 2005 was higher than the same quarter of 2004, primarily due to an increase in compensation and employee benefits (6.5 percent), the result of the Company’s in-store branch expansion, other hiring initiatives and production-based incentives. A year-over-year reduction in net charge-offs (18.2 percent) drove the positive variance in the business line’s provision for credit losses. The increase in Consumer Banking’s contribution in the third quarter of 2005 over the prior quarter was the net result of favorable variances in total net revenue (3.0 percent), partly offset by an increase in total noninterest expense (1.5 percent) and provision for credit losses (5.9 percent). Net interest income was higher quarter-over-quarter largely due to increases in average loans outstanding and deposit spreads relative to the prior quarter, which were partly offset by lower credit spreads. Noninterest income was higher (4.6 percent) than the prior quarter primarily due to growth in deposit service charges and other revenue. The unfavorable variance in total noninterest expense quarter-over-quarter was driven by an increase in marketing and business development (MORE)
- 23. U.S. Bancorp Reports Third Quarter 2005 Results October 18, 2005 Page 23 expense. A 5.9 percent increase in net charge-offs quarter-over-quarter drove the unfavorable variance in the provision for credit losses. Private Client, Trust and Asset Management provides trust, private banking, financial advisory, investment management and mutual fund servicing through five businesses: Private Client Group, Corporate Trust, Asset Management, Institutional Trust and Custody and Fund Services. Private Client, Trust and Asset Management contributed $123 million of the Company’s net income in the third quarter of 2005, 28.1 percent higher than the same period of 2004 and 5.1 percent higher than the prior quarter of 2005. The increase in the business line’s contribution in the third quarter of 2005 over the same quarter of 2004 was the result of favorable variances in total net revenue (11.9 percent). Total noninterest expense remained relatively flat year-over-year. Net interest income was favorably impacted year-over-year by wider deposit spreads and growth in deposit balances. Noninterest income increased by 7.0 percent from the same quarter of 2004, primarily due to improved equity market conditions and account growth. The business line’s contribution in the third quarter of 2005 increased 5.1 percent as compared with the prior quarter, with total net revenue slightly higher (1.6 percent) and total noninterest expense and provision for credit losses remaining relatively flat. Payment Services includes consumer and business credit cards, debit cards, corporate and purchasing card services, consumer lines of credit, ATM processing and merchant processing. Payment Services contributed $207 million of the Company’s net income in the third quarter of 2005, a 25.5 percent increase over the same period of 2004 and a 13.7 percent increase over the second quarter of 2005. The increase in Payment Services’ contribution in the third quarter of 2005 over the same period of 2004 was the result of higher total net revenue (14.8 percent) and a slightly lower provision for credit losses (2.2 percent), partially offset by an increase in total noninterest expense (11.0 percent). The increase in total net revenue year-over-year was due to growth in total noninterest income (16.3 percent) and net interest income (9.6 percent), reflecting growth in higher yielding retail loan balances, offset by increases in corporate card balances and rebates. The increase in noninterest income was principally the result of growth in credit and debit card revenue (13.5 percent), corporate payment products revenue (25.0 percent), ATM processing services revenue (63.3 percent) and merchant processing services revenue (6.4 percent). All categories benefited from higher transaction volumes, rate changes and business expansion initiatives. The growth in total noninterest expense year-over-year primarily reflected an increase in processing (MORE)
- 24. U.S. Bancorp Reports Third Quarter 2005 Results October 18, 2005 Page 24 expense related to the business line’s revenue growth, including costs associated with smaller Payment Services acquisitions. The increase in Payment Services’ contribution in the third quarter of 2005 over the prior quarter was primarily due to seasonally strong growth in total net revenue (7.4 percent), and lower provision for credit losses (4.3 percent), partly offset by higher total noninterest expense (5.0 percent). Net interest income increased 13.8 percent quarter-over-quarter, and fee-based revenue rose by 5.9 percent due to seasonally higher retail and corporate credit card sales volumes, ATM processing services revenue and merchant processing fees. The unfavorable variance in total noninterest expense from the prior quarter was primarily due to personnel and other costs to support ongoing business expansion and marketing programs. Treasury and Corporate Support includes the Company’s investment portfolios, funding, capital management and asset securitization activities, interest rate risk management, the net effect of transfer pricing related to average balances and the residual aggregate of those expenses associated with corporate activities that are managed on a consolidated basis. In addition, changes in MSR valuations primarily due to interest rates are managed at a corporate level and, as such, reported within this business unit. Operational expenses incurred by Treasury and Corporate Support on behalf of the other business lines are allocated back to the appropriate business unit, primarily based on customer transaction volume and account activities, deposit balances and employee levels and are identified as net shared services expense. Treasury and Corporate Support recorded net income of $92 million in the third quarter of 2005, compared with net income of $172 million in the third quarter of 2004 and $102 million in the second quarter of 2005. The change in net income in the current quarter from the same quarter of 2004 was the net result of the unfavorable change in net interest income (60.5 percent) reflecting the Company’s asset/liability management decisions, including higher-cost fixed funding and repositioning of the Company for changes in the interest rate environment, and the $86 million unfavorable change in net securities gains (losses), partially offset by favorable variances in the MSR valuation ($90 million) and debt prepayment expense ($5 million). Net income in the third quarter of 2005 was lower than net income in the second quarter of 2005, the result of the $94 million tax benefit realized in the second quarter of 2005, offset by a favorable MSR valuation ($56 million) and the second quarter of 2005 debt prepayment expense ($54 million). Total net interest income declined quarter-over-quarter, primarily due to the continuing asset/liability management decisions of the Company. (MORE)
- 25. U.S. Bancorp Reports Third Quarter 2005 Results October 18, 2005 Page 25 Additional schedules containing more detailed information about the Company’s business line results are available on the web at usbank.com or by calling Investor Relations at 612-303-0781. CHAIRMAN AND CHIEF EXECUTIVE OFFICER, JERRY A. GRUNDHOFER, AND VICE CHAIRMAN AND CHIEF FINANCIAL OFFICER, DAVID M. MOFFETT, WILL REVIEW THE FINANCIAL RESULTS IN A PRE-RECORDED CALL ON TUESDAY, OCTOBER 18, 2005. The call will be available by telephone or on the internet. The pre- recorded call will be available from approximately 7:00 a.m. (CDT) on Tuesday, October 18th through Tuesday, October 25th at 11:00 p.m. (CDT). To access the recorded call, please dial 800-938-1601. Participants calling from outside the United States, please call 402-220-1546. Find the recorded call via the internet at usbank.com. Minneapolis-based U.S. Bancorp (“USB”), with $207 billion in assets, is the 6th largest financial holding company in the United States. The Company operates 2,396 banking offices and 4,986 ATMs, and provides a comprehensive line of banking, brokerage, insurance, investment, mortgage, trust and payment services products to consumers, businesses and institutions. U.S. Bancorp is the parent company of U.S. Bank. Visit U.S. Bancorp on the web at usbank.com. (MORE)
- 26. U.S. Bancorp Reports Third Quarter 2005 Results October 18, 2005 Page 26 Forward-Looking Statements This press release contains forward-looking statements. Statements that are not historical or current facts, including statements about beliefs and expectations, are forward-looking statements. These statements often include the words “may,” “could,” “would,” “should,” “believes,” “expects,” “anticipates,” “estimates,” “intends,” “plans,” “targets,” “potentially,” “probably,” “projects,” “outlook” or similar expressions. These forward-looking statements cover, among other things, anticipated future revenue and expenses and the future prospects of the Company. Forward-looking statements involve inherent risks and uncertainties, and important factors could cause actual results to differ materially from those anticipated, including the following, in addition to those contained in the Company's reports on file with the SEC: (i) general economic or industry conditions could be less favorable than expected, resulting in a deterioration in credit quality, a change in the allowance for credit losses, or a reduced demand for credit or fee- based products and services; (ii) changes in the domestic interest rate environment could reduce net interest income and could increase credit losses; (iii) inflation, changes in securities market conditions and monetary fluctuations could adversely affect the value or credit quality of the Company's assets, or the availability and terms of funding necessary to meet the Company's liquidity needs; (iv) changes in the extensive laws, regulations and policies governing financial services companies could alter the Company's business environment or affect operations; (v) the potential need to adapt to industry changes in information technology systems, on which the Company is highly dependent, could present operational issues or require significant capital spending; (vi) competitive pressures could intensify and affect the Company's profitability, including as a result of continued industry consolidation, the increased availability of financial services from non-banks, technological developments, or bank regulatory reform; (vii) changes in consumer spending and savings habits could adversely affect the Company’s results of operations; (viii) changes in the financial performance and condition of the Company’s borrowers could negatively affect repayment of such borrowers’ loans; (ix) acquisitions may not produce revenue enhancements or cost savings at levels or within time frames originally anticipated, or may result in unforeseen integration difficulties; (x) capital investments in the Company's businesses may not produce expected growth in earnings anticipated at the time of the expenditure; and (xi) acts or threats of terrorism, and/or political and military actions taken by the U.S. or other governments in response to acts or threats of terrorism or otherwise could adversely affect general economic or industry conditions. Forward-looking statements speak only as of the date they are made, and the Company undertakes no obligation to update them in light of new information or future events. ### (MORE)
- 27. U.S. Bancorp Consolidated Statement of Income Three Months Ended Nine Months Ended (Dollars and Shares in Millions, Except Per Share Data) September 30, September 30, (Unaudited) 2005 2004 2005 2004 Interest Income Loans $2,167 $1,803 $6,105 $5,290 Loans held for sale 30 21 75 68 Investment securities 492 453 1,454 1,366 Other interest income 29 26 84 73 Total interest income 2,718 2,303 7,718 6,797 Interest Expense Deposits 414 222 1,083 654 Short-term borrowings 205 74 460 183 Long-term debt 317 232 895 641 Total interest expense 936 528 2,438 1,478 Net interest income 1,782 1,775 5,280 5,319 Provision for credit losses 145 166 461 605 Net interest income after provision for credit losses 1,637 1,609 4,819 4,714 Noninterest Income Credit and debit card revenue 185 164 516 465 Corporate payment products revenue 135 108 362 306 ATM processing services 64 45 168 132 Merchant processing services 200 188 576 494 Trust and investment management fees 251 240 751 740 Deposit service charges 246 208 690 595 Treasury management fees 109 118 333 357 Commercial products revenue 103 106 299 324 Mortgage banking revenue 111 97 323 301 Investment products fees and commissions 37 37 115 119 Securities gains (losses), net 1 88 (57) (84) Other 134 125 423 335 Total noninterest income 1,576 1,524 4,499 4,084 Noninterest Expense Compensation 603 564 1,782 1,673 Employee benefits 106 100 330 291 Net occupancy and equipment 162 159 475 468 Professional services 44 37 119 104 Marketing and business development 61 61 171 145 Technology and communications 118 110 337 314 Postage, printing and supplies 64 61 190 183 Other intangibles 125 210 377 389 Debt prepayment -- 5 54 42 Other 190 211 564 597 Total noninterest expense 1,473 1,518 4,399 4,206 Income before income taxes 1,740 1,615 4,919 4,592 Applicable income taxes 586 549 1,573 1,481 Net income $1,154 $1,066 $3,346 $3,111 Earnings per share $.63 $.57 $1.82 $1.64 Diluted earnings per share $.62 $.56 $1.80 $1.62 Dividends declared per share $.30 $.24 $.90 $.72 Average common shares outstanding 1,823 1,877 1,836 1,895 Average diluted common shares outstanding 1,849 1,904 1,862 1,919 Page 27
- 28. U.S. Bancorp Consolidated Ending Balance Sheet September 30, December 31, September 30, (Dollars in Millions) 2005 2004 2004 Assets (Unaudited) (Unaudited) Cash and due from banks $6,918 $6,336 $6,969 Investment securities Held-to-maturity 114 127 120 Available-for-sale 41,402 41,354 39,534 Loans held for sale 1,695 1,439 1,372 Loans Commercial 43,237 40,173 40,151 Commercial real estate 28,521 27,585 27,414 Residential mortgages 19,469 15,367 14,741 Retail 45,400 43,190 42,520 Total loans 136,627 126,315 124,826 Less allowance for loan losses (2,055) (2,080) (2,184) Net loans 134,572 124,235 122,642 Premises and equipment 1,850 1,890 1,894 Customers' liability on acceptances 85 95 146 Goodwill 6,372 6,241 6,226 Other intangible assets 2,586 2,387 2,419 Other assets 11,301 11,000 11,522 Total assets $206,895 $195,104 $192,844 Liabilities and Shareholders' Equity Deposits Noninterest-bearing $30,871 $30,756 $31,585 Interest-bearing 69,478 71,936 70,011 Time deposits greater than $100,000 20,446 18,049 13,971 Total deposits 120,795 120,741 115,567 Short-term borrowings 23,061 13,084 12,648 Long-term debt 36,257 34,739 38,004 Acceptances outstanding 85 95 146 Other liabilities 6,833 6,906 6,879 Total liabilities 187,031 175,565 173,244 Shareholders' equity Common stock 20 20 20 Capital surplus 5,913 5,902 5,868 Retained earnings 18,457 16,758 16,260 Less treasury stock (4,318) (3,125) (2,710) Other comprehensive income (208) (16) 162 Total shareholders' equity 19,864 19,539 19,600 Total liabilities and shareholders' equity $206,895 $195,104 $192,844 Page 28
- 29. Supplemental Analyst Schedules 3Q 2005
- 30. U.S. Bancorp Income Statement Highlights Financial Results and Ratios Percent Change Three Months Ended v. September 30, 2005 (Dollars and Shares in Millions, Except Per Share Data) September 30, June 30, September 30, June 30, September 30, (Unaudited) 2005 2005 2004 2005 2004 Net interest income (taxable-equivalent basis) $1,791 $1,761 $1,782 1.7 % .5 % Noninterest income 1,576 1,541 1,524 2.3 3.4 Total net revenue 3,367 3,302 3,306 2.0 1.8 Noninterest expense 1,473 1,595 1,518 (7.6) (3.0) Income before provision and income taxes 1,894 1,707 1,788 11.0 5.9 Provision for credit losses 145 144 166 .7 (12.7) Income before income taxes 1,749 1,563 1,622 11.9 7.8 Taxable-equivalent adjustment 9 7 7 28.6 28.6 Applicable income taxes 586 435 549 34.7 6.7 Net income $1,154 $1,121 $1,066 2.9 8.3 Diluted earnings per share $.62 $.60 $.56 3.3 10.7 Revenue per diluted share* $1.82 $1.78 $1.69 2.2 7.7 Financial Ratios Net interest margin** 3.95 % 3.99 % 4.22 % Interest yield on average loans** 6.38 6.21 5.86 Rate paid on interest-bearing liabilities 2.49 2.23 1.55 Return on average assets 2.23 2.23 2.21 Return on average equity 22.8 22.7 21.9 Efficiency ratio*** 43.8 48.3 47.2 Tangible efficiency ratio**** 40.0 42.8 40.6 * Computed as the sum of net interest income on a taxable-equivalent basis and noninterest income excluding securities gains (losses), net divided by average diluted common shares outstanding ** On a taxable-equivalent basis *** Computed as noninterest expense divided by the sum of net interest income on a taxable-equivalent basis and noninterest income excluding securities gains (losses), net **** Computed as noninterest expense divided by the sum of net interest income on a taxable-equivalent basis and noninterest income excluding securities gains (losses), net and intangible amortization Page 30
- 31. U.S. Bancorp Income Statement Highlights Financial Results and Ratios Nine Months Ended (Dollars and Shares in Millions, Except Per Share Data) September 30, September 30, Percent (Unaudited) 2005 2004 Change Net interest income (taxable-equivalent basis) $5,303 $5,340 (.7) % Noninterest income 4,499 4,084 10.2 Total net revenue 9,802 9,424 4.0 Noninterest expense 4,399 4,206 4.6 Income before provision and income taxes 5,403 5,218 3.5 Provision for credit losses 461 605 (23.8) Income before income taxes 4,942 4,613 7.1 Taxable-equivalent adjustment 23 21 9.5 Applicable income taxes 1,573 1,481 6.2 Net income $3,346 $3,111 7.6 Diluted earnings per share $1.80 $1.62 11.1 Revenue per diluted share* $5.29 $4.95 6.9 Financial Ratios Net interest margin** 4.00 % 4.26 % Interest yield on average loans** 6.23 5.86 Rate paid on interest-bearing liabilities 2.23 1.46 Return on average assets 2.22 2.18 Return on average equity 22.5 21.5 Efficiency ratio*** 44.6 44.2 Tangible efficiency ratio**** 40.8 40.1 * Computed as the sum of net interest income on a taxable-equivalent basis and noninterest income excluding securities gains (losses), net divided by average diluted common shares outstanding ** On a taxable-equivalent basis *** Computed as noninterest expense divided by the sum of net interest income on a taxable-equivalent basis and noninterest income excluding securities gains (losses), net **** Computed as noninterest expense divided by the sum of net interest income on a taxable-equivalent basis and noninterest income excluding securities gains (losses), net and intangible amortization Page 31
- 32. U.S. Bancorp Quarterly Consolidated Statement of Income Three Months Ended (Dollars and Shares in Millions, Except Per Share Data) September 30, June 30, March 31, December 31, September 30, (Unaudited) 2005 2005 2005 2004 2004 Interest Income Loans $2,167 $2,027 $1,911 $1,878 $1,803 Loans held for sale 30 24 21 23 21 Investment securities 492 486 476 461 453 Other interest income 29 28 27 27 26 Total interest income 2,718 2,565 2,435 2,389 2,303 Interest Expense Deposits 414 361 308 250 222 Short-term borrowings 205 143 112 80 74 Long-term debt 317 307 271 267 232 Total interest expense 936 811 691 597 528 Net interest income 1,782 1,754 1,744 1,792 1,775 Provision for credit losses 145 144 172 64 166 Net interest income after provision for credit losses 1,637 1,610 1,572 1,728 1,609 Noninterest Income Credit and debit card revenue 185 177 154 184 164 Corporate payment products revenue 135 120 107 101 108 ATM processing services 64 57 47 43 45 Merchant processing services 200 198 178 181 188 Trust and investment management fees 251 253 247 241 240 Deposit service charges 246 234 210 212 208 Treasury management fees 109 117 107 110 118 Commercial products revenue 103 100 96 108 106 Mortgage banking revenue 111 110 102 96 97 Investment products fees and commissions 37 39 39 37 37 Securities gains (losses), net 1 1 (59) (21) 88 Other 134 135 154 143 125 Total noninterest income 1,576 1,541 1,382 1,435 1,524 Noninterest Expense Compensation 603 612 567 579 564 Employee benefits 106 108 116 98 100 Net occupancy and equipment 162 159 154 163 159 Professional services 44 39 36 45 37 Marketing and business development 61 67 43 49 61 Technology and communications 118 113 106 116 110 Postage, printing and supplies 64 63 63 65 61 Other intangibles 125 181 71 161 210 Debt prepayment -- 54 -- 113 5 Other 190 199 175 190 211 Total noninterest expense 1,473 1,595 1,331 1,579 1,518 Income before income taxes 1,740 1,556 1,623 1,584 1,615 Applicable income taxes 586 435 552 528 549 Net income $1,154 $1,121 $1,071 $1,056 $1,066 Earnings per share $.63 $.61 $.58 $.57 $.57 Diluted earnings per share $.62 $.60 $.57 $.56 $.56 Dividends declared per share $.30 $.30 $.30 $.30 $.24 Average common shares outstanding 1,823 1,833 1,852 1,865 1,877 Average diluted common shares outstanding 1,849 1,857 1,880 1,894 1,904 Financial Ratios Net interest margin* 3.95 % 3.99 % 4.08 % 4.20 % 4.22 % Interest yield on average loans* 6.38 6.21 6.08 5.97 5.86 Rate paid on interest-bearing liabilities 2.49 2.23 1.97 1.72 1.55 Return on average assets 2.23 2.23 2.21 2.16 2.21 Return on average equity 22.8 22.7 21.9 21.2 21.9 Efficiency ratio** 43.8 48.3 41.7 48.5 47.2 Tangible efficiency ratio*** 40.0 42.8 39.5 43.6 40.6 * On a taxable-equivalent basis ** Computed as noninterest expense divided by the sum of net interest income on a taxable-equivalent basis and noninterest income excluding securities gains (losses), net *** Computed as noninterest expense divided by the sum of net interest income on a taxable-equivalent basis and noninterest income excluding securities gains (losses), net and intangible amortization Page 32