1. Nara Bancorp Reports First Quarter Financial Results
Company Release - 04/20/2009 17:28
LOS ANGELES--(BUSINESS WIRE)-- Nara Bancorp, Inc. (the quot;Companyquot;) (NASDAQ: NARA), the holding company of Nara Bank (the quot;Bankquot;) reported a net loss of $3.2 million, or ($0.16) per diluted share, for first quarter 2009,
compared to net income of $5.8 million, or $0.22 per diluted share, for first quarter 2008, and net loss of $9.9 million, or ($0.39) per diluted share, for fourth quarter 2008.
Min Kim, President and Chief Executive Officer, said, quot;As expected, we continued to see elevated levels of charge-offs and provision for loan losses, as the recessionary conditions are having a negative impact on both commercial
business and commercial real estate borrowers. We are aggressively managing our problem assets and have allocated increased resources to our credit administration department to help bring about satisfactory resolutions
more quickly. Despite the credit losses we have incurred, we continue to have strong capital levels and a substantial allowance for loan losses, which position us well to absorb any inherent losses without impairing the
fundamental health and soundness of the bank.
quot;Very positively, we increased our core deposits by $274 million during the first quarter, partially due to successful marketing programs targeting non-Korean-American customers. As a result, our loan-to-deposit ratio declined
significantly to under 100 percent at first quarter end. Not only are we very pleased with the substantial progress we have made to improve our liquidity, the growth in deposits provides the Company with much greater financial
flexibility going forward.
quot;While the current environment remains challenging, we are committed to investing in the business to enhance our position as a leader in the Korean-American banking industry. With the additions of Bonnie Lee as Chief
Operating Officer and Mark Lee as Chief Credit Officer, we have substantially strengthened the depth and quality of our management team, quot; said Ms. Kim.
Financial Highlights
2009 First Quarter 2008 First Quarter 2008 Fourth Quarter
(Dollars in thousands)
Net Income (Loss) $ (3,180 ) $ 5,773 $ (9,853 )
Diluted Earnings $ (0.16 ) $ 0.22 $ (0.39 )
(Loss) Per Share
Net interest income $ 20,421 $ 24,610 $ 22,702
Net interest margin 3.19 % 4.15 % 3.71 %
Non-interest income $ 4,383 $ 4,599 $ 2,058
Non-interest $ 15,248 $ 14,431 $ 13,747
expense
Net Loans $ 2,037,724 $ 2,050,735 $ 2,055,024
receivable
Deposits $ 2,098,312 $ 1,854,349 $ 1,938,603
Non-performing $ 41,337 $ 19,080 $ 37,580
loans
ALLL to total loans 2.42 % 1.11 % 2.07 %
ALLL to
non-performing 122 % 121 % 116 %
loans
Provision for loan $ 15,670 $ 4,993 $ 28,000
losses
Efficiency ratio 61.47 % 49.41 % 55.52 %
Operating Results for First Quarter 2009
Net Interest Income and Net Interest Margin. First quarter 2009 net interest income before provision for loan losses was $20.4 million, a decrease of 17% from first quarter 2008. The decline in net interest income was due to the
decline in net interest margin and a shift in asset allocation from loans to investment securities and liquid assets. The change in asset mix was part of a plan to improve liquidity and strengthen the balance sheet. First quarter 2009
net interest margin (net interest income divided by average interest-earning assets) decreased 96 basis points to 3.19% from 4.15% in the first quarter of 2008, due to the fed fund rate cuts by the Federal Reserve of 200 basis
points during the twelve months ended March 31, 2009.
The weighted average yield on the loan portfolio for first quarter 2009 decreased 184 basis points to 6.01% from 7.85% for the same period last year. The decrease was the result of the prime rate-based portion of the loan portfolio
repricing downward as market interest rates continued to decline due to further reductions in interest rates by the Federal Reserve throughout 2008. The prime rate decreased 200 basis points, consistent with the fed funds rate
cuts. This was partially mitigated by the 49% of fixed rate loans in the portfolio at March 31, 2009. At March 31, 2008, fixed rate loans were 55% of the loan portfolio. The weighted average yield on the variable rate and fixed rate
portfolios (excluding loan discount accretion) at March 31, 2009 was 4.52% and 7.63%, respectively, compared to 6.63% and 7.69% at March 31, 2008.
The weighted average yield on securities available for sale for first quarter 2009 decreased 94 basis points to 4.08% from 5.02% for the same period last year. The decrease was primarily due to variable rate agency CMO
investment securities repricing downward as one month LIBOR rates declined. The variable rate agency CMO portfolio was $96.4 million at March 31, 2009, compared to $78.9 million at March 31, 2008.
The weighted average cost of deposits for first quarter 2009 decreased 101 basis points to 2.42% from 3.43% for the same period last year. The cost of time deposits decreased 175 basis points to 2.81% from 4.56%. Due to the
lag in repricing deposits, the year over year decline in loan yield exceeded the year over year decline in the cost of deposits by 83 basis points during first quarter 2009.
The weighted average cost of FHLB advances for first quarter 2009 decreased 26 basis points to 3.51% from 3.77% for first quarter 2008, reflecting the decline in market interest rates for short-term advances.
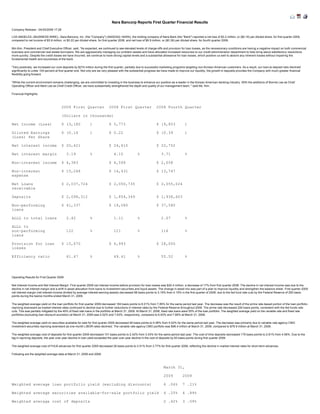
Following are the weighted average data at March 31, 2009 and 2008:
March 31,
2009 2008
Weighted average loan portfolio yield (excluding discounts) 6 .06% 7 .21%
Weighted average securities available-for-sale portfolio yield 4 .25% 4 .89%
Weighted average cost of deposits 2 .42% 3 .09%
2. Weighted average cost of total interest-bearing deposits 2 .83% 3 .82%
Weighted average cost of FHLB advances 3 .70% 3 .62%
Sequentially, first quarter 2009 net interest income before provision for loan losses decreased $2.3 million, or 10%, from fourth quarter 2008. The decrease was attributable to a decline in net interest margin resulting from the
repricing of quarterly adjusting variable rate loans, after the 175 basis points in rate cuts by the Federal Reserve during the fourth quarter of 2008. The net interest margin decreased 52 basis points to 3.19% for first quarter 2009
from 3.71% for fourth quarter 2008. In addition, the build up of short-term liquidity, supported by the growth in core deposits affected both the net interest margin as well as net interest income.
Non-accrual loan interest income recognized or (reversed) was ($394) thousand, $159 thousand, and ($283) thousand for first quarter 2009, first quarter 2008, and fourth quarter 2008, respectively. Excluding this effect, the net
interest margin for first quarter 2009, first quarter 2008, and fourth quarter 2008 was 3.26%, 4.12% and 3.75%, respectively.
Prepayment penalty income for first quarter 2009, first quarter 2008 and fourth quarter 2008 was $147 thousand, $221 thousand and $433 thousand, respectively. Excluding the effects of both non-accrual loan interest income and
prepayment penalty income, the net interest margin for first quarter 2009, first quarter 2008 and fourth quarter 2008 was 3.23%, 4.09% and 3.68%, respectively.
Non-interest Income. First quarter 2009 non-interest income was $4.4 million, a decrease of $216 thousand, or 5% compared to first quarter 2008. The decrease is due to a decline in net gains on sales of SBA and other loans and
losses on sales of OREO, offset by an increase in net gains on sales of securities available-for-sale.
Net gains on sales of SBA and other loans were $450 thousand for first quarter 2009, a decrease of 44% from $800 thousand for first quarter 2008. Included in the results for first quarter 2009 was a net gain of $387 thousand
recognized from the sale of a non-SBA problem loan that had been written down during fourth quarter 2008 and $63 thousand due to loan discounts recognized on loans that were paid off. During first quarter 2008, the Company
had net gains of $715 thousand on the sales of SBA loans, and net gains of $85 thousand from the sale of other loans.
There were no sales of SBA loans during first quarter 2009 compared to $24.4 million during first quarter 2008.
Net gains on sales of securities available-for-sale were $785 thousand for first quarter 2009, an increase of 68% from $467 thousand for first quarter 2008. During first quarter 2009, a total of $43 million in available-for-sale MBS
securities were sold, compared to $54 million during first quarter 2008. The securities sold during the quarter had faster prepayment characteristics, and the proceeds were reinvested into securities with slower prepayment
characteristics.
Sequentially, non-interest income increased 113% from fourth quarter 2008. The increase was primarily due to the net gains recognized from the sale of a non-SBA problem loan and securities available-for-sale as discussed
above, as well as a decrease in the loss recognized from the mark-to-market valuation adjustment on interest rate swaps. Net losses recognized from the mark-to-market valuation adjustment and amortization on interest rate
swaps was $117 thousand during first quarter 2009, compared to $800 thousand during fourth quarter 2008.
Non-interest Expense. First quarter 2009 non-interest expense was $15.2 million, an increase of 6% from $14.4 million for the same period last year. Salaries and employee benefits expense decreased by 16% over the same
quarter of the prior year, primarily due to decreases in bonus expense and in the number of full-time equivalent employees to 367 at March 31, 2009 from 409 at March 31, 2008.
Occupancy expense increased by 12% due to higher depreciation and amortization costs for the new branches opened in 2008. Professional fees increased by 27% over the same quarter of the prior year, primarily due to higher
legal fees.
Other non-interest expense increased 81% to $3.6 million for first quarter 2009, compared to $2.0 million for the same period last year. The increase is primarily due to a 143% increase in FDIC insurance premiums to $750
thousand for first quarter 2009, and credit related expenses of $1.5 million, which included expenses related to OREO.
Sequentially, non-interest expense for first quarter 2009 increased by 11% from $13.7 million in fourth quarter 2008, due to increased credit related expenses, including an allowance for doubtful SBA receivables, and legal fees,
offset by lower compensation costs.
Income Taxes. The effective income tax benefit was 48% for first quarter 2009 compared to the effective income tax rate of 41% for first quarter 2008 and tax benefit of 42% for fourth quarter 2008. The higher tax benefit of 48% for the
first quarter 2009 was due to higher tax credits in that period.
Balance Sheet Summary
At March 31, 2009, total assets were $2.83 billion, an increase of 23% (annualized) from $2.67 billion at December 31, 2008, and an increase of 11% from $2.55 billion at March 31, 2008. The increases in liquid assets and
investments accounted for the asset increases.
Gross loans receivable were $2.09 billion at March 31, 2009, a slight decrease from $2.10 billion at December 31, 2008. Loan growth was impacted by management's strategy to reduce the loan to deposit ratio as well as to stricter
loan underwriting criteria. New loan production was $62.8 million during first quarter 2009, compared to $81.3 million during fourth quarter 2008 and $176.4 million during the first quarter 2008. Loan pay-offs, paydowns,
amortization and other changes totaled $73.1 million during first quarter 2009, compared to $80.2 million during fourth quarter 2008 and $84.0 million during first quarter 2008.
SBA loan originations were $570 thousand during first quarter 2009 compared to $8.0 million during fourth quarter 2008 and $21.4 million during first quarter 2008. There were no sales of SBA loans during first quarter 2009 and
fourth quarter 2008, compared to $24.4 million of SBA loan sales during first quarter 2008.
Total deposits were $2.10 billion at March 31, 2009, an increase of 33.0% (annualized) from $1.94 billion at December 31, 2008 and a 13% increase from $1.85 billion at March 31, 2008. During first quarter 2009, core deposits
increased $274 million, which was offset by a $78 million decrease in brokered deposits and a $36 million decrease in retail jumbo CDs. The growth in core deposits was the result of successful marketing to non-Korean
customers.
FHLB advances were $350.0 million at both March 31, 2009 and December 31, 2008 and $393.0 million at March 31, 2008. Advances are primarily long-term advances with an expected average remaining term to maturity of 3.2
years.
Provision and Allowance for Loan Losses
The Company recorded a provision for loan losses of $15.7 million in first quarter 2009, compared to $5.0 million for the same period of the prior year and $28.0 million in fourth quarter 2008. Although net charge-offs for first
quarter 2009 declined to $8.6 million from $12.5 million for fourth quarter 2008, an increase in impaired loans, additional loan downgrades and higher loss migration factors resulted in an increase in the allowance for loan losses.
Total watch list loans, defined as special mention and classified assets, increased to $174.1 million at March 31, 2009, from $136.7 million at December 31, 2008. Special mention loans decreased to $68.4 million at March 31,
2009, from $71.2 million at December 31, 2008. Substandard loans increased to $98.4 million at March 31, 2009, from $55.6 million at December 31, 2008.
Non-performing loans at March 31, 2009 were $41.3 million, or 1.98% of total loans, compared to $37.6 million, or 1.79% of total loans at December 31, 2008. Inflows to non-performing loans during first quarter 2009 included eight
loans totaling approximately $8.0 million.
Non-performing assets at March 31, 2009 were $77.3 million, or 2.74% of total assets, compared to $43.8 million, or 1.64% of total assets at December 31, 2008. The increase was due to higher levels of accruing troubled debt
restructurings and other real estate owned.
Net loan charge-offs during first quarter 2009 were $8.6 million, or 1.63% of average loans on an annualized basis, compared to $12.4 million, or 2.37% of average loans on an annualized basis, during fourth quarter 2008. First
quarter 2009 charge-offs included partial charge-offs, aggregating $4.1 million, on three loans.
The remaining $4.5 million of charge-offs in first quarter 2009 primarily consisted of loans to retail businesses and consumer auto loans, averaging approximately $64 thousand per loan.
The allowance for loan losses at March 31, 2009 was $50.5 million, or 2.42% of gross loans receivable, compared to $43.4 million, or 2.07% of gross loan receivable at December 31, 2008. The allowance for loan losses to non-
performing loans was 122% and 116% at March 31, 2009 and December 31, 2008, respectively. The allowance for loan losses reflects an increase in specific allowances for impaired loans, as well as general allowances, based
on quantitative and qualitative factors.
Impaired loans at March 31, 2009 were $82.9 million, compared to $50.3 million at December 31, 2008. The increase during the quarter included 4 loans aggregating $21.3 million. Specific reserves for impaired loans were $20.9
million, or 25.2% of the aggregate gross loan amount at March 31, 2009. Excluding specific allowances for impaired loans, the allowance coverage on non-impaired loans was 1.49%, compared to 1.41% at December 31, 2008.
Capital
At March 31, 2009, the Company continued to exceed the regulatory capital requirements to be classified as a quot;well-capitalized institution.quot; The Leverage Ratio was 11.94% at March 31, 2009 compared to 12.61% at December 31,
2008 and 10.56% at March 31, 2008. The Tier 1 Risk-based Ratio was 14.03% at March 31, 2009, compared to 14.32% at December 31, 2008 and 11.56% at March 31, 2008. The Total Risk-based Ratio was 15.30% at March 31,
2009, compared to 15.58% at December 31, 2008 and 12.59% at March 31, 2008.
At March 31, 2009, tangible common equity was 7.74% of tangible assets, slightly lower compared to December 31, 2008 due to a 6% increase in assets. Despite the net loss for the quarter, tangible common equity remained at a
3. high level due to the $3.2 million increase in the fair value of securities available-for-sale, net of tax, which is part of Other Comprehensive Income in stockholders' equity.
Outlook
Commenting on the outlook for the remainder of 2009, Ms. Kim said, quot;Although we expect that credit costs will remain elevated in the near-term, we believe we have positioned the Bank to generate improvements in pre-provision
earnings going forward. With the improved financial flexibility in our balance sheet, we intend to increase our loan production and fund this growth with core deposits. For the full year, we are targeting 5% loan growth. During the
second half of the year, we also expect an increase in our net interest margin, as deposits reprice lower and we see improvements in loan pricing.
quot;As mentioned before, we strengthened our senior management team with two highly regarded veterans of the banking industry. We believe these investments in top quality executives, as well as our commitment to providing top
quality service to our customers, will position Nara Bancorp for sustained growth and profitability as economic conditions improve,quot; said Ms. Kim.
Conference Call and Webcast
A conference call with simultaneous webcast to discuss the Company's first quarter 2009 financial results will be held tomorrow, April 21, 2009 at 9:30 a.m. Pacific / 12:30 p.m. Eastern. Interested participants and investors may
access the conference call by dialing 800-762-8779 (domestic) or 480-248-5081 (international). There will also be a live webcast of the call available at the Investor Relations section of Nara Bank's web site at www.narabank.com.
After the live webcast, a replay will remain available in the Investor Relations section of Nara Bancorp's web site. A replay of the call will be available at 800-406-7325 (domestic) or 303-590-3030 (international) through April 28,
2009; the passcode is 4055954.
About Nara Bancorp, Inc.
Nara Bancorp, Inc. is the parent company of Nara Bank, which was founded in 1989. Nara Bank is a full-service community bank headquartered in Los Angeles, with 21 branches and 4 loan production offices in the United States.
Nara Bank operates full-service branches in California, New York and New Jersey, with loan production offices in California, Nevada, Texas, Georgia, New Jersey, and Virginia. Nara Bank was founded specifically to serve the
needs of Korean-Americans, one of the fastest-growing Asian ethnic communities over the past decade. Presently, Nara Bank serves a diverse group of customers mirroring its communities. Nara Bank specializes in core
business banking products for small and medium-sized companies, with emphasis in commercial real estate and business lending, SBA lending and international trade financing. Nara Bank is a member of the FDIC and is an
Equal Opportunity Lender. For more information on Nara Bank, visit our website at www.narabank.com. Nara Bancorp, Inc. stock is listed on NASDAQ under the symbol quot;NARA.quot;
Forward-Looking Statements
This press release contains forward-looking statements including statements about future operations and projected full-year financial results that are subject to risks and uncertainties that could cause actual results to differ
materially from those expressed or implied by such forward looking statements, including, but not limited to economic, competitive, governmental and technological factors affecting the Company's operations, markets, products,
services, and pricing. Readers should carefully review the risk factors and the information that could materially affect the Company's financial results and business, described in documents the Company files from time to time with
the Securities and Exchange Commission, including its quarterly reports on Form 10-Q and Annual Reports on Form 10-K, and particularly the discussion of business considerations and certain factors that may affect results of
operations and stock price set forth therein. Readers are cautioned not to place undue reliance on these forward-looking statements, which speak only as of the date of this press release. The Company undertakes no obligation to
revise or publicly release the results of any revision to these forward-looking statements.
Nara Bancorp, Inc.
Consolidated Statements of Financial Condition
Unaudited (Dollars in Thousands)
Nara Bancorp, Inc.
Assets 3/31/2009 12/31/2008 % 3/31/2008 %
change change
Cash and due $ 44,705 $ 30,057 49 % $ 41,353 8 %
from banks
Federal funds 150,000 19,000 689 % 21,000 614 %
sold
Securities
available for 430,219 406,586 6 % 273,779 57 %
sale, at fair
value
Federal Home
Loan Bank and
Federal 22,255 22,255 0 % 26,419 -16 %
Reserve Bank
stock
Loans held
for sale, at
the lower of 10,965 9,821 12 % 7,571 45 %
cost or
market
Loans 2,088,228 2,098,443 0 % 2,073,851 1 %
receivable
Allowance for (50,504 ) (43,419 ) 16 % (23,116 ) 118 %
loan losses
Net loans 2,037,724 2,055,024 -1 % 2,050,735 -1 %
receivable
Accrued
interest 8,276 8,168 1 % 9,014 -8 %
receivable
Premises and
equipment, 11,749 11,987 -2 % 11,293 4 %
net
Bank owned
life 23,402 23,349 0 % 23,096 1 %
insurance
Goodwill 2,509 2,509 0 % 2,509 0 %
Other
intangible 1,474 1,627 -9 % 2,132 -31 %
4. assets, net
Other assets 82,259 81,671 1 % 77,212 7 %
Total assets $ 2,825,537 $ 2,672,054 6 % $ 2,546,113 11 %
Liabilities
Deposits $ 2,098,312 $ 1,938,603 8 % $ 1,854,349 13 %
Borrowings
from Federal 350,000 350,000 0 % 393,000 -11 %
Home Loan
Bank
Subordinated 39,268 39,268 0 % 39,268 0 %
debentures
Accrued
interest 9,273 8,549 8 % 10,182 -9 %
payable
Other 38,999 45,681 -15 % 21,920 78 %
liabilities
Total 2,535,852 2,382,101 6 % 2,318,719 9 %
liabilities
Stockholders'
Equity
Preferred
stock, $0.001
par value;
authorized
10,000,000
undesignated
shares;
issued and
outstanding
67,000,
67,000 and 0
shares of
Fixed Rate
Cumulative
Perpetual 67,000 67,000 0 % - 100 %
Preferred
Stock, Series
A with a
liquidation
preference of
$1,000 per
share at
March 31,
2009,
December 31,
2008 and
March 31,
2008,
respectively
Preferred
stock (4,434 ) (4,664 ) -5 % - 100 %
discount
Common stock,
$0.001 par
value;
authorized,
40,000,000
shares;
issued and
outstanding,
26,256,960,
26,246,560, 26 26 0 % 26 0 %
and
26,193,560
shares at
March 31,
2009,
December 31,
2008 and
March 31,
2008,
respectively
Common stock 4,766 4,766 0 % - 100 %
warrant
Capital 82,669 82,077 1 % 80,567 3 %
surplus
5. Retained 137,643 141,890 -3 % 147,544 -7 %
earnings
Accumulated
other
comprehensive 2,015 (1,142 ) -276 % (743 ) -371 %
income
(loss), net
Total
stockholders' 289,685 289,953 0 % 227,394 27 %
equity
Total
liabilities
and $ 2,825,537 $ 2,672,054 6 % $ 2,546,113 11 %
stockholders'
equity
Nara Bancorp, Inc.
Consolidated Statements of Income (Loss)
Unaudited (Dollars in Thousands, Except for Per Share Data)
Three Months Ended,
3/31/2009 3/31/2008 % 12/31/2008 %
change change
Interest income:
Interest and fees $ 31,672 $ 40,364 -22 % $ 35,308 -10 %
on loans
Interest on 4,320 3,668 18 % 3,819 13 %
securities
Interest on
federal funds sold 49 328 -85 % (36 ) -236 %
and other
investments
Total interest 36,041 44,360 -19 % 39,091 -8 %
income
Interest expense:
Interest on 11,825 15,206 -22 % 12,347 -4 %
deposits
Interest on other 3,795 4,544 -16 % 4,042 -6 %
borrowings
Total interest 15,620 19,750 -21 % 16,389 -5 %
expense
Net interest
income before 20,421 24,610 -17 % 22,702 -10 %
provision for loan
losses
Provision for loan 15,670 4,993 214 % 28,000 -44 %
losses
Net interest
(expense) income 4,751 19,617 -76 % (5,298 ) -190 %
after provision
for loan losses
Non-interest
income:
Service fees on 1,769 1,821 -3 % 1,940 -9 %
deposit accounts
Net gains on sales
of SBA and other 450 800 -44 % 87 417 %
loans
Net gains on sales
of securities 785 467 68 % - 0 %
available-for-sale
Net losses on (130 ) - 100 % (1,003 ) 100 %
sales of OREO
Other income and 1,509 1,511 0 % 1,034 46 %
6. fees
Total non-interest 4,383 4,599 -5 % 2,058 113 %
income
Non-interest
expense:
Salaries and 6,443 7,636 -16 % 6,840 -6 %
employee benefits
Occupancy 2,426 2,163 12 % 2,469 -2 %
Furniture and 695 709 -2 % 691 1 %
equipment
Advertising and 457 550 -17 % 360 27 %
marketing
Data processing 901 830 9 % 794 13 %
and communications
Professional fees 678 532 27 % 380 78 %
Other 3,648 2,011 81 % 2,213 65 %
Total non-interest 15,248 14,431 6 % 13,747 11 %
expense
Income (loss)
before income (6,114 ) 9,785 -162 % (16,987 ) -64 %
taxes
Income tax
provision (2,934 ) 4,012 -173 % (7,134 ) -59 %
(benefit)
Net income (loss) $ (3,180 ) $ 5,773 -155 % $ (9,853 ) -68 %
Dividends and
discount accretion $ (1,068 ) $- 100 % $ (474 ) 100 %
on preferred stock
Net income (loss)
available to $ (4,248 ) $ 5,773 -174 % $ (10,327 ) -59 %
common
stockholders
Earnings (Loss)
Per Common Share:
Basic $ (0.16 ) $ 0.22 $ (0.39 )
Diluted $ (0.16 ) $ 0.22 $ (0.39 )
Average Shares
Outstanding
Basic 26,250,258 26,193,672 26,213,085
Diluted 26,250,258 26,400,802 26,213,085
Nara Bancorp, Inc.
Supplemental Data
Unaudited (Dollars in Thousands, Except for Per Share Data)
(Annualized)
At or for the Three Months Ended,
Profitability measures: 3/31/2009 3/31/2008 12/31/2008
ROA -0 .47% 0 .93% -1 .54%
ROE -4 .36% 10 .15% -15 .06%
Net interest margin 3 .19% 4 .15% 3 .71%
Efficiency ratio 61 .47% 49 .41% 55 .52%
7. Three Months Ended Three Months Ended Three Months Ended
3/31/2009 3/31/2008 12/31/2008
Interest Annualized Interest Annualized Interest Annualized
Average Income/ Average Average Income/ Average Average Income/ Average
Balance Expense Yield/Cost Balance Expense Yield/Cost Balance Expense Yield/Cost
(Dollars in thousands) (Dollars in thousands) (Dollars in thousands)
INTEREST EARNING
ASSETS:
Gross loans,
includes loans $ 2,107,685 $ 31,672 6.01 % $ 2,055,535 $ 40,364 7.85 % $ 2,092,641 $ 35,308 6.75 %
held for sale
Securities
available for 423,907 4,320 4.08 % 292,283 3,668 5.02 % 328,601 3,819 4.65 %
sale
FRB and FHLB
stock and other 22,880 48 0.84 % 22,940 316 5.51 % 22,705 (46 ) -0.81 %
investments
Federal funds 2,267 1 0.18 % 1,506 12 3.19 % 5,528 10 0.72 %
sold
Total interest $ 2,556,739 $ 36,041 5.64 % $ 2,372,264 $ 44,360 7.48 % $ 2,449,475 $ 39,091 6.38 %
earning assets
INTEREST BEARING
LIABILITIES:
Deposits:
Demand, $ 331,870 $ 2,265 2.73 % $ 246,120 $ 1,912 3.11 % $ 319,318 $ 2,413 3.02 %
interest-bearing
Savings 111,233 1,008 3.62 % 136,596 1,308 3.83 % 115,245 1,043 3.62 %
Time deposits:
$100,000 or more 579,333 3,544 2.45 % 606,746 7,515 4.95 % 661,172 4,844 2.93 %
Other 637,226 5,008 3.14 % 443,570 4,471 4.03 % 465,236 4,047 3.48 %
Total time 1,216,559 8,552 2.81 % 1,050,316 11,986 4.56 % 1,126,408 8,891 3.16 %
deposits
Total interest 1,659,662 11,825 2.85 % 1,433,032 15,206 4.24 % 1,560,971 12,347 3.16 %
bearing deposits
FHLB advances 368,584 3,237 3.51 % 401,148 3,783 3.77 % 371,038 3,385 3.65 %
Other borrowings 39,734 558 5.62 % 37,618 761 8.09 % 39,268 657 6.69 %
Total interest
bearing 2,067,980 $ 15,620 3.02 % 1,871,798 $ 19,750 4.22 % 1,971,277 $ 16,389 3.33 %
liabilities
Non-interest
bearing demand 291,324 338,043 240,142
deposits
Total funding
liabilities / $ 2,359,304 2.65 % $ 2,209,841 3.57 % $ 2,211,419 2.96 %
cost of funds
Net interest
income / net $ 20,421 2.62 % $ 24,610 3.26 % $ 22,702 3.05 %
interest spread
Net interest 3.19 % 4.15 % 3.71 %
margin
Net interest
margin,
excluding effect 3.26 % 4.12 % 3.75 %
of non-accrual
loan income
(expense)
Net interest
margin,
excluding effect
of non-accrual 3.23 % 4.09 % 3.68 %
loan income
(expense) and
11. Source: Nara Bancorp, Inc.
Contact: Investors and Financial Media: Financial Relations Board Tony Rossi, 213-486-6545
Click here for Printer-Friendly Version