SlideShare a Scribd company logo
1 of 1
Walmart (Sam’s Club)         Costco

  • 102,000 employees         • 68,000 employees

  • Annual turnover rate      • Annual turnover rate
    of 21%                      of 6%

  • Replacement cost is       • Same replacement
    1.5 to 2.5 X salary         cost

  • $755/yr per employee      • $300/yr per employee
    to cover costs of           to cover costs of
    turnover                    turnover

  • 47% covered by            • 82% covered by
    healthcare ins.             healthcare ins.

  • $35 billion in revenue    • $34 billion in revenue
    from 102,000                from 68,000
    employees                   employees

  • When productivity is      • When productivity is
    included, labor rates       included, labor rates
    are 17%                     are 9.8%

  • Low price/low service     • Lower price and high
    strategy                    service strategy

From Cascio (2004) &
Business Week

More Related Content

Similar to Walmart costco

07 production costs
07 production costs07 production costs
07 production costs
NepDevWiki
 
Leveling Up - Five Real World Examples of Incremental Maturity v0.1b
Leveling Up - Five Real World Examples of Incremental Maturity v0.1bLeveling Up - Five Real World Examples of Incremental Maturity v0.1b
Leveling Up - Five Real World Examples of Incremental Maturity v0.1b
The Project Strategy Consulting Group
 

Similar to Walmart costco (20)

Organizing for Effective Management: TJX
Organizing for Effective Management: TJXOrganizing for Effective Management: TJX
Organizing for Effective Management: TJX
 
Winning the Budget Game: How to Get the Money You Need for IT Every Time
Winning the Budget Game: How to Get the Money You Need for IT Every TimeWinning the Budget Game: How to Get the Money You Need for IT Every Time
Winning the Budget Game: How to Get the Money You Need for IT Every Time
 
07 production costs
07 production costs07 production costs
07 production costs
 
Business Plan Preparation - X-Lint
Business Plan Preparation - X-LintBusiness Plan Preparation - X-Lint
Business Plan Preparation - X-Lint
 
Final ppt acct 2302 project (revised)
Final ppt acct 2302 project (revised)Final ppt acct 2302 project (revised)
Final ppt acct 2302 project (revised)
 
STR 581 Capstone Final Examination Part 2 @Assignment E Help
STR 581 Capstone Final Examination Part 2 @Assignment E HelpSTR 581 Capstone Final Examination Part 2 @Assignment E Help
STR 581 Capstone Final Examination Part 2 @Assignment E Help
 
Capital structure theories
Capital structure theoriesCapital structure theories
Capital structure theories
 
CBA.pptx
CBA.pptxCBA.pptx
CBA.pptx
 
Capital structure.pptx
Capital structure.pptxCapital structure.pptx
Capital structure.pptx
 
Leveling up: Five real world examples of incremental maturity
Leveling up: Five real world examples of incremental maturityLeveling up: Five real world examples of incremental maturity
Leveling up: Five real world examples of incremental maturity
 
Leveling Up - Five Real World Examples of Incremental Maturity v0.1b
Leveling Up - Five Real World Examples of Incremental Maturity v0.1bLeveling Up - Five Real World Examples of Incremental Maturity v0.1b
Leveling Up - Five Real World Examples of Incremental Maturity v0.1b
 
Ibkr
IbkrIbkr
Ibkr
 
UWAC2016
UWAC2016UWAC2016
UWAC2016
 
MSP Pricing Tips | Determining Optimal Margins for IT Managed Services
MSP Pricing Tips | Determining Optimal Margins for IT Managed ServicesMSP Pricing Tips | Determining Optimal Margins for IT Managed Services
MSP Pricing Tips | Determining Optimal Margins for IT Managed Services
 
Process Improvement Presentation V1
Process Improvement Presentation V1Process Improvement Presentation V1
Process Improvement Presentation V1
 
High Performance Microfinance SAM 2015 - Plenary Session Day 2
High Performance Microfinance SAM 2015 - Plenary Session Day 2High Performance Microfinance SAM 2015 - Plenary Session Day 2
High Performance Microfinance SAM 2015 - Plenary Session Day 2
 
Cost of Capital , Cost of equity, Cost of Debentures, Cost of Preference Shares
Cost of Capital , Cost of equity, Cost of Debentures, Cost of Preference SharesCost of Capital , Cost of equity, Cost of Debentures, Cost of Preference Shares
Cost of Capital , Cost of equity, Cost of Debentures, Cost of Preference Shares
 
Production and costs
Production and costsProduction and costs
Production and costs
 
Cost curves
Cost curvesCost curves
Cost curves
 
COST-VOLUME-PROFIT (CVP) analysis
COST-VOLUME-PROFIT (CVP) analysis COST-VOLUME-PROFIT (CVP) analysis
COST-VOLUME-PROFIT (CVP) analysis
 

Walmart costco

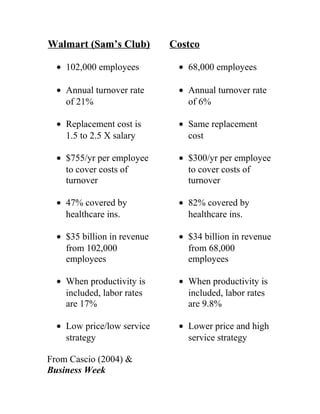
  • 1. Walmart (Sam’s Club) Costco • 102,000 employees • 68,000 employees • Annual turnover rate • Annual turnover rate of 21% of 6% • Replacement cost is • Same replacement 1.5 to 2.5 X salary cost • $755/yr per employee • $300/yr per employee to cover costs of to cover costs of turnover turnover • 47% covered by • 82% covered by healthcare ins. healthcare ins. • $35 billion in revenue • $34 billion in revenue from 102,000 from 68,000 employees employees • When productivity is • When productivity is included, labor rates included, labor rates are 17% are 9.8% • Low price/low service • Lower price and high strategy service strategy From Cascio (2004) & Business Week