2. Breastfeeding Rates in the United States by Characteristics of the Child,
Mother, or Family: The 2002 National Immunization Survey
Ruowei Li, MD, PhD*; Natalie Darling, MPH‡; Emmanuel Maurice, MS, MA‡; Lawrence Barker, PhD‡;
and Laurence M. Grummer-Strawn, PhD*
W
ABSTRACT. Objective. In the third quarter of 2001, orldwide, breastfeeding is recognized as
the National Immunization Survey (NIS) began collect- beneficial for both infants and mothers.1–3
ing data on the initiation and duration of breastfeeding In addition, the American Academy of Pe-
and whether it was the exclusive method of infant feed- diatrics (AAP) has stated that human milk is the
ing. Using the data from the 2002 NIS, this study esti- preferred feeding for all infants including premature
mates breastfeeding rates in the United States by charac-
teristics of the child, mother, or family.
and sick newborns, with rare exceptions.1 In the
Methods. The NIS uses random-digit dialing to sur- United States, the goals of Healthy People 20104 are to
vey households nationwide with children 19 to 35 increase the proportion of mothers who breastfeed
months old about vaccinations and then validates the their infants to 75% in the early postpartum period,
information through a mail survey of the health care 50% 6 months postpartum, and 25% 1 year postpar-
providers who gave the vaccinations. In 2002, 3500 tum.
households from the NIS were randomized to 1 of the 3 Although several national surveys collect breast-
rotating topical modules that covered breastfeeding. feeding data, including the National Health and Nu-
Results. More than two thirds (71.4%) of the children trition Examination Survey and the National Survey
had ever been breastfed. At 3 months, 42.5% of infants of Family Growth, none are ideal for breastfeeding
were exclusively breastfed, and 51.5% were breastfed to
some extent. At 6 months, these rates dropped to 13.3%
surveillance, and none monitor rates of breastfeeding
and 35.1%, respectively. At 1 year, 16.1% of infants were annually.5 Accordingly, the goals on breastfeeding in
receiving some breast milk. Non-Hispanic black children Healthy People 2010 were established and have been
had the lowest breastfeeding rates. Breastfeeding rates tracked with data collected by Ross Products Divi-
also varied by participation in day care or the Women, sion of Abbott Laboratories (Abbott Park, IL), man-
Infants, and Children program, socioeconomic status, ufacturers of infant formula.4 To date, most of the
and geographic area of residence. statistics quoted for the national breastfeeding rates
Conclusions. Although the rate of breastfeeding ini- have been derived from the Ross Laboratories Moth-
tiation in the United States is near the national goal of ers Surveys, in which questionnaires are mailed to a
75%, at 6 and 12 months postpartum the rates of breast-
large sample of mothers who gave birth within the 12
feeding duration are still considerably below the na-
tional goals of 50% and 25%, respectively. In addition, months before the survey. Although the survey has
rates of exclusive breastfeeding are low. Strenuous pub- been a valuable resource for establishing national
lic health efforts are needed to improve breastfeeding goals and monitoring infant-feeding trends in the
behaviors, particularly among non-Hispanic black United States over the past 2 decades, it has a rela-
women and socioeconomically disadvantaged groups. tively low response rate (28%) and has no data on the
Pediatrics 2005;115:e31–e37. URL: www.pediatrics.org/ introduction of any foods and liquids other than
cgi/doi/10.1542/peds.2004-0481; breastfeeding, National breast milk to estimate the exclusivity of breastfeed-
Immunization Survey, surveillance, statistics. ing.6
Appropriate monitoring of the goals and objec-
ABBREVIATIONS. AAP, American Academy of Pediatrics; NIS, tives in Healthy People 2010 is a high priority for the
National Immunization Survey; WIC, Special Supplemental Nu- US Department of Health and Human Services. In
trition Program for Women, Infants, and Children; CI, confidence response to requests from the United States Breast-
interval.
feeding Committee, in November 1999 the Centers
for Disease Control and Prevention held a meeting
on breastfeeding surveillance to review current
From the *Division of Nutrition and Physical Activity and ‡Data Manage- methodologies for assessing this practice.5 Attendees
ment Division, National Center for Chronic Disease Prevention and Health recommended using existing surveillance systems to
Promotion and the National Immunization Program, Centers for Disease immediately improve data collection. As a result,
Control and Prevention, Atlanta, Georgia.
Accepted for publication Aug 26, 2004.
beginning in the third quarter of 2001, 3 questions on
doi:10.1542/peds.2004-0481 breastfeeding were added to the rotating modules of
No conflict of interest declared. the National Immunization Survey (NIS). An overall
Reprint requests to (R.L.) Division of Nutrition and Physical Activity, MS report using the data from this initial quarter has
K-25, Centers for Disease Control and Prevention, 4770 Buford Hwy NE,
Atlanta, GA 30341-3717. E-mail: ril6@cdc.gov
been published, but stratified analyses were not in-
PEDIATRICS (ISSN 0031 4005). Published in the public domain by the cluded because the samples were too small.7 To fur-
American Academy of Pediatrics. ther explore the rates of breastfeeding in the United
www.pediatrics.org/cgi/doi/10.1542/peds.2004-0481 PEDIATRICS Vol. 115 No. 1 January 2005 e31
Downloaded from www.pediatrics.org by on June 2, 2009
3. States by characteristics of the child, mother, and tainty was expressed through 95% confidence intervals (CIs). We
family, we conducted a stratified analysis using com- estimated the statistical difference between 2 levels within each
stratum by using t tests computed in SUDAAN.
bined data from 4 consecutive quarters of the 2002
NIS. RESULTS
The current study included 3444 children with
METHODS complete information on ever breastfeeding, 3439 on
The NIS is conducted annually by the Centers for Disease breastfeeding duration, and 3376 on age at introduc-
Control and Prevention to obtain national, state, and selected tion of something other than breast milk and water.
urban-area estimates of vaccination coverage rates for US chil- Overall, 71.4% of children had ever been breastfed
dren. The NIS uses random-digit dialing to survey households (Table 1). The percentage who continued breastfeed-
with children 19 to 35 months old. After the telephone survey, a
ing to any extent at 6 and 12 months was 35.1% and
mail survey is sent to the health care providers who gave the
vaccinations to validate the information on immunization. Details 16.1%, respectively (Table 2). Although 63.4% of chil-
of the design and methodology are given elsewhere.8,9 dren were exclusively breastfed at 7 days, this figure
In addition to immunization data, the NIS collects socioeco- dropped to 42.5% at 3 months and 13.3% at 6 months
nomic and demographic data about the child, mother, and family. (Table 3).
Respondents are asked to identify the child’s race/ethnicity and
report what type of child care they used at 6 months old. In this
The bivariate analyses (Tables 1–3) revealed signif-
analysis, we classified race/ethnicity as non-Hispanic white, non- icant differences relating to race/ethnicity, day care,
Hispanic black, Hispanic, or other. Attendance at child care was and WIC participation, maternal age, socioeconomic
classified as “yes” vs “no,” with “yes” including nursery, pre-
school, a Head Start program, home day care, day care center, or
care by someone other than the parents. The area in which the
child lived was defined by the US Census Bureau’s definition, and TABLE 1. Proportion of Children Who Were Ever Breastfed
the poverty-income ratio was calculated as the ratio of self-re- (Percent Half 95% CI) by Sociodemographic Characteristics
ported family annual income to the appropriate poverty-threshold Characteristic Sample Ever
value used by the US Census Bureau. Ratios 100% indicate that Size Breastfed, %
the income for the respective family was below the official defi-
nition of poverty, whereas a ratio of 100% indicates income at or US national 3444 71.4 2.3
above the poverty level. To evaluate the child’s participation in the Gender
Special Supplemental Nutrition Program for Women, Infants, and Male 1770 70.4 3.3
Children (WIC), respondents were asked “Did [child’s name] ever Female (ref) 1674 72.5 3.2
receive WIC benefits between birth and [his/her] first birthday?” Birth order
To compare WIC participants with those income-eligible for WIC First-born 2099 70.3 3.1
but not enrolled, we further divided non-WIC participants into 2 Not first-born (ref) 1345 73.1 3.6
subgroups using the poverty income ratio of 185% (a common Child race/ethnicity
criteria used in WIC for eligibility) as a cutoff. Non-Hispanic White (ref) 1888 72.1 3.0
For 2002 as a whole, 13.2% of households interviewed in the Non-Hispanic Black 502 51.5 7.2*
NIS were selected randomly to answer questions pertaining to day Hispanic 715 80.3 4.7*
care arrangements/breastfeeding practices/WIC participation, Other race 339 70.6 8.2
which is 1 of the 3 rotating topical modules added to the core Day care at 6 mo
questionnaire. Among the 3507 expected interviews, the module Yes 1572 68.5 3.8*
interviews were completed in 3483, yielding a completion rate of No (ref) 1870 73.4 2.9
99.3%. The CASRO response rate (a standard calculation devel- Received WIC during first year
oped by the Council of American Survey Research Organizations) Yes (ref) 1705 63.2 3.7
for the core questionnaire of the 2002 NIS was 75.2%.10 The re- No but eligible 165 86.0 6.8*
spondent was asked whether the infant was ever breastfed or fed No and ineligible 1436 80.1 3.0*
breast milk. For those answering “yes,” subsequent questions Maternal age, y
were asked to determine the total length of time the child was 20 95 61.9 13.6*
breastfed and at what age anything other than breast milk or 20–29 1473 63.9 4.0*
water had been introduced, including formula, cow’s milk, juice, 30 (ref) 1876 78.3 2.7
and solid foods. Respondents could give answers in days, weeks, Maternal education
or months. Breastfeeding was classified as “exclusive” if the child High school 459 68.0 6.8*
had not consumed any foods/liquids other than breast milk and High school 999 61.7 4.4*
water by a given age. Some college 639 70.7 5.6*
Each child with household data in the NIS receives a base College graduate (ref) 1347 83.1 3.0
sampling weight equal to the reciprocal of the probability of Marital status
selecting the household’s telephone number into the sample. Be- Married (ref) 2459 77.0 2.6
Unmarried 985 57.0 4.8*
cause nonresponse can occur at several points in the interview
Region
process, all the calculations for this study used base sampling
New England 287 76.6 7.3*
weights adjusted for nonresponse to represent the US population
Middle Atlantic 251 73.0 7.1*
of 19- to 35-month-old children. We calculated the percentage of
East north central 501 64.6 6.2*
children who were ever breastfed and the percentage who re-
West north central 278 68.6 7.3*
mained breastfed at 7 days and at 1, 3, 6, and 12 months, as well
South Atlantic 596 68.8 5.5*
as the percentage who were exclusively breastfed up to 7 days and
East south central 289 50.0 8.0*
1, 3, and 6 months. In estimating the proportion of children who
West south central 439 68.1 7.7*
were exclusively breastfed at a given age, a child was counted as
Mountain 379 80.3 4.9
being exclusively breastfed only if he or she had been breastfed at
Pacific (ref) 424 84.9 5.3
least up to the given age and had not had anything other than
Poverty income ratio, %
breast milk or water until after that age. We should note that,
100 646 59.3 6.0*
because the NIS was conducted throughout 2002 for children who 100–184 642 67.1 5.9*
were 19 to 35 months old, the estimates presented pertain to 185–349 853 73.3 4.7*
children born between February 1999 and June 2001. 350 (ref) 982 79.9 3.6
All calculations were performed by using SUDAAN to take the
complex sampling design into consideration.11 Sampling uncer- * Significantly different from the reference level (ref) with P .05.
e32 BREASTFEEDING RATES IN THE UNITED STATES
Downloaded from www.pediatrics.org by on June 2, 2009
4. TABLE 2. Proportion of Children Who Were Breastfed to Any Extent (Percent Half 95% CI), by Sociodemographic Characteristics
Characteristic Breastfed Breastfed Breastfed Breastfed Breastfed
at 7 d at 1 mo at 3 mo at 6 mo at 12 mo
US national 68.4 2.4 63.2 2.5 51.5 2.7 35.1 2.5 16.1 1.9
Gender
Male 67.5 3.5 62.0 3.6 50.0 3.6 34.0 3.4 15.0 2.4
Female (ref) 69.5 3.4 64.5 3.5 53.3 3.8 36.2 3.8 17.4 2.9
Birth order
First-born 67.0 3.2 62.0 3.4 51.1 3.5 35.4 3.3 16.6 2.3
Not first-born (ref) 70.7 3.7 65.1 3.9 52.3 4.2 34.6 4.0 15.4 3.1
Child race/ethnicity
Non-Hispanic White (ref) 68.8 3.3 63.2 3.3 52.0 3.4 36.6 3.3 16.4 2.3
Non-Hispanic Black 49.1 7.3* 43.6 7.4* 35.4 7.3* 19.7 5.5* 7.9 3.6*
Hispanic 78.2 4.9* 73.4 5.2* 61.0 5.9* 40.2 6.1 19.0 4.7
Other race 67.0 8.3 63.1 8.5 45.9 8.4 33.9 7.6 18.2 6.0
Day care at 6 mo
Yes 64.8 4.0* 59.1 4.1* 49.5 4.1 29.7 3.5* 10.8 2.2*
No (ref) 71.1 3.0 66.2 3.2 53.1 3.5 38.9 3.5 20.0 2.7
Received WIC during first year
Yes (ref) 59.5 3.8 53.4 3.9 42.2 3.9 26.4 3.5 12.1 2.4
No but eligible 82.7 7.8* 82.7 7.8* 64.4 11.8* 55.8 11.9* 25.9 10.4*
No and ineligible 77.9 3.1* 72.9 3.3* 61.8 3.8* 43.8 4.0* 19.6 3.0*
Maternal age, y
20 58.5 14.1* 47.0 15.3* 26.4 13.7* 17.4 12.2* 10.9 11.3
20–29 60.8 4.0* 54.2 4.1* 41.7 4.1* 26.7 3.6* 11.8 2.5*
30 (ref) 75.6 3.0 71.8 3.2 61.4 3.5 43.3 3.6 20.2 2.8
Maternal education
High school 65.4 6.9* 60.8 7.2* 48.4 7.6* 32.5 7.3* 19.0 5.8
High school 58.6 4.5* 52.3 4.6* 40.0 4.5* 25.0 4.0* 11.1 2.8*
Some college 68.4 5.7* 63.0 6.0* 50.3 6.3* 34.5 5.8* 14.1 3.7*
College graduate (ref) 79.7 3.6 75.4 3.8 65.2 4.2 46.7 4.4 20.6 3.2
Marital status
Married (ref) 73.9 2.8 68.6 2.9 56.5 3.2 39.6 3.1 18.0 2.2
Unmarried 54.3 4.9* 49.3 4.9* 38.8 5.0* 23.3 4.3* 11.3 3.4*
Region
New England 74.4 7.5 71.3 7.6 53.4 8.7 38.6 8.1 19.4 5.8
Middle Atlantic 69.2 7.5* 62.8 7.8* 52.3 8.1* 38.8 7.9 19.6 6.2
East north central 61.7 6.3* 54.6 6.5* 44.6 6.3* 28.3 5.3* 13.8 3.9
West north central 64.5 7.5* 58.1 7.8* 47.0 7.5* 32.0 7.0* 11.3 4.4*
South Atlantic 66.1 5.6* 60.0 5.9* 48.2 6.1* 33.5 5.9* 15.6 4.9
East south central 47.5 7.9* 41.5 7.6* 30.3 6.7* 19.4 5.5* 8.7 3.7*
West south central 67.0 7.7* 63.7 7.8* 50.7 8.4* 29.0 7.9* 11.8 4.2*
Mountain 78.4 5.1 76.1 5.3 63.8 5.9 47.3 6.1 21.9 5.3
Pacific (ref) 80.5 6.7 76.4 6.9 64.9 7.7 45.5 8.1 20.8 5.9
Poverty income ratio, %
100 56.1 6.1* 50.9 6.3* 42.1 6.5* 28.5 6.2* 13.9 4.1
100–184 64.0 6.1* 60.3 6.2* 46.7 6.4* 32.2 5.8* 14.8 4.6
185–349 68.7 5.3* 63.0 5.4* 50.0 5.4* 34.4 4.7* 15.9 3.2
350 (ref) 78.2 3.7 72.4 4.0 62.3 4.6 43.3 4.9 18.2 3.8
* Significantly different from the reference level (ref) with P .05.
status, and geographic area. Mothers of non-His- breastfeeding, 26.4% vs 55.8% for continuing at 6
panic black children were less likely to initiate and months). Similarly, at all time points after birth (Ta-
maintain breastfeeding than mothers of non-His- ble 3), children in WIC were less likely to be exclu-
panic white children (51.5% vs 72.1% for ever breast- sively breastfed than were children not in WIC (ei-
feeding, 19.7% vs 36.6% for continuing at 6 months). ther eligible or noneligible).
Only 5.4% of non-Hispanic black infants were exclu- Older mothers and those with higher socioeco-
sively breastfed at 6 months, compared with 14.6% of nomic status had consistently higher breastfeeding
non-Hispanic white infants and 13.8% of Hispanic rates. For example, compared with children whose
infants. mothers had only a high school education, those
Children who attended day care at 6 months were whose mothers had graduated from college had rates
less likely both to have ever been breastfed (Table 1) that were 21%, 22%, and 9% higher for initiating
and to be breastfed continuously or remained exclu- (Table 1), maintaining to 6 months (Table 2), and
sively breastfed at different time points (Tables 2 and exclusive breastfeeding at 6 months (Table 3), respec-
3). In addition, mothers of children who received tively. The rates of initiation, duration, and exclusiv-
WIC benefits during the first year of life were less ity of breastfeeding were generally higher among
likely to initiate or maintain breastfeeding than were children whose mothers lived in the Pacific, Moun-
mothers whose child was not in WIC (Tables 1 and tain, and New England regions than those of moth-
2). Differences by WIC status were particularly large ers who lived elsewhere in the United States. The
between those who participated and those who were lowest rates of initiation, duration, and exclusive
eligible but not enrolled (63.2% vs 86.0% for ever breastfeeding were found in the east south-central
www.pediatrics.org/cgi/doi/10.1542/peds.2004-0481 e33
Downloaded from www.pediatrics.org by on June 2, 2009
5. TABLE 3. Proportion of Children Who Were Exclusively Breastfed (percent half 95% CI), by Sociodemographic Characteristics at
Various Time Points
Characteristic 7d 1 mo 3 mo 6 mo
US national 63.4 2.5 56.9 2.6 42.5 2.7 13.3 1.7
Sex
Male 61.7 3.6 55.5 3.6 39.7 3.5 13.4 2.3
Female (ref) 65.3 3.5 58.5 3.7 45.6 4.0 13.3 2.4
Birth order
First-born 62.5 3.3 56.0 3.4 41.9 3.4 14.0 2.1
Not first-born (ref) 64.9 4.0 58.4 4.1 43.4 4.3 12.4 2.8
Child race/ethnicity
Non-Hispanic White (ref) 62.3 3.4 54.8 3.4 40.9 3.3 14.6 2.2
Non-Hispanic Black 45.9 7.4* 39.5 7.4* 28.9 7.2* 5.4 2.9*
Hispanic 75.4 5.1* 70.5 5.5* 55.3 6.1* 13.8 4.0
Other race 62.8 8.7 57.8 8.8 36.9 8.1 16.1 5.8
Day care at 6 mo
Yes 59.6 4.1* 52.7 4.1* 38.9 4.0* 10.6 2.2*
No (ref) 66.2 3.2 60.0 3.3 45.1 3.5 15.3 2.4
Received WIC during first year
Yes (ref) 55.9 3.9 49.8 3.9 36.5 3.9 9.7 2.0
No but eligible 79.5 8.5* 73.0 10.3* 56.2 12.2* 22.0 10.4*
No and ineligible 71.0 3.4* 64.1 3.6* 48.8 3.9* 16.7 2.9*
Maternal age, y
20 53.6 15.3* 42.7 15.7* 20.2 12.8* 3.9 4.0*
20–29 56.9 4.1* 50.5 4.1* 35.8 4.1* 8.9 1.8*
30 (ref) 69.6 3.2 63.4 3.4 49.5 3.6 17.7 2.7
Maternal education
High school 63.4 7.1* 58.2 7.4 44.7 7.8 10.6 3.8*
High school 54.3 4.6* 47.7 4.6* 33.4 4.5* 9.8 2.7*
Some college 63.2 6.0* 55.5 6.2* 40.6 6.1* 12.3 3.6*
College graduate (ref) 72.6 3.9 66.1 4.1 51.2 4.3 18.9 3.3
Marital status
Married (ref) 68.1 2.9 61.1 3.1 45.6 3.2 14.9 2.1
Unmarried 51.5 5.0* 46.1 5.0* 34.4 5.0* 9.4 2.7*
Region
New England 69.1 7.9 61.6 8.3 42.0 8.3* 14.2 5.0
Middle Atlantic 61.0 7.9* 55.0 8.2* 42.9 8.0* 16.1 6.0
East north central 57.7 6.5* 50.0 6.5* 35.7 6.1* 10.4 3.5*
West north central 58.0 7.9* 50.1 7.9* 37.1 7.2* 11.4 4.7*
South Atlantic 60.5 5.9* 52.2 6.1* 39.2 6.1* 11.9 3.4*
East south central 42.8 7.7* 33.7 6.9* 21.6 5.7* 6.8 3.3*
West south central 64.6 7.9* 57.8 8.1* 42.2 8.8* 9.2 3.8*
Mountain 74.9 5.4 71.6 5.5 52.1 6.2 19.6 4.9
Pacific (ref) 75.7 7.0 72.5 7.1 57.6 7.9 19.0 5.8
Poverty income ratio, %
100 53.4 6.2* 47.5 6.4* 37.3 6.4* 11.2 3.6*
100–184 60.8 6.2 55.9 6.3* 40.8 6.5 12.7 3.8
185–349 64.0 5.4* 57.1 5.4* 40.6 5.3* 12.4 2.9
350 (ref) 70.6 4.1 63.2 4.3 48.2 4.7 17.1 3.8
* Significantly different from the reference level (ref) with P .05.
region (Alabama, Kentucky, Mississippi, and Ten- associated with exclusive breastfeeding might be
nessee). similar to those associated with any breastfeeding in
early life.13 Special attention needs to be paid to the
DISCUSSION sharp decline in exclusive breastfeeding between 3
This analysis shows that although considerable and 5 months; for many mothers, this is the time at
progress had been made toward the Healthy People which they return to work or school and need addi-
2010 goal of 75% for initiation of breastfeeding, the tional support to continue exclusive breastfeeding.
rates of continuing breastfeeding at 6 and 12 months Lack of support for lactation in the workplace has
lagged well behind the national goals (by 15% and been cited as a major barrier to maintaining breast-
9%, respectively). Although the national objectives do feeding.14,15 In addition, other than the social and
not include a goal for exclusive breastfeeding, both the environmental constraints identified previously,16
AAP and the World Health Organization recommend the barriers for exclusive breastfeeding might in-
exclusive breastfeeding for the first 6 months postpar- clude the belief that breast milk cannot provide suf-
tum.1,12 In contrast, we found that only 63.4% in our ficient nutrition to infants beyond the first couple of
sample of the US infants are exclusively breastfed in the months.17 Our previous study found that 31% of US
early postpartum period, with this rate dropping to just adults believe that infants ought to be fed cereal or
13.3% at 6 months postpartum. infant food by 3 months.18 If mothers are told by
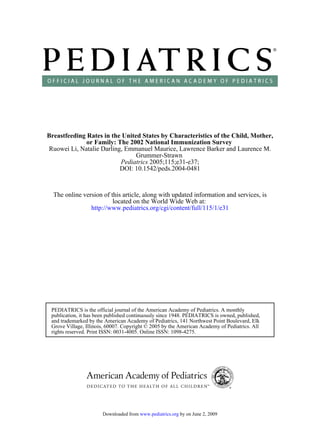
The similarity of the rates at which any breastfeed- their family and friends that their infants should be
ing and exclusive breastfeeding dropped off in the fed solid foods in the first few months, they will find
first couple of months (Fig 1) implies that the factors it difficult to avoid feeding their infants solids until 6
e34 BREASTFEEDING RATES IN THE UNITED STATES
Downloaded from www.pediatrics.org by on June 2, 2009
6. Fig 1. Any and exclusive breastfeeding
rate by age (2002 NIS).
months of age, despite the recommendations by the logical factors that can be targeted for interventions
World Health Organization and AAP to exclusively to increase breastfeeding rates among black women.
breastfeed for the first 6 months of life. Women with infants and children are the fastest-
Overall, mothers of non-Hispanic black children growing segment of the US labor force.25 Approxi-
had very low rates of breastfeeding (Fig 2). The per- mately 70% of employed mothers with children 3
centages of non-Hispanic black children who were years old work full-time; one third of these mothers
ever breastfed (Table 1), received any breast milk at return to work within 3 months after birth, and two
6 months (Table 2), or were exclusively breastfed at 6 thirds return within 6 months.26 At the same time,
months (Table 3) were 21%, 17%, or 9% lower, re- millions of young children spend part or most of
spectively, than those of white children. These find- each day in day care.27 With so many children in day
ings are consistent with previous observations in the care, and given our findings that mothers of children
United States that black women were less likely to in day care are relatively less likely to breastfeed, it
breastfeed than nonblack women.19–22 Consistent will be important for the staff of day care centers to
with observations in other developed countries,23,24 accommodate mothers who wish to breastfeed their
we also observed a strong inverse association be- children or to have their children fed expressed milk
tween how poor a family was and the rate of breast- at the center.
feeding. Although we did not investigate whether As in previous studies,6,28 we found that breast-
the low breastfeeding rates among black women feeding was much less common among children who
could be attributed to generally poorer socioeco- received WIC benefits during the first year than
nomic status, the evidence of racial/ethnic dispari- among those who did not. Only 63.2% of WIC
ties in breastfeeding supports the need for research children were ever breastfed, versus 86.0% of chil-
that identifies social, cultural, economic, and psycho- dren who were eligible but not enrolled and 80.1% of
Fig 2. Racial/ethnic disparities in
breastfeeding rates (percent and 95%
CI; 2002 NIS).
www.pediatrics.org/cgi/doi/10.1542/peds.2004-0481 e35
Downloaded from www.pediatrics.org by on June 2, 2009
7. those whose household income was 185% of the ventions should focus on improving rates in the sectors
poverty level and thus would generally not be eligi- that have the lowest breastfeeding rates. The Healthy
ble. There are multiple reasons why WIC partici- People 2010 objectives do not currently include an ob-
pants had lower rates of breastfeeding.29–34 Previous jective for exclusive breastfeeding, because until now,
studies indicate that low-income breastfeeding national data on exclusive breastfeeding were not
mothers usually acknowledge the health benefits of available. The NIS fills some of the important gaps in
breastfeeding but face barriers that override this our national monitoring of breastfeeding and would
fact.34,35 These barriers include lack of peer and fam- make monitoring an objective for exclusive breastfeed-
ily support, returning to work or school, receiving ing possible.
information or hospital services not conducive to
breastfeeding, and poor living conditions associated REFERENCES
with poverty. It is not clear why mothers of children 1. American Academy of Pediatrics, Work Group on Breastfeeding.
who were eligible for WIC but did not enroll had Breastfeeding and the use of human milk. Pediatrics. 1997;100:1035–1039
much higher breastfeeding rates. Because WIC pro- 2. World Health Organization, United Nations Children’s Fund. The In-
vides free formula for eligible children, it is possible nocenti declaration on the protection, promotion and support of breast-
that women who are determined to breastfeed feel feeding. 1990. Available at: www.cdc.gov/breastfeeding/policy-
innocenti.htm. Accessed October 13, 2004
less need to participate in WIC. 3. American Dietetic Association. Position of the American Dietetic
The national average statistics mask considerable Association: promotion of breastfeeding. J Am Diet Assoc. 1986;86:
geographic variation across the United States. For 1580 –1585
example, the proportion of children ever breastfed 4. US Department of Health and Human Services. Healthy People 2010:
Conference Edition. Vols I and II. Washington, DC: US Government
ranged from just 50.0% in the east south-central re-
Printing Office; 2000:47– 48
gion to 84.9% in the Pacific. For breastfeeding to any 5. Grummer-Strawn LM, Li R. US national surveillance of breastfeeding
extent and exclusively at 6 months, the differences behavior. J Hum Lact. 2000;16:283–290
between the lowest and highest region were 28% and 6. Ryan AS, Zhou W, Acosta A. Breastfeeding continues to increase into
13%, respectively. The large geographic variation in the new millennium. Pediatrics. 2002;110:1103–1109
7. Li R, Zhao Z, Mokdad A, Barker L, Grummer-Strawn L. Prevalence of
breastfeeding rates may be attributed to multiple breastfeeding in the United States: the 2001 National Immunization
factors including socioeconomic and environmental Survey. Pediatrics. 2003;111:1198 –1201
influences. Social and cultural norms also vary by 8. Smith PJ, Battaglia MP, Huggins J, et al. Overview of the sampling
geographic areas, and our previous study indicates a design and statistical methods used in the National Immunization
Survey. Am J Prev Med. 2001;20(4 suppl):17–24
large regional variation in public attitudes toward
9. Zell ER, Ezzati-Rice TM, Battaglia MP, Wright RA. National Immuni-
breastfeeding.18 Unfortunately, the sample size in the zation Survey: the methodology of a vaccination surveillance system.
2002 NIS did not allow us to estimate state-specific Public Health Rep. 2000;115:65–77
rates of breastfeeding. Future studies examining this 10. Council of American Survey Research Organizations Task Force on
geographic variation when more NIS data become Completion Rates. On the definition of response rates. Available at:
www.casro.org/resprates.cfm. Accessed March 2, 2004
available are warranted to aid the setting of targets 11. Shah BV, Barnwell BG, Bieler GS. SUDAAN User’s Manual, Release 7.5.
and also to evaluate the initiatives designed to pro- Research Triangle Park, NC: Research Triangle Institute; 1997
mote breastfeeding. 12. World Health Organization. The optimal duration of exclusive breast-
This study has several major limitations. First, al- feeding. Note for the press no. 7. April 2, 2001. Available at: www.
who.int/inf-pr-2001/en/note2001-07.html. Accessed March 2, 2004
though strictly speaking the definition of exclusive
13. Li R, Ogden C, Ballew C, Gillespie C, Grummer-Strawn L. Prevalence of
breastfeeding specifies that no other liquids or solids exclusive breastfeeding among US infants: the Third National Health
except breast milk are given to the infant,36 this study and Nutrition Examination Survey (Phase II, 1991–1994). Am J Public
includes water feeding in the definition of exclusive Health. 2002;92:1107–1110
breastfeeding. Second, family income and place 14. Lindberg L. Trends in the relationship between breastfeeding and post-
partum employment in the United States. Soc Biol. 1996;43:191–202
where the child lived were those when the interview 15. Fein SB, Roe B. The effect of work status on initiation and duration of
was conducted and may have differed from the time breastfeeding. Am J Public Health. 1998;88:1042–1046
at which the child was being breastfed. Third, there 16. Scott JA, Binns CW. Factors associated with the initiation and duration
might have been some recall bias, especially for older of breastfeeding: a review of the literature. Breastfeed Rev. 1999;7:5–16
17. Obermeyer CM, Castle S. Back to nature? Historical and cross-cultural
children. Previous studies indicate that the recall of
perspectives on barriers to optimal breastfeeding. Med Anthropol. 1996;
initiation and duration of breastfeeding is more ac- 17:39 – 63
curate than recall of when other foods were intro- 18. Li R, Fridinger F, Grummer-Strawn L. Public perceptions on breastfeed-
duced,37,38 and thus the estimates of exclusive breast- ing constraints. J Hum Lact. 2002;18:227–235
feeding may not be as reliable as others. Because 19. Wiemann CM, DuBois JC, Berenson AB. Racial/ethnic differences in the
decision to breastfeed among adolescent mothers. Pediatrics. 1998;
prospective studies are very often not feasible for 101(6). Available at: www.pediatrics.org/cgi/content/full/101/6/e11
large-scale surveys, maternal recall of breastfeeding 20. Timbo B, Altekruse S, Headrick M, Klontz K. Breastfeeding among
practice, especially on doing it exclusively,39 needs to black mothers: evidence supporting the need for prenatal intervention.
be validated further. J Soc Pediatr Nurs. 1996;1:35– 40
21. Kurinij N, Shiono PH, Rhoads GG. Breast-feeding incidence and dura-
tion in black and white women. Pediatrics. 1988;81:365–371
CONCLUSIONS
22. Rassin DK, Richardson CJ, Baranowski T, et al. Incidence of breast-
Although the national goal for initiation of breast- feeding in a low socioeconomic group of mothers in the United States:
feeding has nearly been reached, the gaps remain large ethnic patterns. Pediatrics. 1984;73:132–137
in achieving the goals for continuation of this practice. 23. Donath S, Amir LH. Rates of breastfeeding in Australia by state and
socio-economic status: evidence from the 1995 National Health Survey.
Only 35% and 16% of US infants are receiving breast J Paediatr Child Health. 2000;36:164 –168
milk at 6 and 12 months, respectively. Because there are 24. Rogers IS, Emmett PM, Golding J. The incidence and duration of breast
significant inequalities in breastfeeding practice, inter- feeding. Early Hum Dev. 1997;49(suppl):S45–S74
e36 BREASTFEEDING RATES IN THE UNITED STATES
Downloaded from www.pediatrics.org by on June 2, 2009
8. 25. US Department of Labor. Women’s Jobs: 1964 –1999. Washington, DC: 32. Zimmerman DR, Guttman N. “Breast is best”: knowledge among low-
US Department of Labor, Women’s Bureau; 1999 income mothers is not enough. J Hum Lact. 2001;17:14 –19
26. US Department of Health and Human Services. HHS Blueprint for Action 33. Reifsnider E, Eckhart D. Prenatal breastfeeding education: its effect on
on Breastfeeding. Washington, DC: US Government Printing Office; 2000 breastfeeding among WIC participants. J Hum Lact. 1997;13:121–125
27. US Department of Health and Human Services. National Health and 34. Bentley ME, Caulfield LE, Gross SM, et al. Sources of influence on
Safety Performance Standards: Guidelines for Out-of-Home Child Care Pro- intention to breastfeed among African-American women at entry to
grams. Arlington, VA: US Department of Health and Human Services, WIC. J Hum Lact. 1999;15:27–34
Health Resources and Services Administration, Maternal and Child 35. McLorg PA, Bryant CA. Influence of social network members and
Health Bureau; 1992:117–120 health care professionals on infant feeding practices of economically
28. Baydar N, McCann M, Williams R, Vesper E, McKinney P. WIC Infant disadvantaged mothers. Med Anthropol. 1989;10:2652–2678
Feeding Practices Study: Summary of Findings. Alexandria, VA: US De- 36. World Health Organization. Indicators for Assessing Breast-feeding Prac-
partment of Agriculture, Food and Nutrition Service, Office of Analysis tices. Geneva, Switzerland: World Health Organization; 1991
and Evaluation; 1997 37. Eaton-Evans J, Dugdale AE. Recall by mothers of the birth weights and
29. Walker M. Expanding breastfeeding promotion and support in the feeding of their children. Hum Nutr Appl Nutr. 1986;40:171–175
Special Supplemental Nutrition Program for Women, Infants and Chil- 38. Tienboon P, Rutishauser IHE, Wahlqvist ML. Maternal recall of infant
dren (WIC). J Hum Lact. 2002;18:115–124 feeding practices after an interval of 4 –15 years. Aust J Nutr Diet.
30. Barton SJ. Infant feeding practices of low-income rural mothers. MCN 1994;51:25–27
Am J Matern Child Nurs. 2001;26:93–97 39. Bland RM, Rollins NC, Solarsh G, Van den Broeck J, Coovadia HM, for
31. Zimmerman DR. You can make a difference: increasing breastfeeding the Child Health Group. Maternal recall of exclusive breastfeeding
rates in an inner-city clinic. J Hum Lact. 1999;15:217–220 duration. Arch Dis Child. 2003;88:778 –783
www.pediatrics.org/cgi/doi/10.1542/peds.2004-0481 e37
Downloaded from www.pediatrics.org by on June 2, 2009
9. Breastfeeding Rates in the United States by Characteristics of the Child, Mother,
or Family: The 2002 National Immunization Survey
Ruowei Li, Natalie Darling, Emmanuel Maurice, Lawrence Barker and Laurence M.
Grummer-Strawn
Pediatrics 2005;115;e31-e37;
DOI: 10.1542/peds.2004-0481
Updated Information including high-resolution figures, can be found at:
& Services http://www.pediatrics.org/cgi/content/full/115/1/e31
References This article cites 25 articles, 14 of which you can access for free
at:
http://www.pediatrics.org/cgi/content/full/115/1/e31#BIBL
Citations This article has been cited by 21 HighWire-hosted articles:
http://www.pediatrics.org/cgi/content/full/115/1/e31#otherarticle
s
Subspecialty Collections This article, along with others on similar topics, appears in the
following collection(s):
Nutrition & Metabolism
http://www.pediatrics.org/cgi/collection/nutrition_and_metabolis
m
Permissions & Licensing Information about reproducing this article in parts (figures,
tables) or in its entirety can be found online at:
http://www.pediatrics.org/misc/Permissions.shtml
Reprints Information about ordering reprints can be found online:
http://www.pediatrics.org/misc/reprints.shtml
Downloaded from www.pediatrics.org by on June 2, 2009