2. 80 R.J. Dowen, T. Mann / Financial Services Review 13 (2004) 79-91
"benefits" of professional management. If professional managers are unable to produce
superior after tax returns then the individual investor would be better served by the creation
of portfolios that track broad market indexes.
In order to manage the shareholders' money, the fund management must trade securities.
Trading securities incurs a number of costs that affect the profitability of a transaction.
Among these are direct brokerage costs and the effect of the bid/ask spread on purchase or
sale price which are not reflected in the funds expense ratio. The trading efficiency of a fund
manager is impacted by these costs. Since trading is costly, funds should only trade when it
is advantageous to the shareholder. One view is that the managers who are less successful at
generating returns will do more trading in an effort to make up lost ground. Such an effort,
if unsuccessful, will only generate more trading costs. We examine the relation between
managers' ability to generate returns and the amount of trading they do.
Investors take the risk that the managers to whom they entrust their funds may under-
perform the market on a risk-adjusted basis. Investors must pay the managers and the
expenses of operating the fund. Efficient managers should be able to operate a fund at a lower
cost. We examine the relation between the cost of operating the fund and the returns
generated by the fund.
In addition to the management fee, investors holding money in accounts that are not tax
deferred must also pay taxes as taxable events occur. Since taxes are an expense of the
shareholder that reduces retum, it is incumbent upon managers to operate the fund in a
tax-efficient manner. If a taxable fund is earning returns, investors who are not in tax deferred
accounts such as the 401k or the IRA, will be incurring tax costs. The fact that some investors
are in fully taxable accounts and some investors are in tax deferred accounts creates a
dilemma for fund managers.
A new measure of potential future tax liability required by the Securities and Exchange
Commission (SEC) is the Potential Capital Gains Exposure (PCGE). If the assets in a fund
appreciate, the investor may sell shares in the fund and pay the tax on the capital gain.
Alternatively, the management of the fund could choose to sell some component of the
appreciated assets of the i'und. If management makes that decision, the capital gain will then
be distributed to the shareholders and they will be required to pay tax on that gain regardless
of their personal tax situations. PCGE provides potential new investors with a measure of the
possible future tax exposure from such transactions. PCGE does the same for existing
shareholders, but until management sells the appreciated assets those investors have the tax
option to sell their shares in accordance with their personal tax planning. We test whether
PCGE is related to the returns generated by the fund.
Another aspect of tax efficiency for a mutual fund is the receipt of taxable interest and
dividends by the fund. Such receipt produces a taxable event for the investor. It is the
responsibility of the fund's management to conduct the affairs of the fund so as to insure that
the investor does not incur an unwarranted tax liability. We examine the relation between tax
costs and the ability of fund management to generate returns.
Most mutual funds, particularly large mutual funds, are members of fund families. Eund
families vary considerably both in the number of funds under management and in the total
assets under management. Malhotra and McLeod (1997) examined an aspect of this issue by
using a dummy variable equal to one if a fund was a member of a family with at least five
3. R.J. Dowen, T. Mann / Financial Services Review 13 (2004) 79-91 81
funds under management and zero otherwise. They found that being a member of a large
fund family reduced a funds expense ratio. We extend their work by examining both
economies of scale associated with the total money under management and economies of
scope associated with the number of funds under management.
2. Literature review
Ang, Chen, and Lin (1998) explored equity mutual fund management reaction to poor
performance using data beginning in 1994. They observed that management had good reason
to be concerned about poor performance, as management compensation is based upon the
amount of money under management and performance of the fund. Their analysis explores
possible management reactions to poor performance. Management could trade more often,
reduce costs, take more risks, or adopt a more aggressive marketing strategy. They found that
the management of lower performing funds did more trading and had greater expense ratios
than the management of funds that had good performance. We examine these issues and
contribute to the understanding of mutual fund performance by studying a later time period
with a larger sample and by including fixed income as well as equity funds. We also
contribute by considering the role of economies of scale both at the level of the individual
fund and the level of the fund family.
Berkowitz and Kotowitz (2002) found that there is a relationship between the fees, the
structure of the fees charged by asset managers, and the level of the funds performance. We
build on and support these findings.
Droms and Walker (2001), studying 151 mutual funds over a 20-year period found no
long-term persistence in returns, expenses, or turnover rates. They examine a longer time
period than this study, but a smaller sample of investment companies. Their findings could
support various explanations. Changes in returns, expenses, and turnover rate could be due
to changes in fund management or management philosophy. The findings are also consistent
the possibility that the quality of oversight from the independent trustees varies over time.
Malhotra and McLeod (1997) argue that investors ignore aspects of fund management
other than performance. They also argue that this behavior is suboptimal in that net
performance after consideration of fees and taxes is a more appropriate measure. We find that
fund expenses and tax costs do significantly reduce returns. We find that tax costs are of
greater magnitude than the costs of managing the fund.
3. Hypotheses
HI: Trading activity is unrelated to market performance
The trading activity of a fund may be linked to the market performance of the fund
because of the link between the amount of money under management and the compensation
of the managers. In the mutual fund industry, there are various compensation schemes, some
based on performance and some based on a proportion of funds under management. Golec
4. 82 R.J. Dowen, T. Mann / Financial Services Review 13 (2004) 79-91
(2003) found that 2190 of the 2351 equity mutual funds that he studied, using 1995 data,
charged fees strictly as a percentage of assets, and only 39 funds utilized performance-based
fees. Golec argued that the primary reason for this was that the SEC had made other
compensation schemes either illegal or unattractive. He found this to be significant because
individual investors have difficulty distinguishing between investor-oriented funds that
minimize costs and marketing oriented funds that pursue other strategies to increase the level
of the assets.
Even managers of funds with no performance-based compensation will be concerned
about performance because negative portfolio returns generally result in decreased income to
management, since the net assets in the fund will fall due to the poor performance. For a fund
with positive but below average returns income to management will not increase as fast as
income to the management of funds with above average returns. In addition, there may be
negative cash inflows as investors reallocate their money to better performing funds.
Therefore the managers with negative or below average performance will have a strong
motivation to improve performance, or to at least appear to be working to improve the
performance. One way in which they can try to improve performance, or create the
appearance of doing something to improve performance, is to increase the amount of trading.
Therefore it is expected that poorly performing funds will trade more frequently than funds
with good performance as managers attempt to improve performance.
Assets under management increase for two reasons. The first is performance. If there is
positive performance the assets will grow in an amount proportional to the performance. The
second is net cash inflow. The firms marketing efforts, which are greatly influenced by the
performance, detennine net cash inflow. In general, the better the performance the greater the
cash inflow and the greater the compensation to management. The less management feels the
need to increase trading activity.
H2: There is no relation between performance and expense ratio
Operating a mutual fund is a costly undertaking. Management must be compensated.
Custodial and transfer agency fees must be paid. Investment research must be conducted. All
of these result in a reduction of the return available to shareholders. Shareholders have a
strong interest in knowing that their fund is operated as efficiently as possible. It is expected
that the better performing funds will have lower expense ratios.
H3: Foorly performing funds will have the same potential capital gain exposure as funds
with good performance
Effective April 16, 2001 the SEC requires funds to report potential capital gains exposure.
If management choses to sell all appreciated assets, PCGE represents the potential taxable
capital gain that the fund could realize and force investors to recognize on their income taxes.
The justification given for the requirement by the SEC was that unrecognized capital gains
would be recognized in future time periods creating taxable capital gain distributions for the
shareholders of the fund. Contrary to the justification for the SEC ruling, the existence of
positive potential capital gain exposure actually represents cumulative gain in unsold assets
5. R.J. Dowen, T. Mann / Financial Services Review 13 (2004) 79-91 83
and past positive performance on the part of the fund, and a tax option for the shareholder.
The shareholder has a valuable tax option in that a choice can be made to recognize the
capital gain in the current period by selling the appreciated shares of the fund. Alternatively,
the shareholder can hold on to the appreciated shares and allow fund management to continue
to manage the money. It is expected that the poorly performing funds will have more
negative potential capital gain exposure consistent with the poor performance. Even negative
PCGE provides the investor with a valuable tax option in that capital losses from selling the
shares of the fund can produce tax savings at an advantageous time for the investor. The
investor can control the timing of the sale of shares of the fund and the associated taxes. The
investor cannot control the timing of the sale of the assets contained in the fund. Management
must have good reason to sell appreciated assets, as the sale removes a valuable tax option
from the shareholder unless the gain is offset by the sale of depreciated assets. Potential
capital gains exposure actually represents a measure of the cumulative success of fund manage-
ment in managing the fund. A positive relation between returns and PCGE is expected.
H4: There is no relation between tax costs and returns
We expect that the tax costs associated with poorly performing funds will be less than that
of the funds that do well, in that the poorly performing funds will produce a smaller income
stream with fewer taxable events. Managers should manage in a tax efficient manner
realizing that an investor will prefer a fund with successful management even though it may
produce tax liabilities.
H5: There is no relation between expenses and the total of assets under management by
a fund family
Professional management groups manage all mutual funds. These management groups are
of various sizes, as are the mutual funds that they manage. Latzko (1999), using a translog
cost function found that mutual funds experienced economies of scale up to $3.5 billion in
assets. Beyond that level, Latzko found that economies of scale are exhausted. Scale
economies are exhibited in any industry when the fixed costs of running the firm can be
allocated over a larger plant size or, in the case of mutual fund management groups, over
more dollars of assets under management. If there are fixed costs associated with running
mutual funds, then the more assets over which those costs can be allocated the lower will be
the expense ratio. Consistent with Malhotra and McLeod, we expect that the sample will
exhibit scale economies.
H6: There is no relation between expenses and the total number of different mutual funds
included in a fund group
Economies of scope occur when a firm is able to allocate fixed costs over more than one
product. A classic example of an economy of scope is com and pig production. A fanner can
easily combine these two products because a portion of the com produced can be used to feed
the pigs, eliminating transportation and processing costs, including accounting profit for the
6. 84 R.J. Dowen, T. Mann / Financial Services Review 13 (2004) 79-91
feed wholesaler. The use of the com in this manner allows the farmer to produce pigs at
lower cost. The use of the pigs reduces some of the demand uncertainty faced by the farmer
at the time of planting, thus reducing the cost of hedging the com price. The question here
is whether mutual fund management groups experience similar economies of scope. Given
the proliferation of mutual funds under one management group it is expected that there will
be a negative relation between cost and the number of different funds under management.
4. Data and methodology
Data for this study comes from the Momingstar Principia Mutual Fund database with data
last updated on March 31, 2003. This analysis examines "pure no load" mutual funds where
Momingstar has indentified 36 different "prospectus objectives" ranging from "aggressive
growth" to municipal bond funds specializing in the bonds issued within a particular state.
The Momingstar criteria include the requirement that no 12b-l fee be charged by the fund.
Only no load funds are used because of the complexity of the variety of loads now charged.
Fund performance is measured by average annual retum over the previous 5 years as
calculated by Momingstar. That measure consists of ending net asset value per share plus any
distributions that were available for reinvestment divided by beginning net asset value per
share. One is subtracted from this quotient and the result is stated as a percentage. The 5-year
measure is chosen because it is relatively long term.
The measure of trading activity used in the study is "tumover" as calculated by Mom-
ingstar. Tumover is the lesser of the total dollar volume of shares purchased or sold,
excluding all securities with a maturity of less than 1 year, over a time period divided by the
average net asset value in the time period. By this definition, a fund that is experiencing only
cash inflows and only buying securities would have sales of zero and report a zero tumover.
Overall, the average tumover rate for the funds islO9.8O% of assets. This does not mean that
the fund sold all of the assets that it started with; it means only, that in the time period, it
purchased or sold, (whichever was less) a dollar volume of assets equal to 109.80% of the
average net asset value.
The funds' expenses are measured by the expense ratios reported by Momingstar.
Momingstar does not calculate the expense ratios but rather reports the expense ratios that
the funds report in the prospectuses. The expense ratio includes operating expenses, man-
agement fees and would, for load funds, include 12b-l fees. The average expense ratio
reported for all of the funds is 0.98% of assets. The highest average expense ratio is 1.86%,
reported for the aggressive growth funds, and the lowest was 0.58% for the Califomia
Municipal Bond Funds.
The number reported by the funds in their respective prospectuses measures PCGE. While
PCGE is designed to provide investors with an estimate of the amount on which they might
have to pay capital gains taxes in the future, in fact the average potential capital gains
exposure is -36.56%. The lowest reported PCGE is for the specialty technology funds with
—323.86%. A negative number of this magnitude can result because ending net assets are
used as the denominator. For example, start with $100 in assets and end with unrecognized
7. R.J. Dowen, T. Mann / Financial Services Review 13 (2004) 79-91 85
losses of $80. Your net asset value is now $20 and your potential capital gains exposure is
(-$80/$20) X 100 = -400%. The greatest potential capital gains exposure is for Califomia
municipal bond funds with 6.94%.
The tax costs are measured using the Momingstar tax cost ratio for the 5-year period. The
5-year period is chosen to be consistent with the performance measure used. The tax cost
ratio represents the reduction in annualized retum that would result from income taxes if the
fund management realized all gains, did not realize any losses, and the individual investor
paid tax at the highest statutory rate. The ratio does not include the taxes incurred by the
individual investor for selling shares of the fund. It does include the hypothetical tax that an
investor in the maximum federal tax bracket would pay on dividend, interest, and capital gain
distributions. For the funds as a whole the average tax cost ratio is 1.48%, which is
substantially larger than the expense ratio. The largest tax cost ratio is 3.74% for high-yield
corporate bonds and the smallest is 0.05% for Califomia municipal bond funds.
After elimination of all mutual funds missing relevant data, the sample consists of 3292
funds managed by 408 fund complexes. Summary data for the overall sample and for each
of the different objectives is contained in Table 1. The smallest objective category, Special-
ty-Unaligned, contains only nine funds. The largest objective category. Growth, contains
651 funds. Across all funds, management expenses average 0.98% of assets and tax costs
average 1.48% of assets. There is substantial variation in these numbers across different
investment objectives.
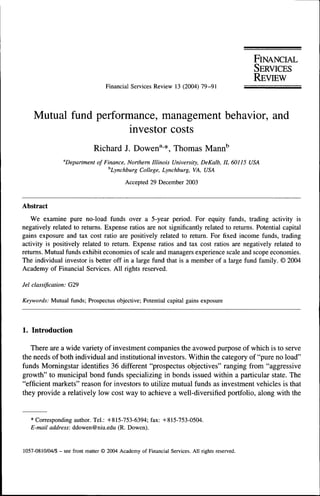
Table 2 presents data on the funds, broken down by equity and fixed income and divided
into size deciles based on total net assets in the fund. For the equity investment companies
the funds under management in the largest decile constitute nearly three fourths of the total
assets of the equity funds. The retums for the funds increase and the expense ratios decrease
as size of fund increases, indicating the presence of economies of scale. Tumover decreases
as funds get larger. Overall, there appears to be strong market concentration in the mutual
fund industry that may relate to scale economies.
For the fixed income mutual funds, the largest ten percentage of funds control over 65%
of the assets being managed. Retums increase as the size increases and the expense ratio
decreases indicating economies of scale.
Table 3 considers the issue of the total assets under management by a single manager.
Since fund managers mn both equity and fixed income funds and economies of scale and
scope may affect both of these types of funds, there was no attempt to break out the equity
from the fixed income funds. The largest ten percentage of fund families control 82.5% of
the assets under management and 42.63% of the total number of individual funds. The
relation between retum and size for fund families is not monotonic. However, the expense
ratio does generally decrease as size increases, indicating that there may be both economies
of scale and of scope.
The tests of HI through H4 are conducted using regression analysis, the following
regression models are used:
To test HI:
i = a + /3i(Retumi) -I- b2(AssetSi) + e, 1,
8. 86 R.J. Dowen, T. Mann / Financiat Services Review 13 (2004) 79-91
Table 1
Characteristics of the overall sample and mutual funds by prospectus objective
Pros. Obj. Number Avg. Ann. Tot. Turnover Expense PCGE Tax Ratio
Return last 5 Ratio Last Five
Years Years
Overall 3291 -.01% 109.80% .98% -36.56% 1.48%
Agg. Growth 50 -4.81% 145.14% 1.86% -90.16% 1.39%
Ass. Allocation 98 .78% 103.24% .90% -32.57% 1.86%
Balanced 141 .02% 93.51% .91% -26.34% 1.85%
Convert. Bond 14 1.06% 99.42% 1.18% -30.57% 2.44%
Corp Bond-Gen 228 6.22% 166.45% .67% -3.76% 2.34%
Cp Bond-HiQu 120 6.22% 155.50% .63% 1.20% 2.17%
Cp Bond-HiYl 64 .01% 119.15% .83% -65.48% 3.74%
Emg Mkt 53 -6.01% 106.07% 1.65% -86.55% .34%
Eq Income 74 -2.39% 70.50% 1.00% -23.05% 1.66%
Eur. Stk. 24 -5.71% 95.33% 1.42% -67.12% f.50%
For. Stk. 230 -5.53% 82.53% 1.22% -65.23% 1.24%
G.Bd.-ARM 10 5.13% 74.40% .63% -8.30% 1.96%
G.Bd.-Gen 107 6.53% 193.69% .71% 2.72% 2.06%
G.Bd.-Mort 49 6.62% 219.18% .67% -1.20% 2.26%
G.Bd.-Treas 35 6.60% 94.26% .64% 4.46% 1.97%
Growth 651 -3.05% 107.40% 1.06% -52.25% 1.48%
Gr. & Inc. 287 -3.67% 81.63% .81% -30.08% 1.32%
Mul.As.Global 18 .60% 121.56% 1.22% -48.33% 1.90%
Mul.Sec.Bd. 23 4.49% 211.78% .90% -14.30% 2.64%
MuniBdCa 38 5.22% 37.02% .58% 6.94% .05%
MuniBdNat 153 4.90% 55.46% .66% .61% .06%
MuniBdNY 24 5.36% 46.33% .71% 5.79% .11%
MuniBdSingSt 159 5.20% 23.91% .64% 5.23% .02%
Pacif.Stk 50 -1.92% 105.16% 1.75% -95.16% .86%
Sm.Company 312 -1.29% 96.06% 1.18% -45.52% 1.46%
Spec.Comm 10 -9.19% 335.30% 1.56% -253.70% 1.77%
Spec.Finn. 14 .19% 258.93% 1.33% -46.35% 1.33%
Spec.Hlth 14 5.82% 129.36% 1.28% -50.36% 1.06%
Spec.Nat.Res. 20 .72% 184.35% 1.33% -25.35% .65%
Spec.Prec.Met. 12 2.20% 165.00% 1.82% -63.33% .28%
Spec.Re.Est. 44 3.47% 64.91% 1.13% -.81% 2.00%
Spec.Tech. 29 -5.29% 175.07% 1.48% -323.86% 1.21%
Spec.Unal. 9 -2.74% 574.33% 1.50% -26.00% .72%
Spec.Util. 17 -3.64% 52.82% .89% -68.82% 2.04%
Wrld.Bd. 61 5.87% 20.965% .87% -2.39% 2.44%
Wrld.Stk. 49 -4.54% 119.59% 1.23% -68.44% 1.52%
where Turn; is the portfolio turnover for mutual fund i, Retunij is the past 5-year average
return for mutual fund i; The variable AssetSj is the net assets under management for mutual
fund i. Assets are used as a control variable because of the potential economies of scale in
mutual fund management. The slope coefficient of assets is expected to have a significant
negative sign for this test. The null hypothesis will be rejected if the slope coefficient of the
variable return; is significant. 6; is the error term of the equation for mutual fund i.
Similar regression models were used to test H2 through H4. For H2, the dependent
9. R.J. Dowen, T. Mann / Financiat Services Review 13 (2004) 79-91 87
Table 2
Mutual fund characteristics by asset size decile for equity (A) and fixed income (B) funds
A: Equity mutual funds
Asset Assets Return Turnover Expense PCGE Tax Percent of
Size (millions (%) Ratio Cost Total assets
Decile of dollars) Ratio
1 1.95 -4.51 141.66 1.32 -91.91 1.42 .03
2 9.78 -3.34 132.96 1.34 -60.83 1.33 .17
3 21.41 -3.23 96.71 1.25 -62.07 1.53 .38
4 39.97 -3.45 115.69 1.20 -69.33 1.44 .72
5 66.04 -2.78 93.42 1.11 -51.58 1.48 1.17
6 110.64 -2.21 95.36 1.10 -42.01 1.43 1.98
7 185.89 -2.23 97.10 1.07 -41.61 1.55 3.30
8 324.01 -2.00 81.65 1.02 -43.01 1.46 5.77
9 672.08 -1.79 80.63 .92 -28.46 1.36 11.97
10 4202.6 -1.10 53.17 .77 -28.65 1.35 74.50
B: Fixed income mutual funds
Asset Assets Return Turnover Expense PCGE Tax Percent of
Size (millions (%) Ratio Cost Total Assets
Decile of dollars) Ratio
1 4.87 3.73 121.93 .83 -21.10 1 .86 .09
2 21.57 4.99 132.62 .80 -9.56 1 .64 .39
3 44.35 4.89 108.04 .79 -5.62 1 .59 .82
4 74.93 5.19 116.64 .71 -2.91 1 .49 1.38
5 121.28 4.90 121.54 .71 -4.81 1 .48 2.24
6 175.64 5.17 112.32 .69 -1.14 1 .51 3.24
7 262.25 4.79 108.90 .64 -7.19 1 .59 4.84
8 425.59 5.57 147.61 .64 -1.42 1 .67 7.86
9 730.83 5.52 128.86 .62 -.58 1 .60 13.51
10 3548.44 5.96 122.14 .49 2.18 1 .63 65.59
"Assets" is tfie average net assets in funds in this size decile.
"Return" is the mean annual return for assets in this size decile for the five year period ended 3/31/2003.
"Turnover" is the mean of the lesser of dollar volume of shares purchased or sold divided by average net asset
value in the time period.
"Expense ratio" is mean operating expenses and management fees divided by assets for the funds in the size
quintile.
"PCGE" is the mean potential capital gains exposure for the funds in the size quintile.
"Tax cost ratio" is the mean of the reduction in return due to taxes if all gains were realized.
"Percent of total assets" is the percent of the total assets of all funds in the sample in the asset size decile.
variable is the expense ratio. For H3 dependent variable is the PCGE. For H4 the dependent
variable is the tax cost ratio. In all cases, the null hypothesis will be rejected if the slope
coefficient of Retunij is significant.
To test H5 and H6, regression analysis is again used. To test H5, the log of the total assets
under management is added to the equation. To test H6, the total number of funds under
management by the fund manager replaces the total assets under management. All of the tests
are conduced separately for equity and fixed income funds.
10. R.J. Dowen, T. Mann / Financiat Services Review 13 (2004) 79-91
Table 3
Size decile characteristics of mutual fund families (number of mutual fund families in study 408)
Asset Total Net Assets Unweighted Unweighted Unweighted PCGE Tax Number %of %of
Size Managed (Millions Average Average Average Cost of Funds Total Total
Decile of Dollars) Return Turnover Expense Ratio Managed Assets Mutual
Ratio Eunds
Managed
1 7.51 4.28 103.68 1.93 3.85 1.34 1.45 .02 1.81
2 26.91 3.99 85.61 1.52 2.08 1.04 1.36 .06 1.74
3 66.50 3.75 108.22 1.32 5.24 1.22 2.07 .16 2.64
4 141.03 4.43 95.33 1.09 2.68 1.53 2.75 .33 3.51
5 231.39 5.90 98.34 1.22 2.38 1.51 3.51 .55 4.48
6 449.42 5.16 104.58 1.11 3.56 1.35 4.24 1.07 5.41
7 872.12 4.52 101.83 1.09 2.71 1.55 5.76 2.07 7.34
8 1733.54 4.85 121.16 .94 1.71 1.45 11.26 4.12 14.37
9 3820.47 453 94.97 .99 4.04 1.59 12.59 9.09 16.06
10 35510.65 5.01 98.21 .84 2.53 1.52 34.22 82.50 42.62
"Assets" is the average net assets in funds in this size decile.
"Return" is the mean annual return for assets in this size decile for the five year period ended 3/31/2003.
"Turnover" is the mean of the lesser of dollar volume of shares purchased or sold divided by average net asset
value in the time period.
"Expense ratio" is mean operating expenses and management fees divided by assets for the funds in the size
quintile.
"PCGE" is the mean potential capital gains exposure for the funds in the size quintile.
"Tax cost ratio" is the mean of the reduction in return due to taxes if all gains were realized.
"Percent of total assets" is the percent of the total assets of all funds in the sample in the asset size decile for
the mutual fund families.
"Percent of total mutual funds managed" is the percent of the total mutual funds managed by families in the
size decile.
5. Results
The tests of HI through H4 appear on Table 4 in panel A for equity funds and in panel
B for Fixed income funds.
The null hypothesis that there is no relation between returns and asset turnover (HI) is
rejected for both equity and fixed income funds. However, for equity funds there is a negative
relation between turnover and return as was expected. More frequent trading for equity funds
is associated with lower returns even after controlling for the net assets under management.
For fixed income funds, there is a significant positive relation between trading and return.
Net assets under management do not affect trading for fixed income funds. One explanation
for this positive relationship is that the management of bond funds may depend on control-
ling duration which requires trading but which has a relatively predictable effect on returns
as opposed to the uncertainty associated with trading in equities.
The null hypothesis that there is no relation between expense ratio and return (H2) is not
rejected for equity funds. There does not appear to be a relation between the expense ratio
and return for equity funds.
For fixed income funds, there is a significant negative relation between expense ratio and
11. R.J. Dowen, T. Mann / Financial Services Review 13 (2004) 79-91 89
Tahle 4
Tests of hypotheses t - 4 using regression analysis
A: Tests of H1-H4 for Equity Mutual Funds
Hypothesis Dependent F Value Adjusted Intercept Retum Log of
Variahle R-Square Assets
HI Turnover 24.48** .02 134.47*** -1.74*** -.93
(T-Value) (16.64) (-2.67) (-5.87)
H2 Expense Ratio 107.40*** .09 1 44*** -2.75 X 10"°-' -.08***
(T-Value) (50.95) (-1.20) (-14.14)
H3 PCGE 171.93*** .14 -55.66*** 6.96*** 4.93***
(T-Value) (-10.80) (16.69) (4.91)
H4 Tax Cost Ratio 83.86*** .07 1.67*** 06*** -.02**
(T-Value) (31.67) (12.95) (-2.16)
B: Tests of H1-H4 for Fixed Income Mutual Funds
Hypothesis Dependent F Value Adjusted Intercept Retum Log of
Variahle R-Square Assets
HI Turnover 10.46*** .02 82.12*** 8.83*** -.98
(T-Value) (5.36) (4.53) (-.36)
H2 Expense Ratio 140.86*** .22 1.04*** -.03*** -04***
(T-Value) (46.69) (-10.44) (-10.59)
H3 PCGE 231.73*** .32 -45.32*** 6.99*** .98**
(T-Value) (-16.88) (20.48) (2.08)
H4 Tax Cost Ratio 4.40** .01 1.81*** -.04*** .00
(T-Value) (15.50) (-2.91) (.00)
* Significant at .10 level
** Significant at .5 level
*** Significant at .01 level
HI - Trading activity is unrelated to market performance.
H2 - There is no relationship hetween performance and expense ratio.
H3 - Poorly performing funds will have the same PCGE as funds with good performance.
H4 - There is no relation hetween tax costs and returns.
return. The inconsistency in the results between equity and fixed income funds may again be
due to the fact that returns on fixed income securities are more controllable than retums on
equity securities. If that is true, then management efficiency in controlling costs becomes a
relatively more important matter for the fixed income funds.
There is a positive and significant relation hetween PCGE and retum (H3) for hoth equity
and fixed income funds. This is consistent with the idea that PCGE provides a measure ofthe
past success of the fund management.
For equity funds, there is a positive and significant relation hetween tax cost and retum
(H4). Fund management cannot produce retums without creating tax consequences for the
shareholders of the fund. For fixed income funds, there is a significant negative relation
between tax costs and retums. The result is probably infiuenced hy the large number of
municipal hond funds that invest in securities for which investors pay no tax on the interest
income that is generated.
There remain two questions that are addressed hy this article: whether there are economies
12. 90 R.J. Dowen, T. Mann / Financial Services Review 13 (2004) 79-91
Table 5
Test of hypothesis H5: economies of scale extend to the fund family level of organization
Type of Fund Dependent F Value Adjusted Intercept Fund Retum Fund Family
Variable R-Squared Assets Assets
Equity Expense Ratio 133.48*** .16 1.84*** -3.88 X 10"^* -.04** -.07***
(T-Value) (44.70) (-1.76) (-7.52) (-12.98)
Fixed Income Expense Ratio 102.84*** .24 1.16*** -.03*** -.03*** -.02***
(T-Value) (34.27) (-10.64) (-6.85) (-4.59)
* Significant at 0.10
** Significant at 0.05
*** Significant at 0.01
of scale and scope in mutual fund families. Economies of scale are addressed in Table 5.
Controlling for fund retum and fund assets, there is a negative and significant relation
between expense ratio and the total assets under management by a particular fund family.
The null hypothesis of no relation is rejected. The result is consistent with the possibility that
there are economies of scale in the mutual fund industry at the asset manager level as well
as at the individual fund level. For fixed income funds, a negative and significant relation
between expense ratio and the assets in a fund family is also present.
Economies of scope are addressed in Table 6. For both equity and fixed income funds, the
null hypotheses (H6) is rejected. The result is consistent with the idea that mutual fund
managers and investors benefit from economies of scope. Costs decrease as the variety of
types of funds increases.
6. Conclusions
We studied some aspects of mutual fund behavior. We found that over time, the managers
of larger funds and larger fund families produce greater retums at lower cost. Much of the
difference in performance is related to differences in portfolio objective and may be due to
the time period studied. The mutual fund industry is a concentrated industry with nearly three
fourths of the equity assets and more than 65% of the fixed income assets held by the largest
size decile. These larger funds had the lowest tax cost ratio. For the individual investor, the
conclusion that larger funds that are members of large fund families are more likely to
produce superior retums at lower cost is clear.
Table 6
Test of hypothesis H6: economies of scope extend to the fund family
Type of Fund Dependent F Value Adjusted Intercept Fund Retum Fund Funds Managed
Variable R-Square Assets By Family
Equity Expense Ratio 98.83*** .12 1 50*** 3.68 X 10"^ _ 07*** -3.28 X 1O"3***
(T-Value) (52.42) (-1.63) (-12.70) (-8.62)
Fixed Income Expense Ratio 102.26*** .23 1.06*** _ 03*** _ 04*** -1.19 X 10^3***
(T-Value) (47.23) (-10.63) (-8.91) (-4.44)
13. R.J. Dowen, T. Mann /Financiat Services Review 13 (2004) 79-91 91
Equity managers who trade less tended to produce greater returns while fixed income
managers who traded more tended to produce greater returns. This may be due to the greater
predictability of fixed income returns and the reliance of fixed income fund managers on
models emphasizing the control of such factors as duration and convexity.
Both equity and fixed income funds managers who produce better returns manage their
funds at lower cost. On average, costs are less than 1% of assets. The greatest costs are
associated with aggressive growth stock funds. The lowest with high quality corporate bond
funds and government related adjustable rate mortgage bonds.
Funds that experienced strong returns in the past will have significantly greater Potential
Capital Gain Exposure than other funds since they will a greater number of appreciated
assets. On average, PCGE is negative across all fund classes. In some cases the unrecognized
capital loss is quite substantial. The SEC requires that PCGE be reported in order to alert
shareholders to potential future tax liabilities. Instead investors may consider high PCGE as
the hallmark of funds that performed well in the past.
We confirm the Latzko (1999) finding that mutual fund cost ratios are consistent with the
existence of economies of scale. Building on Latzko as well as Malhotra and McLeod, we
show that the economies of scale exist at both the fund level and the fund family level. We
find the cost structure in the mutual fund industry to be consistent with the existence of
economies of scope, in that cost ratios for individual funds decrease as the number of
different types of funds controlled by the asset manager increase.
Acknowledgments
The authors express their thanks to an anonymous referee for his helpful suggestions
which greatly improved the paper. All remaining errors and omissions belong to the authors.
References
Ang, J., Chen, C. R., & Wuh Lin, J. (1998). Mutual fund managers' efforts and performance. Joumat of Investing
7, 68-75.
Berkowitz, M. K., & Yehuda, K. (2002). Managerial quality and the structure of management expenses in the
U. S. mutual fund industry. Intemationat Review of Economics and Finance, 11, 315-330.
Droms, W., & Walker, D. A. (2001). Persistence of mutual fund operating characteristics: Returns, turnover rates,
and expense ratios. Apptied Financiat Economics, 11, 457-466.
Golec, J. (2003). Regulation and the rise in asset-based mutual fund management fees. Joumat of Financiat
Research, 26, 19-30.
Latzko, D. A. (1999). Economies of scale in the mutual fund industry. Joumat of Financiat Research, 22
331-340.
Malhotra, D. K., & McLeod, R. W. (1997). An empirical analysis of mutual fund expenses. Joumat of Financiat
Research, 20, 175-190.
U. S. Securities and Exchange Commission. (2000). Final rule: disclosure of mutual, fund after-tax returns, 17
CER Parts 230, 239, 270 and 274.