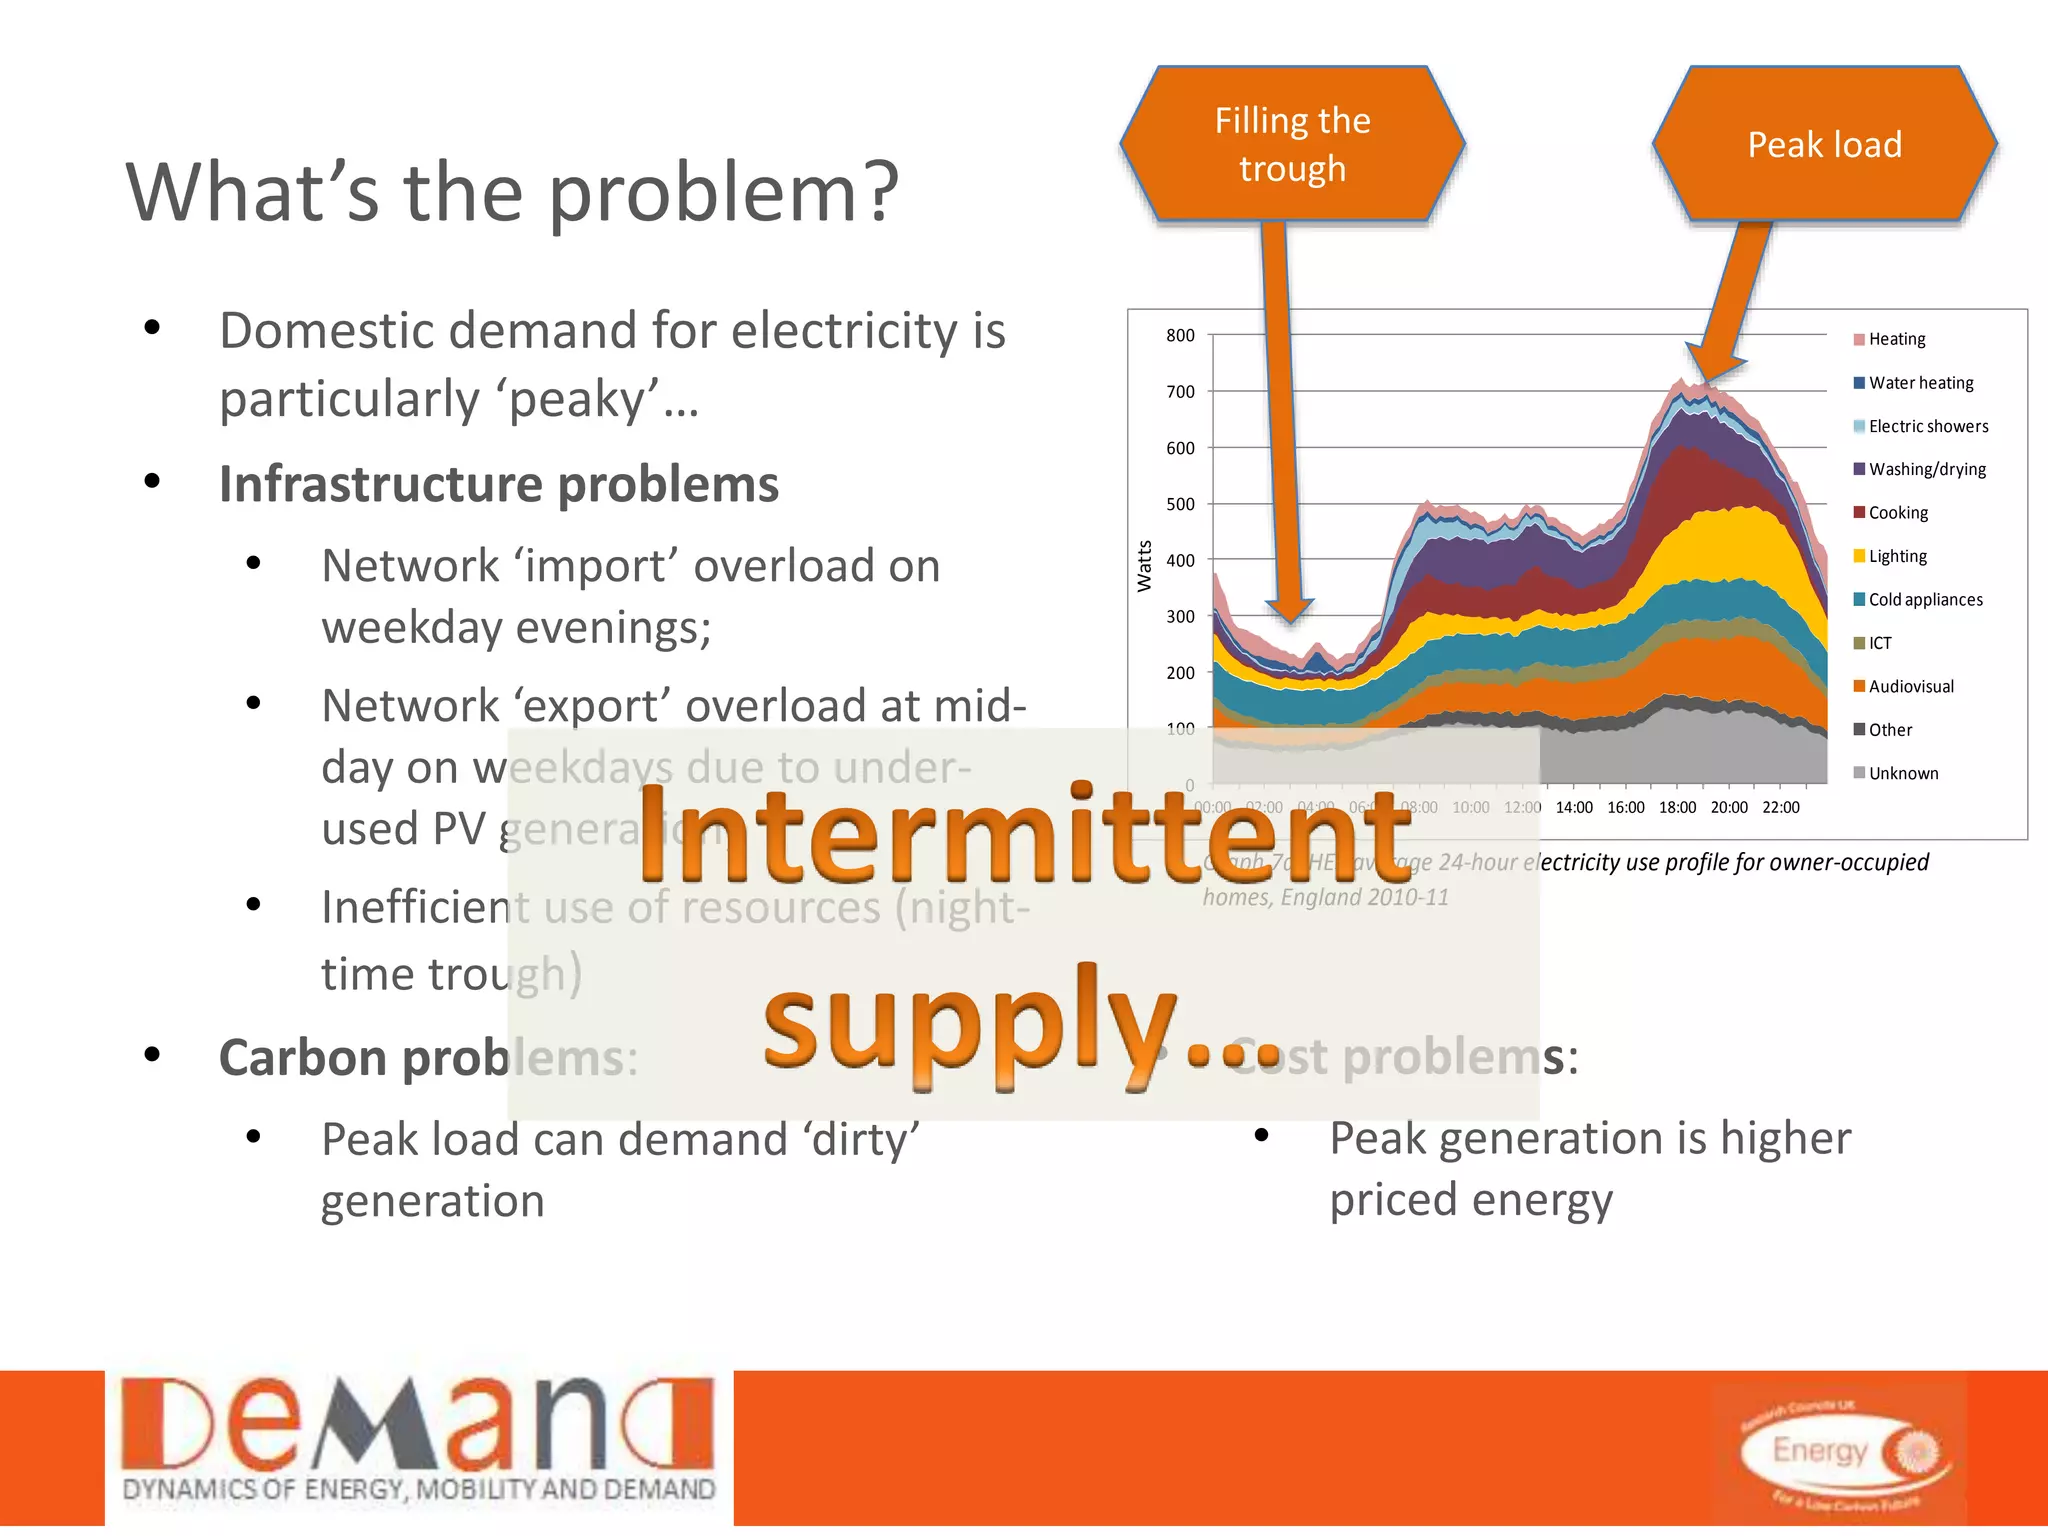
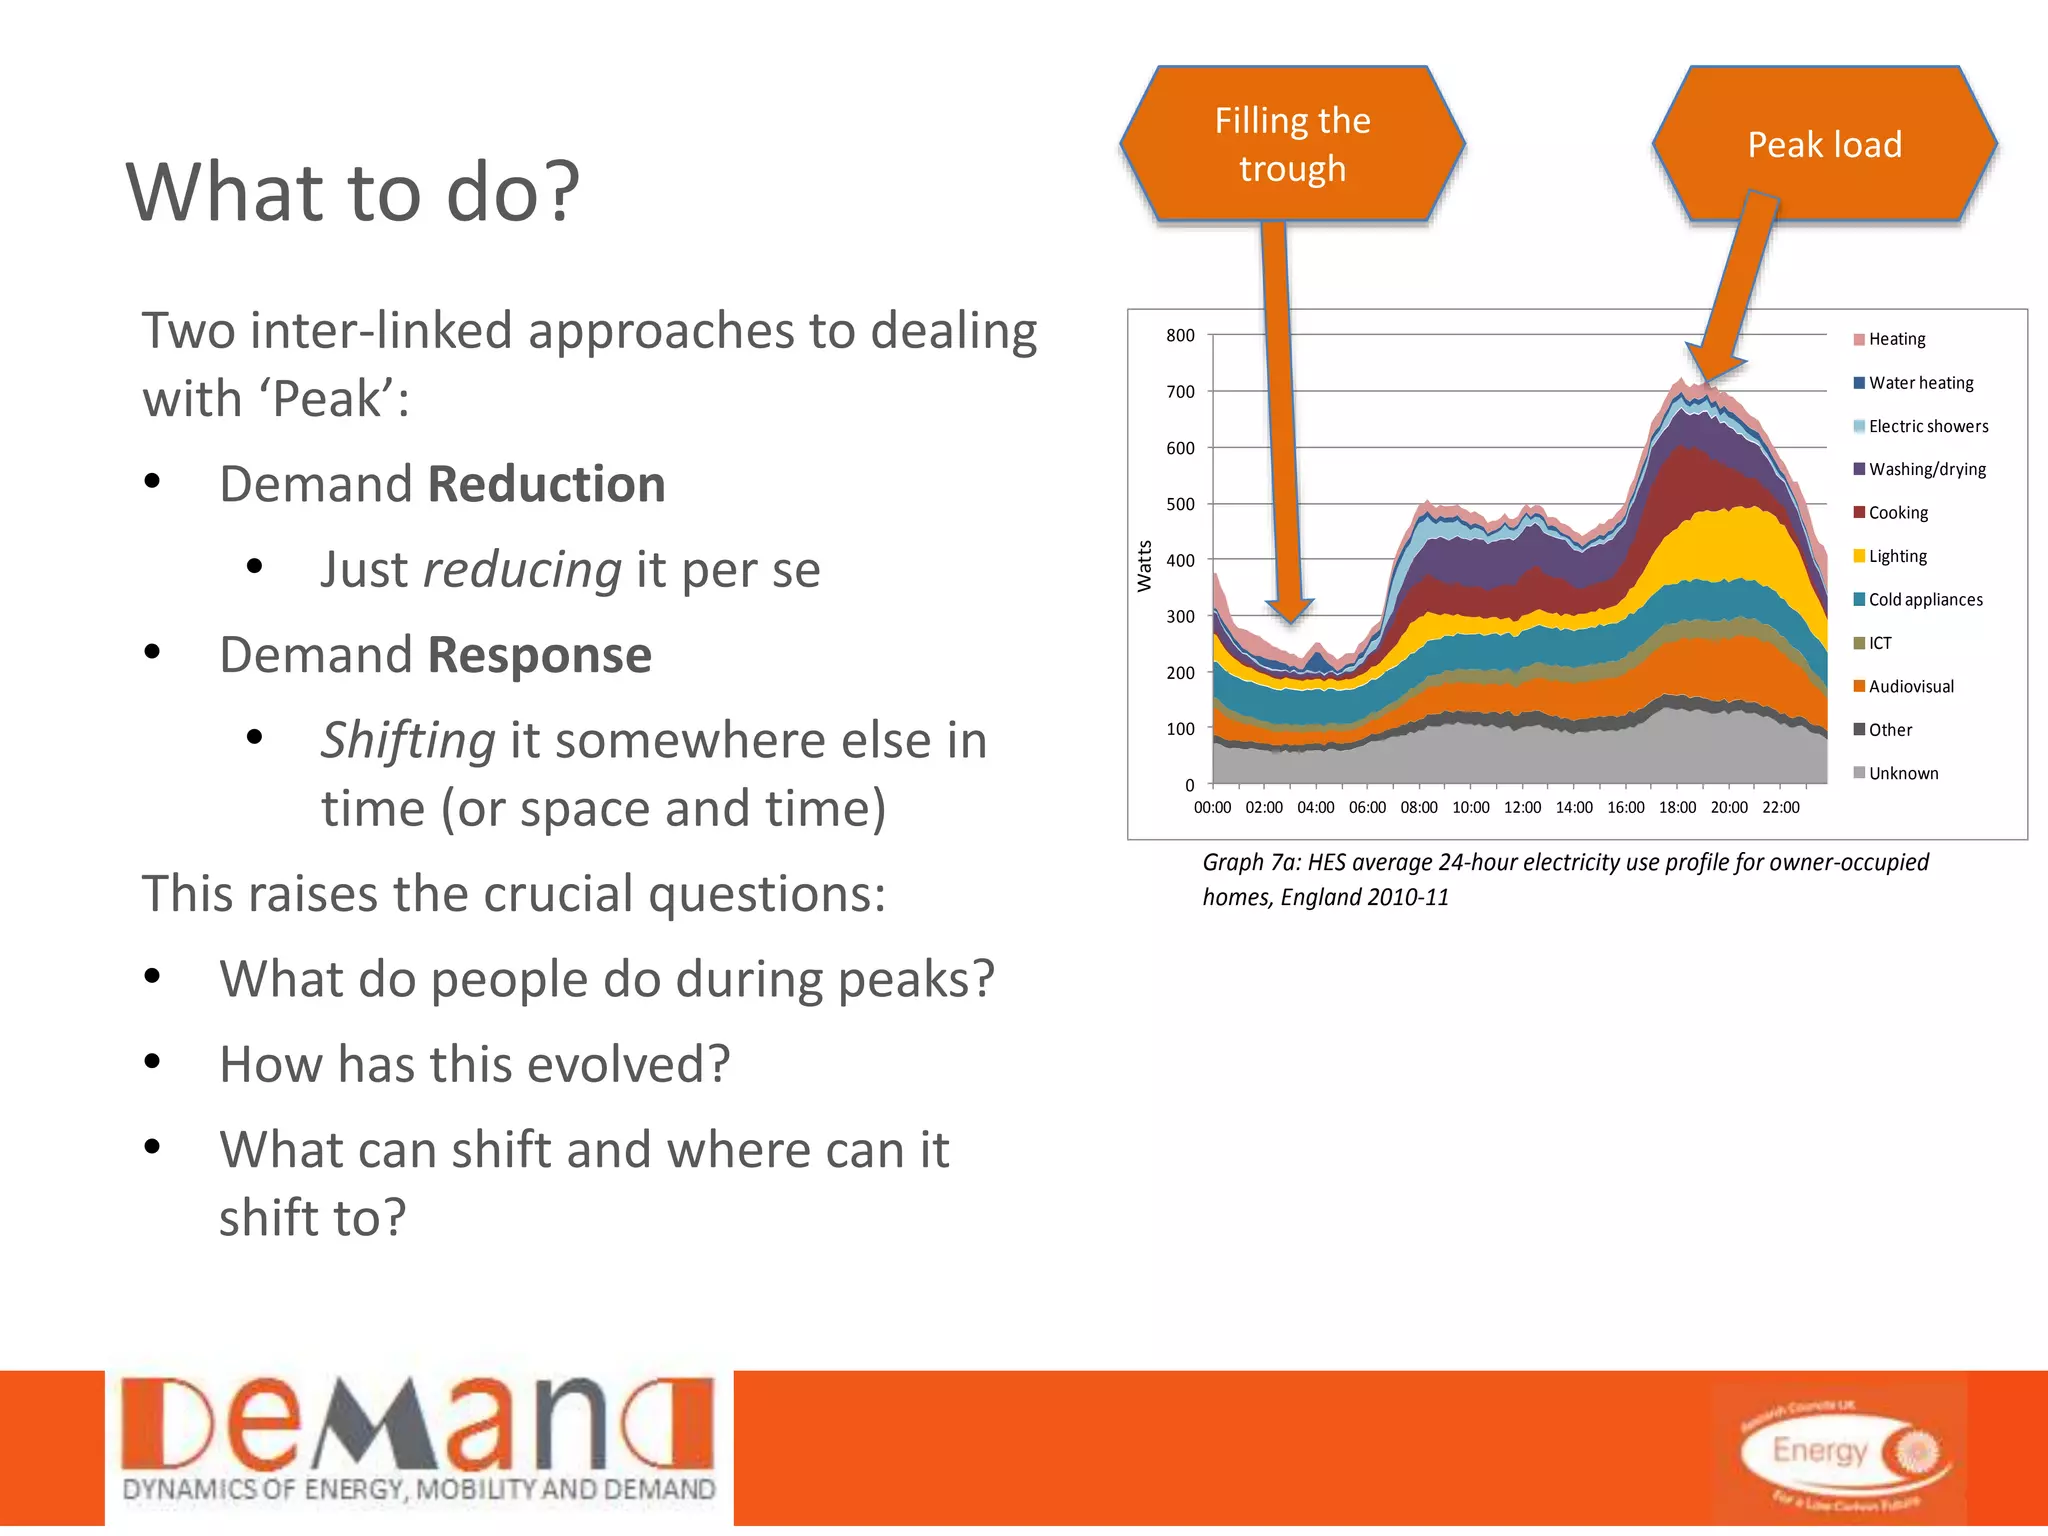
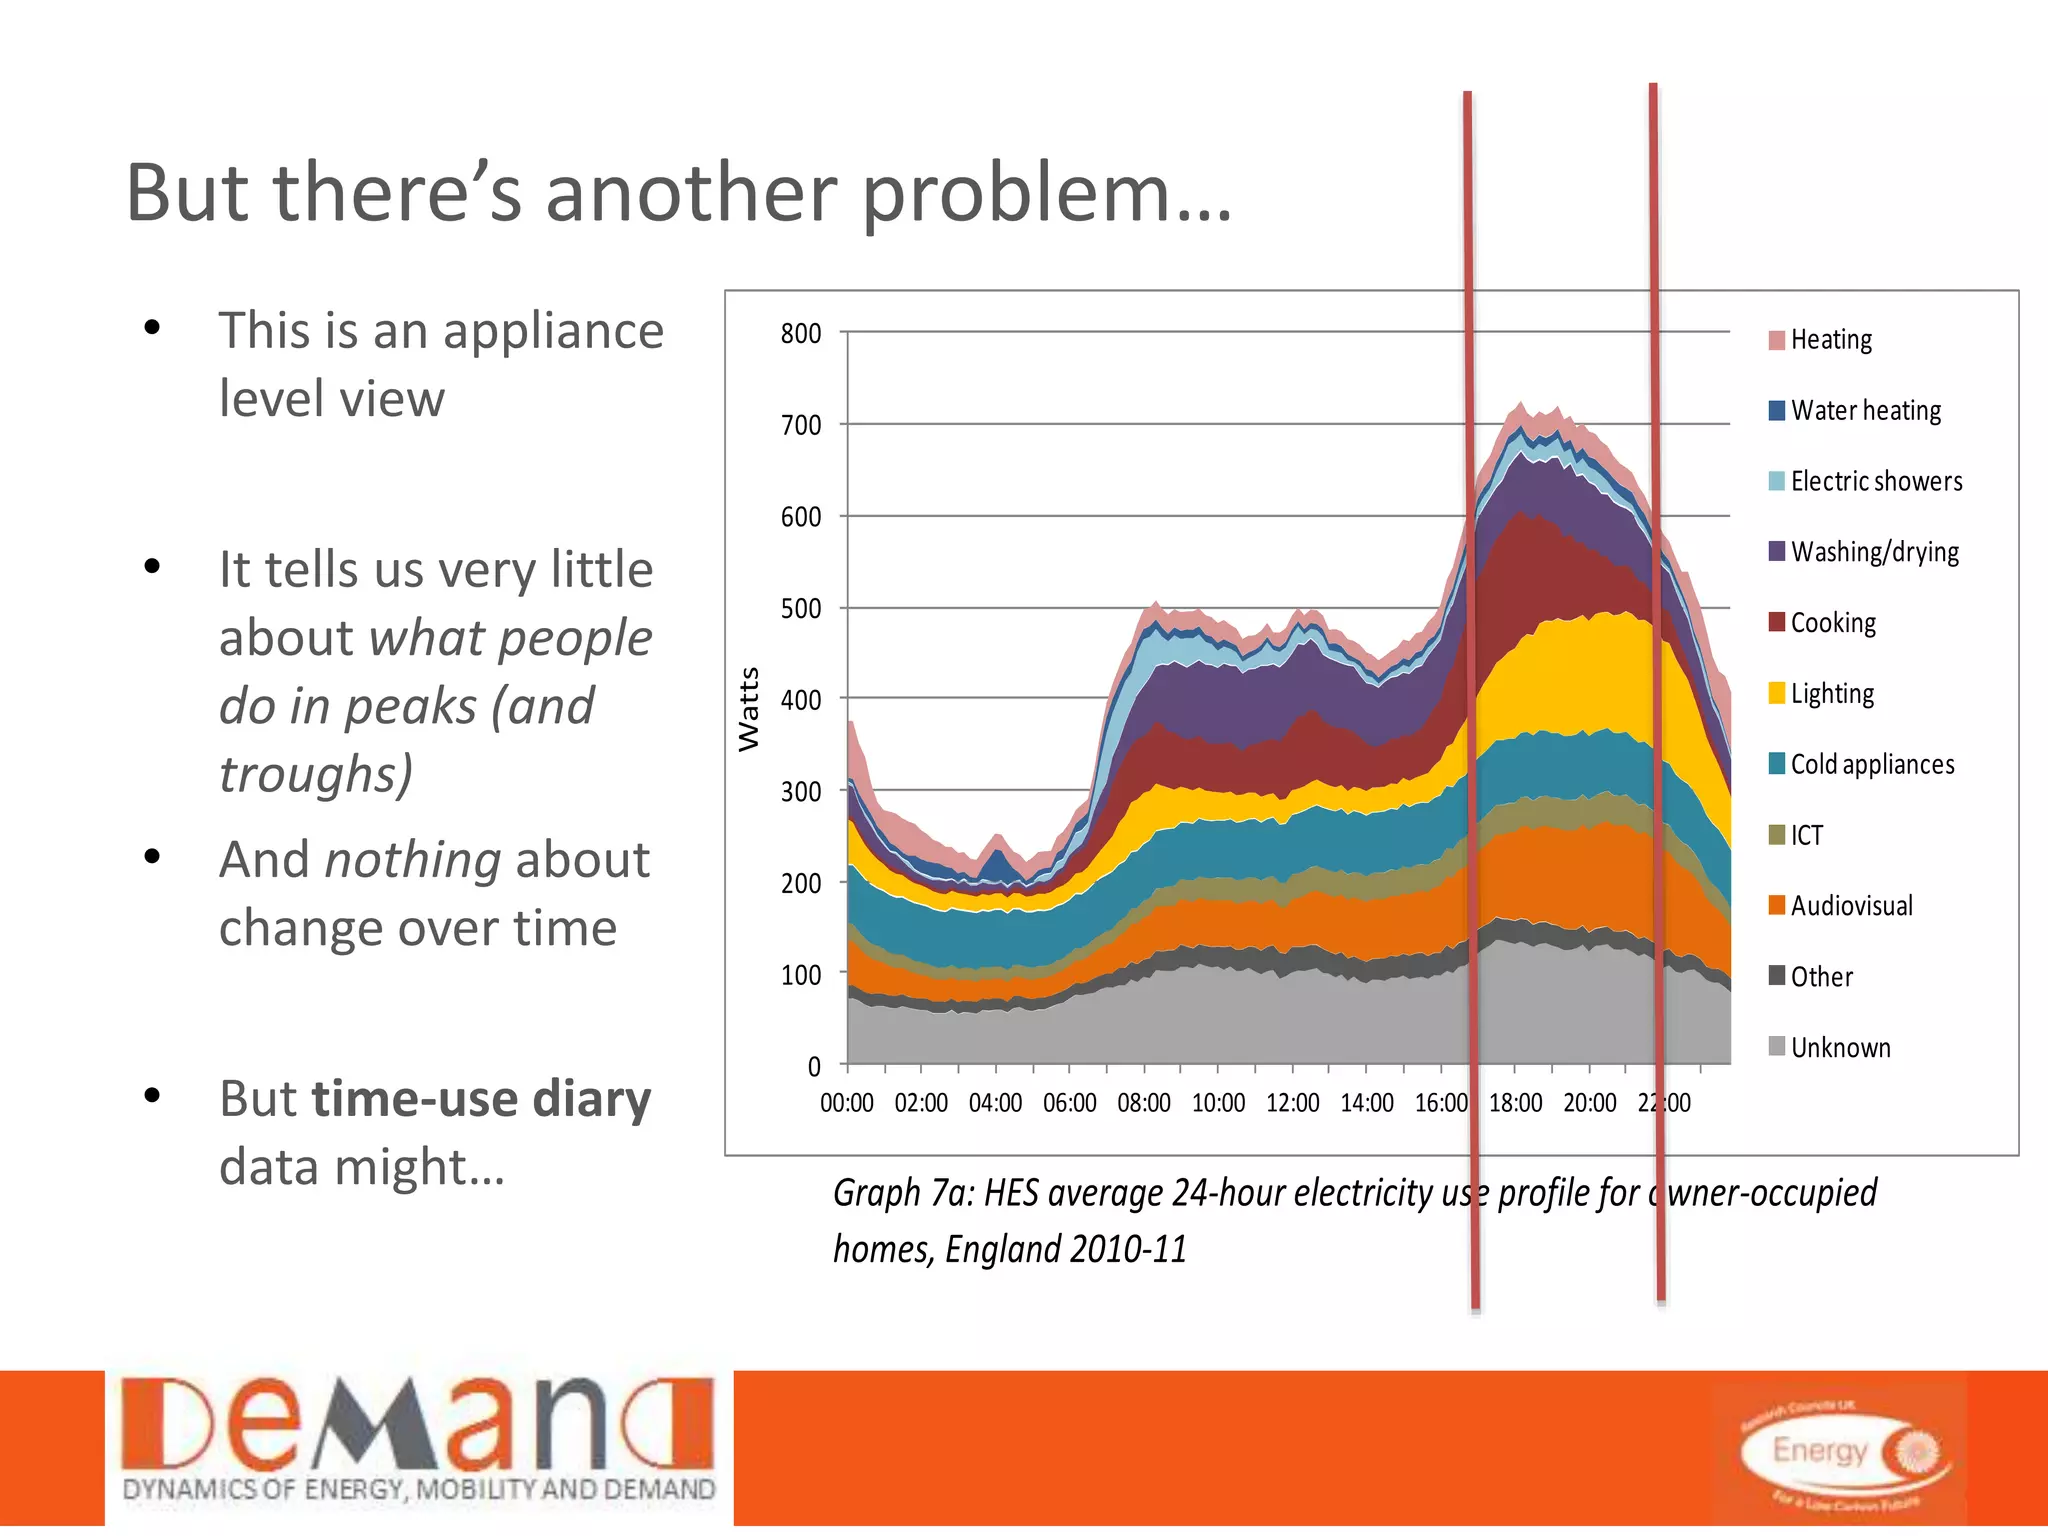
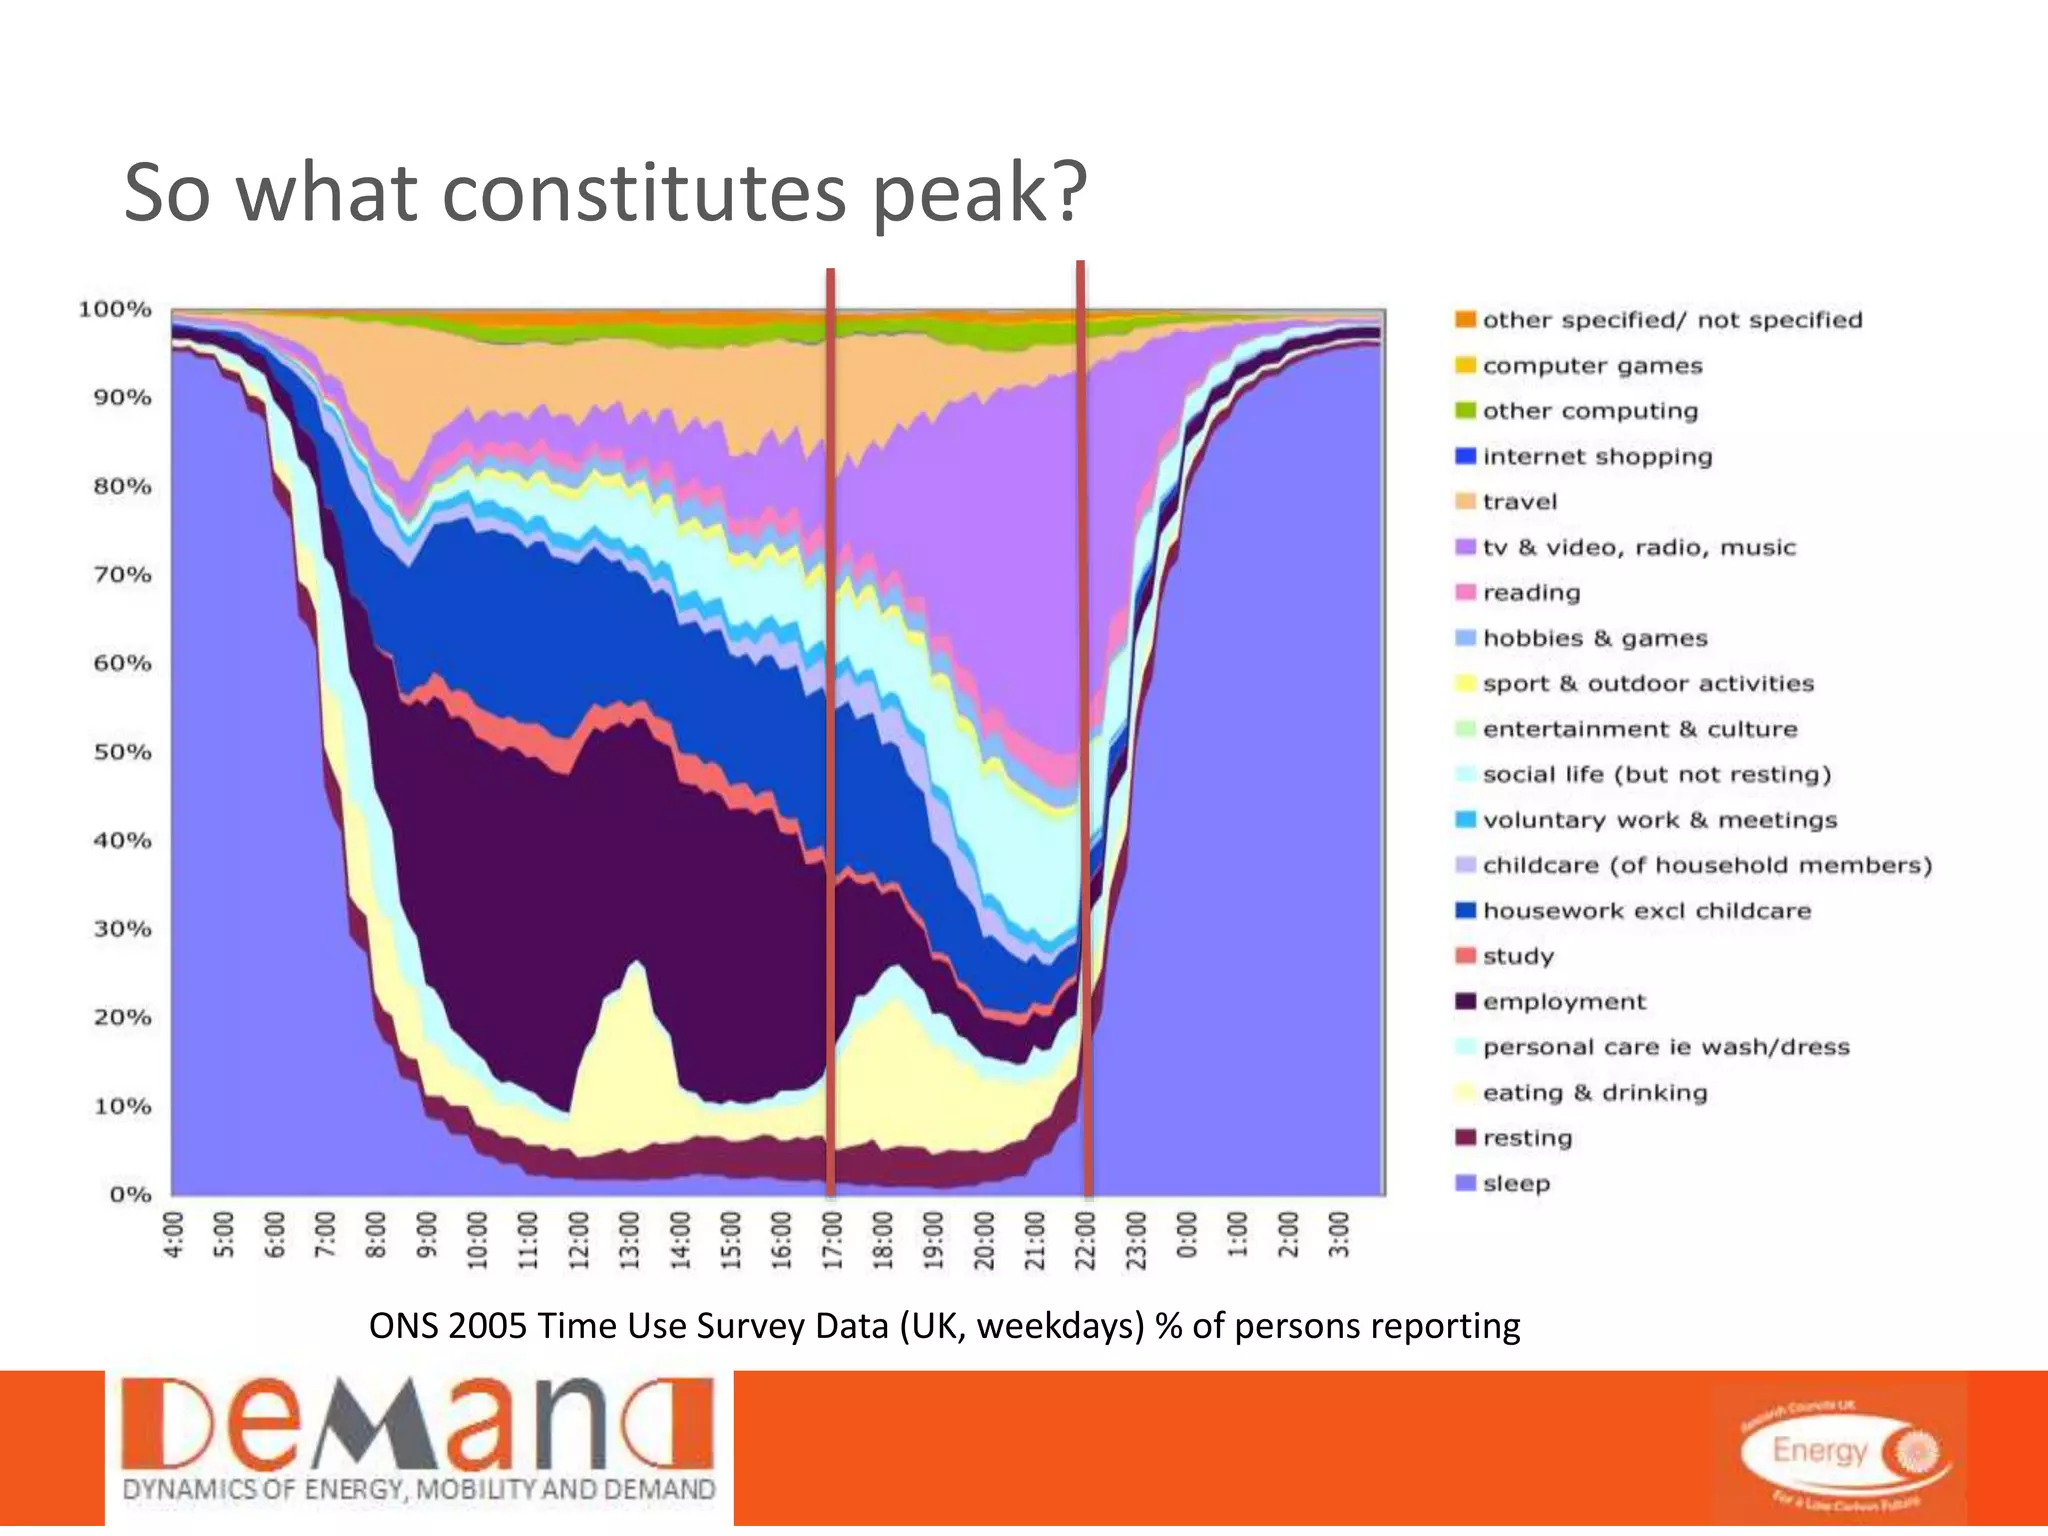
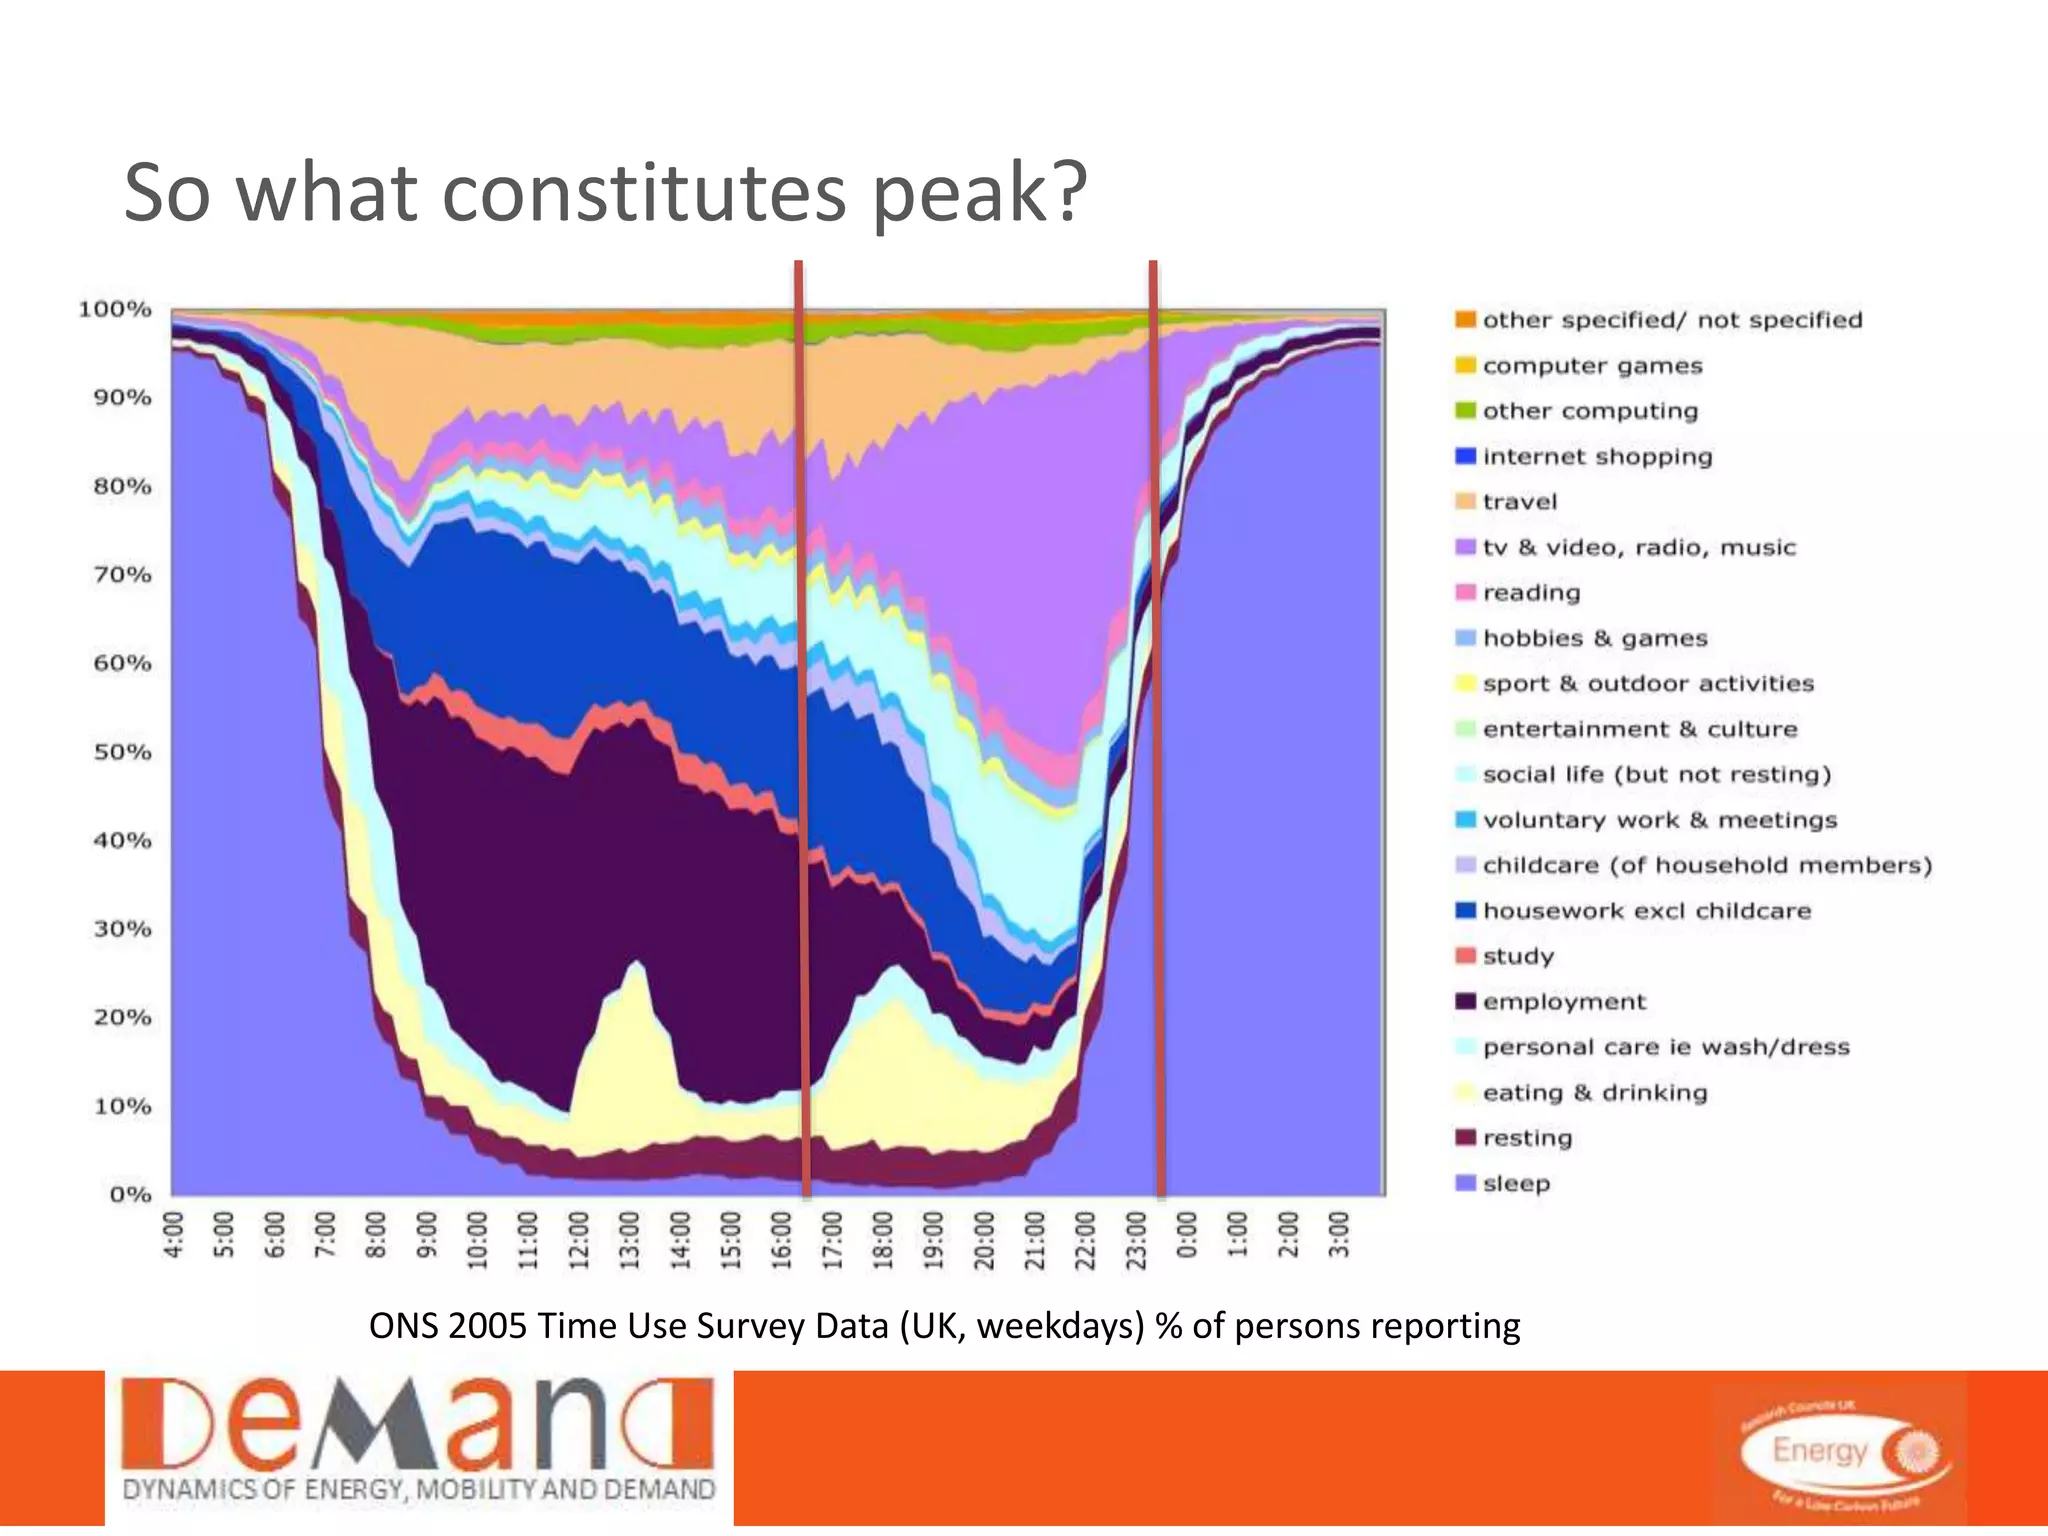
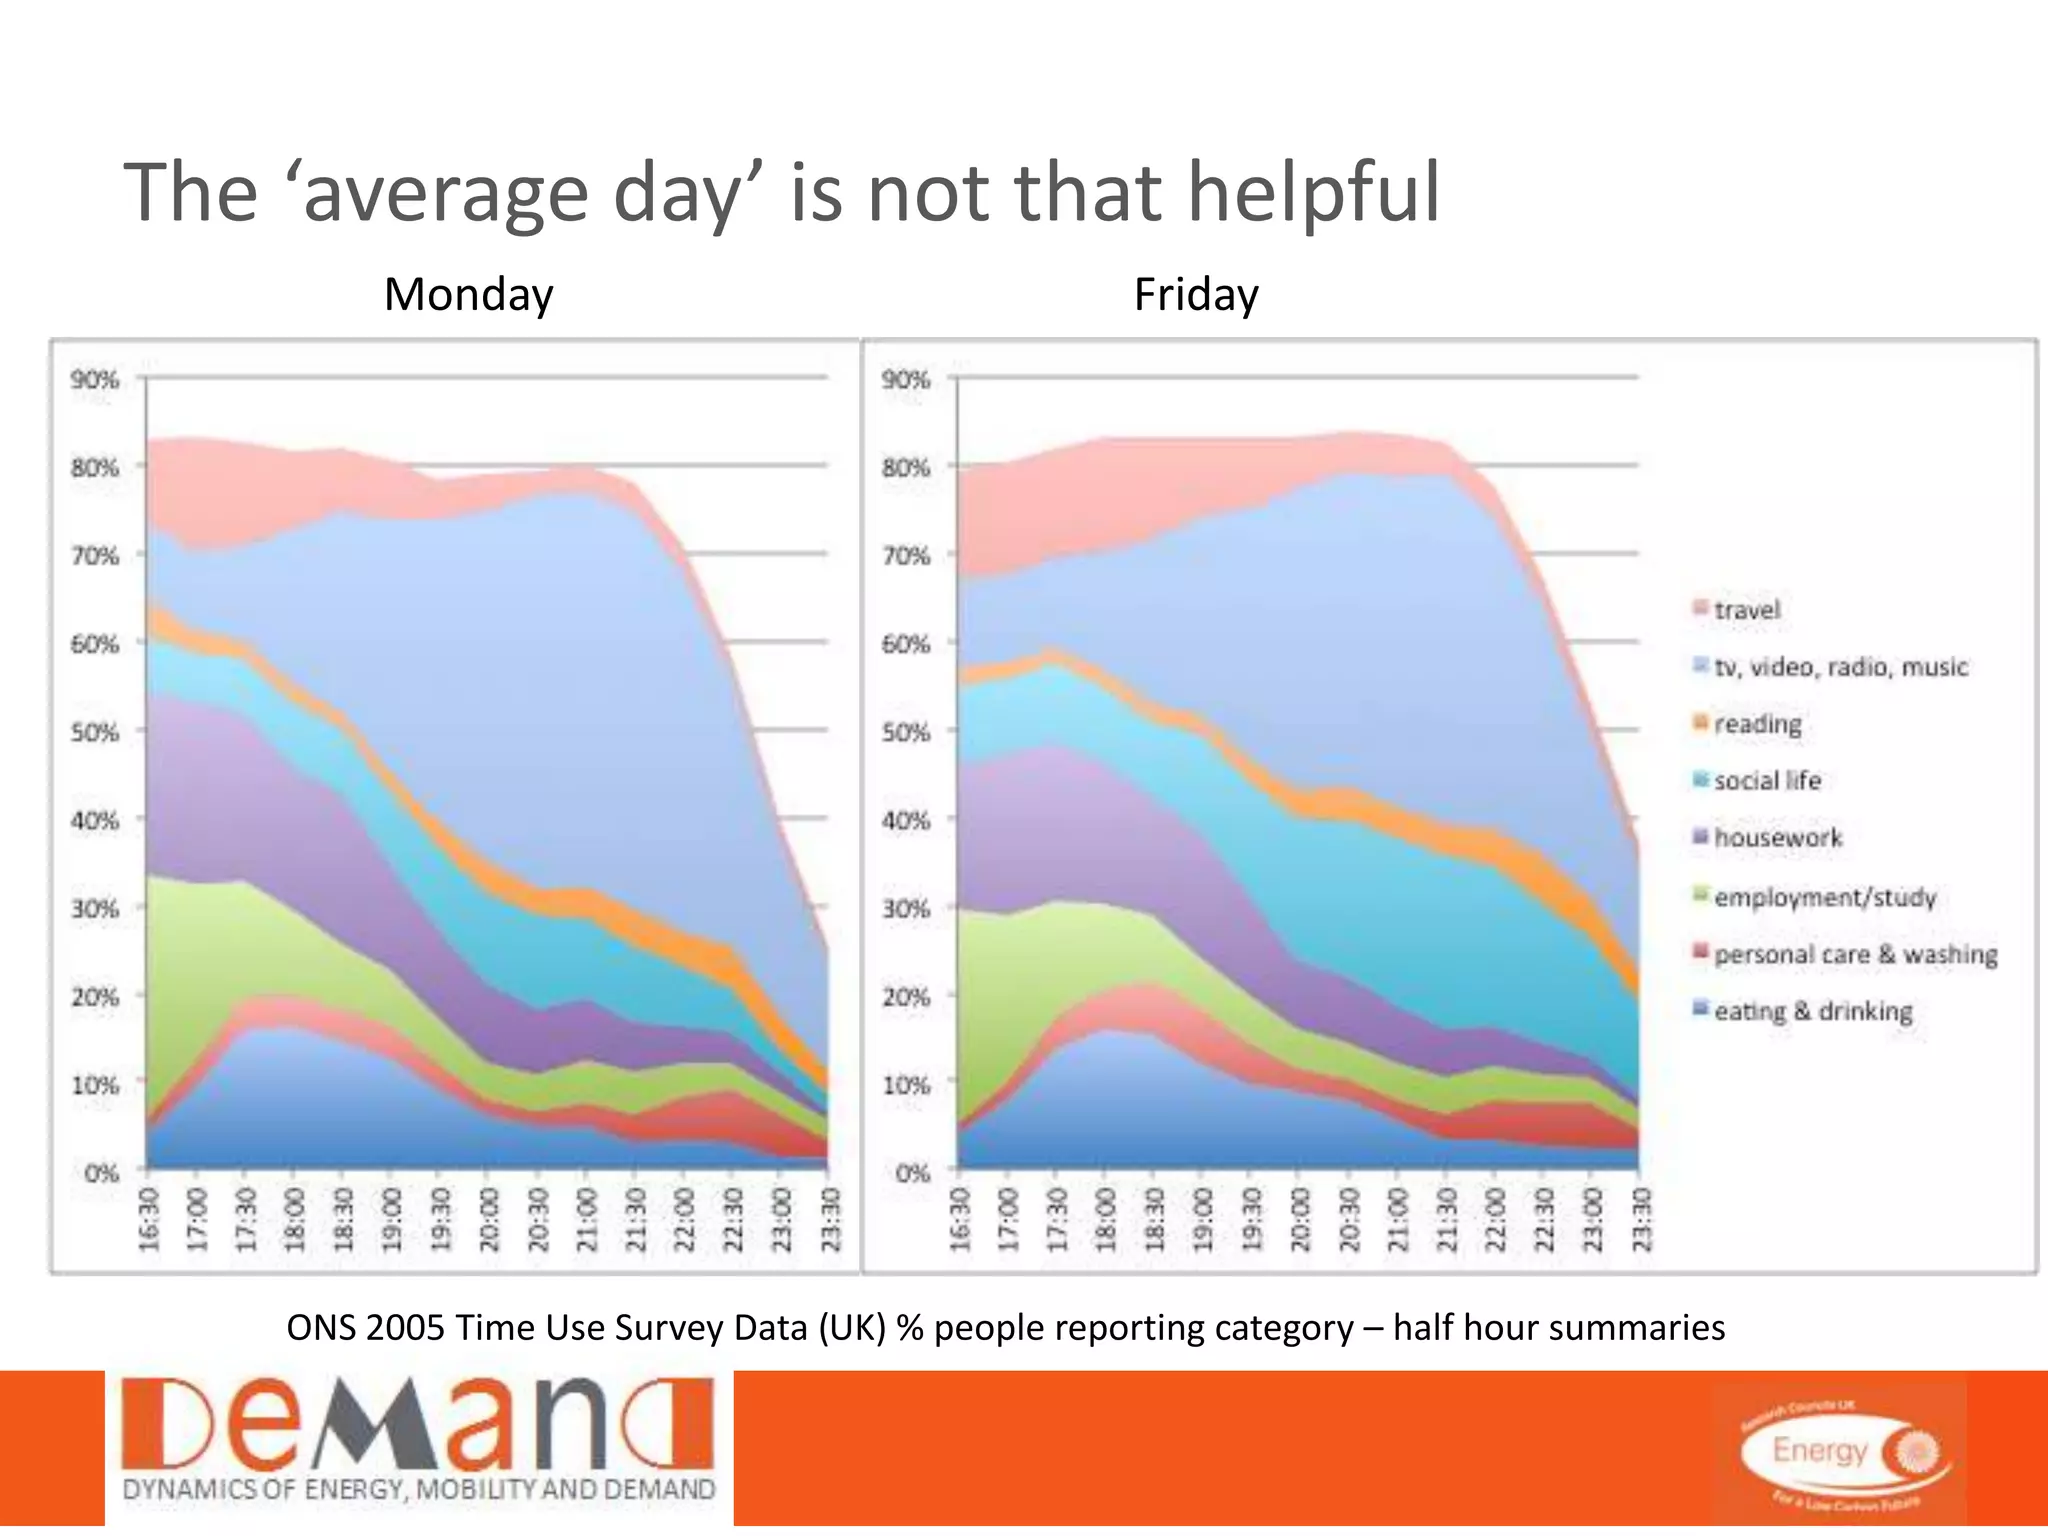
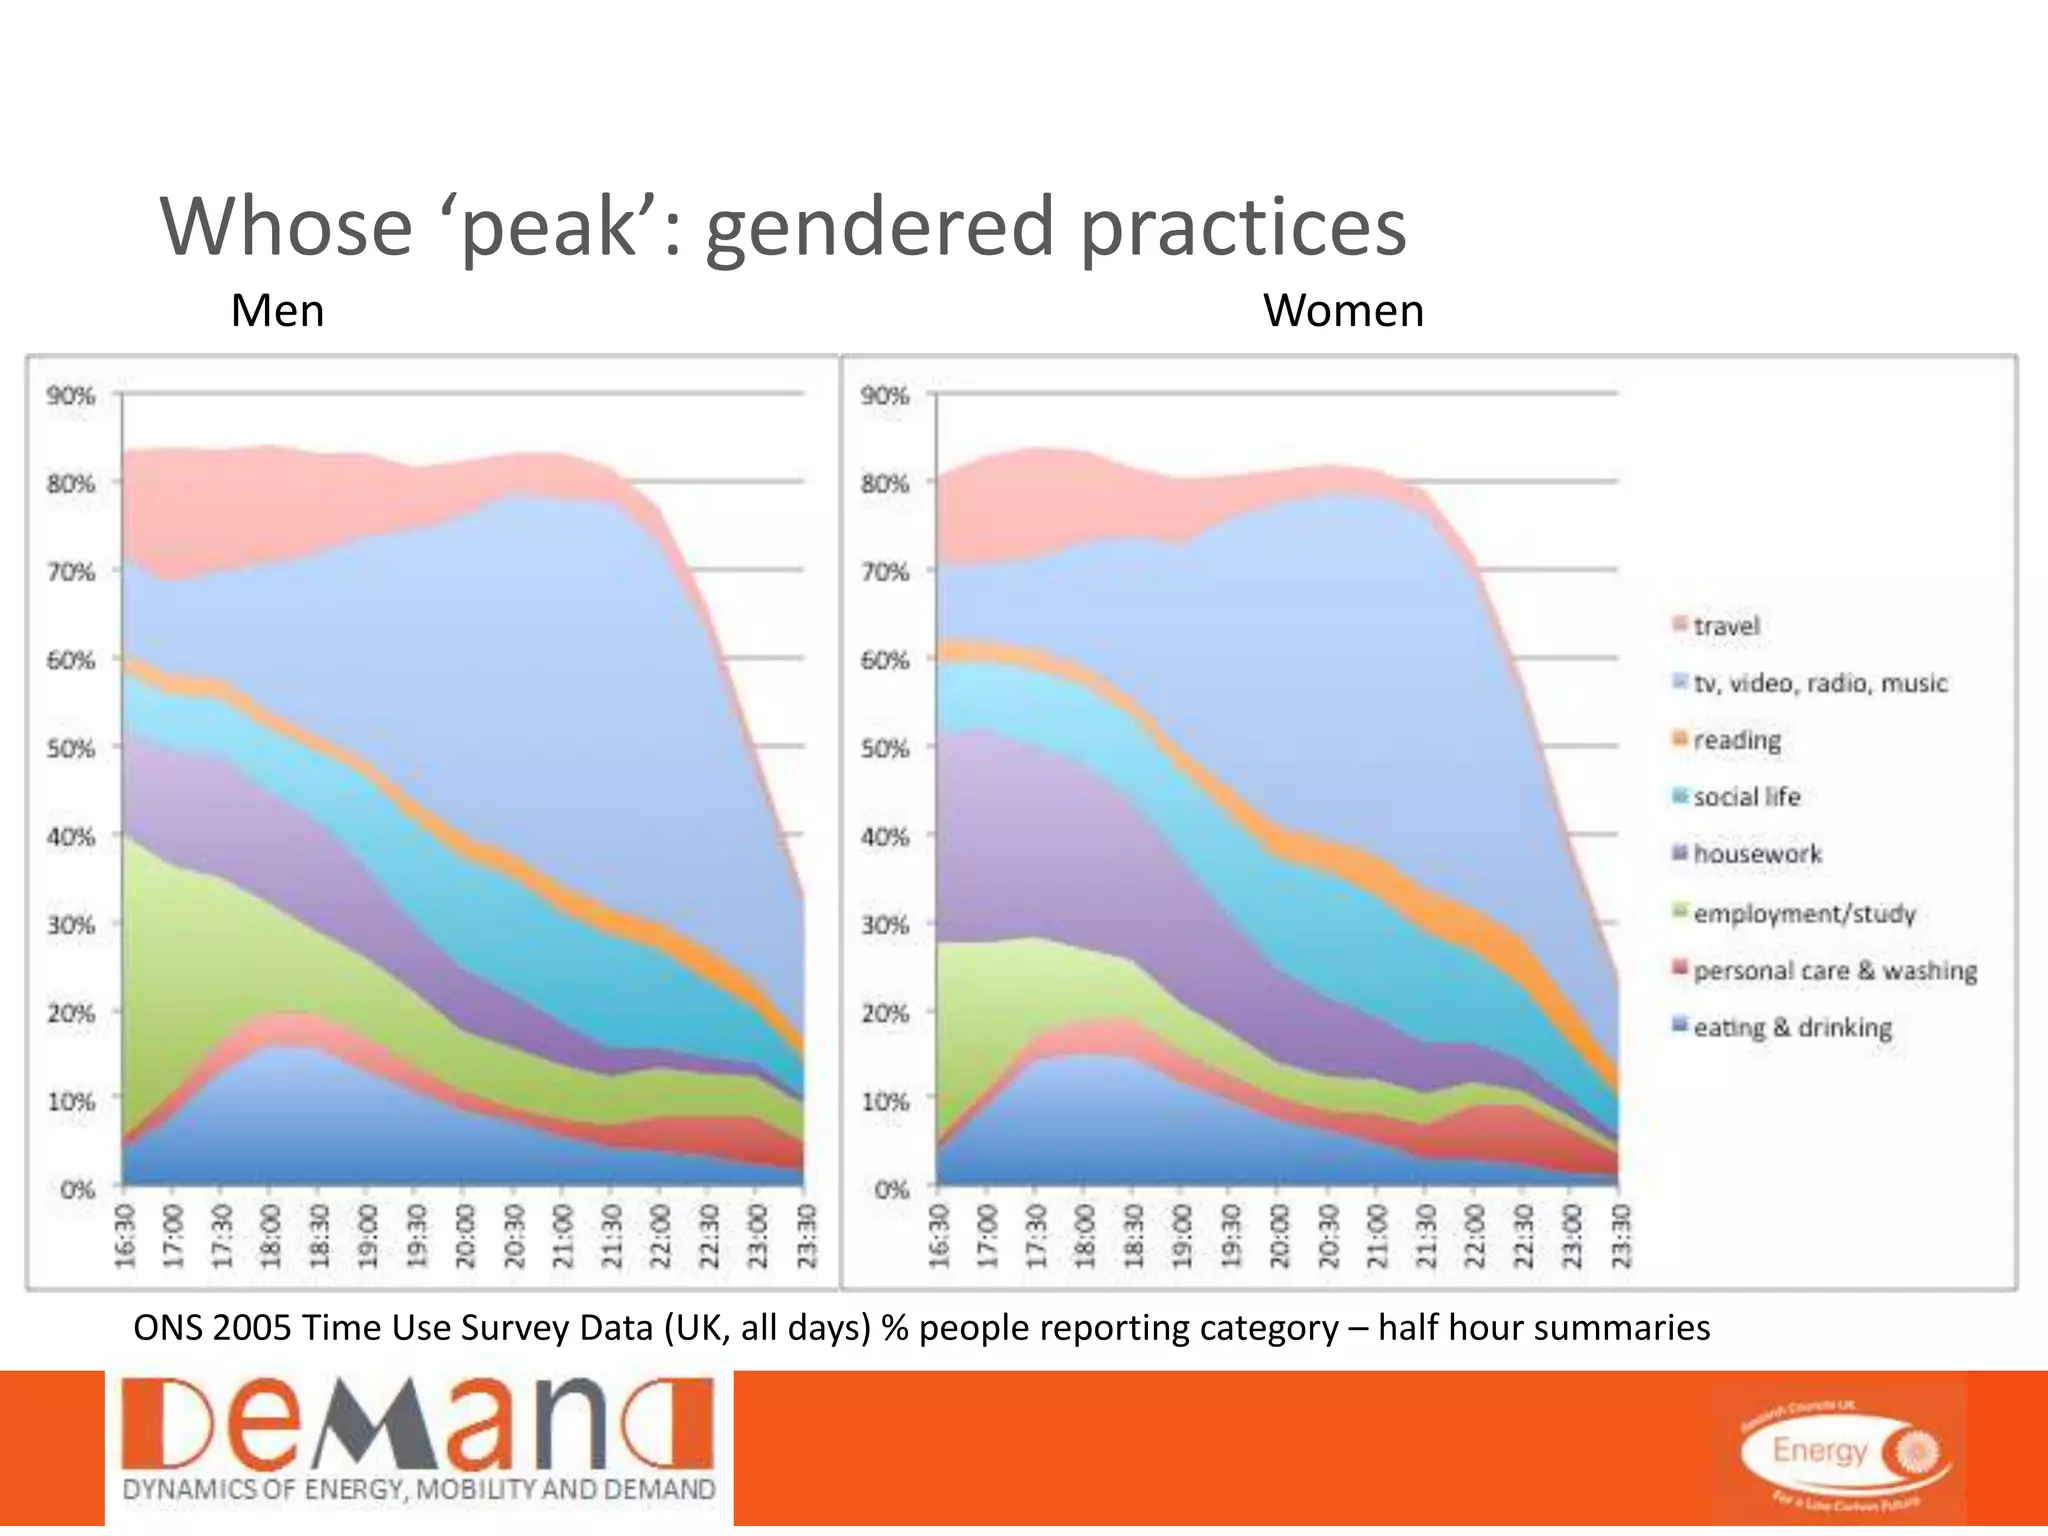
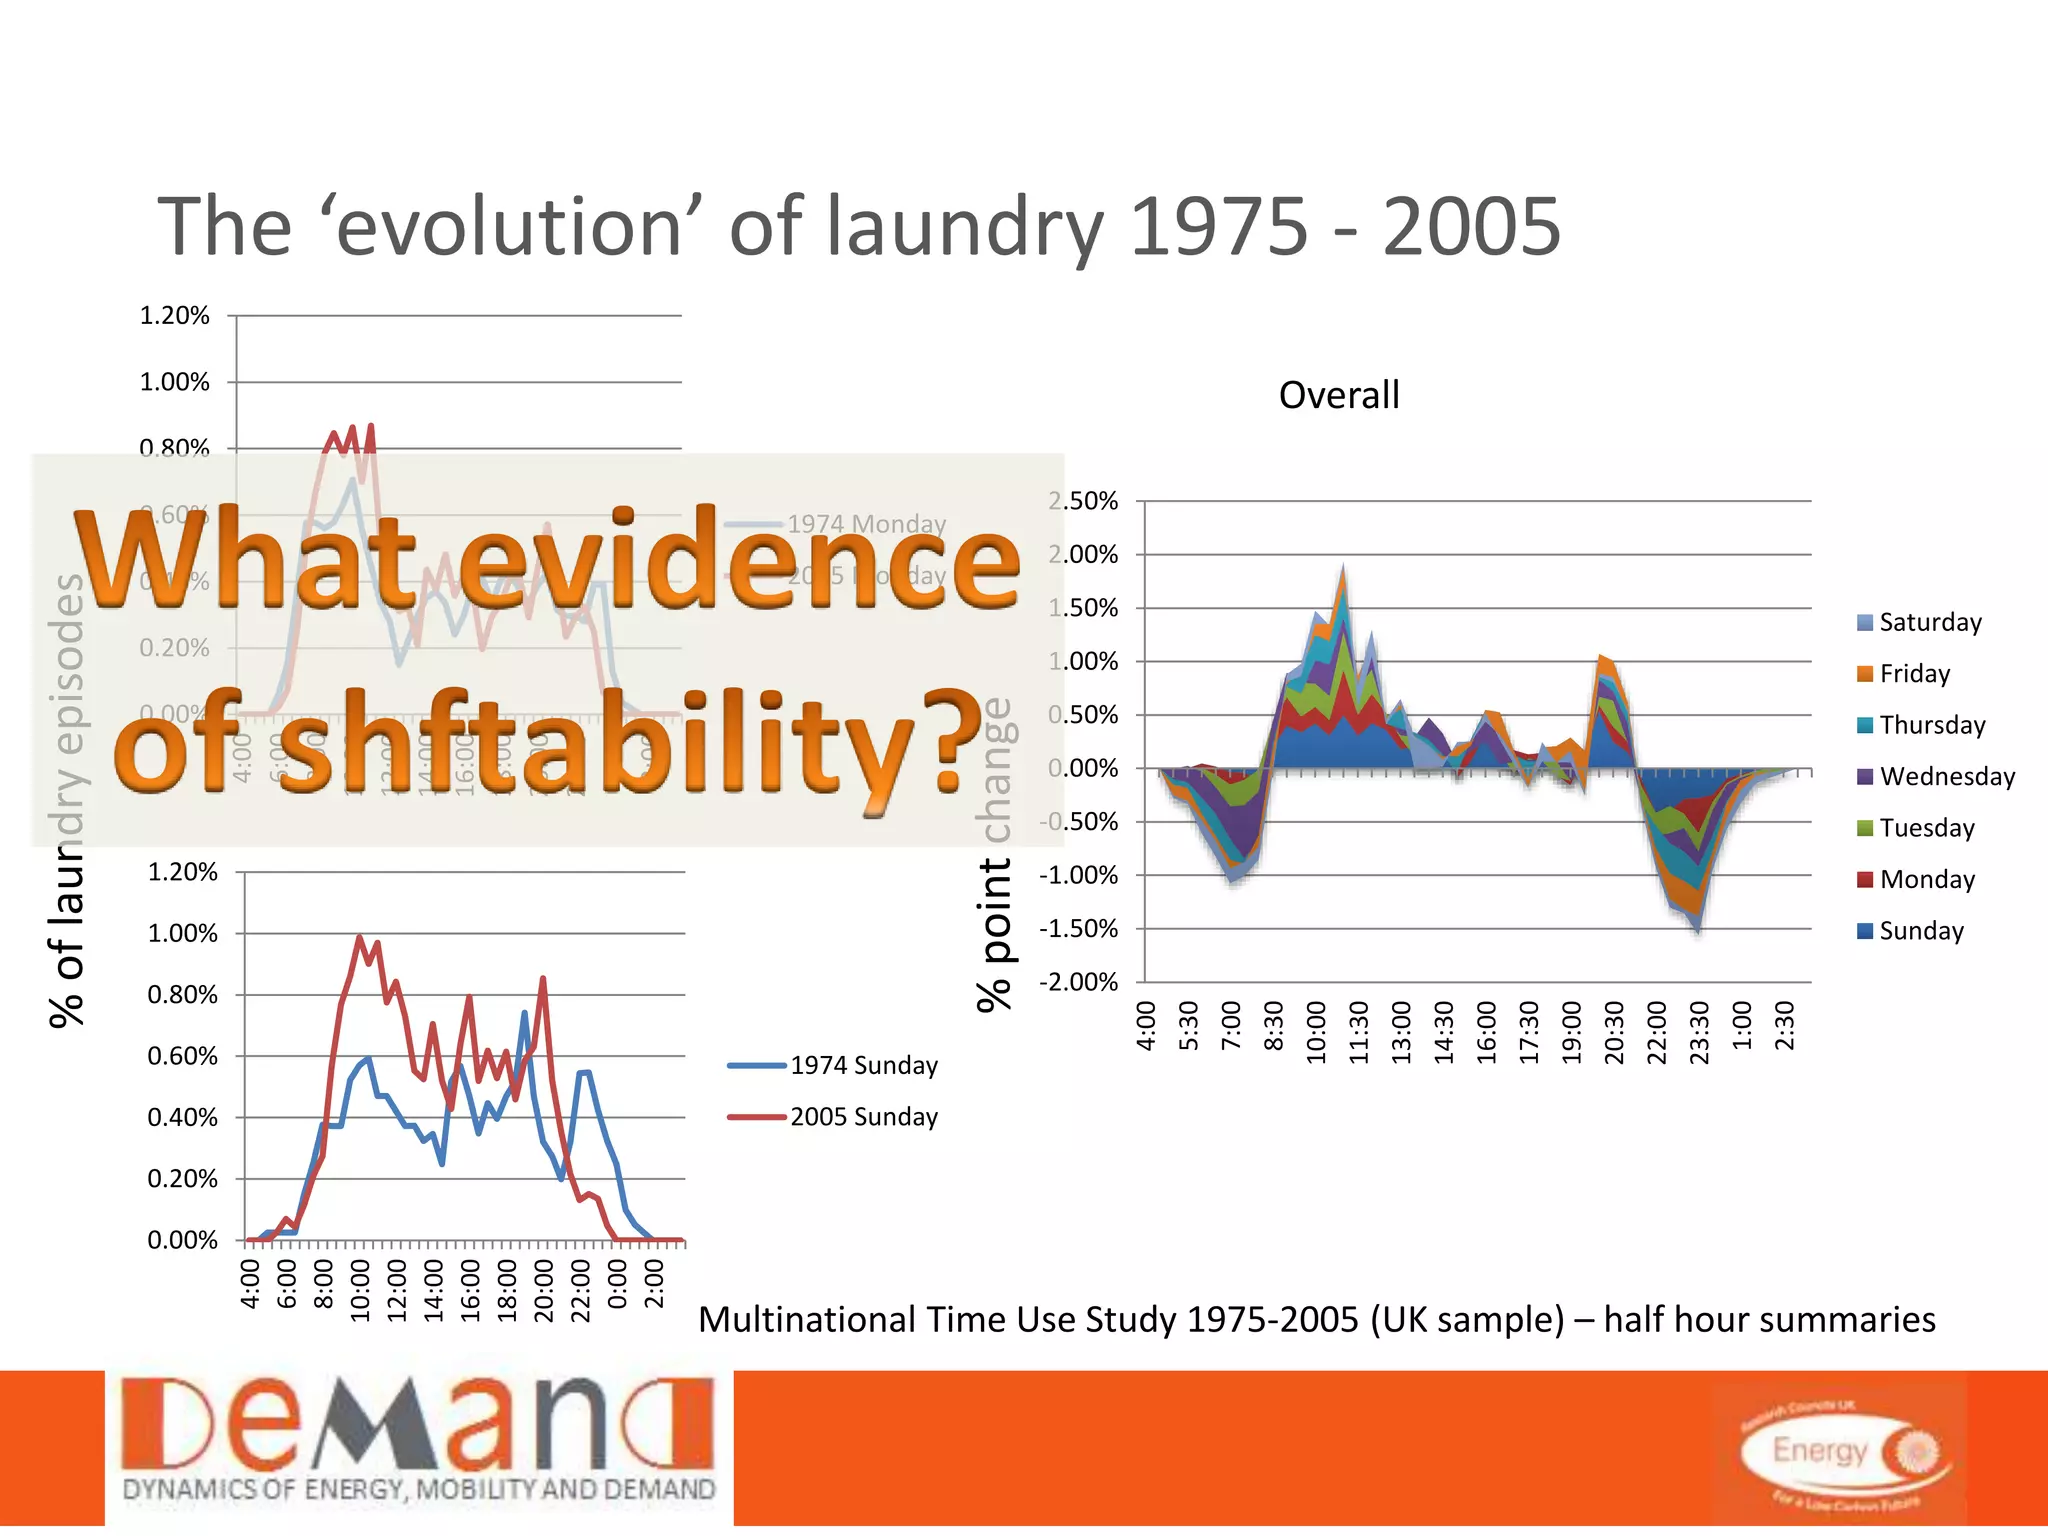
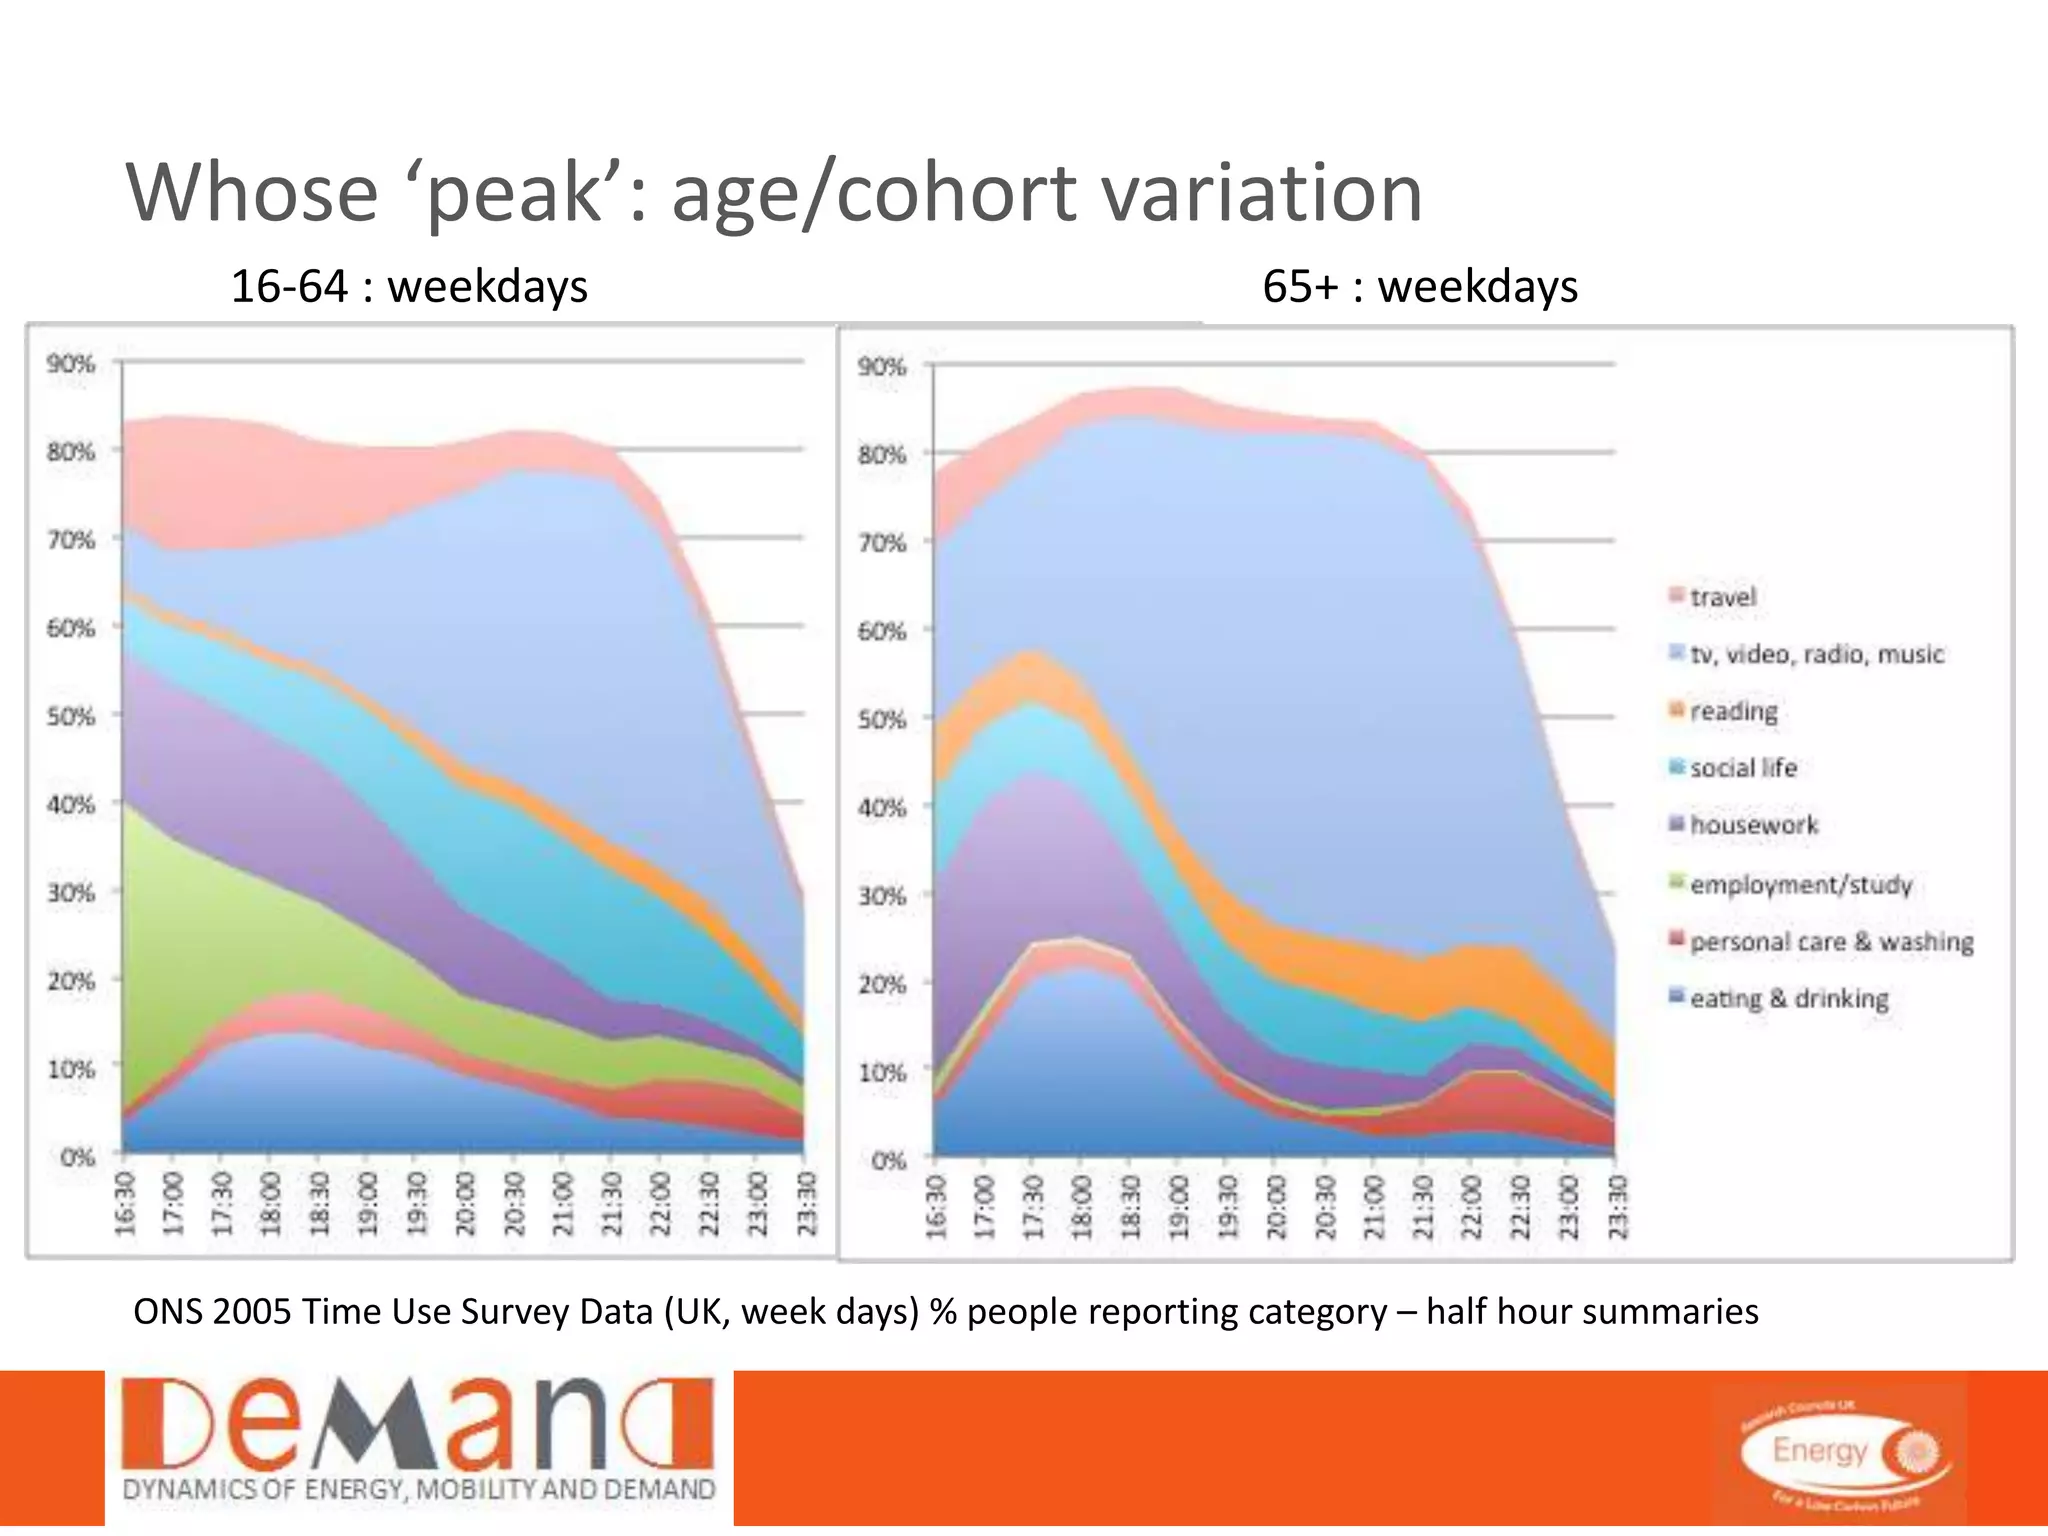
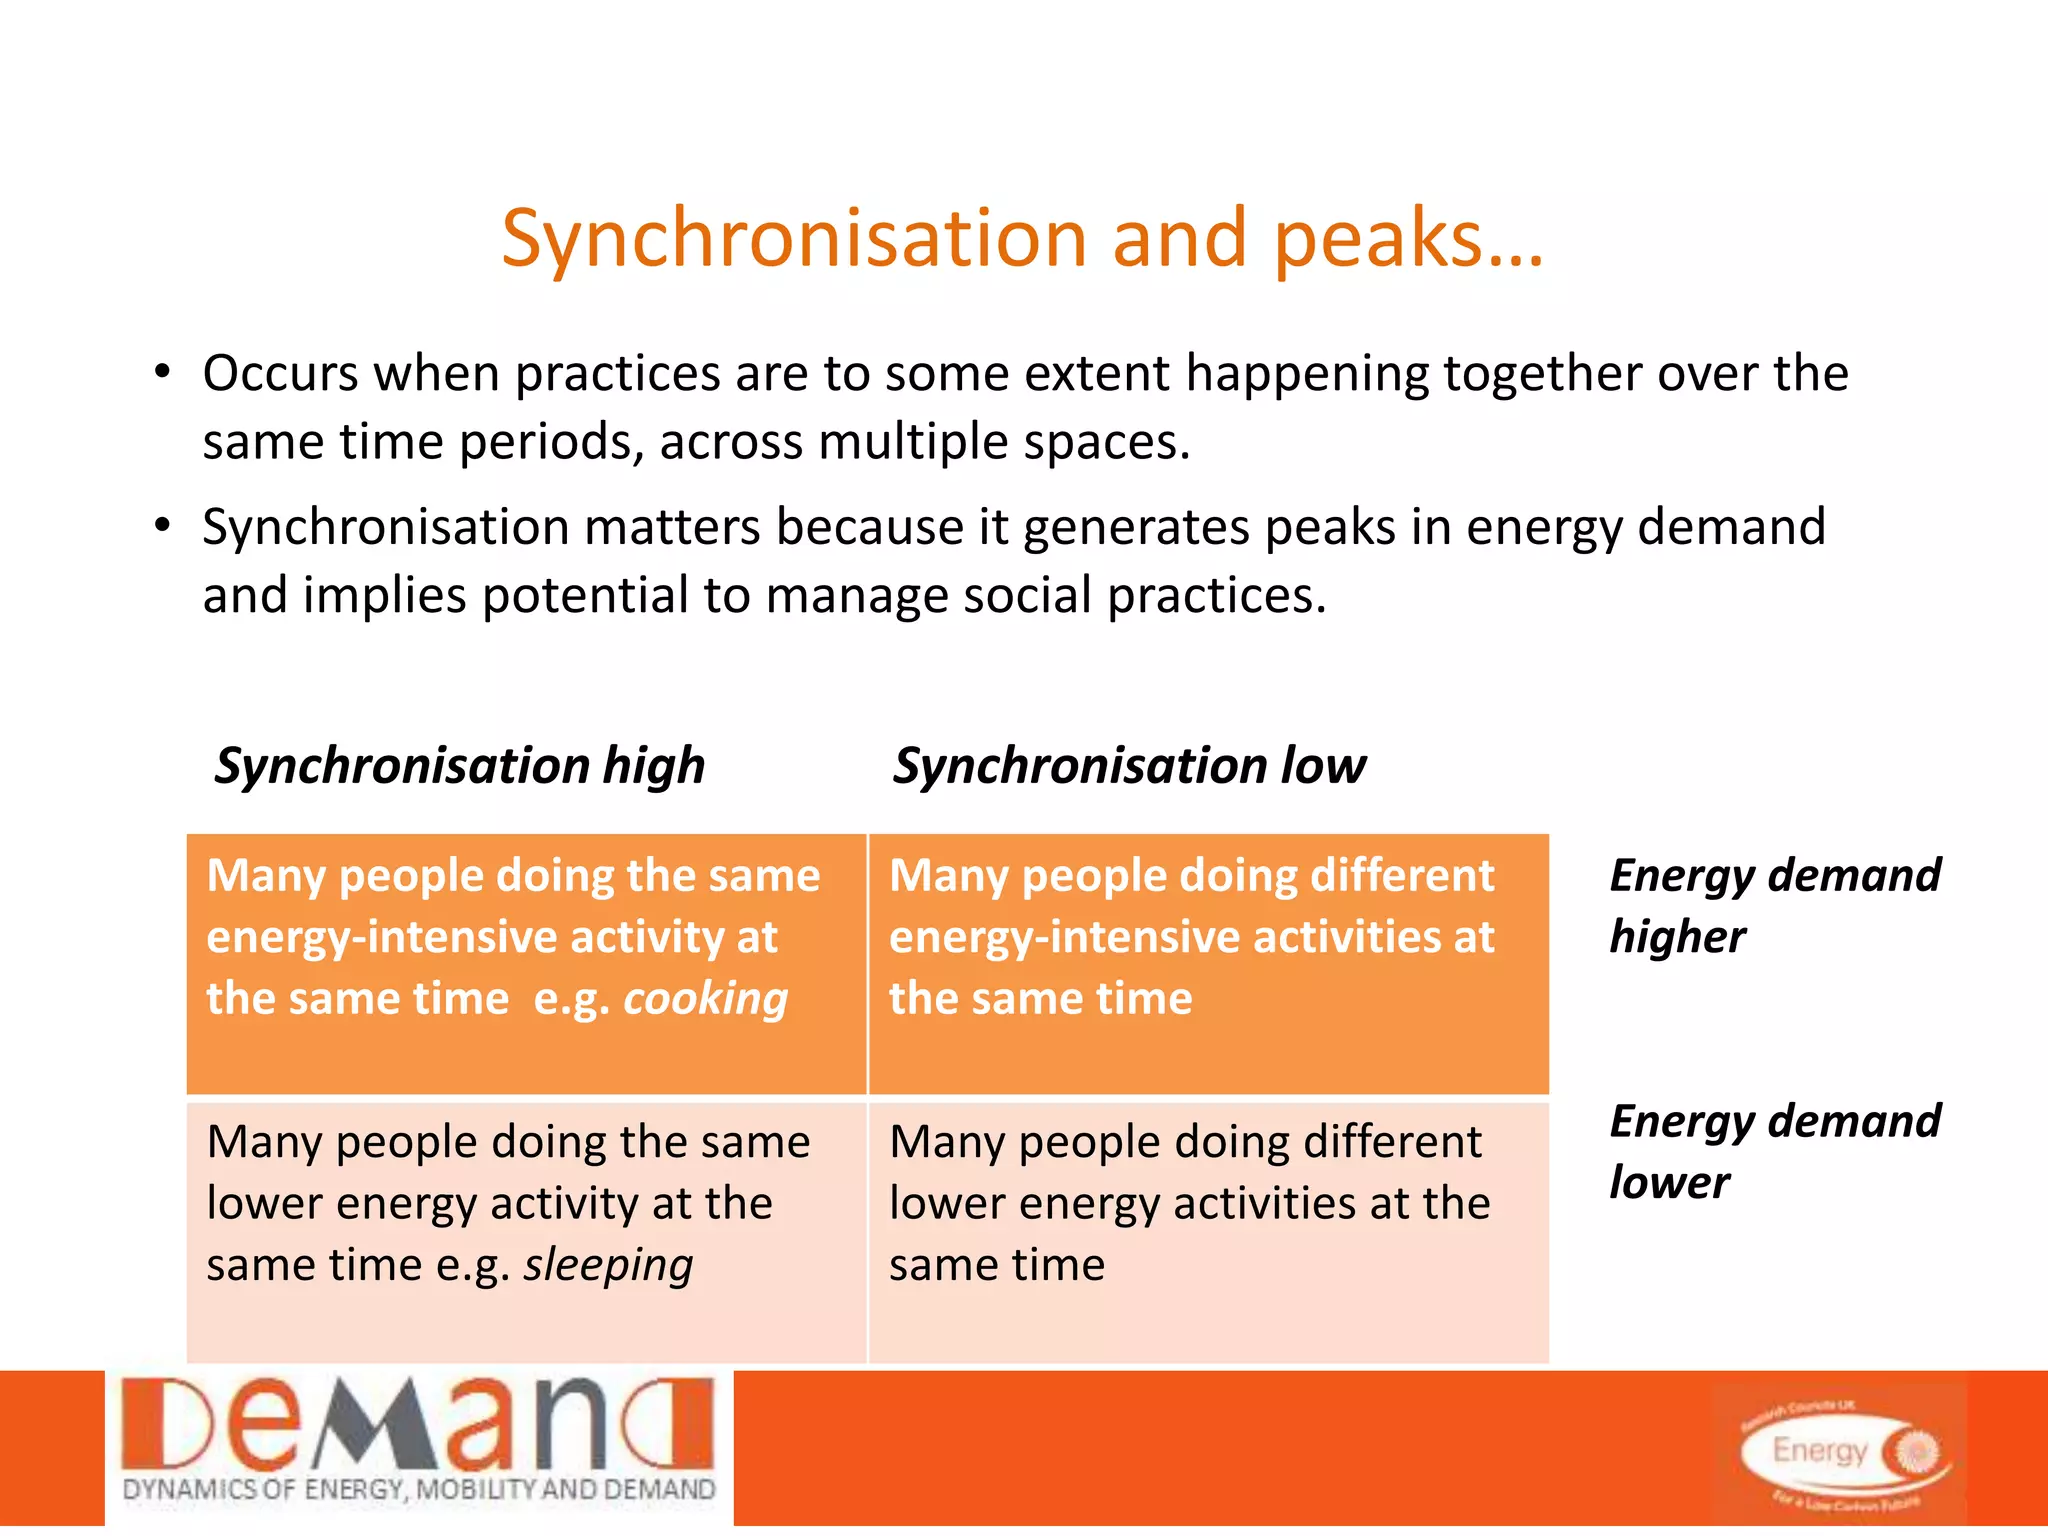
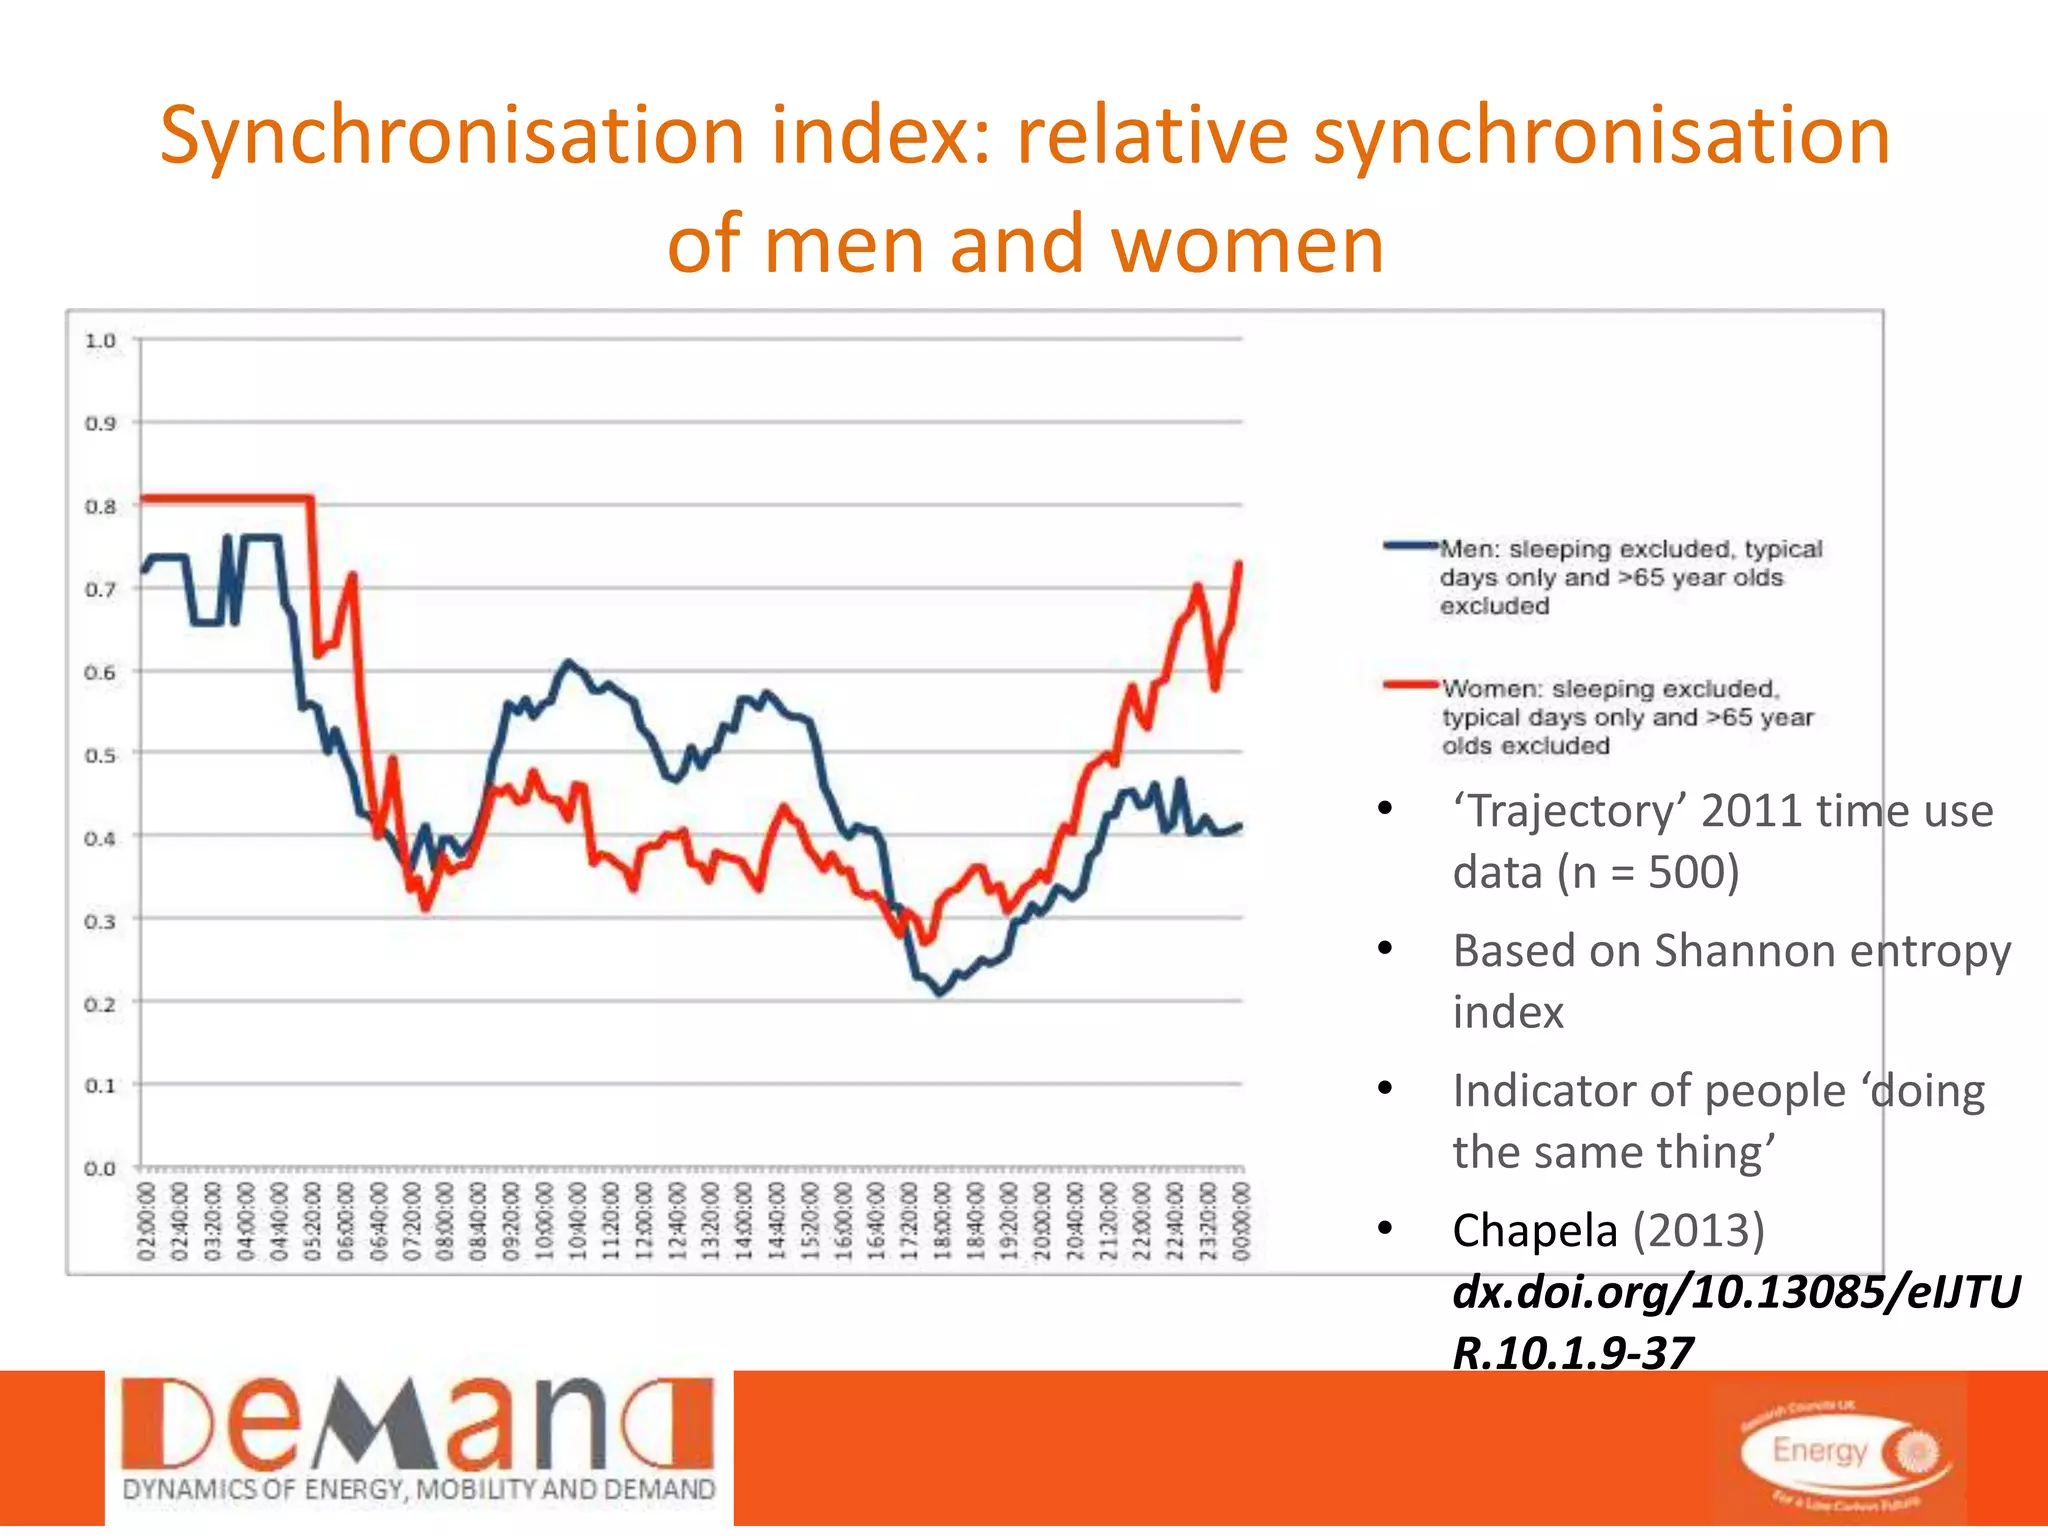
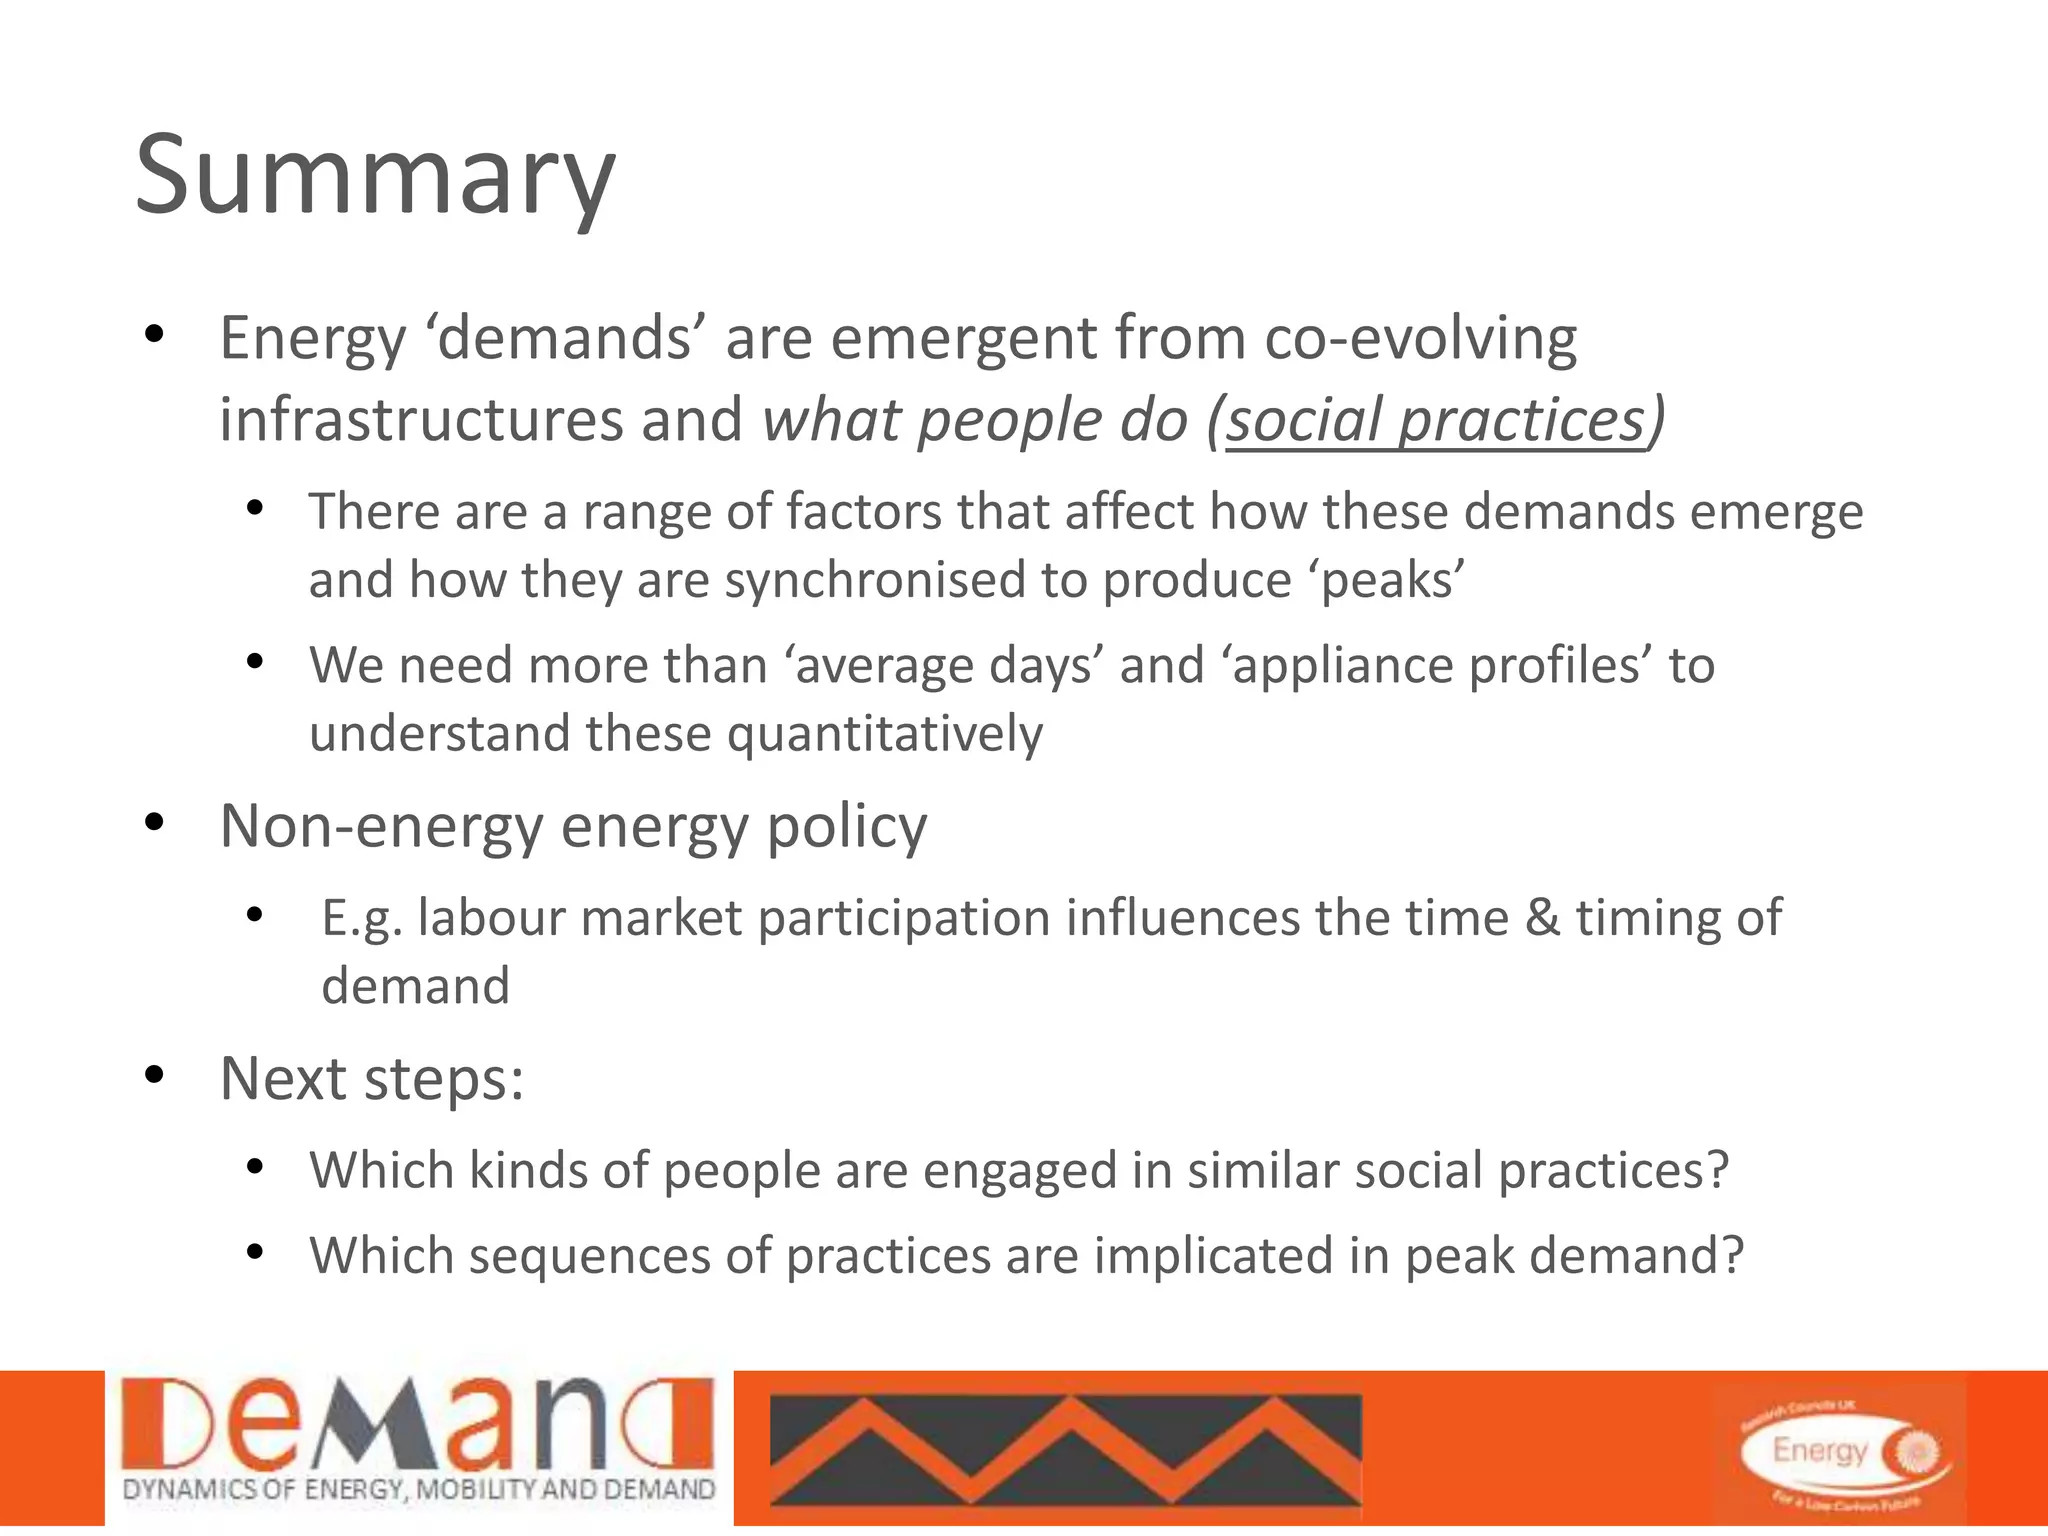
The Rhythms and Components 
of ‘Peak Energy’ Demand 
Ben Anderson – University of Southampton (@dataknut) 
Jacopo Torriti – University of Reading 
Richard Hanna – University of Reading 
www.demand.ac.uk 
BEHAVE Conference 2014 
3rd September 2014
What’s the problem? 
• Domestic demand for electricity is 
particularly ‘peaky’… 
• Infrastructure problems 
• Network ‘import’ overload on 
weekday evenings; 
• Network ‘export’ overload at mid-day 
on weekdays due to under-used 
PV generation; 
• Inefficient use of resources (night-time 
trough) 
• Carbon problems: 
• Peak load can demand ‘dirty’ 
generation 
UK Housing Energy Fact File 
Graph 7a: HES average 24-hour electricity use profile for owner-occupied 
homes, England 2010-11 
Gas consumption 
The amount of gas consumed in the UK varies dramatically between 
households. The top 10% of households consume at least four times as 
much gas as the bottom 10%.60 Modelling to predict nhouseholds’ e ergy 
consumption – based on the property, household income and tenure – has 
so far been able to explain less than 40% of this variation. 
Households with especially high or low consumption do not have particular 
behaviours that make them easy to identify. Instead they tend to have a 
cluster of very ordinary behaviours that happen to culminate in high or low 
gas use. There are, it seems, many different ways to be a high or low gas 
user. The behaviours in question can be clustered under three broad 
headings: 
• physical properties of the home – the particular physical environment 
Gas use varies enormously from 
household to household, and the 
variation has more to do with 
behaviour than how dwellings are 
built. 
800 
700 
600 
500 
400 
300 
200 
100 
0 
00:00 02:00 04:00 06:00 08:00 10:00 12:00 14:00 16:00 18:00 20:00 22:00 
Heating 
Water heating 
Electric showers 
Washing/drying 
Cooking 
Lighting 
Cold appliances 
ICT 
Audiovisual 
Other 
Unknown 
Watts 
Filling the 
trough 
Peak load 
• Cost problems: 
• Peak generation is higher 
priced energy
What to do? 
Two inter-linked approaches to dealing 
with ‘Peak’: 
• Demand Reduction 
• Just reducing it per se 
• Demand Response 
• Shifting it somewhere else in 
time (or space and time) 
This raises the crucial questions: 
• What do people do during peaks? 
• How has this evolved? 
• What can shift and where can it 
shift to? 
UK Housing Energy Fact File 
Graph 7a: HES average 24-hour electricity use profile for owner-occupied 
homes, England 2010-11 
Gas consumption 
The amount of gas consumed in the UK varies dramatically between 
households. The top 10% of households consume at least four times as 
much gas as the bottom 10%.60 Modelling to predict nhouseholds’ e ergy 
consumption – based on the property, household income and tenure – has 
so far been able to explain less than 40% of this variation. 
Households with especially high or low consumption do not have particular 
behaviours that make them easy to identify. Instead they tend to have a 
cluster of very ordinary behaviours that happen to culminate in high or low 
gas use. There are, it seems, many different ways to be a high or low gas 
user. The behaviours in question can be clustered under three broad 
headings: 
• physical properties of the home – the particular physical environment 
Gas use varies enormously from 
household to household, and the 
variation has more to do with 
behaviour than how dwellings are 
built. 
800 
700 
600 
500 
400 
300 
200 
100 
0 
00:00 02:00 04:00 06:00 08:00 10:00 12:00 14:00 16:00 18:00 20:00 22:00 
Heating 
Water heating 
Electric showers 
Washing/drying 
Cooking 
Lighting 
Cold appliances 
ICT 
Audiovisual 
Other 
Unknown 
Watts 
Filling the 
trough 
Peak load
But there’s another problem… UK Housing Energy Fact File 
• This is an appliance 
level view 
• It tells us very little 
about what people 
do in peaks (and 
troughs) 
• And nothing about 
change over time 
• But time-use diary 
data might… 
Graph 7a: HES average 24-hour electricity use profile for owner-occupied 
homes, England 2010-11 
Gas consumption 
Gas use varies enormously from 
800 
700 
600 
500 
400 
300 
200 
100 
0 
00:00 02:00 04:00 06:00 08:00 10:00 12:00 14:00 16:00 18:00 20:00 22:00 
Heating 
Water heating 
Electric showers 
Washing/drying 
Cooking 
Lighting 
Cold appliances 
ICT 
Audiovisual 
Other 
Unknown 
Watts
So what constitutes peak? 
ONS 2005 Time Use Survey Data (UK, weekdays) % of persons reporting
So what constitutes peak? 
ONS 2005 Time Use Survey Data (UK, weekdays) % of persons reporting
The ‘average day’ is not that helpful 
Monday Friday 
ONS 2005 Time Use Survey Data (UK) % people reporting category – half hour summaries
Whose ‘peak’: gendered practices 
Men Women 
ONS 2005 Time Use Survey Data (UK, all days) % people reporting category – half hour summaries
Overall 
The ‘evolution’ of laundry 1975 - 2005 
Multinational Time Use Study 1975-2005 (UK sample) – half hour summaries 
% of laundry episodes 
-2.00% 
-1.50% 
-1.00% 
-0.50% 
0.00% 
1.00% 
0.50% 
1.50% 
2.00% 
2.50% 
0.00% 
0.20% 
4:00 
5:30 
7:00 
8:30 
10:00 
11:30 
13:00 
14:30 
16:00 
17:30 
19:00 
20:30 
22:00 
23:30 
1:00 
2:30 
Saturday 
Friday 
Thursday 
Wednesday 
Tuesday 
Monday 
Sunday 
0.40% 
0.60% 
0.80% 
1.00% 
1.20% 
4:00 
6:00 
8:00 
10:00 
12:00 
14:00 
16:00 
18:00 
20:00 
22:00 
0:00 
2:00 
1974 Monday 
2005 Monday 
0.00% 
0.20% 
0.40% 
0.60% 
0.80% 
1.00% 
1.20% 
4:00 
6:00 
8:00 
10:00 
12:00 
14:00 
16:00 
18:00 
20:00 
22:00 
0:00 
2:00 
1974 Sunday 
2005 Sunday 
% point change
Whose ‘peak’: age/cohort variation 
16-64 : weekdays 65+ : weekdays 
ONS 2005 Time Use Survey Data (UK, week days) % people reporting category – half hour summaries
Synchronisation and peaks… 
• Occurs when practices are to some extent happening together over the 
same time periods, across multiple spaces. 
• Synchronisation matters because it generates peaks in energy demand 
and implies potential to manage social practices. 
Synchronisation high Synchronisation low 
Many people doing the same 
energy-intensive activity at 
the same time e.g. cooking 
Many people doing different 
energy-intensive activities at 
the same time 
Many people doing the same 
lower energy activity at the 
same time e.g. sleeping 
Many people doing different 
lower energy activities at the 
same time 
Energy demand 
higher 
Energy demand 
lower
Synchronisation index: relative synchronisation 
of men and women 
• ‘Trajectory’ 2011 time use 
data (n = 500) 
• Based on Shannon entropy 
index 
• Indicator of people ‘doing 
the same thing’ 
• Chapela (2013) 
dx.doi.org/10.13085/eIJTU 
R.10.1.9-37
Summary 
• Energy ‘demands’ are emergent from co-evolving 
infrastructures and what people do (social practices) 
• There are a range of factors that affect how these demands emerge 
and how they are synchronised to produce ‘peaks’ 
• We need more than ‘average days’ and ‘appliance profiles’ to 
understand these quantitatively 
• Non-energy energy policy 
• E.g. labour market participation influences the time & timing of 
demand 
• Next steps: 
• Which kinds of people are engaged in similar social practices? 
• Which sequences of practices are implicated in peak demand?
Thank you 
Ben Anderson b.anderson@soton.ac.uk 
Jacopo Torriti j.torriti@reading.ac.uk 
Richard Hanna r.f.hanna@reading.ac.uk 
www.demand.ac.uk

The Rhythms and Components of ‘Peak Energy’ Demand

  • 1.
    The Rhythms andComponents of ‘Peak Energy’ Demand Ben Anderson – University of Southampton (@dataknut) Jacopo Torriti – University of Reading Richard Hanna – University of Reading www.demand.ac.uk BEHAVE Conference 2014 3rd September 2014
  • 2.
    What’s the problem? • Domestic demand for electricity is particularly ‘peaky’… • Infrastructure problems • Network ‘import’ overload on weekday evenings; • Network ‘export’ overload at mid-day on weekdays due to under-used PV generation; • Inefficient use of resources (night-time trough) • Carbon problems: • Peak load can demand ‘dirty’ generation UK Housing Energy Fact File Graph 7a: HES average 24-hour electricity use profile for owner-occupied homes, England 2010-11 Gas consumption The amount of gas consumed in the UK varies dramatically between households. The top 10% of households consume at least four times as much gas as the bottom 10%.60 Modelling to predict nhouseholds’ e ergy consumption – based on the property, household income and tenure – has so far been able to explain less than 40% of this variation. Households with especially high or low consumption do not have particular behaviours that make them easy to identify. Instead they tend to have a cluster of very ordinary behaviours that happen to culminate in high or low gas use. There are, it seems, many different ways to be a high or low gas user. The behaviours in question can be clustered under three broad headings: • physical properties of the home – the particular physical environment Gas use varies enormously from household to household, and the variation has more to do with behaviour than how dwellings are built. 800 700 600 500 400 300 200 100 0 00:00 02:00 04:00 06:00 08:00 10:00 12:00 14:00 16:00 18:00 20:00 22:00 Heating Water heating Electric showers Washing/drying Cooking Lighting Cold appliances ICT Audiovisual Other Unknown Watts Filling the trough Peak load • Cost problems: • Peak generation is higher priced energy
  • 3.
    What to do? Two inter-linked approaches to dealing with ‘Peak’: • Demand Reduction • Just reducing it per se • Demand Response • Shifting it somewhere else in time (or space and time) This raises the crucial questions: • What do people do during peaks? • How has this evolved? • What can shift and where can it shift to? UK Housing Energy Fact File Graph 7a: HES average 24-hour electricity use profile for owner-occupied homes, England 2010-11 Gas consumption The amount of gas consumed in the UK varies dramatically between households. The top 10% of households consume at least four times as much gas as the bottom 10%.60 Modelling to predict nhouseholds’ e ergy consumption – based on the property, household income and tenure – has so far been able to explain less than 40% of this variation. Households with especially high or low consumption do not have particular behaviours that make them easy to identify. Instead they tend to have a cluster of very ordinary behaviours that happen to culminate in high or low gas use. There are, it seems, many different ways to be a high or low gas user. The behaviours in question can be clustered under three broad headings: • physical properties of the home – the particular physical environment Gas use varies enormously from household to household, and the variation has more to do with behaviour than how dwellings are built. 800 700 600 500 400 300 200 100 0 00:00 02:00 04:00 06:00 08:00 10:00 12:00 14:00 16:00 18:00 20:00 22:00 Heating Water heating Electric showers Washing/drying Cooking Lighting Cold appliances ICT Audiovisual Other Unknown Watts Filling the trough Peak load
  • 4.
    But there’s anotherproblem… UK Housing Energy Fact File • This is an appliance level view • It tells us very little about what people do in peaks (and troughs) • And nothing about change over time • But time-use diary data might… Graph 7a: HES average 24-hour electricity use profile for owner-occupied homes, England 2010-11 Gas consumption Gas use varies enormously from 800 700 600 500 400 300 200 100 0 00:00 02:00 04:00 06:00 08:00 10:00 12:00 14:00 16:00 18:00 20:00 22:00 Heating Water heating Electric showers Washing/drying Cooking Lighting Cold appliances ICT Audiovisual Other Unknown Watts
  • 5.
    So what constitutespeak? ONS 2005 Time Use Survey Data (UK, weekdays) % of persons reporting
  • 6.
    So what constitutespeak? ONS 2005 Time Use Survey Data (UK, weekdays) % of persons reporting
  • 7.
    The ‘average day’is not that helpful Monday Friday ONS 2005 Time Use Survey Data (UK) % people reporting category – half hour summaries
  • 8.
    Whose ‘peak’: genderedpractices Men Women ONS 2005 Time Use Survey Data (UK, all days) % people reporting category – half hour summaries
  • 9.
    Overall The ‘evolution’of laundry 1975 - 2005 Multinational Time Use Study 1975-2005 (UK sample) – half hour summaries % of laundry episodes -2.00% -1.50% -1.00% -0.50% 0.00% 1.00% 0.50% 1.50% 2.00% 2.50% 0.00% 0.20% 4:00 5:30 7:00 8:30 10:00 11:30 13:00 14:30 16:00 17:30 19:00 20:30 22:00 23:30 1:00 2:30 Saturday Friday Thursday Wednesday Tuesday Monday Sunday 0.40% 0.60% 0.80% 1.00% 1.20% 4:00 6:00 8:00 10:00 12:00 14:00 16:00 18:00 20:00 22:00 0:00 2:00 1974 Monday 2005 Monday 0.00% 0.20% 0.40% 0.60% 0.80% 1.00% 1.20% 4:00 6:00 8:00 10:00 12:00 14:00 16:00 18:00 20:00 22:00 0:00 2:00 1974 Sunday 2005 Sunday % point change
  • 10.
    Whose ‘peak’: age/cohortvariation 16-64 : weekdays 65+ : weekdays ONS 2005 Time Use Survey Data (UK, week days) % people reporting category – half hour summaries
  • 11.
    Synchronisation and peaks… • Occurs when practices are to some extent happening together over the same time periods, across multiple spaces. • Synchronisation matters because it generates peaks in energy demand and implies potential to manage social practices. Synchronisation high Synchronisation low Many people doing the same energy-intensive activity at the same time e.g. cooking Many people doing different energy-intensive activities at the same time Many people doing the same lower energy activity at the same time e.g. sleeping Many people doing different lower energy activities at the same time Energy demand higher Energy demand lower
  • 12.
    Synchronisation index: relativesynchronisation of men and women • ‘Trajectory’ 2011 time use data (n = 500) • Based on Shannon entropy index • Indicator of people ‘doing the same thing’ • Chapela (2013) dx.doi.org/10.13085/eIJTU R.10.1.9-37
  • 13.
    Summary • Energy‘demands’ are emergent from co-evolving infrastructures and what people do (social practices) • There are a range of factors that affect how these demands emerge and how they are synchronised to produce ‘peaks’ • We need more than ‘average days’ and ‘appliance profiles’ to understand these quantitatively • Non-energy energy policy • E.g. labour market participation influences the time & timing of demand • Next steps: • Which kinds of people are engaged in similar social practices? • Which sequences of practices are implicated in peak demand?
  • 14.
    Thank you BenAnderson b.anderson@soton.ac.uk Jacopo Torriti j.torriti@reading.ac.uk Richard Hanna r.f.hanna@reading.ac.uk www.demand.ac.uk