Downloaded 208 times
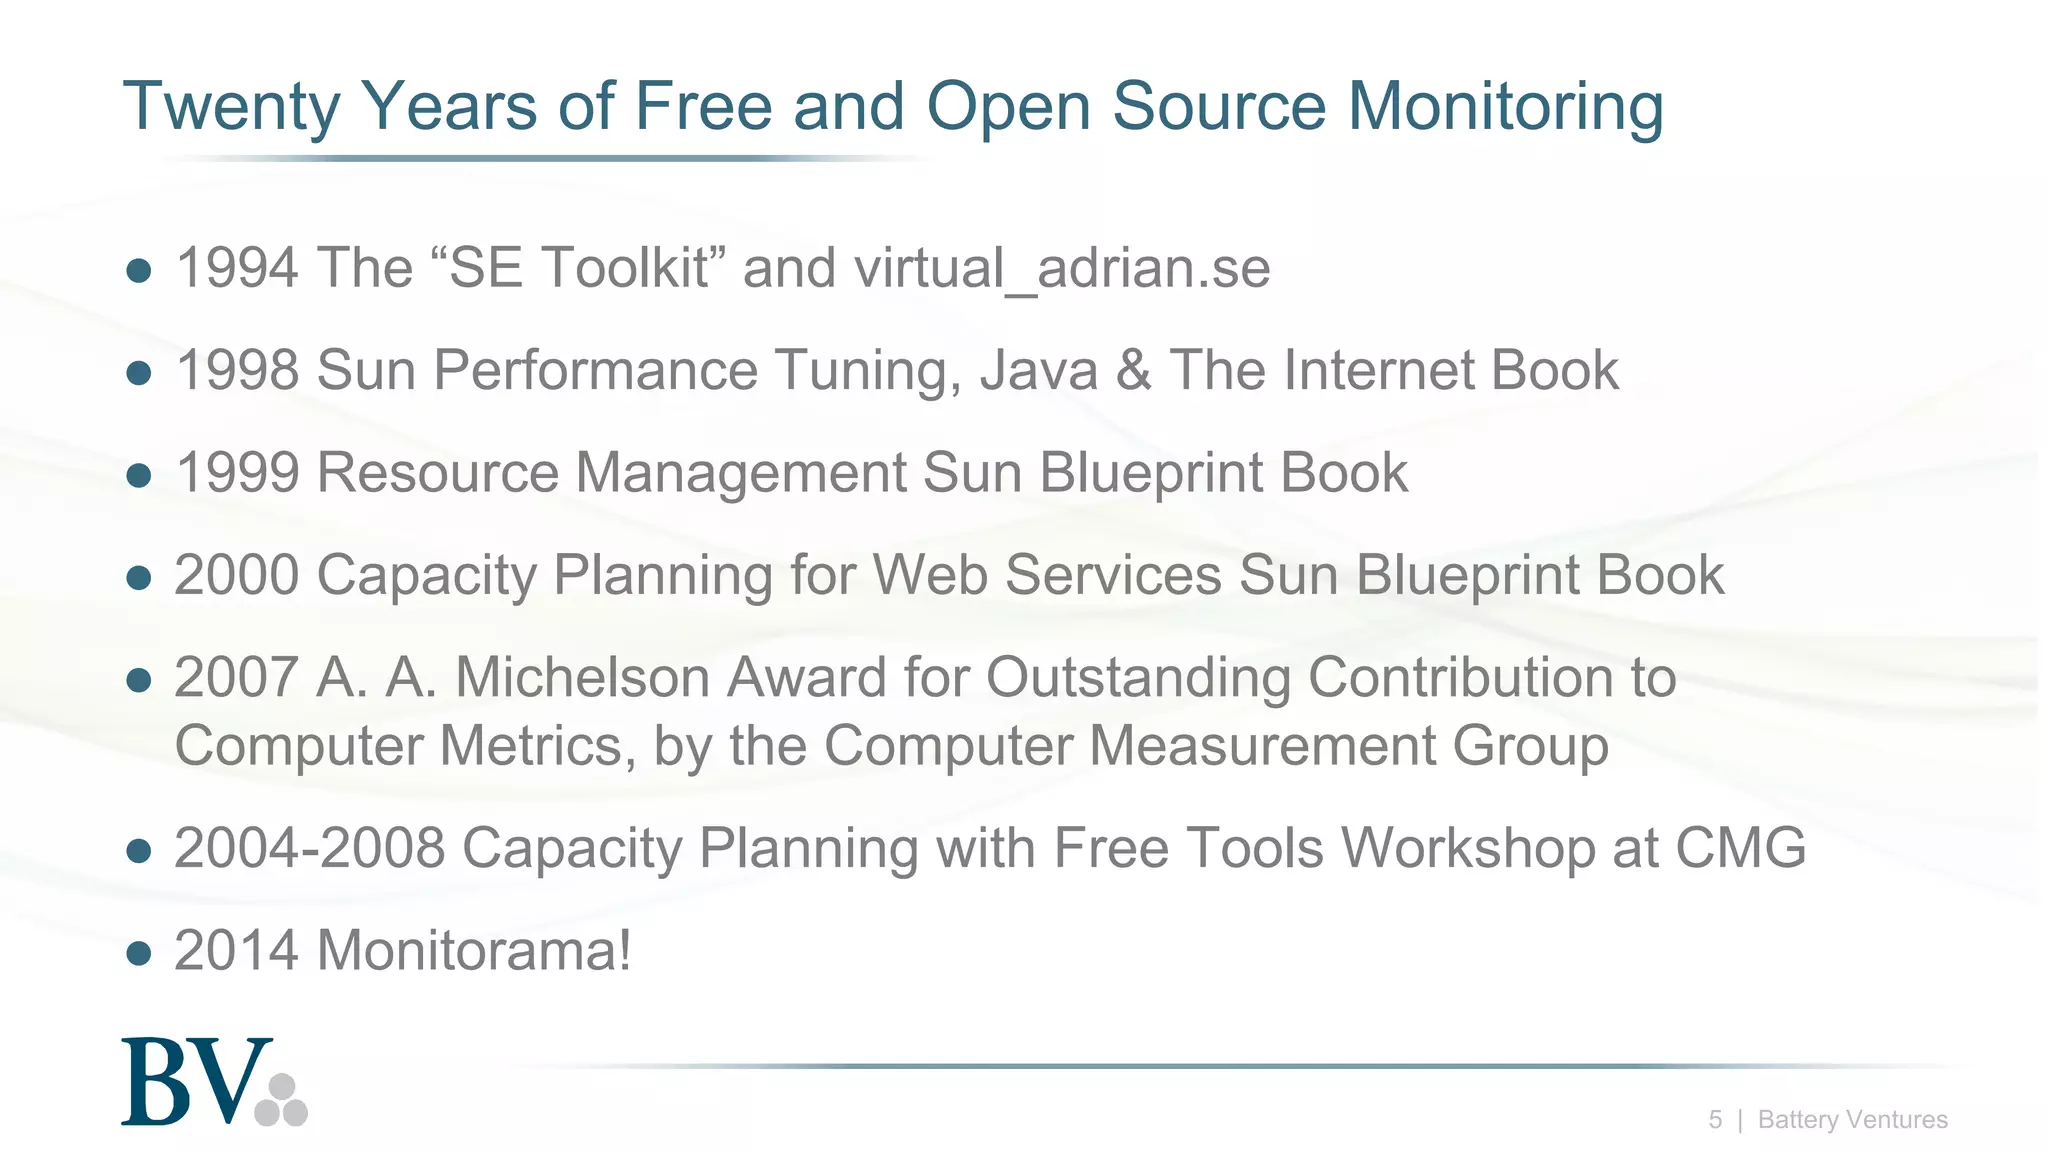
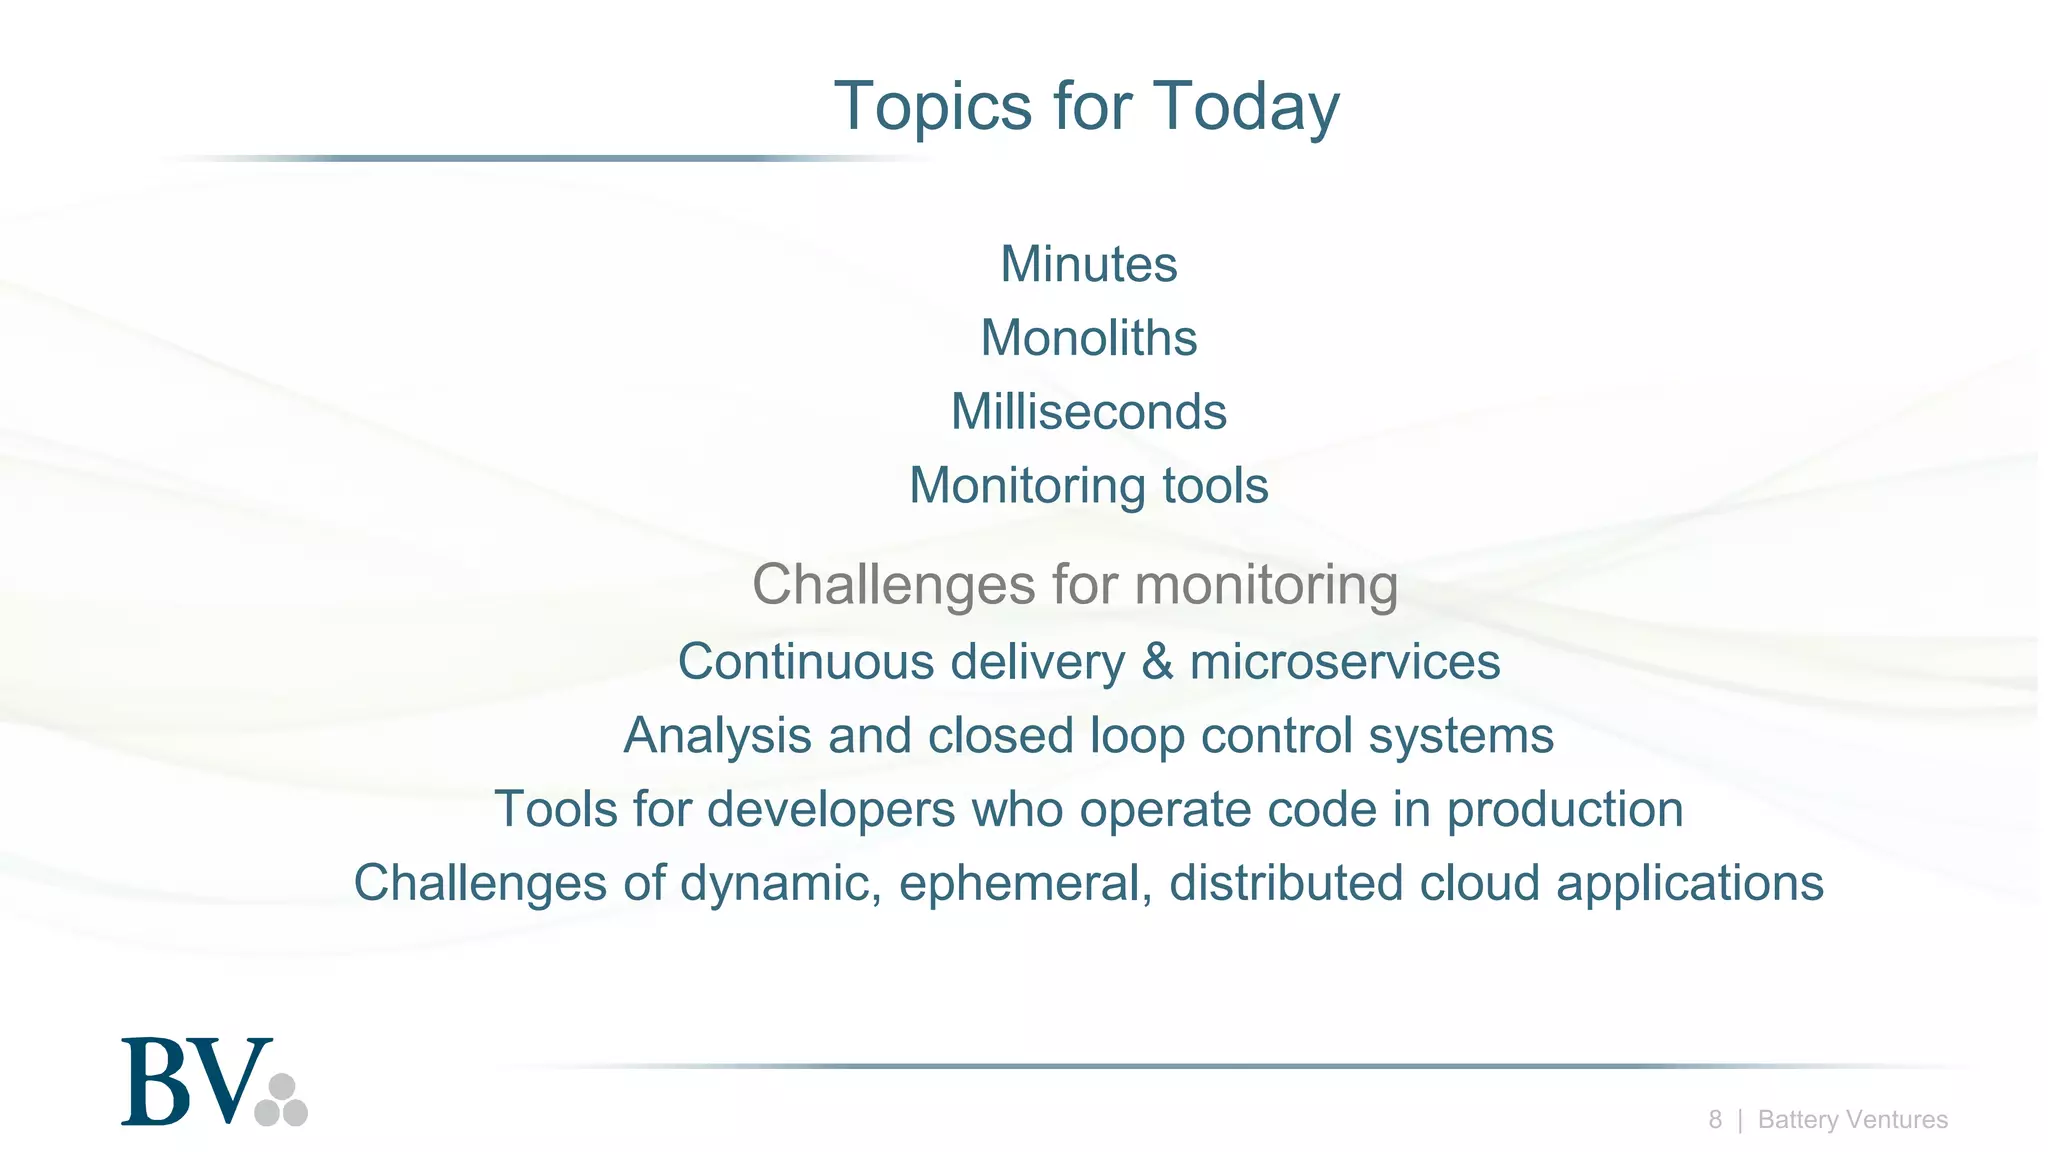

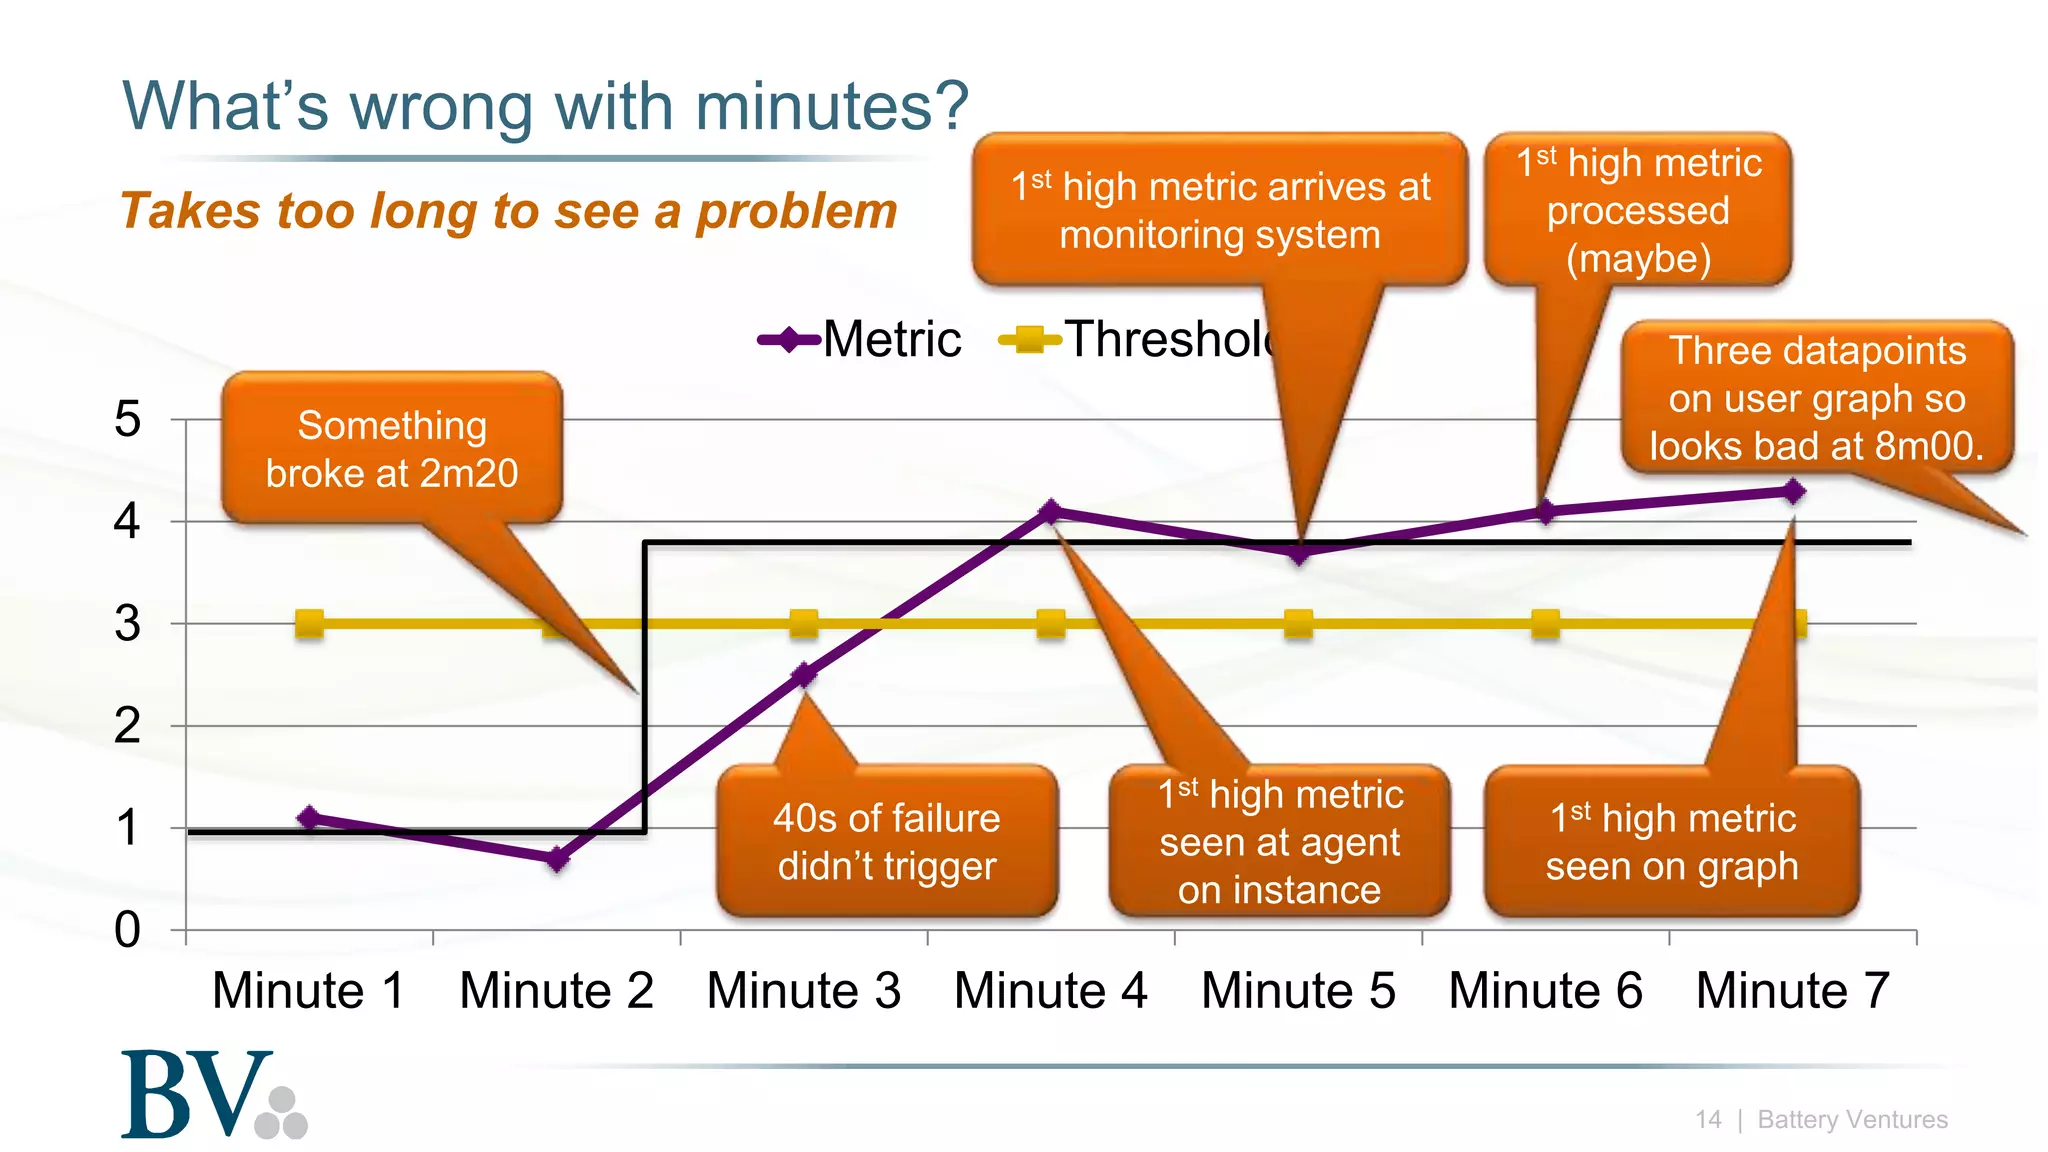
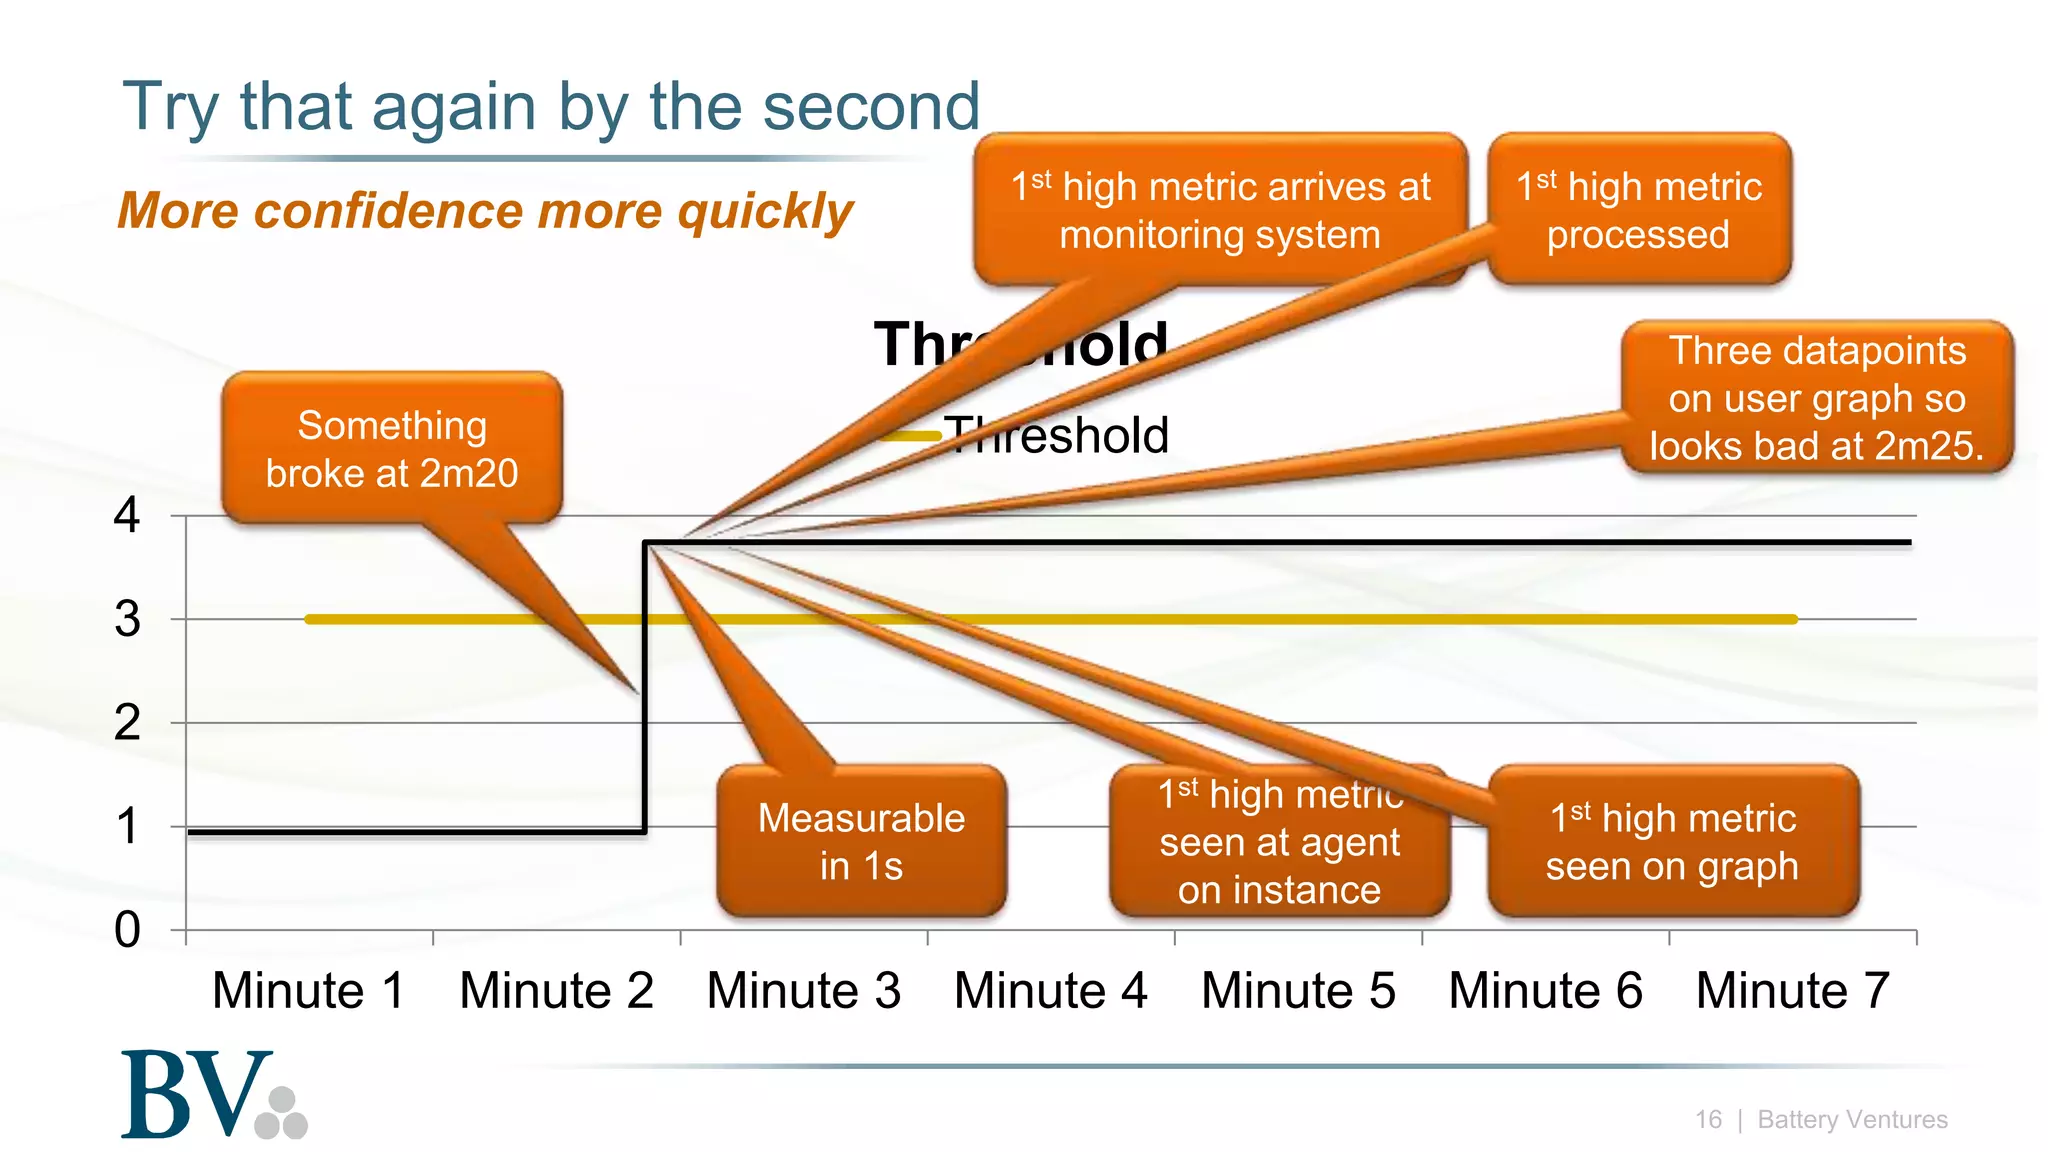
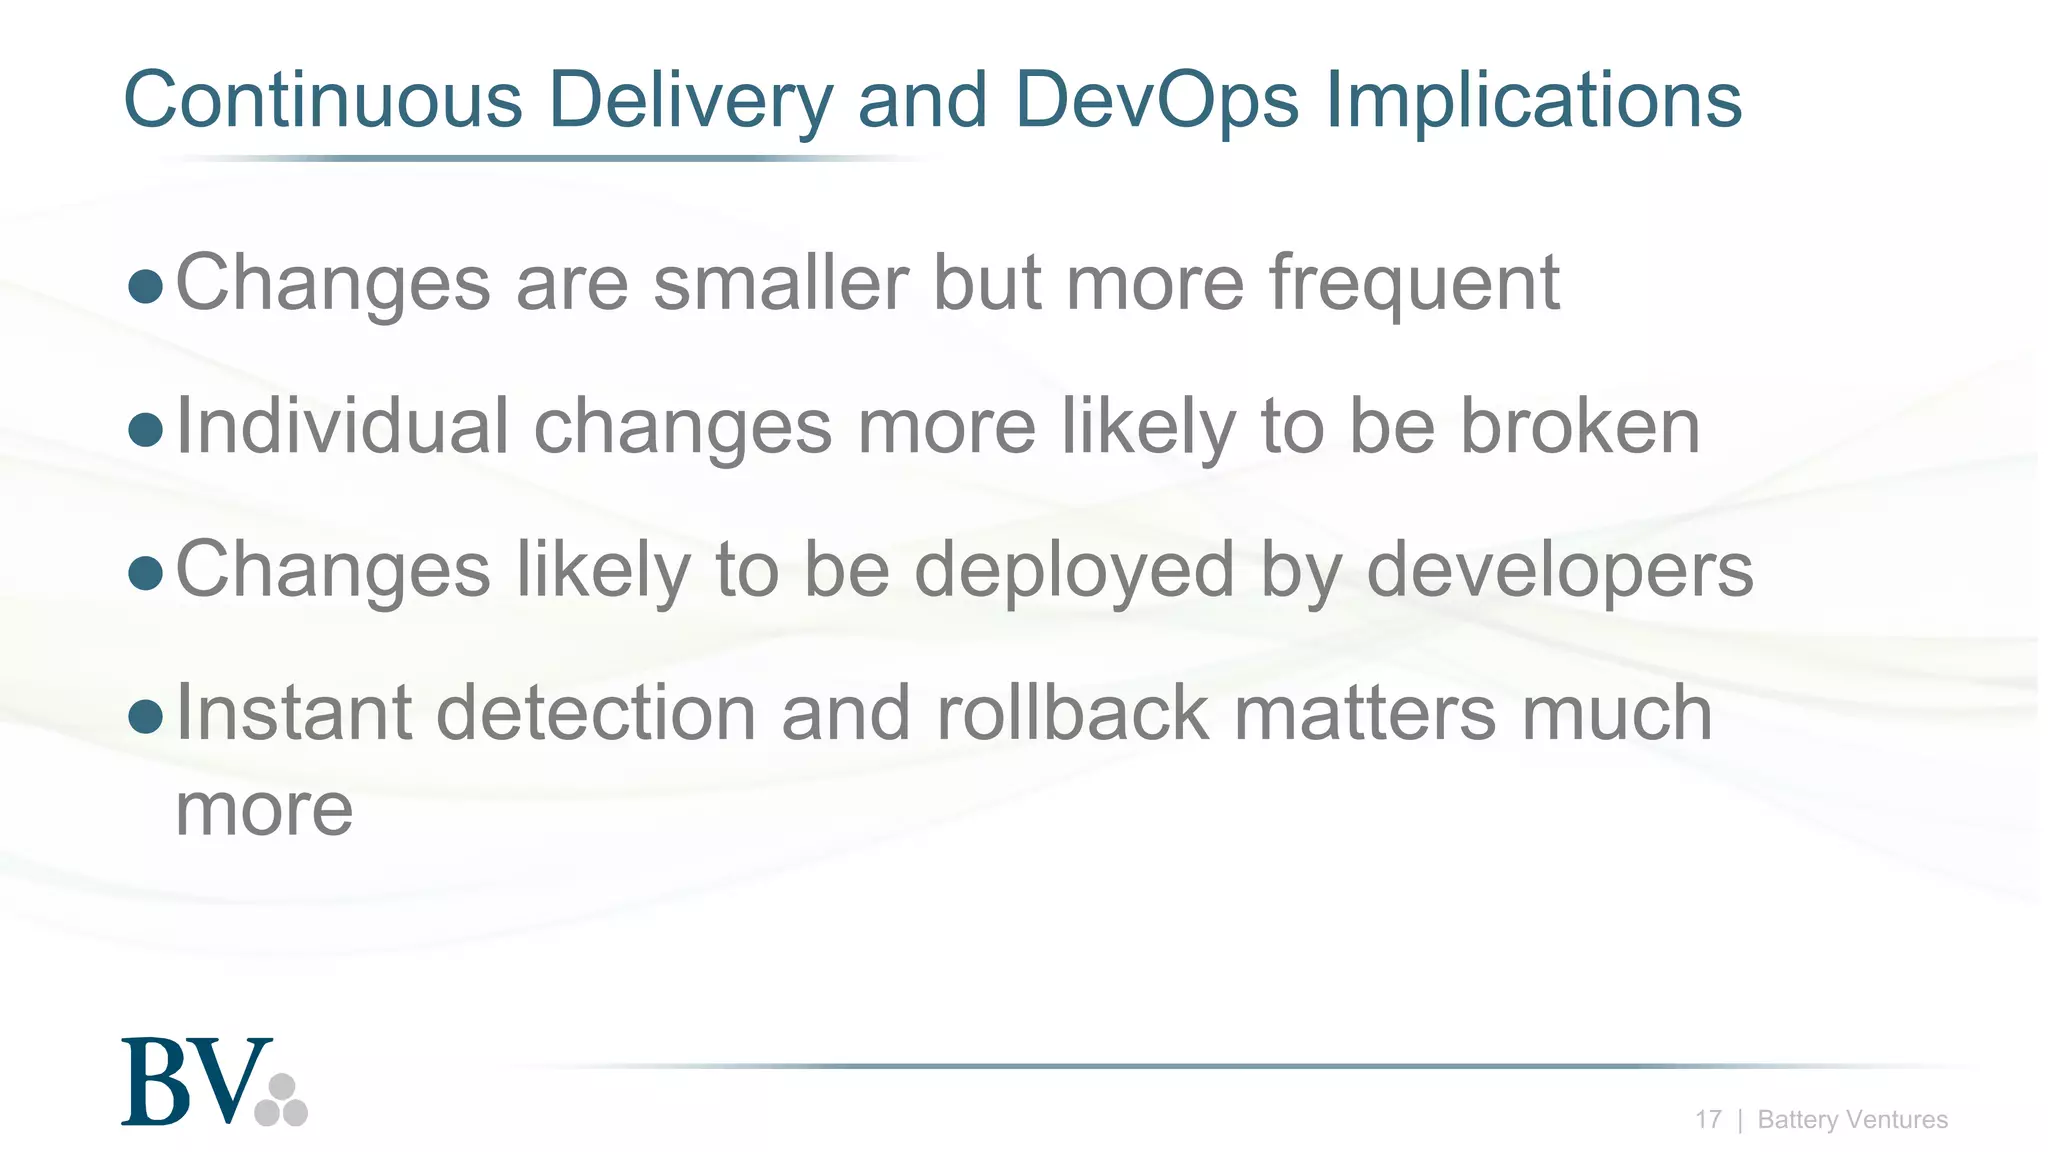
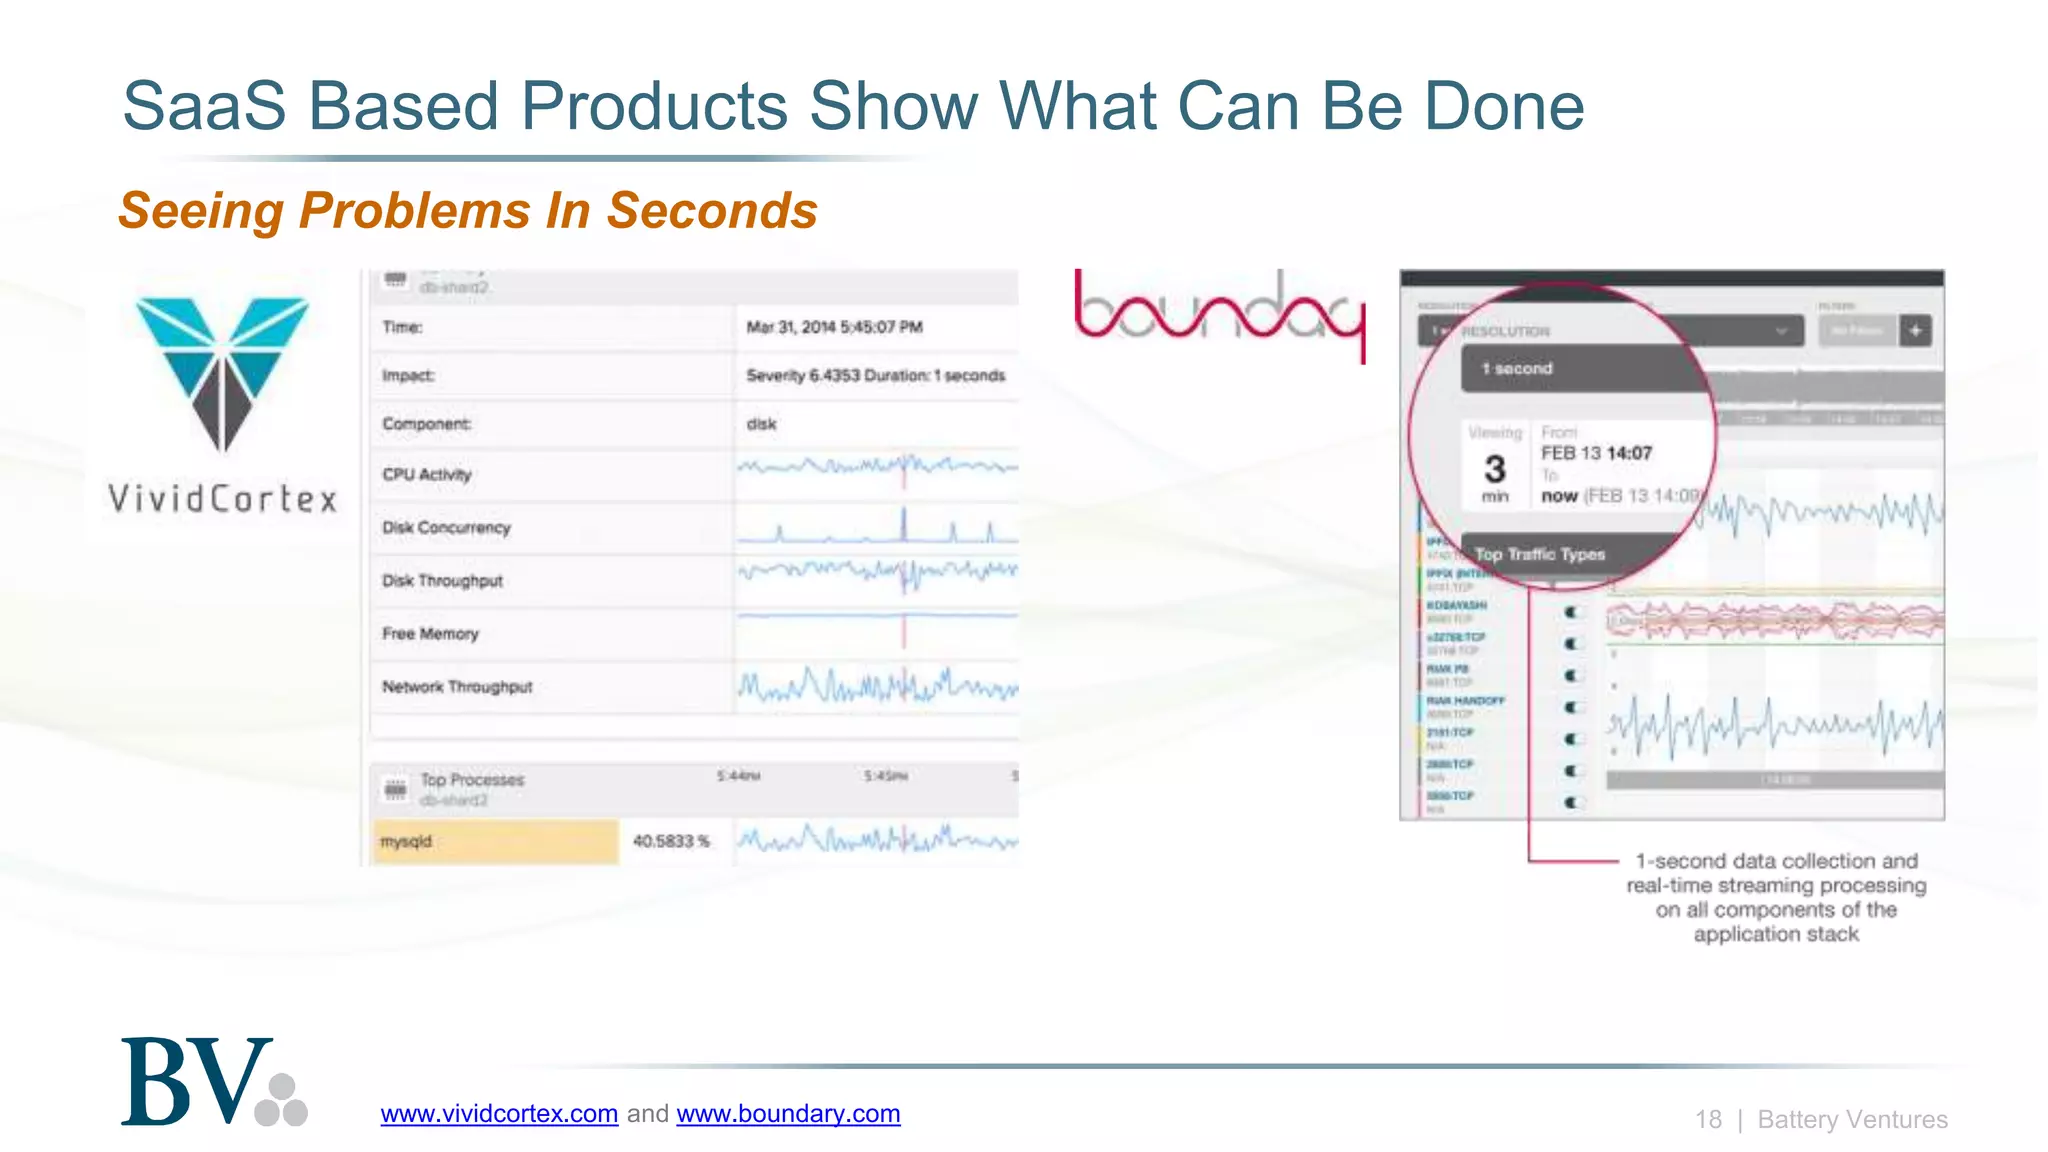
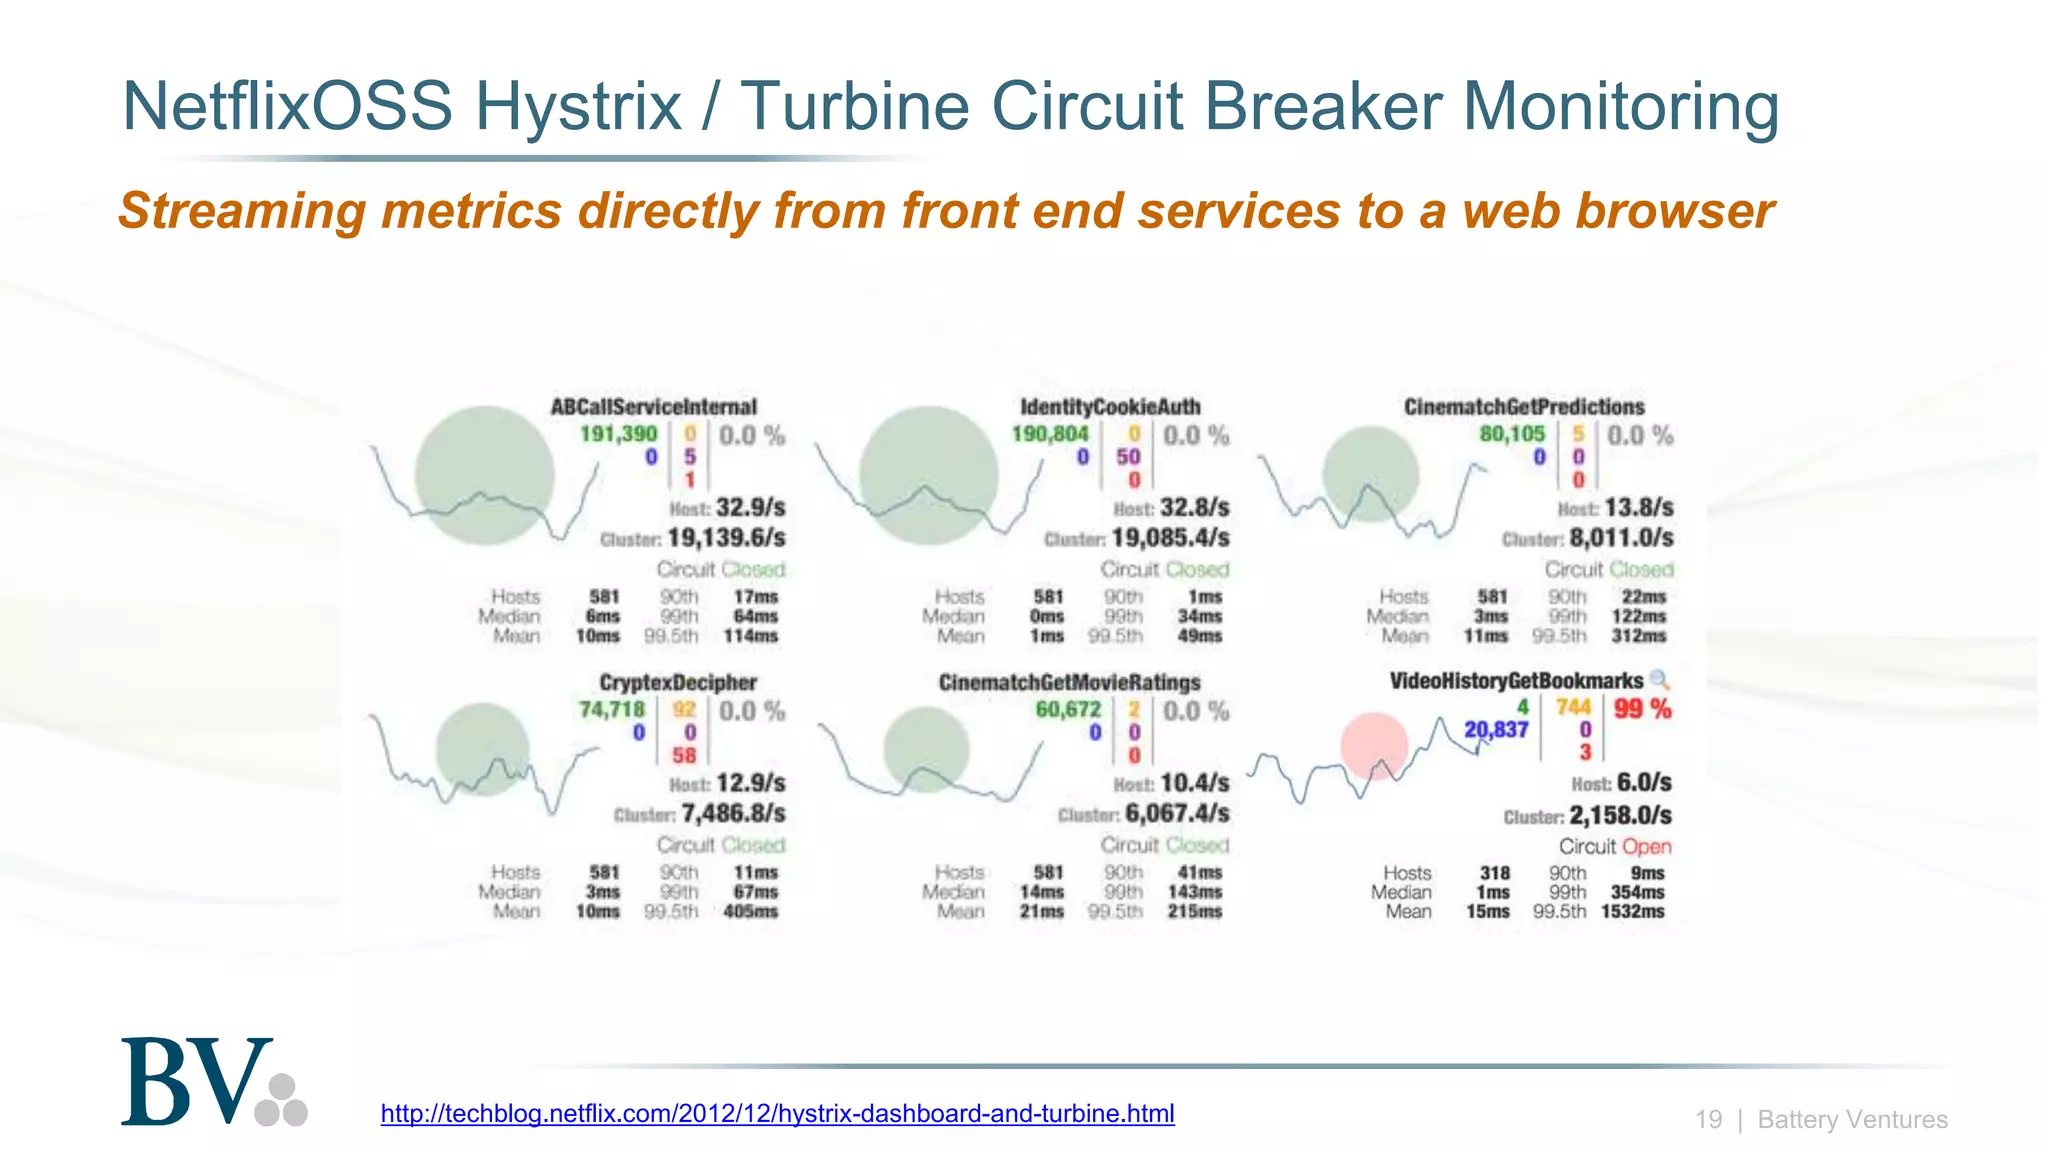

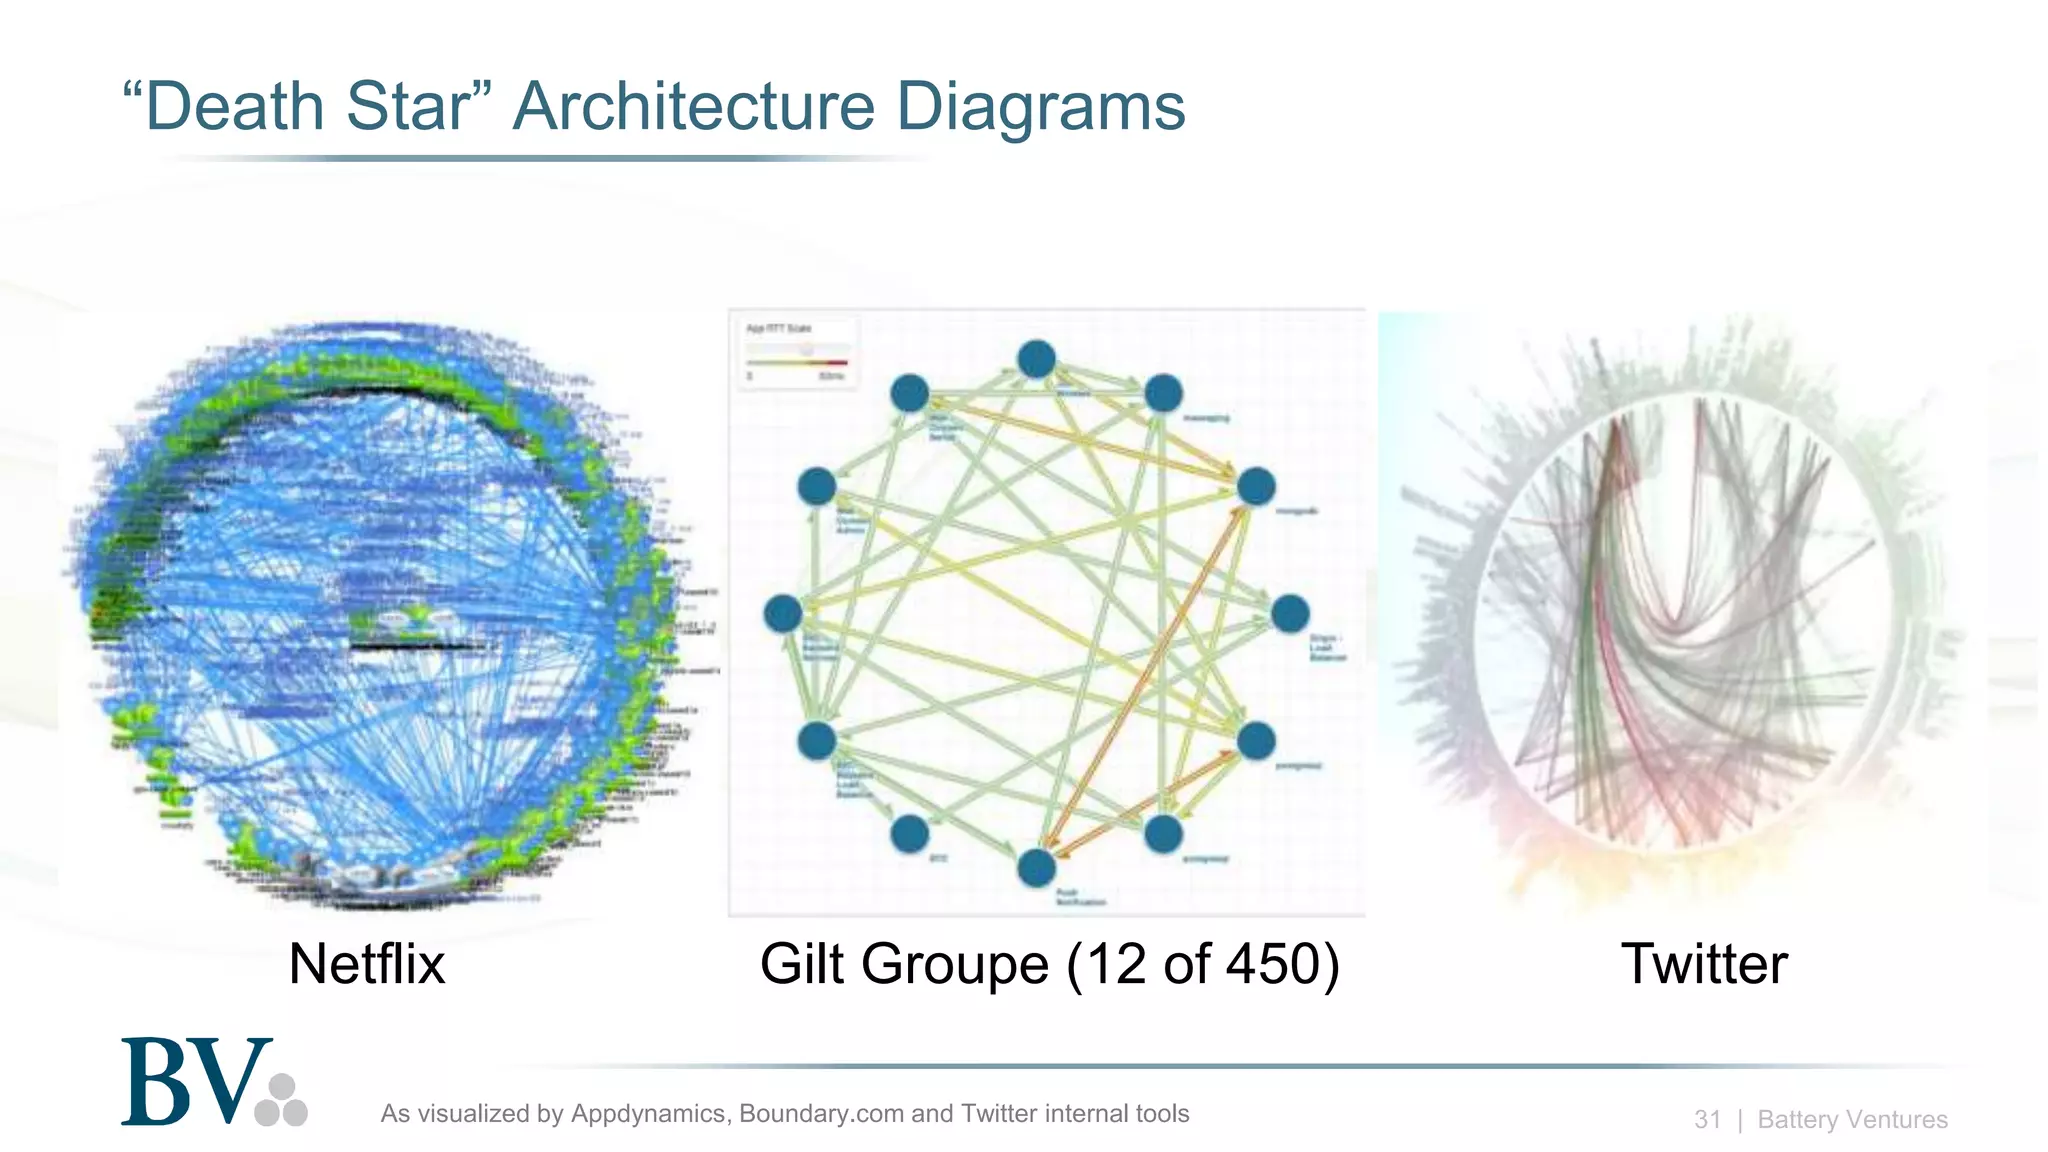
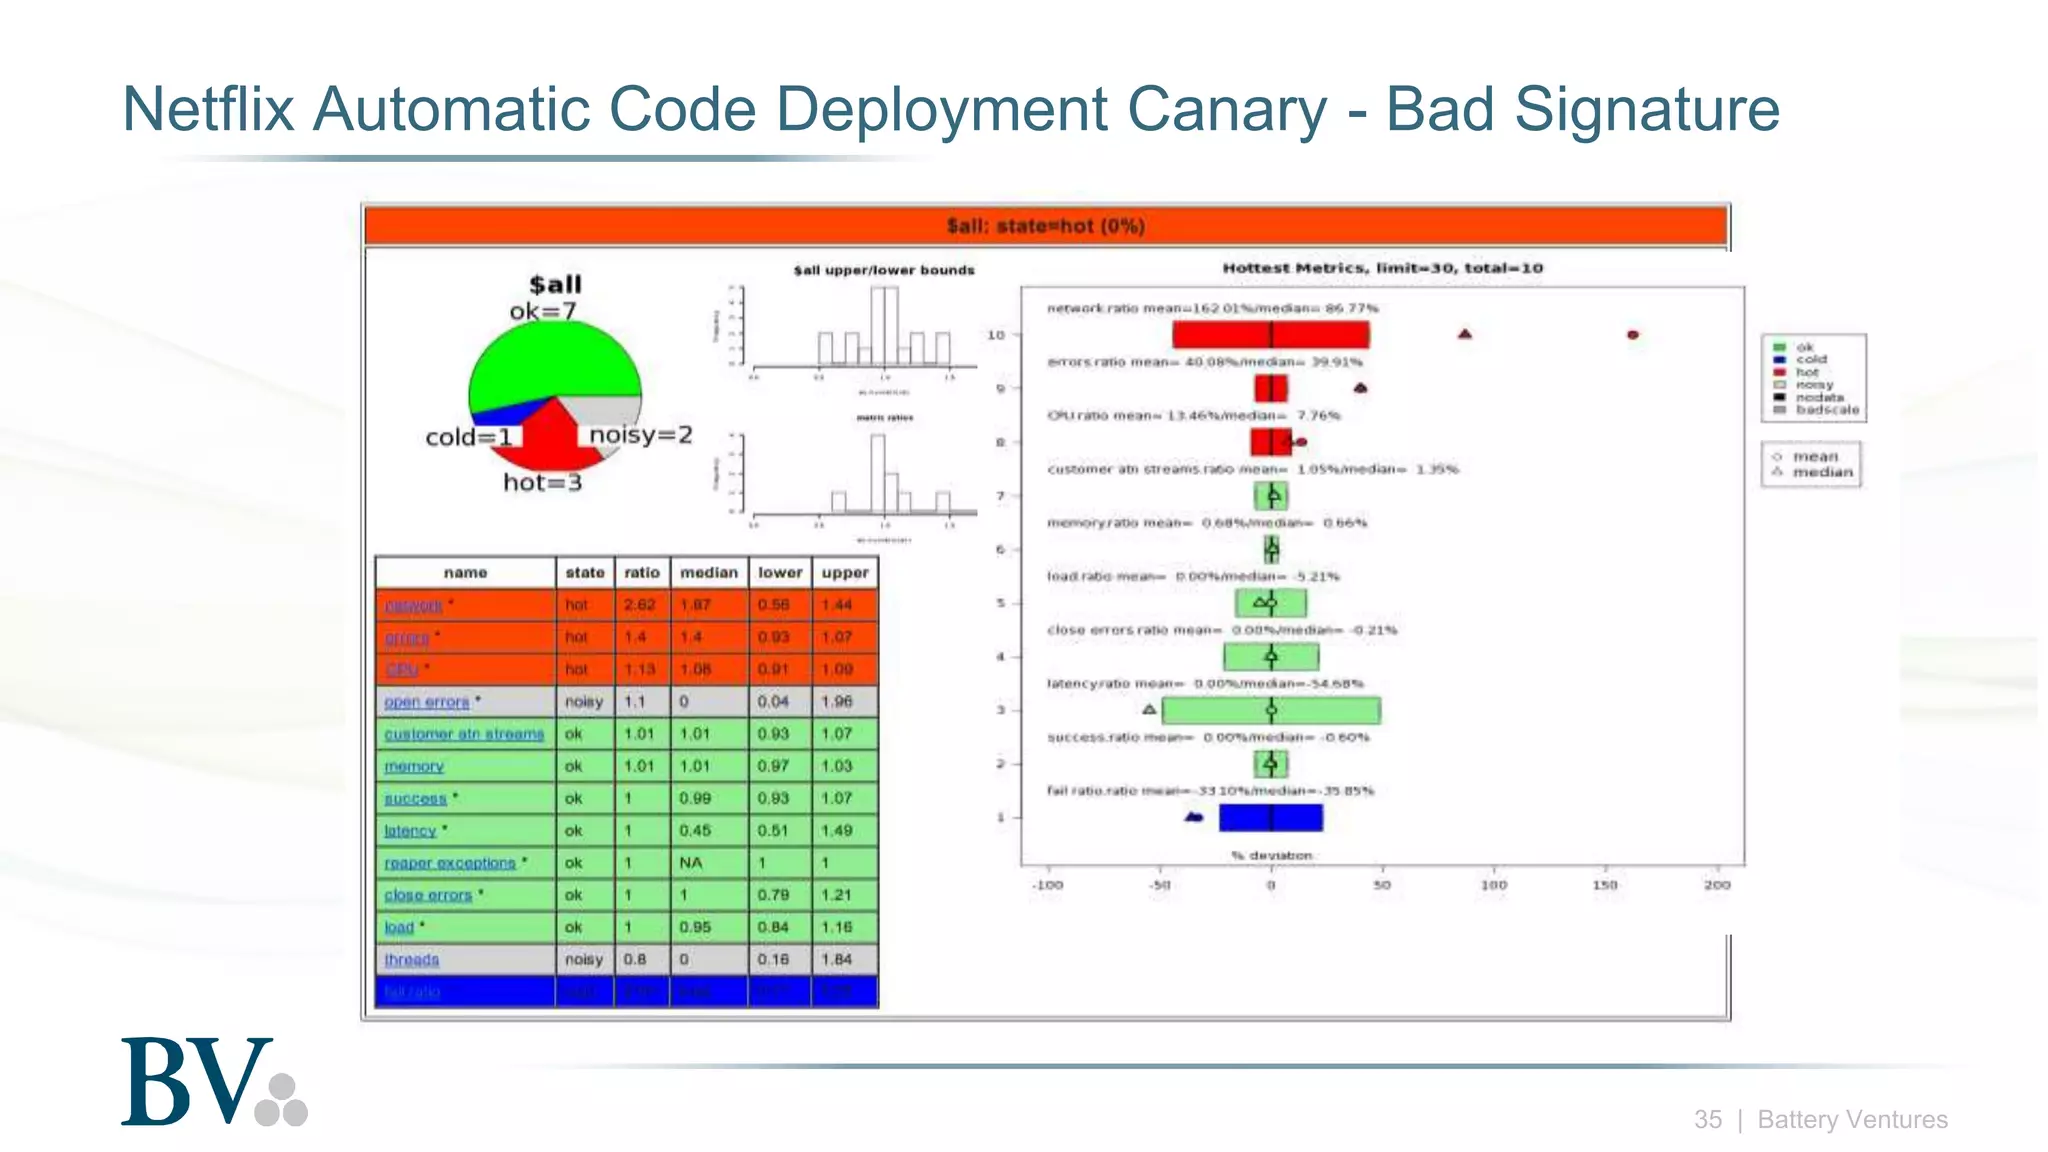
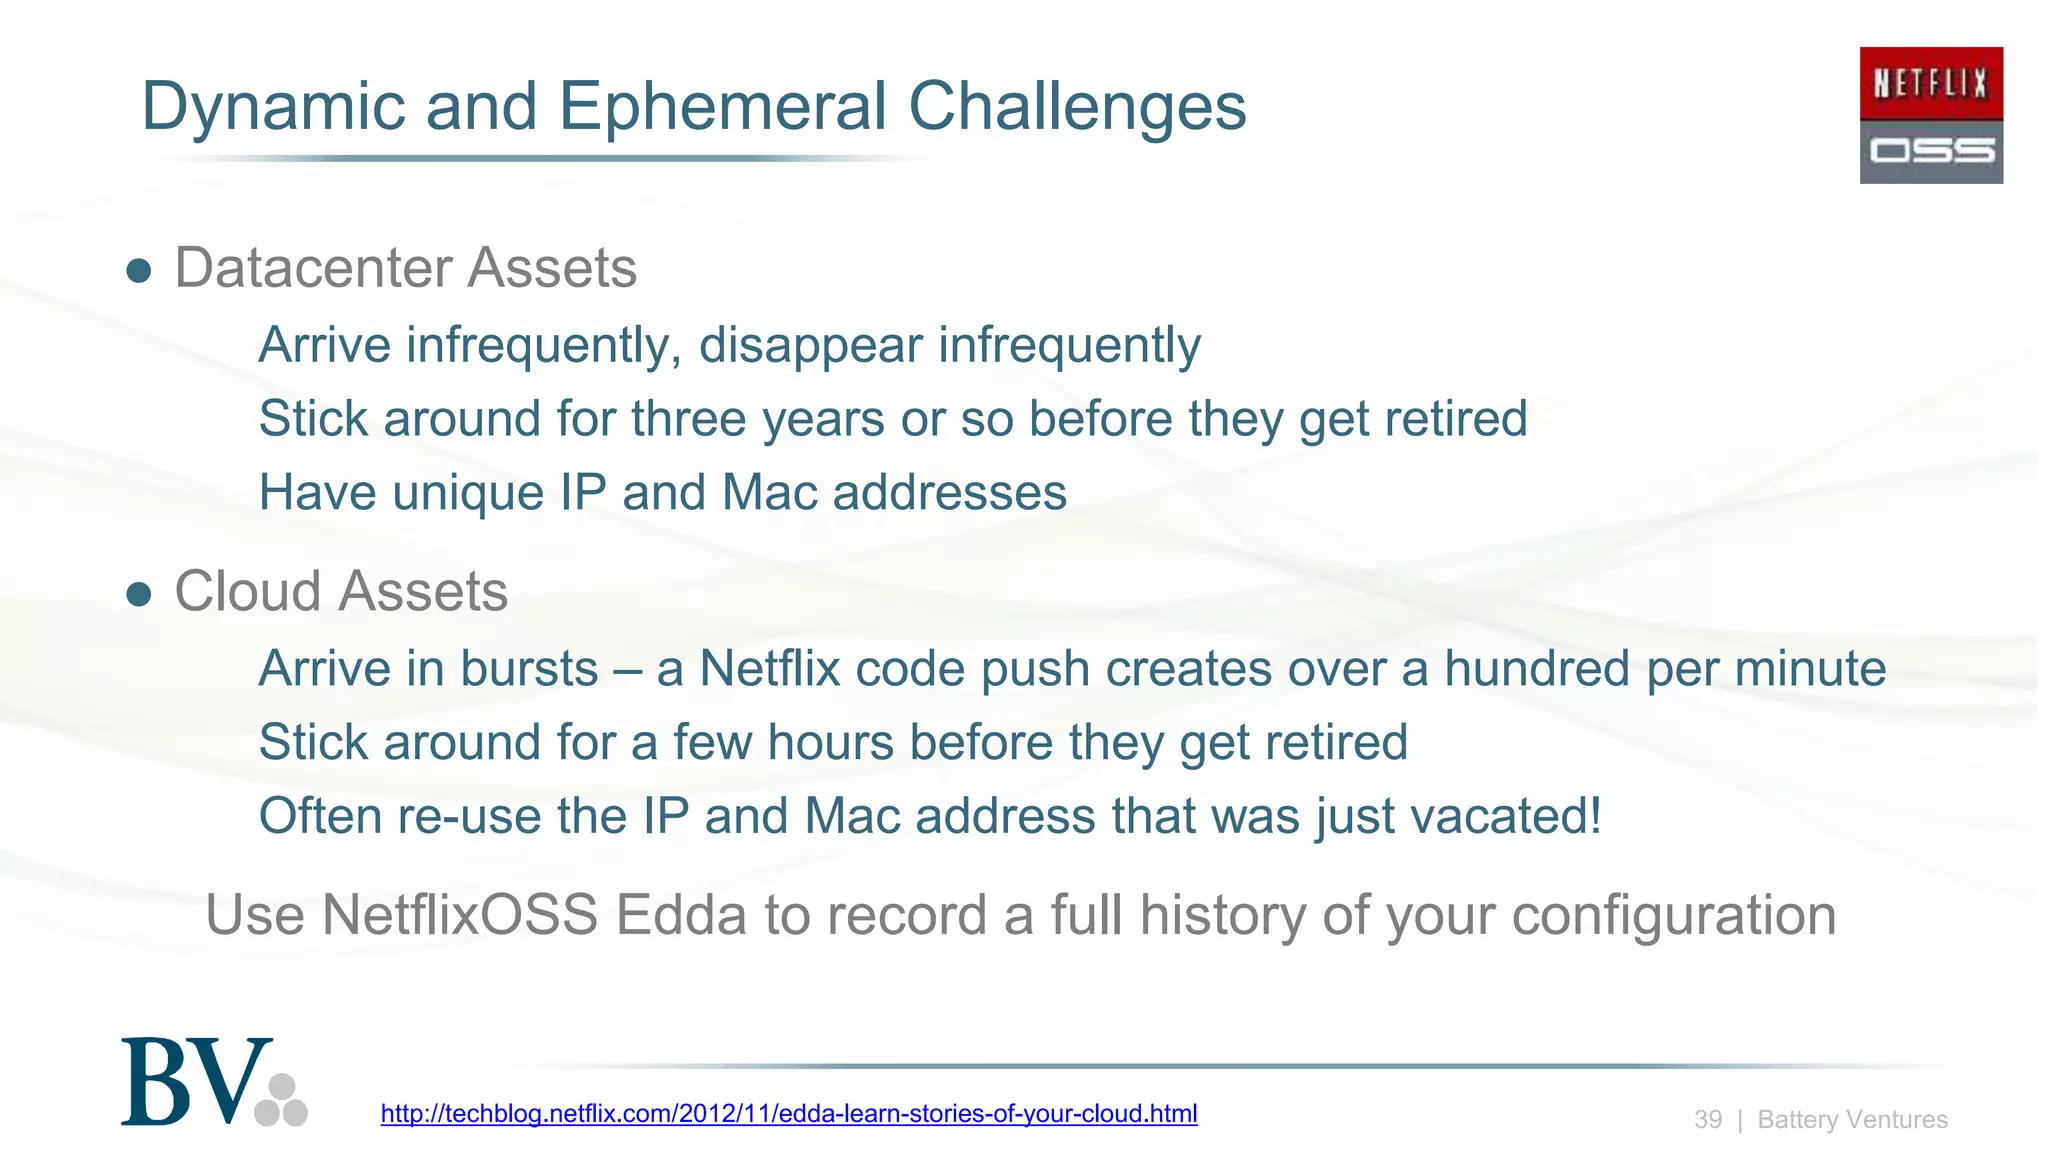
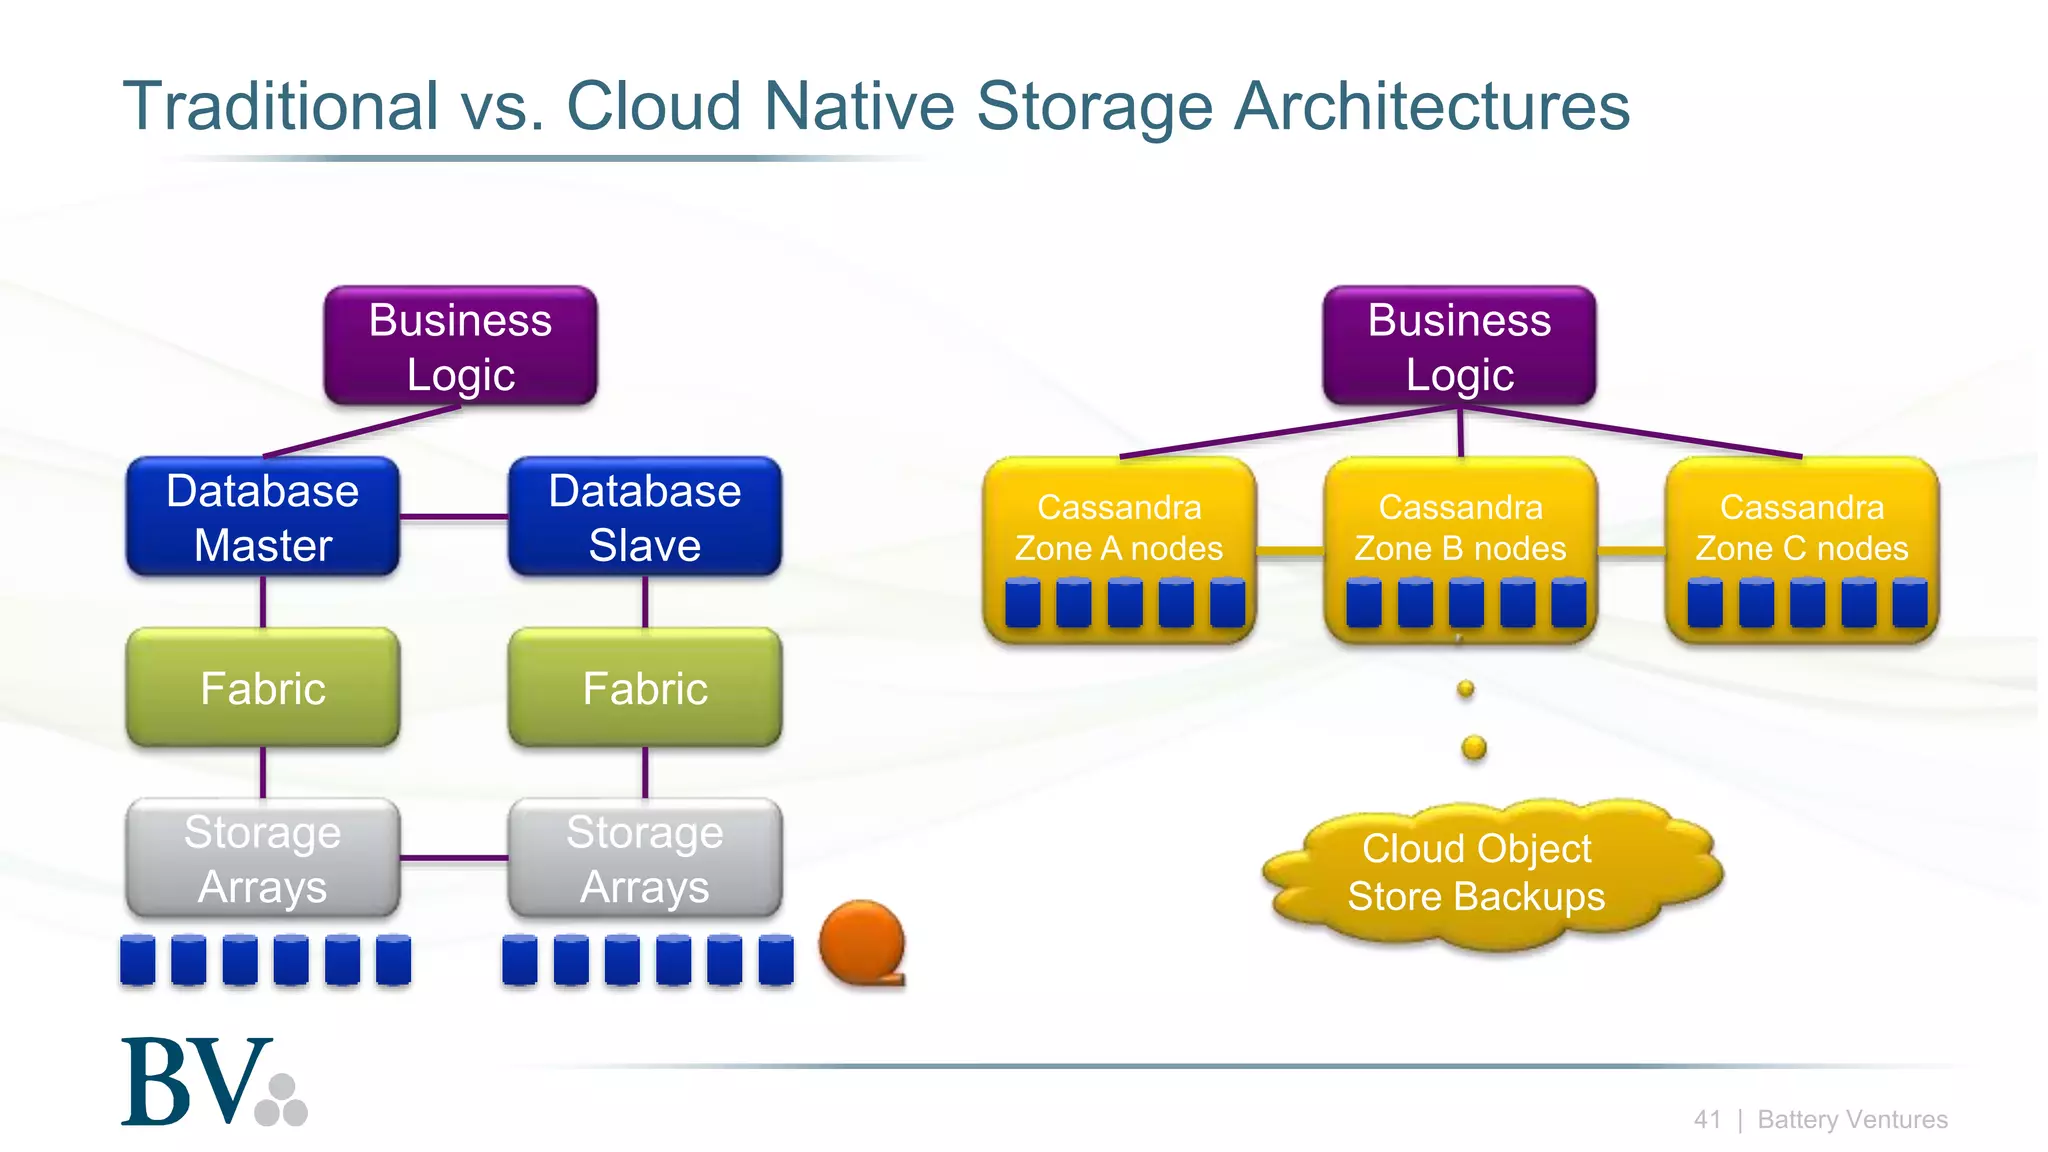
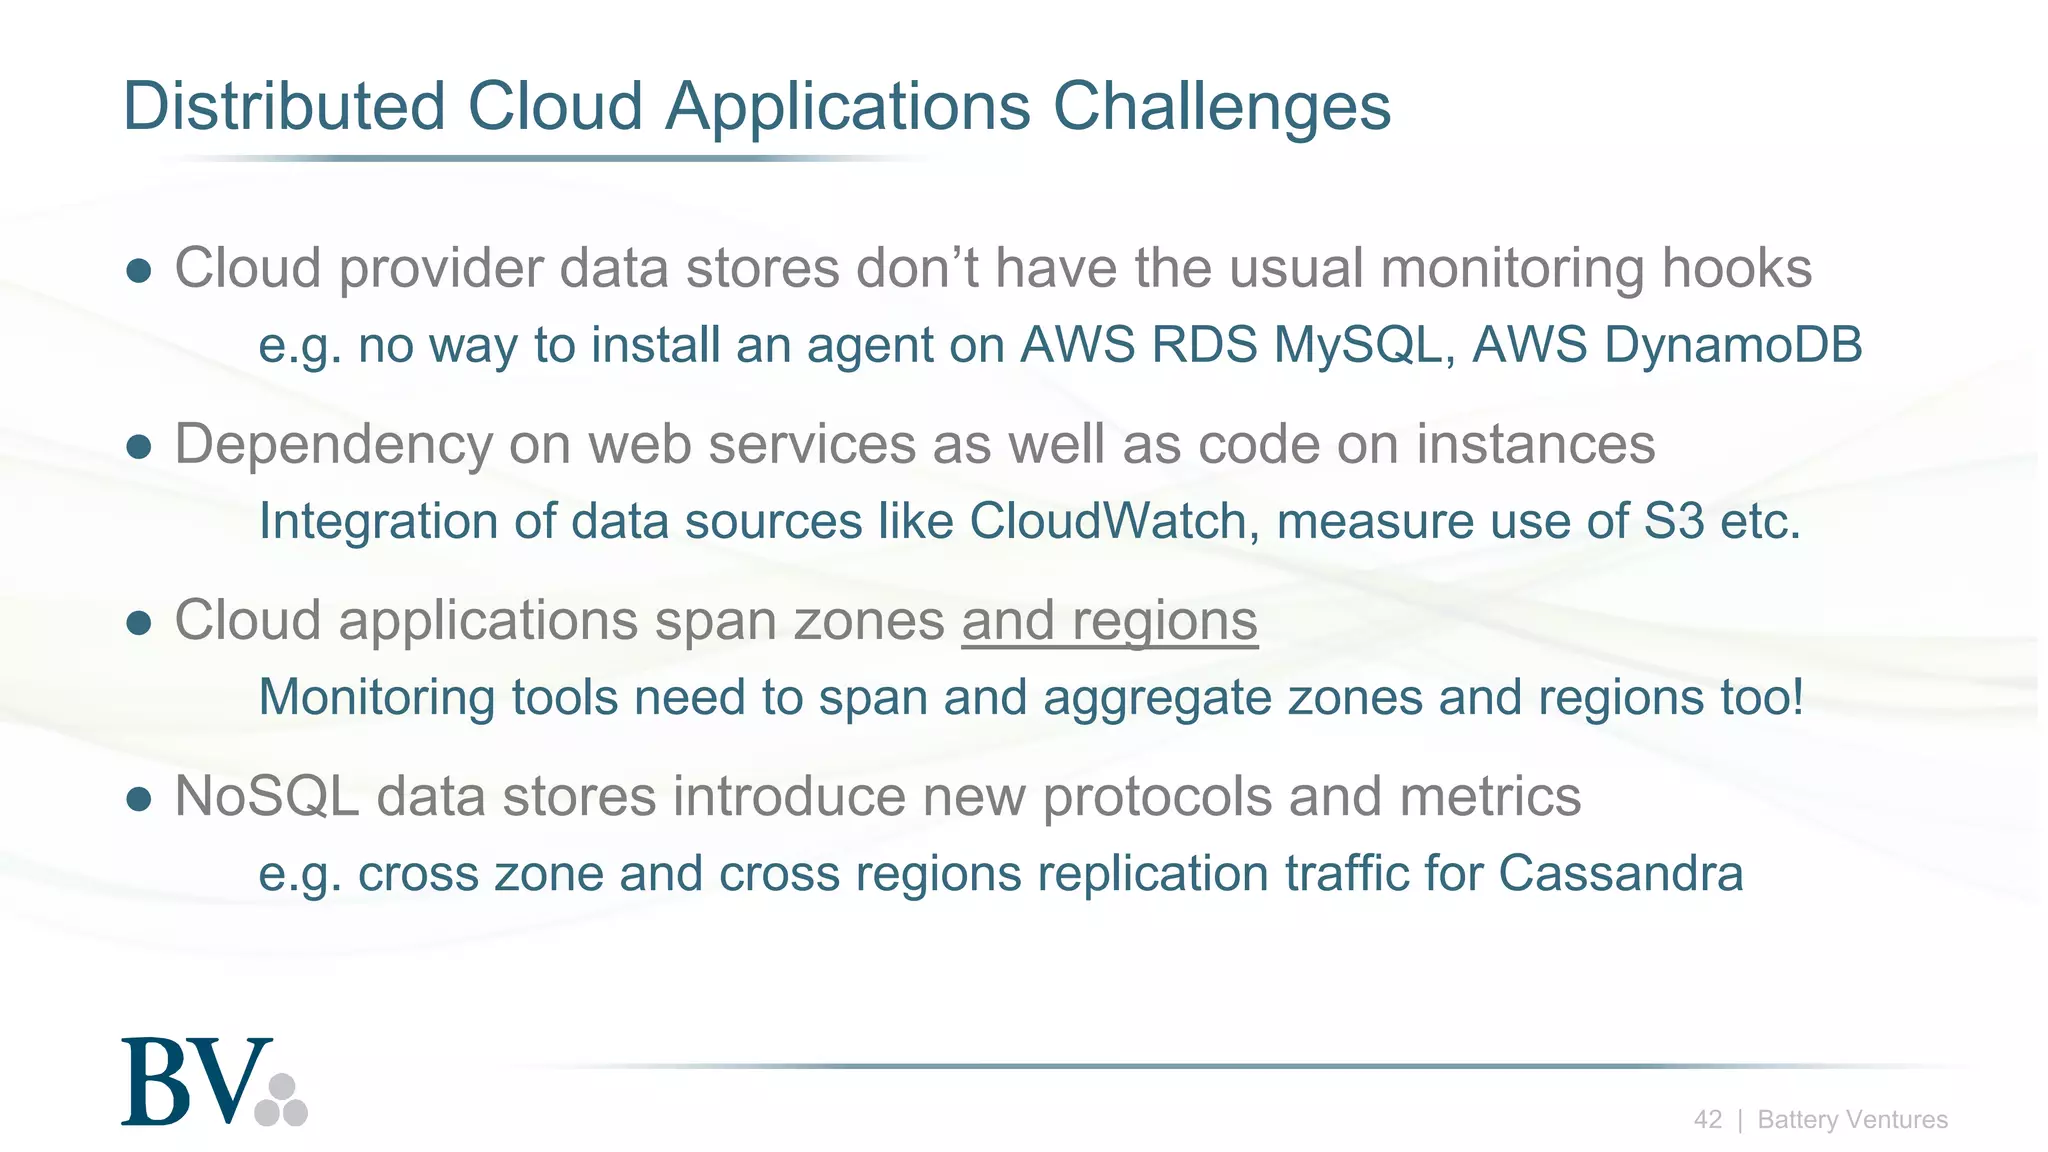
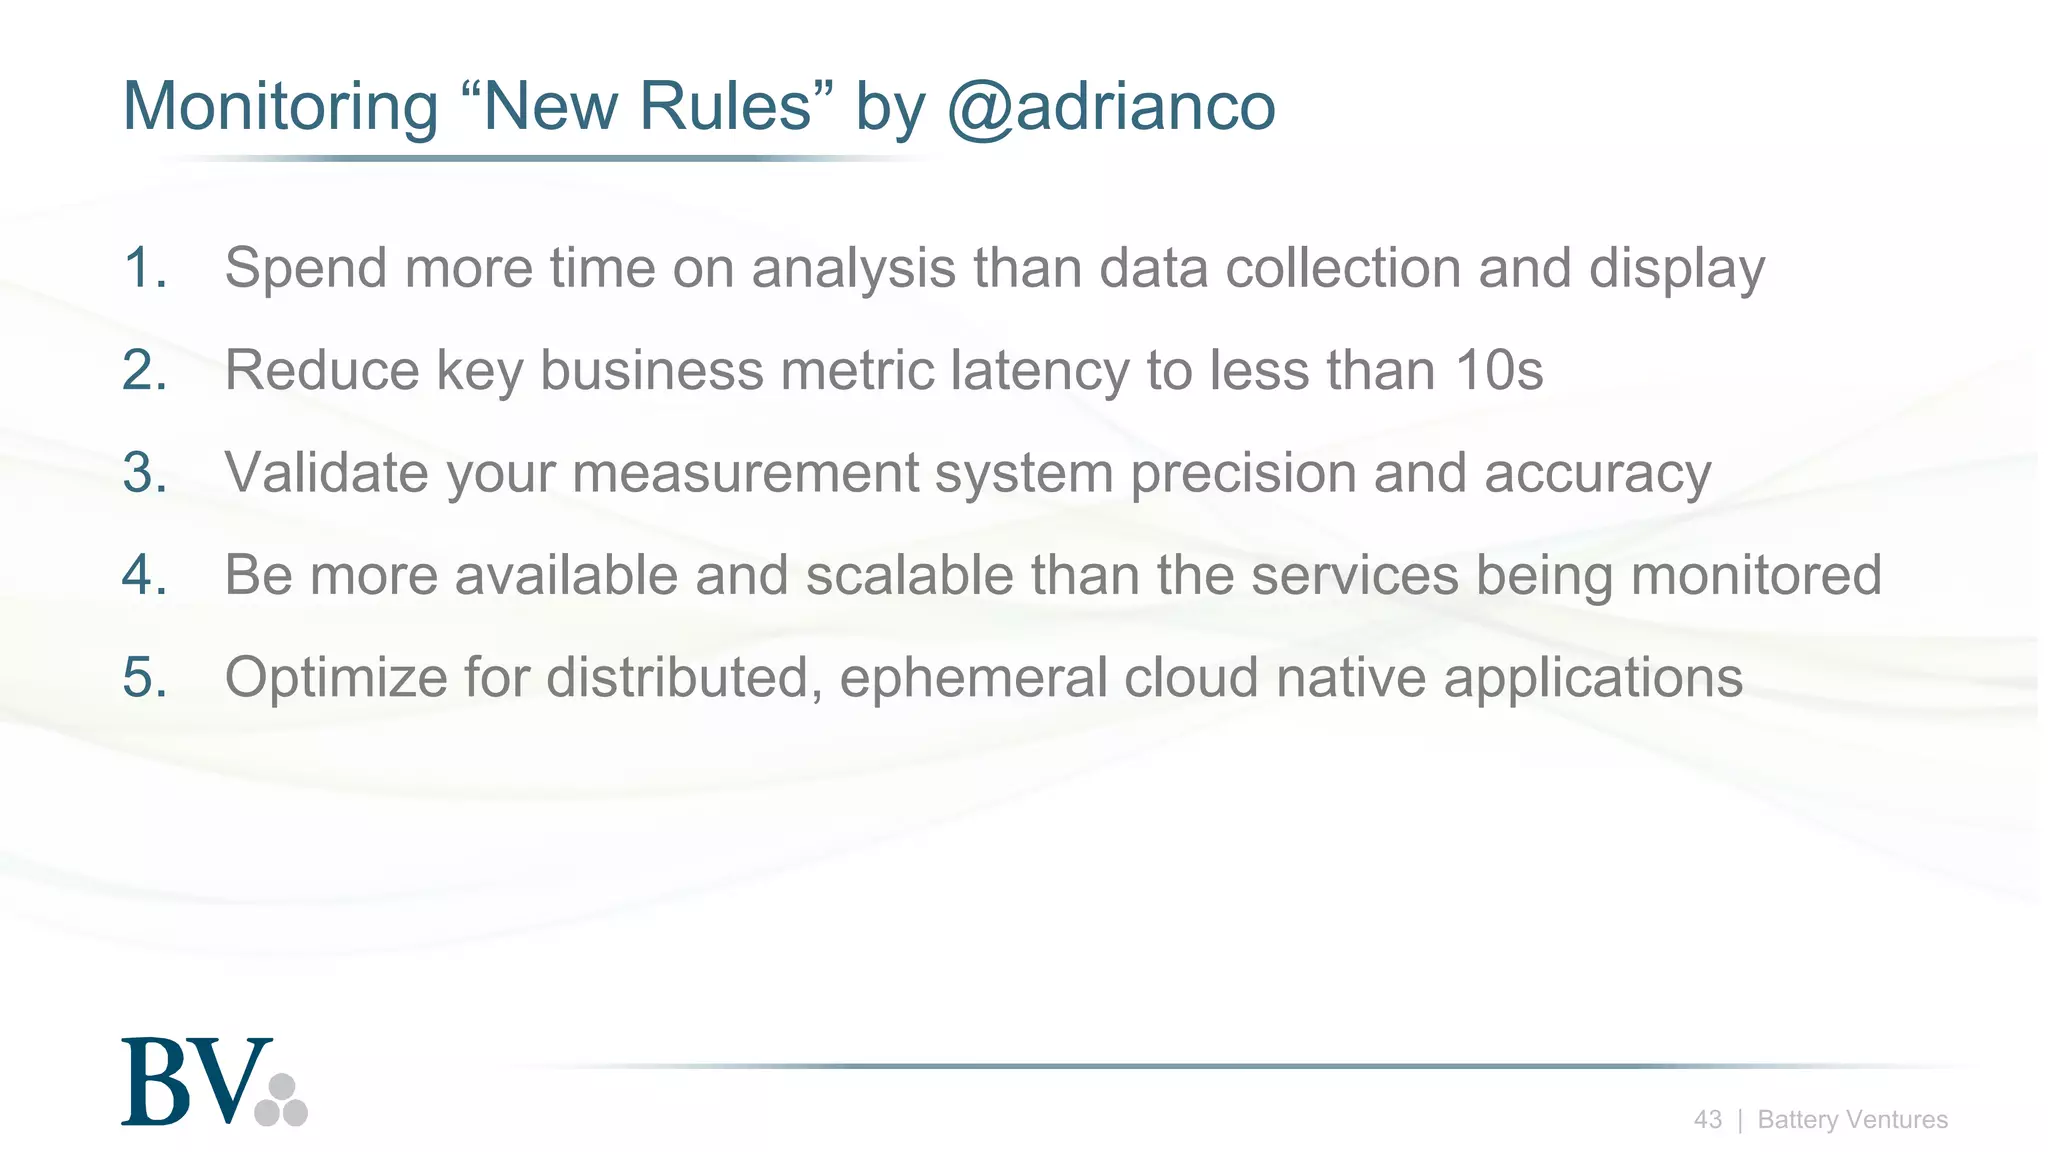

The document discusses the evolution and challenges of monitoring tools in the context of continuous delivery and microservices. It critiques traditional monitoring methods, advocating for a focus on metrics analysis instead of just collection and display. The author emphasizes the importance of immediate problem detection and the scalability of monitoring systems, particularly for dynamic cloud applications.


![Vibe Coding vs. Spec-Driven Development [Free Meetup]](https://cdn.slidesharecdn.com/ss_thumbnails/vibecodingvsspecdrivendevelopment-251209105622-43f455e7-thumbnail.jpg?width=640&height=640&fit=bounds)


![Coded Agents – with UiPath SDK + LangGraph [Virtual Hands-on Workshop]](https://cdn.slidesharecdn.com/ss_thumbnails/codedagentsdeck-251215155422-5497c599-thumbnail.jpg?width=640&height=640&fit=bounds)
