SlideShare a Scribd company logo
1 of 4
Break-Even Visualizer -- Template with provision to portray discount and "crash-cost" effects
www.cortrapar.com                        Copyright 2002 Corporate Training Partners, Inc.     traininginc@cortrapar.com

NOTES: No standardization exists in what costs organizations include in material and activity costs.
This template depends entirely on the judgment of the user in properly reflecting costs.
Many discount and excess-capacity costs increase on a non-linear (exponential) basis. In those cases,
this template will tend to underestimate the effects of aggressive discounting and over-capacity activity.
This template only applies discounts to units sold above capacity; if ALL units go down in price
as part of a discount, the impact is MUCH larger.
Instructions: Enter the data in the green user-data boxes as labeled.
The template creates a graph and data table of outcomes.
ATTENTION USER: Put cell A6 in the upper-left corner of your screen, to watch the graph update in real-time!

              User Inputs:


                                                       Percentage Unit
  Units per                                         Price discount and/or
    Year                                            selling cost increase                         Labor and
 at 100% of                                        to result in short-term    Material Cost      Activity Cost
   normal                         Sales Price        market share gains       (or "Variable      (or "Variable
 short-term   Organization's     per unit when      to exceed short-term       Cost") per         Cost") per
capacity (the     Period           sales rate        capacity (0% = zero      unit produced      unit produced
  capacity     (or "Fixed")      is well within   selling cost increases or   within normal      within normal
 already in       Costs            short-term       discounts required to      short-term         short-term
   place):       per year:          capacity              gain share)           capacity :         capacity :
  4,000,000 $70,000,000             $90.00                 23%                   $28.00             $40.00
  Capacity      Fixed Costs        Unit Price         Share Gain Costs           Mat'l/Unit        Conv/Unit

                        Break Even Visualizer with capability to show discount and "crash-cost" effects
  $700,000,000

  $600,000,000

  $500,000,000

  $400,000,000

  $300,000,000                                                                                          Column C   Column D   Colum

  $200,000,000

  $100,000,000

               $0
                         800,000    2,400,000 4,000,000 5,600,000 7,200,000
                    0         1,600,000 3,200,000 4,800,000 6,400,000
                                Units of Production & Sales

Table of Unit Sales, Gross Revenue, Costs, and Profit
Gross Revenue      Period                         Labor &
Percent of      Unit      per year less   (or "Fixed")      Material     Conversion
Short-Term     Sales     discounts and       Costs         Costs per      Costs per
Capacity      per Year    special costs     per year         Year           Year
    0%            0            $0         $70,000,000          $0            $0
    10%       400,000     $36,000,000     $70,000,000     $11,200,000    $16,000,000
    20%       800,000     $72,000,000     $70,000,000     $22,400,000    $32,000,000
    30%      1,200,000    $108,000,000    $70,000,000     $33,600,000    $48,000,000
    40%      1,600,000    $144,000,000    $70,000,000     $44,800,000    $64,000,000
    50%      2,000,000    $180,000,000    $70,000,000     $56,000,000    $80,000,000
    60%      2,400,000    $216,000,000    $70,000,000     $67,200,000    $96,000,000
    70%      2,800,000    $252,000,000    $70,000,000     $78,400,000   $112,000,000
    80%      3,200,000    $288,000,000    $70,000,000     $89,600,000   $128,000,000
    90%      3,600,000    $324,000,000    $70,000,000    $100,800,000   $144,000,000
   100%      4,000,000    $360,000,000    $70,000,000    $112,000,000   $160,000,000
   110%      4,400,000    $387,720,000    $70,000,000    $124,768,000   $178,880,000
   120%      4,800,000    $415,440,000    $70,000,000    $137,536,000   $197,760,000
   130%      5,200,000    $443,160,000    $70,000,000    $150,304,000   $216,640,000
   140%      5,600,000    $470,880,000    $70,000,000    $163,072,000   $235,520,000
   150%      6,000,000    $498,600,000    $70,000,000    $175,840,000   $254,400,000
   160%      6,400,000    $526,320,000    $70,000,000    $188,608,000   $273,280,000
   170%      6,800,000    $554,040,000    $70,000,000    $201,376,000   $292,160,000
   180%      7,200,000    $581,760,000    $70,000,000    $214,144,000   $311,040,000
   190%      7,600,000    $609,480,000    $70,000,000    $226,912,000   $329,920,000
scount and "crash-cost" effects

nginc@cortrapar.com

 ctivity costs.

In those cases,
apacity activity.
n price


aph update in real-time!


                     Percentage      Percentage
                    Material Cost  Labor & Activity
                   increase above   Cost increase
                       normal       above normal
                      short-term      short-term
                       capacity        capacity
                        (0% =           (0% =
                     zero cost to    zero cost to
                  exceed capacity) exceed capacity)
                        14%               18%
                   Mat'l Crash Cost   Conv Crash Cost

nd "crash-cost" effects


      Column C          Column D       Column G
Profit as a
                                percentage
 Total Costs                     of Gross
  Per Year   Profit Per Year       Sales
$70,000,000     -$70,000,000
$97,200,000     -$61,200,000      -170%
$124,400,000    -$52,400,000       -73%
$151,600,000    -$43,600,000       -40%
$178,800,000    -$34,800,000       -24%
$206,000,000    -$26,000,000       -14%
$233,200,000    -$17,200,000        -8%
$260,400,000     -$8,400,000        -3%
$287,600,000         $400,000        0%
$314,800,000      $9,200,000         3%
$342,000,000     $18,000,000         5%
$373,648,000     $14,072,000         4%
$405,296,000     $10,144,000         2%
$436,944,000      $6,216,000         1%
$468,592,000      $2,288,000         0%
$500,240,000     -$1,640,000         0%
$531,888,000     -$5,568,000        -1%
$563,536,000     -$9,496,000        -2%
$595,184,000    -$13,424,000        -2%
$626,832,000    -$17,352,000        -3%

More Related Content

Similar to Break even visualizer template

Cost Vs Budget PowerPoint Presentation Slides
Cost Vs Budget PowerPoint Presentation SlidesCost Vs Budget PowerPoint Presentation Slides
Cost Vs Budget PowerPoint Presentation SlidesSlideTeam
 
Actual Vs Budget Variance PowerPoint Presentation Slides
Actual Vs Budget Variance PowerPoint Presentation SlidesActual Vs Budget Variance PowerPoint Presentation Slides
Actual Vs Budget Variance PowerPoint Presentation SlidesSlideTeam
 
Budget Vs Actual Variance Analysis PowerPoint Presentation Slides
Budget Vs Actual Variance Analysis PowerPoint Presentation SlidesBudget Vs Actual Variance Analysis PowerPoint Presentation Slides
Budget Vs Actual Variance Analysis PowerPoint Presentation SlidesSlideTeam
 
Budget Variance PowerPoint Presentation Slides
Budget Variance PowerPoint Presentation SlidesBudget Variance PowerPoint Presentation Slides
Budget Variance PowerPoint Presentation SlidesSlideTeam
 
Business Budgeting PowerPoint Presentation Slides
Business Budgeting PowerPoint Presentation SlidesBusiness Budgeting PowerPoint Presentation Slides
Business Budgeting PowerPoint Presentation SlidesSlideTeam
 
Plan Vs Forecast PowerPoint Presentation Slides
Plan Vs Forecast PowerPoint Presentation SlidesPlan Vs Forecast PowerPoint Presentation Slides
Plan Vs Forecast PowerPoint Presentation SlidesSlideTeam
 
Eastman Chemical Company
Eastman Chemical CompanyEastman Chemical Company
Eastman Chemical CompanyFranklin Monzon
 
Brioneja Probabilistic Decision Analysis For Elastomeric Components Sep 16,...
Brioneja   Probabilistic Decision Analysis For Elastomeric Components Sep 16,...Brioneja   Probabilistic Decision Analysis For Elastomeric Components Sep 16,...
Brioneja Probabilistic Decision Analysis For Elastomeric Components Sep 16,...Jose Briones
 
Actual Cost Vs Plan Projection Powerpoint Presentation Slides
Actual Cost Vs Plan Projection Powerpoint Presentation SlidesActual Cost Vs Plan Projection Powerpoint Presentation Slides
Actual Cost Vs Plan Projection Powerpoint Presentation SlidesSlideTeam
 
CASE19CASE 20 Instructor VersionCopyright 2014 Health Ad.docx
CASE19CASE 20           Instructor VersionCopyright 2014 Health Ad.docxCASE19CASE 20           Instructor VersionCopyright 2014 Health Ad.docx
CASE19CASE 20 Instructor VersionCopyright 2014 Health Ad.docxwendolynhalbert
 
Economics presentation
Economics presentationEconomics presentation
Economics presentationshaikhaalm
 
Actual Cost Vs Budget Powerpoint Presentation Slides
Actual Cost Vs Budget Powerpoint Presentation SlidesActual Cost Vs Budget Powerpoint Presentation Slides
Actual Cost Vs Budget Powerpoint Presentation SlidesSlideTeam
 
Actual Cost Vs Budget PowerPoint Presentation Slides
Actual Cost Vs Budget PowerPoint Presentation Slides Actual Cost Vs Budget PowerPoint Presentation Slides
Actual Cost Vs Budget PowerPoint Presentation Slides SlideTeam
 
Actual Cost Vs Plan Projection PowerPoint Presentation Slides
Actual Cost Vs Plan Projection PowerPoint Presentation Slides Actual Cost Vs Plan Projection PowerPoint Presentation Slides
Actual Cost Vs Plan Projection PowerPoint Presentation Slides SlideTeam
 
Revenue Projection PowerPoint Presentation Slides
Revenue Projection PowerPoint Presentation SlidesRevenue Projection PowerPoint Presentation Slides
Revenue Projection PowerPoint Presentation SlidesSlideTeam
 

Similar to Break even visualizer template (20)

Cost Vs Budget PowerPoint Presentation Slides
Cost Vs Budget PowerPoint Presentation SlidesCost Vs Budget PowerPoint Presentation Slides
Cost Vs Budget PowerPoint Presentation Slides
 
Actual Vs Budget Variance PowerPoint Presentation Slides
Actual Vs Budget Variance PowerPoint Presentation SlidesActual Vs Budget Variance PowerPoint Presentation Slides
Actual Vs Budget Variance PowerPoint Presentation Slides
 
Budget Vs Actual Variance Analysis PowerPoint Presentation Slides
Budget Vs Actual Variance Analysis PowerPoint Presentation SlidesBudget Vs Actual Variance Analysis PowerPoint Presentation Slides
Budget Vs Actual Variance Analysis PowerPoint Presentation Slides
 
Budget Variance PowerPoint Presentation Slides
Budget Variance PowerPoint Presentation SlidesBudget Variance PowerPoint Presentation Slides
Budget Variance PowerPoint Presentation Slides
 
105136
105136105136
105136
 
Business Budgeting PowerPoint Presentation Slides
Business Budgeting PowerPoint Presentation SlidesBusiness Budgeting PowerPoint Presentation Slides
Business Budgeting PowerPoint Presentation Slides
 
Plan Vs Forecast PowerPoint Presentation Slides
Plan Vs Forecast PowerPoint Presentation SlidesPlan Vs Forecast PowerPoint Presentation Slides
Plan Vs Forecast PowerPoint Presentation Slides
 
Eastman Chemical Company
Eastman Chemical CompanyEastman Chemical Company
Eastman Chemical Company
 
moodle upload
moodle upload moodle upload
moodle upload
 
Brioneja Probabilistic Decision Analysis For Elastomeric Components Sep 16,...
Brioneja   Probabilistic Decision Analysis For Elastomeric Components Sep 16,...Brioneja   Probabilistic Decision Analysis For Elastomeric Components Sep 16,...
Brioneja Probabilistic Decision Analysis For Elastomeric Components Sep 16,...
 
Sales Math Workshop
Sales Math WorkshopSales Math Workshop
Sales Math Workshop
 
Cost behavior and contribution margin reporting
Cost behavior and contribution margin reportingCost behavior and contribution margin reporting
Cost behavior and contribution margin reporting
 
Actual Cost Vs Plan Projection Powerpoint Presentation Slides
Actual Cost Vs Plan Projection Powerpoint Presentation SlidesActual Cost Vs Plan Projection Powerpoint Presentation Slides
Actual Cost Vs Plan Projection Powerpoint Presentation Slides
 
CASE19CASE 20 Instructor VersionCopyright 2014 Health Ad.docx
CASE19CASE 20           Instructor VersionCopyright 2014 Health Ad.docxCASE19CASE 20           Instructor VersionCopyright 2014 Health Ad.docx
CASE19CASE 20 Instructor VersionCopyright 2014 Health Ad.docx
 
Economics presentation
Economics presentationEconomics presentation
Economics presentation
 
Actual Cost Vs Budget Powerpoint Presentation Slides
Actual Cost Vs Budget Powerpoint Presentation SlidesActual Cost Vs Budget Powerpoint Presentation Slides
Actual Cost Vs Budget Powerpoint Presentation Slides
 
Actual Cost Vs Budget PowerPoint Presentation Slides
Actual Cost Vs Budget PowerPoint Presentation Slides Actual Cost Vs Budget PowerPoint Presentation Slides
Actual Cost Vs Budget PowerPoint Presentation Slides
 
Actual Cost Vs Plan Projection PowerPoint Presentation Slides
Actual Cost Vs Plan Projection PowerPoint Presentation Slides Actual Cost Vs Plan Projection PowerPoint Presentation Slides
Actual Cost Vs Plan Projection PowerPoint Presentation Slides
 
Revenue Projection PowerPoint Presentation Slides
Revenue Projection PowerPoint Presentation SlidesRevenue Projection PowerPoint Presentation Slides
Revenue Projection PowerPoint Presentation Slides
 
KPI Dashboard Template in Excel
KPI Dashboard Template in ExcelKPI Dashboard Template in Excel
KPI Dashboard Template in Excel
 

Recently uploaded

RSA Conference Exhibitor List 2024 - Exhibitors Data
RSA Conference Exhibitor List 2024 - Exhibitors DataRSA Conference Exhibitor List 2024 - Exhibitors Data
RSA Conference Exhibitor List 2024 - Exhibitors DataExhibitors Data
 
VIP Call Girls In Saharaganj ( Lucknow ) 🔝 8923113531 🔝 Cash Payment (COD) 👒
VIP Call Girls In Saharaganj ( Lucknow  ) 🔝 8923113531 🔝  Cash Payment (COD) 👒VIP Call Girls In Saharaganj ( Lucknow  ) 🔝 8923113531 🔝  Cash Payment (COD) 👒
VIP Call Girls In Saharaganj ( Lucknow ) 🔝 8923113531 🔝 Cash Payment (COD) 👒anilsa9823
 
B.COM Unit – 4 ( CORPORATE SOCIAL RESPONSIBILITY ( CSR ).pptx
B.COM Unit – 4 ( CORPORATE SOCIAL RESPONSIBILITY ( CSR ).pptxB.COM Unit – 4 ( CORPORATE SOCIAL RESPONSIBILITY ( CSR ).pptx
B.COM Unit – 4 ( CORPORATE SOCIAL RESPONSIBILITY ( CSR ).pptxpriyanshujha201
 
Monte Carlo simulation : Simulation using MCSM
Monte Carlo simulation : Simulation using MCSMMonte Carlo simulation : Simulation using MCSM
Monte Carlo simulation : Simulation using MCSMRavindra Nath Shukla
 
9599632723 Top Call Girls in Delhi at your Door Step Available 24x7 Delhi
9599632723 Top Call Girls in Delhi at your Door Step Available 24x7 Delhi9599632723 Top Call Girls in Delhi at your Door Step Available 24x7 Delhi
9599632723 Top Call Girls in Delhi at your Door Step Available 24x7 DelhiCall Girls in Delhi
 
Mondelez State of Snacking and Future Trends 2023
Mondelez State of Snacking and Future Trends 2023Mondelez State of Snacking and Future Trends 2023
Mondelez State of Snacking and Future Trends 2023Neil Kimberley
 
Call Girls Pune Just Call 9907093804 Top Class Call Girl Service Available
Call Girls Pune Just Call 9907093804 Top Class Call Girl Service AvailableCall Girls Pune Just Call 9907093804 Top Class Call Girl Service Available
Call Girls Pune Just Call 9907093804 Top Class Call Girl Service AvailableDipal Arora
 
Pharma Works Profile of Karan Communications
Pharma Works Profile of Karan CommunicationsPharma Works Profile of Karan Communications
Pharma Works Profile of Karan Communicationskarancommunications
 
Value Proposition canvas- Customer needs and pains
Value Proposition canvas- Customer needs and painsValue Proposition canvas- Customer needs and pains
Value Proposition canvas- Customer needs and painsP&CO
 
Understanding the Pakistan Budgeting Process: Basics and Key Insights
Understanding the Pakistan Budgeting Process: Basics and Key InsightsUnderstanding the Pakistan Budgeting Process: Basics and Key Insights
Understanding the Pakistan Budgeting Process: Basics and Key Insightsseri bangash
 
Event mailer assignment progress report .pdf
Event mailer assignment progress report .pdfEvent mailer assignment progress report .pdf
Event mailer assignment progress report .pdftbatkhuu1
 
Grateful 7 speech thanking everyone that has helped.pdf
Grateful 7 speech thanking everyone that has helped.pdfGrateful 7 speech thanking everyone that has helped.pdf
Grateful 7 speech thanking everyone that has helped.pdfPaul Menig
 
Regression analysis: Simple Linear Regression Multiple Linear Regression
Regression analysis:  Simple Linear Regression Multiple Linear RegressionRegression analysis:  Simple Linear Regression Multiple Linear Regression
Regression analysis: Simple Linear Regression Multiple Linear RegressionRavindra Nath Shukla
 
Creating Low-Code Loan Applications using the Trisotech Mortgage Feature Set
Creating Low-Code Loan Applications using the Trisotech Mortgage Feature SetCreating Low-Code Loan Applications using the Trisotech Mortgage Feature Set
Creating Low-Code Loan Applications using the Trisotech Mortgage Feature SetDenis Gagné
 
Unlocking the Secrets of Affiliate Marketing.pdf
Unlocking the Secrets of Affiliate Marketing.pdfUnlocking the Secrets of Affiliate Marketing.pdf
Unlocking the Secrets of Affiliate Marketing.pdfOnline Income Engine
 
Mysore Call Girls 8617370543 WhatsApp Number 24x7 Best Services
Mysore Call Girls 8617370543 WhatsApp Number 24x7 Best ServicesMysore Call Girls 8617370543 WhatsApp Number 24x7 Best Services
Mysore Call Girls 8617370543 WhatsApp Number 24x7 Best ServicesDipal Arora
 
MONA 98765-12871 CALL GIRLS IN LUDHIANA LUDHIANA CALL GIRL
MONA 98765-12871 CALL GIRLS IN LUDHIANA LUDHIANA CALL GIRLMONA 98765-12871 CALL GIRLS IN LUDHIANA LUDHIANA CALL GIRL
MONA 98765-12871 CALL GIRLS IN LUDHIANA LUDHIANA CALL GIRLSeo
 
Call Girls In DLf Gurgaon ➥99902@11544 ( Best price)100% Genuine Escort In 24...
Call Girls In DLf Gurgaon ➥99902@11544 ( Best price)100% Genuine Escort In 24...Call Girls In DLf Gurgaon ➥99902@11544 ( Best price)100% Genuine Escort In 24...
Call Girls In DLf Gurgaon ➥99902@11544 ( Best price)100% Genuine Escort In 24...lizamodels9
 

Recently uploaded (20)

RSA Conference Exhibitor List 2024 - Exhibitors Data
RSA Conference Exhibitor List 2024 - Exhibitors DataRSA Conference Exhibitor List 2024 - Exhibitors Data
RSA Conference Exhibitor List 2024 - Exhibitors Data
 
VIP Call Girls In Saharaganj ( Lucknow ) 🔝 8923113531 🔝 Cash Payment (COD) 👒
VIP Call Girls In Saharaganj ( Lucknow  ) 🔝 8923113531 🔝  Cash Payment (COD) 👒VIP Call Girls In Saharaganj ( Lucknow  ) 🔝 8923113531 🔝  Cash Payment (COD) 👒
VIP Call Girls In Saharaganj ( Lucknow ) 🔝 8923113531 🔝 Cash Payment (COD) 👒
 
B.COM Unit – 4 ( CORPORATE SOCIAL RESPONSIBILITY ( CSR ).pptx
B.COM Unit – 4 ( CORPORATE SOCIAL RESPONSIBILITY ( CSR ).pptxB.COM Unit – 4 ( CORPORATE SOCIAL RESPONSIBILITY ( CSR ).pptx
B.COM Unit – 4 ( CORPORATE SOCIAL RESPONSIBILITY ( CSR ).pptx
 
Monte Carlo simulation : Simulation using MCSM
Monte Carlo simulation : Simulation using MCSMMonte Carlo simulation : Simulation using MCSM
Monte Carlo simulation : Simulation using MCSM
 
9599632723 Top Call Girls in Delhi at your Door Step Available 24x7 Delhi
9599632723 Top Call Girls in Delhi at your Door Step Available 24x7 Delhi9599632723 Top Call Girls in Delhi at your Door Step Available 24x7 Delhi
9599632723 Top Call Girls in Delhi at your Door Step Available 24x7 Delhi
 
Mondelez State of Snacking and Future Trends 2023
Mondelez State of Snacking and Future Trends 2023Mondelez State of Snacking and Future Trends 2023
Mondelez State of Snacking and Future Trends 2023
 
VVVIP Call Girls In Greater Kailash ➡️ Delhi ➡️ 9999965857 🚀 No Advance 24HRS...
VVVIP Call Girls In Greater Kailash ➡️ Delhi ➡️ 9999965857 🚀 No Advance 24HRS...VVVIP Call Girls In Greater Kailash ➡️ Delhi ➡️ 9999965857 🚀 No Advance 24HRS...
VVVIP Call Girls In Greater Kailash ➡️ Delhi ➡️ 9999965857 🚀 No Advance 24HRS...
 
Call Girls Pune Just Call 9907093804 Top Class Call Girl Service Available
Call Girls Pune Just Call 9907093804 Top Class Call Girl Service AvailableCall Girls Pune Just Call 9907093804 Top Class Call Girl Service Available
Call Girls Pune Just Call 9907093804 Top Class Call Girl Service Available
 
unwanted pregnancy Kit [+918133066128] Abortion Pills IN Dubai UAE Abudhabi
unwanted pregnancy Kit [+918133066128] Abortion Pills IN Dubai UAE Abudhabiunwanted pregnancy Kit [+918133066128] Abortion Pills IN Dubai UAE Abudhabi
unwanted pregnancy Kit [+918133066128] Abortion Pills IN Dubai UAE Abudhabi
 
Pharma Works Profile of Karan Communications
Pharma Works Profile of Karan CommunicationsPharma Works Profile of Karan Communications
Pharma Works Profile of Karan Communications
 
Value Proposition canvas- Customer needs and pains
Value Proposition canvas- Customer needs and painsValue Proposition canvas- Customer needs and pains
Value Proposition canvas- Customer needs and pains
 
Understanding the Pakistan Budgeting Process: Basics and Key Insights
Understanding the Pakistan Budgeting Process: Basics and Key InsightsUnderstanding the Pakistan Budgeting Process: Basics and Key Insights
Understanding the Pakistan Budgeting Process: Basics and Key Insights
 
Event mailer assignment progress report .pdf
Event mailer assignment progress report .pdfEvent mailer assignment progress report .pdf
Event mailer assignment progress report .pdf
 
Grateful 7 speech thanking everyone that has helped.pdf
Grateful 7 speech thanking everyone that has helped.pdfGrateful 7 speech thanking everyone that has helped.pdf
Grateful 7 speech thanking everyone that has helped.pdf
 
Regression analysis: Simple Linear Regression Multiple Linear Regression
Regression analysis:  Simple Linear Regression Multiple Linear RegressionRegression analysis:  Simple Linear Regression Multiple Linear Regression
Regression analysis: Simple Linear Regression Multiple Linear Regression
 
Creating Low-Code Loan Applications using the Trisotech Mortgage Feature Set
Creating Low-Code Loan Applications using the Trisotech Mortgage Feature SetCreating Low-Code Loan Applications using the Trisotech Mortgage Feature Set
Creating Low-Code Loan Applications using the Trisotech Mortgage Feature Set
 
Unlocking the Secrets of Affiliate Marketing.pdf
Unlocking the Secrets of Affiliate Marketing.pdfUnlocking the Secrets of Affiliate Marketing.pdf
Unlocking the Secrets of Affiliate Marketing.pdf
 
Mysore Call Girls 8617370543 WhatsApp Number 24x7 Best Services
Mysore Call Girls 8617370543 WhatsApp Number 24x7 Best ServicesMysore Call Girls 8617370543 WhatsApp Number 24x7 Best Services
Mysore Call Girls 8617370543 WhatsApp Number 24x7 Best Services
 
MONA 98765-12871 CALL GIRLS IN LUDHIANA LUDHIANA CALL GIRL
MONA 98765-12871 CALL GIRLS IN LUDHIANA LUDHIANA CALL GIRLMONA 98765-12871 CALL GIRLS IN LUDHIANA LUDHIANA CALL GIRL
MONA 98765-12871 CALL GIRLS IN LUDHIANA LUDHIANA CALL GIRL
 
Call Girls In DLf Gurgaon ➥99902@11544 ( Best price)100% Genuine Escort In 24...
Call Girls In DLf Gurgaon ➥99902@11544 ( Best price)100% Genuine Escort In 24...Call Girls In DLf Gurgaon ➥99902@11544 ( Best price)100% Genuine Escort In 24...
Call Girls In DLf Gurgaon ➥99902@11544 ( Best price)100% Genuine Escort In 24...
 

Break even visualizer template

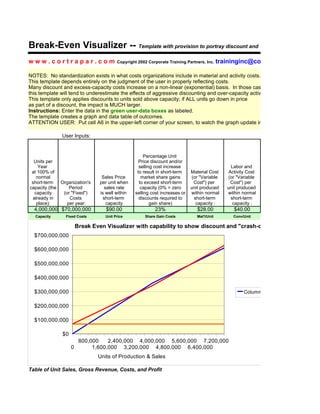
  • 1. Break-Even Visualizer -- Template with provision to portray discount and "crash-cost" effects www.cortrapar.com Copyright 2002 Corporate Training Partners, Inc. traininginc@cortrapar.com NOTES: No standardization exists in what costs organizations include in material and activity costs. This template depends entirely on the judgment of the user in properly reflecting costs. Many discount and excess-capacity costs increase on a non-linear (exponential) basis. In those cases, this template will tend to underestimate the effects of aggressive discounting and over-capacity activity. This template only applies discounts to units sold above capacity; if ALL units go down in price as part of a discount, the impact is MUCH larger. Instructions: Enter the data in the green user-data boxes as labeled. The template creates a graph and data table of outcomes. ATTENTION USER: Put cell A6 in the upper-left corner of your screen, to watch the graph update in real-time! User Inputs: Percentage Unit Units per Price discount and/or Year selling cost increase Labor and at 100% of to result in short-term Material Cost Activity Cost normal Sales Price market share gains (or "Variable (or "Variable short-term Organization's per unit when to exceed short-term Cost") per Cost") per capacity (the Period sales rate capacity (0% = zero unit produced unit produced capacity (or "Fixed") is well within selling cost increases or within normal within normal already in Costs short-term discounts required to short-term short-term place): per year: capacity gain share) capacity : capacity : 4,000,000 $70,000,000 $90.00 23% $28.00 $40.00 Capacity Fixed Costs Unit Price Share Gain Costs Mat'l/Unit Conv/Unit Break Even Visualizer with capability to show discount and "crash-cost" effects $700,000,000 $600,000,000 $500,000,000 $400,000,000 $300,000,000 Column C Column D Colum $200,000,000 $100,000,000 $0 800,000 2,400,000 4,000,000 5,600,000 7,200,000 0 1,600,000 3,200,000 4,800,000 6,400,000 Units of Production & Sales Table of Unit Sales, Gross Revenue, Costs, and Profit
  • 2. Gross Revenue Period Labor & Percent of Unit per year less (or "Fixed") Material Conversion Short-Term Sales discounts and Costs Costs per Costs per Capacity per Year special costs per year Year Year 0% 0 $0 $70,000,000 $0 $0 10% 400,000 $36,000,000 $70,000,000 $11,200,000 $16,000,000 20% 800,000 $72,000,000 $70,000,000 $22,400,000 $32,000,000 30% 1,200,000 $108,000,000 $70,000,000 $33,600,000 $48,000,000 40% 1,600,000 $144,000,000 $70,000,000 $44,800,000 $64,000,000 50% 2,000,000 $180,000,000 $70,000,000 $56,000,000 $80,000,000 60% 2,400,000 $216,000,000 $70,000,000 $67,200,000 $96,000,000 70% 2,800,000 $252,000,000 $70,000,000 $78,400,000 $112,000,000 80% 3,200,000 $288,000,000 $70,000,000 $89,600,000 $128,000,000 90% 3,600,000 $324,000,000 $70,000,000 $100,800,000 $144,000,000 100% 4,000,000 $360,000,000 $70,000,000 $112,000,000 $160,000,000 110% 4,400,000 $387,720,000 $70,000,000 $124,768,000 $178,880,000 120% 4,800,000 $415,440,000 $70,000,000 $137,536,000 $197,760,000 130% 5,200,000 $443,160,000 $70,000,000 $150,304,000 $216,640,000 140% 5,600,000 $470,880,000 $70,000,000 $163,072,000 $235,520,000 150% 6,000,000 $498,600,000 $70,000,000 $175,840,000 $254,400,000 160% 6,400,000 $526,320,000 $70,000,000 $188,608,000 $273,280,000 170% 6,800,000 $554,040,000 $70,000,000 $201,376,000 $292,160,000 180% 7,200,000 $581,760,000 $70,000,000 $214,144,000 $311,040,000 190% 7,600,000 $609,480,000 $70,000,000 $226,912,000 $329,920,000
  • 3. scount and "crash-cost" effects nginc@cortrapar.com ctivity costs. In those cases, apacity activity. n price aph update in real-time! Percentage Percentage Material Cost Labor & Activity increase above Cost increase normal above normal short-term short-term capacity capacity (0% = (0% = zero cost to zero cost to exceed capacity) exceed capacity) 14% 18% Mat'l Crash Cost Conv Crash Cost nd "crash-cost" effects Column C Column D Column G
  • 4. Profit as a percentage Total Costs of Gross Per Year Profit Per Year Sales $70,000,000 -$70,000,000 $97,200,000 -$61,200,000 -170% $124,400,000 -$52,400,000 -73% $151,600,000 -$43,600,000 -40% $178,800,000 -$34,800,000 -24% $206,000,000 -$26,000,000 -14% $233,200,000 -$17,200,000 -8% $260,400,000 -$8,400,000 -3% $287,600,000 $400,000 0% $314,800,000 $9,200,000 3% $342,000,000 $18,000,000 5% $373,648,000 $14,072,000 4% $405,296,000 $10,144,000 2% $436,944,000 $6,216,000 1% $468,592,000 $2,288,000 0% $500,240,000 -$1,640,000 0% $531,888,000 -$5,568,000 -1% $563,536,000 -$9,496,000 -2% $595,184,000 -$13,424,000 -2% $626,832,000 -$17,352,000 -3%