2. 2 1 Production Optimization
value stream method is going to be introduced using the example of an easily
comprehensible serial production, moving on to rather more complex case exam-
ples of small batch productions of high-variance as well as customer-specific
productions to illustrate the successful expansion of the value stream method’s
application range to include piece productions with complex multi-step production
structures and high product variance.
As the value stream method was originally developed by Toyota for their own
production systems, its application range initially seemed to be limited to the car
industry; however, numerous different examples of value stream optimization and
factory planning have since proved this wrong. Thanks to a few methodical
amendments and variations concerning the application of the design guidelines, its
implementation in other industries was enabled and positive experiences have
since been gained in machine construction as well as in the electrical and electron-
ics industries, in medical engineering and optics, sanitary and line technology as
well as the customer goods industry. The value stream method has thus proved
highly suitable for the analysis and new design of all types of piece productions.
Besides, experience has shown the method to be perfectly suited for multinational
large scale manufacturers and their suppliers as well as small and medium-sized
businesses.
This book is addressed to corporate management as well as to present and fu-
ture production managers. The value stream method provides the management
with a clear picture of the production and thus enables a precise assessment of the
inherent production requirements. Simple standardized symbolism allows the il-
lustration and comprehensible corporation-wide communication of different types
of improvement potential and their respective solution approaches. The detailed
description of the value stream method and the numerous practical examples
illustrate its many benefits and wide range of possible applications. The approach
is directly applicable and allows the targeted conception and implementation of a
improved productive efficiency.
A book on methods will never be able to make up for practical project experience
– no matter how many examples are given. However, it facilitates the targeted con-
textual collection of the respective experiences. This is greatly supported by the ob-
jective and neutral observations of an external advisor who is not yet used to
habitual restrictions and is thus able to disregard the same in his search for unre-
strained, innovative solution approaches. In order keep the initial dynamics of
beginning improvements moving and prevent the same petering out halfway, it is
recommended to make one person responsible for the intended implementation to
avoid prevarication on the grounds of day-to-day business. External monitoring may
keep up constant communication and thus also ensure the conceptual focus is kept.
Contents
Though the book at hand concentrates on details of production, production-related
cost effectiveness is not the central aspect of our investigations. Instead, the focus
lies on the purpose of all production: The actual product to be produced – though
this is not entirely correct either, as the purpose of a product is not really fulfilled
until it has been sold. Accordingly, the basic idea of assuming the customers’
3. 1.1 The Organisation of Production 3
point of view in the evaluation is of central importance for the method introduced
herein (Chap. 2).
Viewed from the point of corporate controlling, things usually look different,
though: Development, production and distribution of products are merely means
to achieve financial profit. Accordingly, costs – inclusively those of production –
become significant factors for the evaluation of a production. However, without a
successful business idea, without marketable products, hardly any profit will be
made. Cost assessment alone will therefore not be much help when it comes to
appropriately improving the design for the technical activities connected with a
production.
Accordingly, there is no point in planning how to increase the efficiency of
processes devised to aid the purpose of production until the usefulness of the re-
spective act of producing has been ascertained. Production optimization – if un-
derstood correctly – observes both aspects and thus begins with a critical analysis
of all customer-specific and product-related production processes. This is compre-
hensively reflected in the basic concept of a production design primarily striving
to prevent all waste (Chap. 3). For low-waste, i.e. lean production, it is not enough
to keep production costs low, the right products must be manufactured in accor-
dance with the customers’ wishes – the only way to ensure sustainable profitabil-
ity. However, the term ‘lean production’ should not be misunderstood – as often
happens – to mean ‘slim’: The goal is to keep the muscles but get rid of unneces-
sary fat.
The purpose behind the act of producing is to satisfy the customers’ wishes.
Customers’ wishes are satisfied by products featuring certain characteristics and
functionalities. The basic aspects are determined during the product development
stage and in the case of customer-specific products are later varied during order
processing. However, the customers’ specific desires comprise more than a basic
adaptation of product characteristics. Customers want products of a certain qual-
ity, available in certain quantities and within certain periods of time – and at cer-
tain prices, too. The production must therefore be aligned with different goals, the
interdependencies of which are going to be preparatively explained in the follow-
ing (Sect. 1.2). This detailed reflection on the goals of production is a vital pre-
requisite to conclusively achieve the required degree of usefulness in a production.
A purposeful production needs to be organized accordingly. A lean production
procedure is realized in the form of a customer-oriented, highly efficient value
stream. Seen from this value stream perspective, the entire production is focused
on the creation of value. The structure of the production is defined by its spatial
and social layout within the factory, where each value stream has its expedient lo-
cation. The organization of production as a value stream is going to be prefatorily
outlined in the following (Sect. 1.1).
1.1 The Organisation of Production
The organization of industrial production happens in factories. Not only does the
factory building provide the physical environment, the factory itself could also
be considered a sociotechnical production system (Sect. 1.1.1). In order to best
4. 4 1 Production Optimization
holistically regard the production procedure with all its correlations within the fac-
tory, the value stream perspective is assumed, showing the production as a value-
creating flow (Sect. 1.1.2).
1.1.1 The Factory
As a rule, a society’s wealth is usually based on its self-acquired material founda-
tions. Today, we quite aptly refer to industrial societies, in spite of information
and/or service societies, which are hardly ever fit to exist on their own. Etymol-
ogically, ‘industry’ means ‘diligence’ and ‘activity’. The central location of this
activity is the factory, in which necessary as well as not so necessary things are
produced. This is not done to secure sheer survival, but also to provide ‘objec-
tively superfluous’ goods, which simply make life more diversified and
interesting. The term ‘factory’ generally refers to a commercial business and/or
production facility for the mechanical and work-sharing production of goods – in
contrast to a traditional, manually operated manufacture. The VDI-Guideline 5200
on factory planning (guideline published 2010 by the German Association of En-
gineers, Verband deutscher Ingenieure, VDI) defines a factory ‘as a location
where value is created by way of work-sharing production of industrial goods us-
ing factors of production’. In practice, factories result from historically grown
changes and adaptations applied in factory operations as well as planned interven-
tions in factory planning.
A detailed depiction of a factory may be developed in five dimensions: the lo-
cation, the structure of the entire factory site, the factory building incl. factory
structure and layout, the production logistics as well as the work organization, all
of which are going to be discussed in further detail in the following.
Location. Initially, a factory is defined by its location: On a local level, the choice
of a location mainly depends on criteria such as price, size and topography, as well
as infrastructure, i.e. water and energy supply, roads, railways and waterways etc.
On a regional level, characteristics like human resources, labour market, wage
levels, taxes and subsidies as well as climate and cultural environment are taken
into consideration. All these location factors greatly influence the factory opera-
tions. Conversely, both a factory and its production processes must be suited for
their respective location and inherent characteristics. Thus, a factory is entrenched
in its environment.
Factory site. The factory site is situated at said location. The first boundaries are
fixed in connection with the initial structural planning. The existing terrain is
shaped, levelled and the parcel of land fenced in. Construction plots are defined
for future production, storage, and/or administrative buildings or those for social
purposes (such as canteens, company kindergardens). These buildings are logisti-
cally connected by paths and streets; space permitting, parking spaces and outdoor
facilities may also be planned. The resulting ideal structure of the premises illus-
trates the connection between the buildings within the factory compound as well
as external infrastructural connections. Basically, this is a small town of its own
5. 1.1 The Organisation of Production 5
with highly differentiated functions, though. Accordingly, the structural planning
of factory sites is actually part of an urban planner’s field of work.
Factory. At least one of the buildings on the site will be allocated to the factory
intended for production in the true sense of the word. Each factory is composed of
three basic components, i.e. the outer building shell, the structure of the internal
areas and the spatial arrangement of the resources within the factory layout. The
factory building comprises three elements: the building shell including supporting
structures, HVACR incl. media supply as well as all permanent support elements,
such as walls and apertures (windows, doors). Once the factory has been built, it
will still be empty from the production’s point of view. Within the factory build-
ing, different production areas will be created by way of segmentation in order to
create a transparent and efficient factory structure. In a manner of speaking, once
the rooms of a house have been defined, the matching furniture may be planned.
Technologies are chosen, appropriate resources such as machines and plants as
well as conveyor and storage techniques are devised, developed, constructed,
built, planned with a view to layout and finally installed. Among others, the deci-
sive layout criteria concern the material flows and their correlations, defining the
transport and storage of material between resources. The final result is the factory
layout, which describes the space requirements and the physical arrangement of
the production facilities in the narrower sense.
Logistics. Now that the construction of the factory has essentially been completed,
the real work – the action – begins: Machines and material must be set in motion.
This requires information on what needs to be done where and when. The infor-
mation flow organizes order processing-related tasks such as the recording, com-
piling, processing, storing and distributing of data and instructions required for
production planning and control. The factory is controlled and managed by way of
specially designed production logistics with the aid of production plans – convert-
ing the act of producing into systematic technical action. This systematic action is
guided by three logistical goals, namely a high degree of machine utilization, low
inventories and high delivery reliability. As these goals will hardly ever be able to
be met to identical degrees, the production planner is faced with the so-called
dilemma of production scheduling (Sect. 1.2.1). As a result, poorly planned tech-
nical actions will frequently be encountered factory operations, though these are
usually only ever revealed retrospectively.
Work organization. The fifth factory dimension is still missing – employees with
specific skills and qualifications whose production-related obligations and rights
are determined by the work organization. This allocation of tasks and persons or-
ganizes the distribution of work. The social factory dimension also includes work-
ing time models, shift rosters as well as pay scales. In addition, the employees are
organized in a structural organization which in turn determines the management
structure.
All five dimensions described above – location, site structure, factory building
incl. factory and layout, production logistics and work organization – are designed
and prepared for the actual factory operations during the factory planning stage.
6. 6 1 Production Optimization
The actual factory, i.e. the fully equipped building, could be regarded as the turn-
key product of a factory outfitter, turned over to the user ready for use. Equally
important though is the entrenchment of the factory in its geographical and social
environment as well as the installation of the target-oriented production logistics
to create the factory’s efficient and customer-related working order. However, the
work organization defining the social rules pertaining to the factory can only be
roughly planned – it cannot be sold like a product, it needs to be ‘lived’ in the fac-
tory. The latter is a vital prerequisite for the achievement of the production goals
and the success of the developed production concepts. Accordingly, a factory is a
highly complex sociotechncial system (Ropohl 1982). This does not make a fac-
tory a complicated and large technical device, but a technically shaped techno-
morphically designed and lived-in living space for living people.
A factory, seen as a space for living, could be referred to as a technotope (Er-
lach 2000) – in line with the term ‘biotope’. The human existence takes place –
and particularly so in a factory – in a technical environment. Human beings do
not simply surround themselves with technology – they are technology. This an-
thropological constant seems to be highly influential with a view to our lifestyle.
A factory is a place for living rather than a mere building or a simple production
facility. This also explains why the construction of factories with an attractive
working environment is a vital luxury, it’s the only possible way to allow and en-
able employees to fully dedicate themselves to their best possible performance. It
also explains why the design of successful factories often matches that of their
products.
1.1.2 The Value Stream
The question of what a factory looks like is generally answered by way of a pho-
tograph of the building, or factory site, respectively, as well as the traditional
overall result of the factory planning, i.e. the factory layout. However, this only re-
flects some aspects of a factory, as explained above. More often than not denomi-
nations, sizes and spatial arrangement of resources are stated, which are of little
informative value with respect to the production procedure and tell us nothing at
all about the quality of the factory. The presentation can be greatly improved by
charting the material flows. This illustrates the sequences in which certain prod-
ucts pass resources, allowing an evaluation of how well the sequences match the
layouts of resources. In cases of complex production procedures, though, the de-
piction of overlapping material flows quickly becomes confusing and an important
question arises: Though we can see that something is moving with the material
flow we have no way of knowing why, i.e. which information flow triggers which
production processes.
Value Stream Method
This is exactly where the value stream method and its advantages come in. It not
only visualizes production processes and material flows, but also information
7. 1.1 The Organisation of Production 7
flows – all within one and the same illustration. Additional flow charts of business
processes are merely required for extra detail. The process chain diagram found in
order processing is firmly rooted in value stream mapping; it visualizes the inter-
faces between production processes and business processes. Resources with simi-
lar functions are merged into production processes in the value stream map. This
abstracted value stream depiction increases the transparency of the production
processes as opposed to the numerous single machines individually shown in the
factory layout. The spatial layout of the resources is not shown, though. Accord-
ingly, a factory will always initially be devised, planned and depicted as a value
stream and subsequently as a layout (Sect. 4.1).
With its clear visualization of the production processes, the value stream
method provides an excellent internal communication platform for mutual inter-
change concerning the current state as well as the desired future state of a factory.
The comprehensive depiction of the production processes allows a transparent
factory analysis for the targeted identification of weaknesses as well as the deter-
mination of potential improvement (Chap. 2). Based on the aforesaid, the possible
effects of changed production procedures may be conceptionally examined with
the aid of design guidelines indicating the path towards an improved production
and a value stream-optimized factory (Chap. 3).
The term ‘value stream method’ includes two descriptive elements – ‘value’
and ‘stream’. ‘Value’ refers to the value creation inherent in the production of
goods. This describes the general intention of production: namely the conversion
of a source material into a product considered to be of higher value. The term
‘stream’ refers to the fact that an essential characteristic of said production lies in
the spatial movement and qualitative alteration of the parts and products in the
flow of production. Due to machine utilization and work-sharing specialization,
though, the various process steps cannot all be conducted at the same place – nor
at the same time.
Value
During the course of the production, the process of value creation furnishes the
source material with additional value, thus the finished products are appropriately
referred to as ‘goods’. The value of such goods results from their evaluation by
certain criteria. This leads to the fundamental problem of value arising from prod-
uct characteristics as well as from conformance with certain criteria. From the
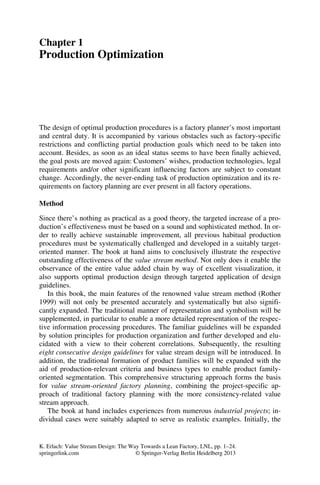
viewpoint of the producing company, an evaluation of the goods in line with the
respective production effort seems expedient – i.e. production costs are used as a
basis. This results in the type of calculation typically found in a supplier market:
The price is calculated as the total production costs plus a profit margin deter-
mined by the producer (Fig. 1.1, case 1). The customers are allocated the products
in the sequence of order receipt or other criteria. As the production costs invaria-
bly rise over time due to wage increases, replacement investments and increased
purchase prices, frequent increases in sales prices are also inevitable.
8. 8 1 Production Optimization
Profit
PriceofProduct
+ = - =
1 Principle of Profit Margin 2 Principle of Cost Reduction
MarketPrice
!
MarketPrice
Profit
ProductionCosts
ProductionCosts
Fig. 1.1 The principle of cost reduction
While a supplier market offers hardly any incentive for cost reduction, com-
petitive environments may well result in product prices higher than market prices.
In global competition with free market access, the corporate success depends
much more on the achievable market prices, where the profit is then conversely
determined by subtracting the production costs from the market price (Fig. 1.1,
case 2). Accordingly, the profit may also be increased by way of consistent cost
reduction. As far as the production is concerned, however, this requires constant
improvement in order to ensure a consistent decrease of production costs and thus
cushion inevitably rising factor costs through lower production effort. From the
production’s point of view, this is the only viable leverage to sustainably ensure
the competitiveness of a location.
Depending on the various possible location-specific combinations of applicable
factor costs, though, sustainable global competitiveness may be a hopeless venture
for some products. Therefore the corporate point of view should bear in mind that
the price also reflects a product’s value in use – based on the subjective criteria of
the customers’ expectations with a view to its actual usefulness. Said usefulness
results from the product’s ability to satisfy the respective customer’s wishes. Ac-
cordingly, a lamp may be better or less suited for reading, regardless of its price,
whereas representative features may by more dependent on the material quality
and may therefore directly influence the price. Regardless of the actual production
effort, the benefits of a product may well be much higher – or in the worst case
also lower – than the production costs. A production location’s success thus
largely depends on its concentration on the respective customer benefits generated
by the products. It is on the one hand influenced by concrete product characteris-
tics, which shall be disregarded herein, though; on the other hand it depends on the
customer-specific performance features of a production. The latter in particular are
also reflected by delivery reliability and delivery quality and largely depend on the
customer-oriented design of the entire production procedure.
Stream/Flow
The metaphor of a flow has widely established itself for the description of a fac-
tory’s production. Whenever something changes and/or moves in the production,
9. 1.1 The Organisation of Production 9
such as material flowing from station to station, the respective production is re-
garded to be positive. In a negative production, the production process is said to
have come to a halt, with material piling up and backing up. The production flow
is considered a decisive characteristic of a positive production process, a possible
key figure for its evaluation is the degree of flow.
However, change and movement within a factory are no guarantee for value-
adding properties of the respective activities, i.e. any real creation of value. This
aspect is emphasized by the term ‘value stream’. The value stream includes all
tasks and activities required for the conversion of raw material into a finished
product.
• Firstly, these tasks include all directly producing tasks, i.e. activities which
change the properties of the respective materials. They are broken down into
six main groups of manufacturing procedures as per German industrial standard
DIN 8580: primary shaping, shaping, separating, joining, coating and the al-
teration of substance properties.
• Secondly, they also comprise all logistical tasks concerning handling, transport,
storage, supply and commissioning.
• Thirdly, they include tasks generally referred to as indirect tasks, such as pre-
liminary planning and control as well as maintenance, servicing and repair of
machines, plants and workplaces.
There are also numerous ancillary tasks which may be required due to specific cir-
cumstances, local boundary conditions and technological requirements.
Assuming the value stream perspective means taking a comprehensive look at
all these tasks as a whole – with a focus on the creation of value. Not all of the
tasks mentioned above are considered value adding ones, though – the decisive
criterion is whether or not the respective tasks issue the material and later product
with any value-enhancing characteristics from a customer’s point of view – which
is not always easily determined with certainty. In addition, there are numerous
non-value adding tasks which seem vital for the production procedures due to dif-
ferent boundary conditions. Thus, one of the goals of production optimization is
the reduction or elimination of non-value adding tasks.
Improvement of Production
Accordingly, the effectual logic of a lean factory lies in consistent production im-
provement (Fig. 1.2).The presentation of this correlation is derived from the so-
called Deming Cycle known from quality management systems – the PDCA
(Plan-Do-Check-Act) Cycle. Continuous improvement is the force that pulls the
rotating wheel of the value stream upwards on the steep slope of production qual-
ity with the aid of an appropriate work organization. Waste of any kind is the
obstacle which must be overcome through increased effort in the realization of
improvement measures. Once implemented, improvements are secured through
determination of binding standards, because positive production procedures are
characterized by repetitive execution of procedures in an identical manner. The il-
lustration clearly highlights the vital significance of the respective standardization
10. 10 1 Production Optimization
– without which the gravity of bad habits would soon drag the level of production
back down the hill again. Besides, certain disturbances and a great part of the
waste occurring in production can only be made visible against the background of
such standards. All design guidelines for a value stream optimized factory there-
fore aim at standardization or even presuppose the same. Whenever new produc-
tion technologies are introduced – usually in connection with new or significantly
changed products – the process of continuous improvement begins from scratch.
Those promoting the changes will have learned from previous experience, though,
and may thus be better equipped for a faster qualitative ascent this time.
Fig. 1.2 The effectual logic of continuous production improvement
However, before a new production can be designed, or an existing production
be improved, respectively, the respective factory goals and their priorities must be
clarified and weighted accordingly. Specific individual goals may be hierarchi-
cally arranged in a specific system of goals. On the highest level of abstraction,
there are four independent goal dimensions which are not mutually reducible,
though. These goal dimensions as well as their correlations and interdependencies
are going to be discussed in greater detail in the following.
1.2 The Four Goals of Production
The first question that arises in the optimization of a production asks which goals
the intended improvements should measure up to. The achievement of the respec-
tive goals then indicates the quality and efficiency of a production, enabling the
respective factors indicating the success of such factory products in the market to
be defined accordingly. Said success factors indicate which customers’ desires
need to be met by which performance criteria in order for a factory to successfully
establish itself in the market.
Work Organisation
Standardisation
Waste
LEAN
FACTORY
VALUE STREAM
Continuous
Improvement
Quality of Production
11. 1.2 The Four Goals of Production 11
The primary objectives of production are known as the ‘holy trinity’ of cost,
quality, and time – the sequence varying according to the ‘felt’ importance. Most
important is to point out the right direction of goal achievement – low production
costs, high quality of products, as well as short lead times in production and order
processing. Recently, though rarely, the product variety on offer is added to these
production goals. Gone are the times of mass production, characterised by Henry
Ford’s statement, “You can have any colour you want, as long as it is black.”
Products produced in series and not positioned within the lowest price segment
can only be distinguished from competition by the ‘long tail’ of innumerable pos-
sible variants.
Goal Dimensions
Accordingly, a production’s efficiency is always basically determined by four in-
dependent goal dimensions (Fig. 1.3). On a general level, the four dimensions of
variability, quality, speed and economy span the entire width of a production’s ap-
plicable system of goals. Each goal dimension comprises several typical partial
goals, which in their reciprocal correlations define a production’s system of goals
and accordingly also the factory goals. These highly interdependent factory goals
of the four dimensions may sometimes conflict with each other, though (Sect.
1.2.1). They are not interchangeable, i.e. goals allocated to a specific goal dimen-
sion cannot be converted into or reduced to any of the goals pertaining to other
goal dimensions. Quality targets for instance will not automatically be met along
with necessary changeover reductions; nor may they be regarded merely with a
view to profitability when designing a factory, though they may be allocated dif-
ferent levels of relevance through appropriate weighting.
Fig. 1.3 The four goal dimensions of production
The four goal dimensions shall be illustrated in further detail by way of exam-
ples of their respective partial goals in the following:
1. The variability of production indicates how wide the attainable production
range is. This dimension determines how many variants will be produced
for what product – and whether there are customised products. The
flexibility of a production system indicates to what extent short-term
variations of market demand can be met. Mutability describes the ability
e.g.
• Range of Variants
• Customised Products
• Flexibility of Facilities
• Mutability
• Qualifications of Workers
e.g.
• Rejections & Rework
• Ergonomics
• Occupational Safety
• Schedule Reliability
• Direct Responsibility
e.g.
• Operation Time
• Changeover time
• Uptime
• Production lead time
• Sick Leave
e.g.
• Material utilisation
• Energy / Eco Efficiency
• Capacity Utilisation
• Space Efficiency
• Employee Productivity
Increasing Efficiency regarding the Goal Dimensions of Production
Variability Quality Speed Economy
12. 12 1 Production Optimization
of production to respond to requirements changing in the short to medium
term by adapting structures.
2. On the one hand, the quality of production indicates the rate of yield of
production processes. On the other, it describes how well the tolerance
levels are complied with, as well as how reliable any of the production
processes works. This is closely connected to the question whether the
exact number of pieces can be produced to obtain the necessary quantities.
Also ergonomics and occupational safety of the production processes are a
quality measure within production. In addition, schedule reliability – both
internal and external – is a quality feature of production.
3. The speed of production indicates how time-consuming the value-adding
steps are, as well as the auxiliary operations such as changeover activities.
The length of production lead time also falls under this goal dimension.
The availability of machines and other facilities expresses the qualitative
reliability of production processes in terms of time. Frequency and
duration of breakdown greatly impact the efficiency of production.
4. The economy of production indicates productivity in relation to all
production factors. Here, all factor costs arise that are influenced by the
requirements of variability, quality, and speed. Directly relevant are
personnel productivity, capacity utilisation, and material utilisation; i.e.
sustainability in a broader sense.
The above given sequence of goal dimensions does not reflect their significance.
The importance of any goal and goal dimension depends on the specific conditions
of production. The sequence, however, indicates the logical succession for defin-
ing the required goals in each goal dimension. Therefore, one begins with the
definition of the product range to be produced to achieve market success. Then,
the desired product quality and accompanying production quality have to be de-
termined. If, in consequence, the technologies for the production processes are
established, operation times and process duration can be calculated. Finally, econ-
omy can be checked after designing and selecting the facilities to achieve the other
above-stated goals. At last, this economy view has repercussions on the other three
goal dimensions. Often, some of the aspired features of production design are too
expensive or inefficient. As a rule, the repercussions lead to mutual restrictions in
goal accomplishment. For cost reasons as well as for other restrictions, variability,
quality or speed of production will be limited to certain extent.
Production optimization aims to consistently increase the efficiency of the pro-
duction in spite of the four conflicting goal dimensions, bearing in mind, though,
that the relative weighting of the various goals has changed over time – mainly
as a result of technological developments and increased social wealth. With in-
creasing wealth and technological experience, the original desire to simply own a
certain product gives way to certain expectations with a view to desired product
qualities, such as functionality and quality. Such rising expectations as to product
efficiency are often accompanied by ready acceptance of (slightly) higher prices,
but sometimes lead to immense pressure with a view to pricing and lower expecta-
tions. This experience is based on the fact that increasing social wealth is
only possible with consistently decreasing prices or increasing efficiency at only
13. 1.2 The Four Goals of Production 13
moderately increasing prices. Accordingly, cost pressure in production is the in-
evitable downside of social wealth, enabled through technological progress, which
allows decidedly higher profitability in the production and at the same time offers
various ways to meet more of the performance-related goals with only minimal
loss of profitability.
Success Factors
These rather broad boundaries allow companies the specific positioning of their
products in the market. The concrete goals within the four goal dimensions depend
on the specific success factors of the company in the market. And related to these
success factors, a product can be more or less costly. The respective price level
can be justified by material quality, workmanship, durability and reliability,
design and image of brand, availability, product innovation, consequential
charges, environmental friendliness and other more (Fig. 1.4). The analogous
structure of the goal dimensions of production and the success factors of products
shows that both should be adjusted to each other. The objectives at a specific
production site must comply with the respective specifications of success factors.
The strengths of each production site should meet the specific demands of the
products to be produced there.
Fig. 1.4 The four success factors of products in market
Goal dimensions
Production optimization aims at the constant improvement of production effi-
ciency with respect to four conflicting goal dimensions. These four dimensions
– variability, quality, speed and cost-effectiveness – are reflected in the market
as the success factors of the respective products. The essential strategic pa-
rameters of a production are comprehensively defined with the aid of the mar-
ket goals of availability, delivery capability, delivery reliability and delivery
time.
1.2.1 The Dilemma of Production Process Planning
The challenge for production management is to find the best way to achieve the
different and conflicting goals. Typical measures to improve the achievement of
one goal lead to a deterioration of goal achievement in the other goal dimensions.
• Availability
• Product Design
• Product Innovation
• Delivery Reliability
• Delivery Capability
• Product Reliability
• Delivery Time • Price
• Cost of Ownership
• Recycling Capability
Success Factors of Products in Market
Variability Quality Speed Economy
14. 14 1 Production Optimization
These goal contradictions appear in scheduling and material planning with regard
to three target criteria for both cases. They are known in literature as the 'dilem-
mas' of material planning and scheduling (Gutenberg) or as the goal conflicts of
production logistics (Wiendahl 1995) and are going to be slightly modified and il-
lustrated in the form of a triangle diagram below. Based on this preliminary work
and supplemented by the fourth goal dimension of ‘variability’, a general diagram
of goal dimensions is going to be developed (Sect. 1.2.2).
Dilemma of Production Scheduling
The dilemma of production scheduling usually occurs during production schedul-
ing, or production-related time scheduling, respectively (Fig. 1.5), which aim to
complete production orders and, above all, customer orders on schedule. Delivery
reliability is a measure of logistical process reliability in factory, which has to be
maximised (goal dimension ‘quality’). If customer demand is varying, this goal
can be achieved quite simply with more or less unlimited production capacities.
Due to restricted investment resources, capacities are always limited. That’s why
scheduling also aims to ensure high capacity utilisation. It is a precondition to
achieving low respectively marketable production costs (goal dimension ‘econ-
omy’). For that it is necessary to level production quantity.
The realisation of a levelled production volume leads inevitably to variations in
the throughput time of both customer orders and production orders, if customer
demand is varying. This jeopardizes the goal of delivery reliability, because the
compliance of schedules requires foreseeable throughput times. In general, short
throughput times are easier to predict than longer ones. This is firstly because
there is less time for schedule-related postponements. So to speak, production
orders are already executed before any schedule deviations can be planned.
Therefore, and secondly, production systems with short throughput times can be
more easily controlled, because laborious changes of schedules and priorities can
be avoided. Thirdly, higher percentage variations of throughput time are of
slighter importance. A fifty percent delay for a two day delivery time would be
one day, which can be compensated by express delivery, whereas the same delay
for a one month delivery time would be painful two weeks (goal dimension
‚speed’). Consequently it is the main objective of production scheduling to
achieve high schedule reliability, high reliability of throughput time as well as low
production costs. Accordingly, the maximisation of capacity utilisation contradicts
the maximisation of schedule reliability as well as the minimisation of throughput
time, whereas the latter both are to some extent compatible as also shown in the
illustration (Fig. 1.5).
Limited production capacity is additionally restricted by the technical
availability of the resources. Machine utilisation, throughput time and, above all,
schedule reliability decline in an unpredictable way. Further restrictions are
caused especially by setup requirements. On the one hand, setups diminish the
available capacity and thereby increase resource costs, resulting in higher capacity
requirements. On the other hand, setups necessitate lot-sizing, which usually does
not correspond with customer demand. Lot sizes and their sequence, the setup
15. 1.2 The Four Goals of Production 15
sequence, are both parameters to optimise production scheduling with respect to
conflicting goals (Fig. 1.5). The setups generate a goal conflict between the
necessity of producing a variant desired by the customer and the necessity to
create appropriate lot sizes and maintain the setup sequence in order to have
enough capacity available. Thus, production scheduling is internally influenced by
three determining factors – availability, lot sizes, and setup sequence.
Fig. 1.5 Dilemma of production scheduling with conflict of goals and determining factors
Dilemma of Material Planning
The dilemma of material planning appears both in planning the material of semi-
finished parts and final products as well as in the materials management for raw
material procurement (Fig. 1.6). The objective of material planning is to reach
high delivery capability, which means to be able to meet the customer’s requested
delivery date. Delivery capability is a measure of logistical process capability in
factory, which has to be maximised (goal dimension ‘quality’). This could be eas-
ily reached if all products would be held available as finished goods in the maxi-
mum quantity of customer orders. According to the multiplicity of final product
variety, the capital tie-up costs and the need for storage space would be exorbitant.
To avoid this, it is necessary to plan raw material and semi-finished parts. The re-
quired minimisation of inventory presumes a shortened replenishment lead
time for suppliers as well as internal prefabrication. It is an important additional
condition that delivery time must be short enough to meet market demand (goal
dimension‚ speed’).
Destocking as a result of shortened replenishment lead time requires more
frequent orders in smaller order quantities with more frequent transports. More
frequent orders, lead to increasing material costs. This is a result of higher
administration expenses, smaller order quantities in smaller packaging, as well as
more frequent deliveries. The task of procurement is to achieve low costs of
material planning and procurement while order transactions become more frequent
with smaller quantities. In the same way, placing more frequent production orders
increases the internal costs of prefabrication. These costs have to be minimised by
reducing controlling expenses, transporting distances, and changeover times (goal
dimension ‚economy’). Accordingly, scheduling aims to secure a factory’s process
Capacity
Utilisation
Throughput
Time
Schedule
Reliability
Maximize ! Minimize !
Maximize !
Availability
Lot Size
Setup Sequence
16. 16 1 Production Optimization
Delivery Frequency
Replenishment Lead Time
Material
Costs
Inventory
Delivery
Capability
Minimize !
Maximize !
Minimize !
Fig. 1.6 Dilemma of material planning with conflict of goals and determining factors
capability with a view to material availability and/or delivery capability, it keeps
procurement costs low and minimizes raw material and semi-finished goods in-
ventories. Accordingly, the maximisation of delivery capability contradicts the
minimisation of inventory as well as the minimisation of material costs (Fig. 1.6).
Material planning and management can be optimised by adjusting delivery
frequency and replenishment lead time (Fig. 1.6). Increasing delivery frequency
allows for placing smaller order quantities with suppliers and prefabrication, this
being prerequisite for reducing raw material and semi-finished parts. The
maximum level of delivery frequency is confined by order costs. Cutting down on
costs incurred by an operation makes it possible to ease the goal conflict and
improves the production process as a whole. Lowering replenishment time
shortens the planning horizon so that procurement can respond quickly to varying
customer demand. However, reducing replenishment time by increasing
inventories at the supplier’s to enable him to supply from stock at short notice is
not sufficient, because sooner or later this will lead to higher purchase prices. Nor
is it helpful, with lengthy replenishment times, to simply increase delivery
frequency, as inventories would be increased by wrong forecasts, bearing in mind
that there are usually multiple deliveries on the road.
Goal Dilemma of Production
The above investigation of the scheduling and material planning dilemma proves
that the generally known goal conflicts in production are confined to the three ma-
jor goals of quality, speed and economy. In sum, this can be visualised by a trian-
gle scheme indicating the dilemma of the three traditional production goals (Fig.
1.7). In the following, the goal dimensions will be further analysed taking the ex-
ample of a number of selected sub-goals of key significance, depicted below with
their respective direction.
Quality. Here, a distinction has to be made between technological quality goals
and logistic quality goals. Technological quality becomes noticeable in the output,
i.e. the product quality, as well as in the processes, i.e. in production quality.
17. 1.2 The Four Goals of Production 17
Fig. 1.7 Overview displaying the dilemma of the three goals of production
The difference refers mainly to when and where an error is detected. If this hap-
pens in the factory, it results in scrap or rework. Quality defects are handled
directly on the shop floor. If a defect is detected after being delivered, then this
impacts the customer’s evaluation of product quality. This affects one of the suc-
cess factors.
The logistic quality performance is mainly measured in terms of schedule
adherence. Basically, four different dates can be distinguished: The customer
requested due date stated in the order, the delivery date agreed in the order con-
firmation, the internal completion date planned on the shop floor, and finally the
actual shipping date. Ideally, all of these four dates refer to the same point in time.
If the dates deviate from each other, the deviations from two dates will result in
separate quality performance measures. In industrial practice it makes sense to
measure the following three performance indicators:
• Delivery capability indicating to what degree the customer requested due date
corresponds with the delivery date confirmed for the desired delivery quantity.
• Delivery quality indicating the share of customer orders delivered in the right
quantity without product quality defects (product quality) at the confirmed de-
livery date (delivery reliability).
• Delivery reliability indicating the share of parts and products manufactured in
the right quantity and on schedule by the planned completion date.
Delivery capability is related to the logistic process capability, whereas delivery
quality is related to the logistic process reliability (Wiendahl 2002). Both are mar-
ket goals pursued by companies. Internal delivery reliability, however, is usually
concealed from the customer, being only relevant to the scheduling of internal op-
erations. In general, there is a difference between market and company goals.
If possible, all quality performance measures relating to schedule adherence and
absence of defects should be maximised.
Speed. For time-based production indicators, a similar distinction can be made
between market and company goals. The former are indicated or measured as
Economy
Price
Capacity Utilisation
Productivity
Material Costs
Speed
Delivery Time
Throughput Time
Inventory
Replenishment Time
Quality
Delivery Reliability
Delivery Capability
Quality of Products
Schedule Reliability
Maximize Sub-goal
Minimize Sub-goal
18. 18 1 Production Optimization
delivery times, the latter as lead times. With regard to market, the aim is to come
up with competitive delivery times. Internally, this is accomplished through rapid
order fulfilment, extending from order entry or order capturing to shipment.
This is to be distinguished from internal production lead time. It correlates with
inventories, which accordingly, despite being cost factors, function more or less as
time-based production measures. Delivery time and production lead time are to
some extent independent of each other. While delivery time in comparison to lead
time exceeds the latter because of the additional steps of administrative order han-
dling, it is shorter than the latter due to the missing part of customer-independent
prefabrication.
Another time factor is the replenishment lead time. It may refer to the length of
internal customer-independent prefabrication as well as to the external procure-
ment of raw material from suppliers. The latter directly affects the delivery time of
customer-specific parts. In case of a sudden and strong increase in demand, even
order-independent material may run out, with negative effects on delivery time.
The internal replenishment time does not only depend on the length of the prefab-
rication time, i.e. the corresponding lead time, but also on the time required for
scheduling and dispatching the relevant production orders.
The success factor of shorter delivery times can be supported by reducing the
time-based measures mentioned above, especially by speeding up production, pro-
curement and order fulfilment processes. If the time-based measures are mini-
mised so that they fall below the value needed to achieve the requested delivery
time, even the quality goal of delivery capability can be fostered despite limited
capacity. This correlation points to the fact that the goals are interdependent and
mutually affect each other, as described below.
Economy. The key market success factor – provided you could agree on the ser-
vices to be ordered – is price. To make profits with competitive prices in global
competition, it is vital to minimise all costs. Economy calculation, however, is a
rather complicated affair and therefore will not be dealt with here. Only the three
main factors of personnel, operating resources and material are briefly highlighted.
It should be noted that not the absolute cost rates but the corresponding relative
performance measures are key.
• Essential for an assessment of the economic efficiency of personnel are not the
labour costs per man-hour but personnel productivity, e.g. measured as unit
labour costs. It should be noted that investments also affect personnel produc-
tivity. Thus, fixed costs overlap with variable costs, though they cannot be in-
fluenced in the same way.
• Machine-hour rates are part of fixed costs but virtually depend on utilisation,
which in turn depends on demand and the selected lot sizes.
• Material costs do not only depend on external factors, such as purchase price
and transport costs, but also on internal procedures including ordering costs,
which are related to order frequency. Production technologies also have an ef-
fect on the material cost per unit via the degree of material utilisation, e.g. in
case of scrap.
19. 1.2 The Four Goals of Production 19
Performance figures
Each of the three goal dimensions of quality, speed and economy can be dis-
tinguished in terms of market goals and factory goals. Market goals include
delivery quality and delivery capability, delivery time and delivery price. Fac-
tory goals basically cover delivery reliability, lead time, replenishment time,
productivity, utilisation, and material costs. These are some of the common
key figures used to measure production performance, which can be extended
according to the respective company circumstances.
A performance measurement system for a production system must set out
from the factory goals with parameters being adjusted to market goals, and
needs to be structured, of course, in line with the goal dimensions.
It has not been dealt with the mutual dependencies of the three classic goal di-
mensions. Moreover, the fourth goal dimension of variability needs to be added to
the triangle scheme. This should be achieved in the following by constructing the
logical square of goals.
1.2.2 The Logical Square of Goals
The fourth goal, which is about an increased variability of production systems, is
rarely discussed in the technical literature on production organisation or explicitly
mentioned in passing only. Thus another dimension is added to the goal dilemma
of production described in greater detail above. In setting out the factory goals it is
therefore necessary to consider the specific goal conflicts of the four independent
and not interchangeable dimensions, and to take appropriate decisions. The fol-
lowing section will not only deal with the fourth goal dimension, but also with
the course the individual conflict lines take between the goal dimensions in the
expanded goal dilemma of production.
Variability
The market goal here is deliverability. This parameter indicates whether a product
is deliverable at all, regardless of its momentary availability. While delivery capa-
bility informs whether an item is available on a specified delivery date or not,
deliverability indicates whether, in principle, a customer need can be met and sup-
plied, i.e. what the product range on offer looks like.
Accordingly, one factory goal must be the ability to cover the variety of
products on offer. Flexibility and mutability ensure that the entire product range in
its variety and extent of customisation can be produced. In comparison with the
other goals, variability is of increasing importance to the business success. In
many markets, companies can only maintain their competitiveness by attaching
particular weight to this goal. Top quality is often considered a matter of course
and only the ability to make tailor-made products that are made quickly available
to the customer allows a company to distinguish itself from the product standard
available all over the world with, for the most part, low profit margins.
20. 20 1 Production Optimization
Goal Conflicts
As already indicated above, the four goal dimension conflict with each other at
varying degrees. The goal conflicts are more or less severe. Some goals can be
more easily achieved than others; some goals are compatible to a certain extent;
the attainment of others is completely incompatible. In sum, the possible relation-
ships between the four goal dimensions can be distinguished into four types:
1. The contradictory antagonism of goals describes the strongest type of con-
flict. Here, an improved level of goal achievement for the one goal deterio-
rates that of the other goal.
2. With the contrary antagonism of goals, the goal achievement of the two op-
posing goals is irreconcilable. This somewhat alleviated conflict means
that the attainment of the two goals cannot be improved at the same time;
anyhow, the fulfilment of the one goal can be improved without negatively
affecting the fulfilment of the other goal.
3. Some goals are basically easier to accomplish than others thanks to their
lower implementational requirements. This subordination of goals is to be
understood in a logical sense, not in terms of practical relevance.
4. Compatibility of goals exists if the levels of goal achievement for two goals
can not be deteriorated simultaneously, if not explicitly aimed at. In this
case, the two goals can be better accomplished independently.
Logical Square of Goals
Now the four goal dimensions can be arranged into a square. The four sides and the
two diagonals add up to a total of six oppositions for the four goal dimensions.
Each of these oppositions can be related to one of the goal conflicts described
above. The relationships between the four goal dimensions and the relevant goal
conflicts can be depicted by the logical square of goals (Fig. 1.8). As the arrange-
ment of the four goal dimensions into a square depends on the respective type of
mutual goal conflict, it is not arbitrary. This schematic depiction illustrates the
different logical features of the goal conflicts in production. The general representa-
tion of the relationships makes it easier to find out what type of antagonism lies be-
hind currently realised goal conflicts and to achieve at least partial compatibility.
All six goal conflicts will be described in greater detail in the following section.
1. Quality & Economy: contradictory antagonism of goals
This conflict line indicates that the improvement of quality will lead to higher
costs. Thus, enhanced product quality requires more precise and thus more expen-
sive resources, more highly skilled and therefore better paid employees, and
maybe additional quality assurance processes that are not for free. If one refrains
from these additional expenses, direct scrap costs will increase for the supposedly
higher quality requirements, as now fewer parts will be within the tolerance range.
The frequently pursued goal of increasing economy with larger lot sizes to achieve
better utilisation, however, will reduce logistic quality. Since larger lots lead to
longer and more variable waiting times in front of the resources, the times spent
21. 1.2 The Four Goals of Production 21
Economy
Price
Capacity Utilisation
Costs
Productivity
Quality
Delivery Reliability
Delivery Capability
Quality of Products
Schedule Reliability
Variability
Availability
Variety of Products
Mutability
Speed
Delivery Time
Throughput Time
Inventory
Compatibility of Goals
SubordinationofGoals
SubordinationofGoals
Contradictory Antagonism of Goals
Contrary Antagonism
of Goals
Fig. 1.8 The logical square of production goals with its six conflict lines
waiting for urgently needed parts will rise, thus reducing delivery reliability. The
goal conflict can be resolved to some extent by trying to achieve a quality level in
line with the market price.
2. Variability & Speed: contradictory antagonism of goals
This conflict line indicates that an increase in variability will lead to longer deliv-
ery times or higher stock levels. A simple example of this effect would be the
Kanban supermarket warehouse in which all variants must be stored. Stock levels
will rise with the number of variants and so will production lead time (Sect. 3.3.2).
The shortest possible delivery time can be achieved by holding products on stock,
since stock withdrawal is usually faster than manufacturing. Make-to-stock, how-
ever, is only possible for a limited product range; for make-to-order products this
is utterly impossible. In general the following is true: The higher the number of
variants and the more customised a product, the earlier in the manufacturing proc-
ess chain must customer-oriented production start and the longer the customer
must wait. The goal conflict can be resolved to some extent by moving the point
of variant creation to the latest possible point in the manufacturing process. Simi-
larly, if flexible machines are used for processing, then the whole process often
slows down. The more tools are required and the more different work fixtures are
used, the more difficult it will be to increase processing speed.
22. 22 1 Production Optimization
3. Variability & Quality: contrary antagonism of goals
This conflict line indicates that, on the one hand, an increase in variability makes
it more difficult to meet quality goals and, on the other hand, an increase in quality
requirements lead to restricted variety and flexibility. Thus, an increase in product
variety due to customer-specific design adaptations, for example, brings about a
completely new type of risk associated with unplanned delays. Accordingly, de-
livery reliability may decrease, but need not. Becoming better in this field than in
series production is a rather implausible goal. By definition, quality problems due
to slow or incorrect design adaptations cannot occur with catalogue products. In
general, an increase in variety places higher demands on production systems, lead-
ing to poor parts quality, poor schedule adherence or poor delivery capability. The
goal conflict can be resolved to some extent by slowly increasing requirements on
the one side to enable the other side to improve alongside, i.e. not to fall behind or,
if so, only marginally.
4. Variability & Economy: Subordination of goals
This conflict line indicates that most often it is easier to improve productivity and
utilisation than to expand the product range. In general, it is easier to cut the
manufacturing cost of a standard product than to make an existing production sys-
tem more flexible in order to be able to manufacture a diversified product range.
Increasing the adaptability of an existing production system is an even greater
challenge, since it requires construction as well as changing the design of manu-
facturing resources. Conversely, a more flexible machine can also be better
utilised than an inflexible machine. Accordingly, both goal dimensions can be ful-
filled to greater extent, though being located on a completely different level of
production design. At the same time, they will conflict with each other, as too
much flexibility will, as a rule, make it inefficient.
5. Quality & Speed: Subordination of goals
This conflict line indicates that, as a rule, it is more difficult to raise quality than
speed. Thus, by holding goods in stock it is easy to minimise the delivery time, the
real challenge lying in the ability to deliver punctually in any case, typically hav-
ing anything in stock except for the desired variant. Likewise, it is also easier to
manufacture quickly than in good product quality; or to reduce production lead
time by decreasing stocks than being capable to deliver at all times. If one devel-
ops a good strategy to manage the manufacturing process, it is also possible to im-
prove delivery reliability by cutting down on lead time. Similarly, the quality of
some production processes will rise, if execution is accelerated.
6. Economy & Speed: Compatibility of goals
This conflict line indicates that, as a rule, economy and speed can both be im-
proved at the same time. For example, the reduction of setup time along with
slightly reduced lot sizes, resulting in decreasing inventories would at the same
time reduce lead time, increase machine utilisation and cut down on setup costs.
Decreasing lead time inevitably saves associated inventory costs. To some extent
both goal dimensions do positively correlate.
23. 1.2 The Four Goals of Production 23
Logical Square of Goals
The logical square of production goals presented here shows how the four goal
dimensions of production are arranged in six different types of goal conflict
relationships. Improving the individual goals does not necessarily mean that
another goal is affected to the same degree; some goals can actually be
improved simultaneously.
The objective of production optimization is to counterbalance operation of
production and the product range at a specific production site with the four
goal dimensions in order to achieve the best level of goal achievement.
A closer look at the traditional methods of lean production and their objectives
reveals their underlying goal systems. The respective goal hierarchies are going to
be described in the following, broken down into logistical and production-related
goals (Fig. 1.9).
The goal dimension of quality is easily the utmost priority of lean production.
Quite rightly, rejections are considered the most severe technical kind of waste, as
with one single process step they wipe out all previously generated value-adding
activities as well as the utilized raw material. In cases of defects only detected in
later process steps, subsequently created value is also lost. In addition, the produc-
tion is disrupted as rejections are unavailable for customer orders at short notice.
Zero defect production is thus of superordinate significance for a reliable low-
waste production procedure. From a logistical point of view, another qualitative
goal, namely delivery reliability is attached the highest possible priority. The con-
sistent assumption of the customer’s point of view as well as the entailing strict
alignment of the production with the customer demand is one of the basic con-
cepts of lean production (cf. Sect. 2.2). All other specifications are developed on
this basis.
The speed-related goal of short production lead times typically associated with
lean production comes second. Accordingly, inventories are considered the most
severe logistical kind of waste, provided customer deadlines are met. From a pro-
duction-related aspect, this aims less at an acceleration of machining processes in
order to shorten operation times than more at a maximization of machine running
times and entailing improved uptimes. The method of total productive mainte-
nance (TPM) is of central importance in the context of lean production to reduce
breakdown-related time loss and loss of speed. The thus desired increase in ma-
chine efficiency illustrates the importance of time management.
The goal dimension of economic efficiency ranks third. This may seem surpris-
ing, as even in a lean production, costs are no insignificant factor, and should
definitely be kept at a minimum. Initially, though, this is indirectly achieved
through prevention of non-monetary waste such as rejections, machine break-
downs and inventories, not with the aid of directly reduced cost rates. The third
goal dimension aims to keep resource-related investment (and thus machine-
related hourly rates) low in accordance with the principle of low cost automation.
From a logistical viewpoint, this allows a lower weighting of the utilization-
related targets in production planning, i.e. the forgoing of high machine utilization
for the benefit of lower inventories and conformance with delivery dates. With
24. 24 1 Production Optimization
respect to the workers, lean production similarly does not aim at lower wages, but
rather wants to achieve high worker productivity on the basis of high employee
qualifications and staff motivation. Contrary to resources, maximum utilization
is desired here – not logistically, though, through personnel planning, but in a
production process-specific manner by way of temporal alignment of all work
contents, ensuring optimal employee productivity for each and every workplace.
At the same time this enables a production-wide application of the operator bal-
ance chart known from assembly processes.
RankingofFactoryGoals
Quality1 Quality1
Speed2 Speed2
Economy3 Economy3
Variability4 Variability4
Logistic Goals Production-related Goals
High Delivery Reliability
»Taking Customers View«
Zero-Defect-Production
»Rejections are the Most Severe
Technical Kind of Waste«
Low Production Lead Time
»Inventory is the Most Severe
Logistical Kind of Waste«
High Machine Availability
»Total Productive Maintenance is a
Key Lean Tool«
High Capacity Utilisation
»Low Cost Automation«
High Employee Productivity
»Focus on Operator Balance Chart«
High Variety of Products
Sequencing with »Heijunka-Box«
High Machine Flexibility
»Reduce EPEI (Every Part Every
Interval)«
Fig. 1.9 The ranking of factory goals in a conventional lean production system
From a logistical point of view, the goal dimension of variability is imple-
mented with the aid of the simple heijunka principle which enables easy sequenc-
ing of production orders of different product variants. However, this is only of
limited benefit in productions of high variance – a weakness which leads to its
rather low prioritization in lean production. As a result, this method for the level-
ling of the production mix has been significantly advanced in the book at hand (cf.
Sect. 3.4.2). With respect to production-related goals, high machine flexibility is
of vital importance for the achievement of a high product variance, as an indicator
of which the so-called EPEI value (cf. Sect. 2.3.1) lends itself, though its low de-
gree of popularity also somewhat reflects the low priority of this aspect.
The book at hand aims to illustrate how to design an optimal production. With the
aid of value stream design, design guidelines will be suggested which shall enable
the design of a production in such a way as to consistently operate the pertaining
factory at a specific goal-related operating point. The traditional solution ap-
proaches of lean production were expanded in the design guidelines introduced
herein – in particular with a view to the previously neglected goal dimension of
variability (Chap. 3). First of all, though, the production needs to be mapped in its
current state in order to clearly and appropriately visualize the starting point for an
intended redesign and/or new design of the production, for the purpose of which
the value stream analysis introduced in the following is the perfect tool (Chap. 2).