Welsh Government Future Trends 2017: economy and infrastructure
Total spending by function
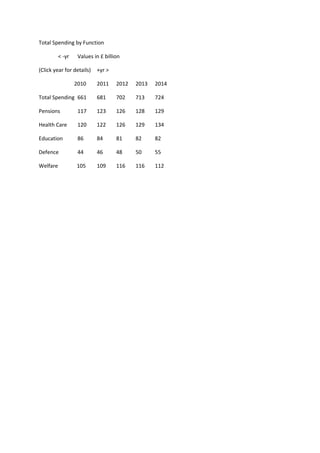
1. Total Spending by Function
< -yr Values in £ billion
(Click year for details) +yr >
2010 2011 2012 2013 2014
Total Spending 661 681 702 713 724
Pensions 117 123 126 128 129
Health Care 120 122 126 129 134
Education 86 84 81 82 82
Defence 44 46 48 50 55
Welfare 105 109 116 116 112
2. UK Public Spending Since 1900
A briefing from ukpublicspending.co.uk
Nobody, in 1900, speculating on the future of government, could have imagined the
3. astonishing growth and scope of public services in the 20th century. Nor would they have
imagined that, for many people, this gigantic state provision would seem the very essence of
efficiency, compassion, and modernity. The era of the welfare state did not start, of course, in
1948 and the creation of the NHS. It started decades before. You can see how it all happened
in the United Kingdom in the charts below.
A Century of Public Spending
Public spending in the United Kingdom has steadily increased from 12 percent of GDP in
1900 to 47 percent today.
Chart 1: Public Spending 1900-2011
Click image for numbers or to customize chart
Public Spending in the 20th century is dominated by the great exertions of the world wars.
But peacetime expenditures show clear trends.
Prior to World War I, public spending sat at about 15 percent of GDP. Then, after the war it
emerged at about 25 percent of GDP, and remained at about that level, except for a surge at
the start of the depression in the 1930s.
After World War II, public spending consumed about 35 percent of GDP, and this level
continued through the 1950s. At about 1960 expenditures began a steady rise that peaked in
the early 1980s at 45 percent of GDP.
During the 1980s public spending was cut as a percent of GDP from about 45 percent down
to 35 percent in 1989. But then, with the ERM sterling crisis and associated recession, it rose
back to 40 percent of GDP before declining to 36 percent in 2000.
After 2000 public spending increased rapidly, with a peak of 47 percent of GDP expected in
2011 in the afermath of the financial crisis of 2008.
Defence Spending since 1900
4. Defence spending in the United Kingdom has fluctuated in the last century, starting at 6.5
percent of GDP during the Boer War, peaking at 46.4 percent in World War II, declining
from 10 percent in the early years of the Cold War to under three percent today.
Chart 2: UK Defence Spending 1900-2011
Click image for numbers or to customize chart
Defence began in 1900 at 3.69 percent of GDP but quickly expanded during the Boer War to
6.47 percent. After the war it contracted down to about 3 percent of GDP.
World War I saw an extraordinary mobilisation of nation resources, beginning from a
standing start of 3.15 percent of GDP spent on defence in 1914. Defence spending soared to
21.68 percent of GDP by 1919. But spending quickly contracted after the Great war, slipping
below three percent of GDP by 1927, and staying below three percent thereafter.
Defence spending began to increase well before World War II. Starting at 3.01 perent of GDP
in 1935, it reached 3.71 percent in 1936, 4.82 in 1937, 8.72 in 1938, and 15.19 in 1939.
Appeasement or no, Britain started to rearm as the storm gathered. After the start of World
war II, Britain mobilised all its national resources for the war, spending over 40 percent of
GDP on defence for four years, peaking at 46.37 percent of GDP in 1943.
The Growth of State Education
Public spending on education has expanded from about two percent of GDP in 1900 to six
percent in the second decade of the 21st century.
5. Chart 3: Education Spending 1900-2011
Click image for numbers or to customize chart
State spending on education in Britain started out the 20th century at a little less than two
percent of GDP. Spending increased steadily, breaching three percent of GDP in 1946 and
reaching 3.37 percent of GDP in 1955.
Starting in 1956 education spending increased rapidly, breaching four percent of GDP in
1960 and peaking at 6.5 percent of GDP in 1975.
During the late 1970s and the 1980s education spending declined as a percent of GDP,
reaching a low of 4.25 percent in 1989. In the early 1990s education expanded, reaching 5.07
percent of GDP in 1995. In the late 1990s education spending declined to 4.33 percent of
GDP in 1998.
In the 2000s education spending increased rapidly, rising from 4.34 percent of GDP in 1999
to a planned 5.95 percent of GDP in 2010.
The Steady Growth of Health Expenditures
Public spending for health services increased steadily through most of the 20th century, from
0.3 percent of GDP to six percent of GDP by 1980. Followin a mild decline in the 1980s and
1990s, health spending increased rapidly in the 2000s past eight percent of GDP.
6. Chart 4: Health Spending 1900-2011
Click image for numbers or to customize chart
At the beginning of the 20th century, government spent about 0.5 percent of GDP on health.
But spending began to increase in 1909 after passage of the National Insurance Act, reaching
1.14 percent of GDP in 1921.
Health spending increased steadily in the 1920s and 1930s reaching 1.91 percent of GDP at
the start of World War II. Spending kept steady during the war and then increased briskly
after the war, reaching 3.07 percent just before the National Health Service was set up in
1948.
Costs rose sharply in the early years of the NHS, reaching 3.6 percent of GDP by 1950 and
then dropping to 3.0 percent of GDP by 1955. Spending increased steadily after the mid
1950s, running at about 3.5 percent of GDP in the early 1960s and increasing to 4.0 percent
of GDP by 1970 and peaking at 4.98 percent of GDP in 1975.
Health spending declined in the late 1970s, down to 4.7 percent of GDP in 1979 and
increased thereafter, reaching 5.64 percent of GDP in 1983 before beginning a decline to 5.16
percent in 1988. Then spending jolted upwards, reaching 6.31 percent of GDP by 1993 before
a steep decline to 4.91 percent of GDP in 1998.
Spending began increasing sharply after 1999, and is expected to reach a planned
expenditures of 8.43 percent of GDP in 2010.