Download to read offline
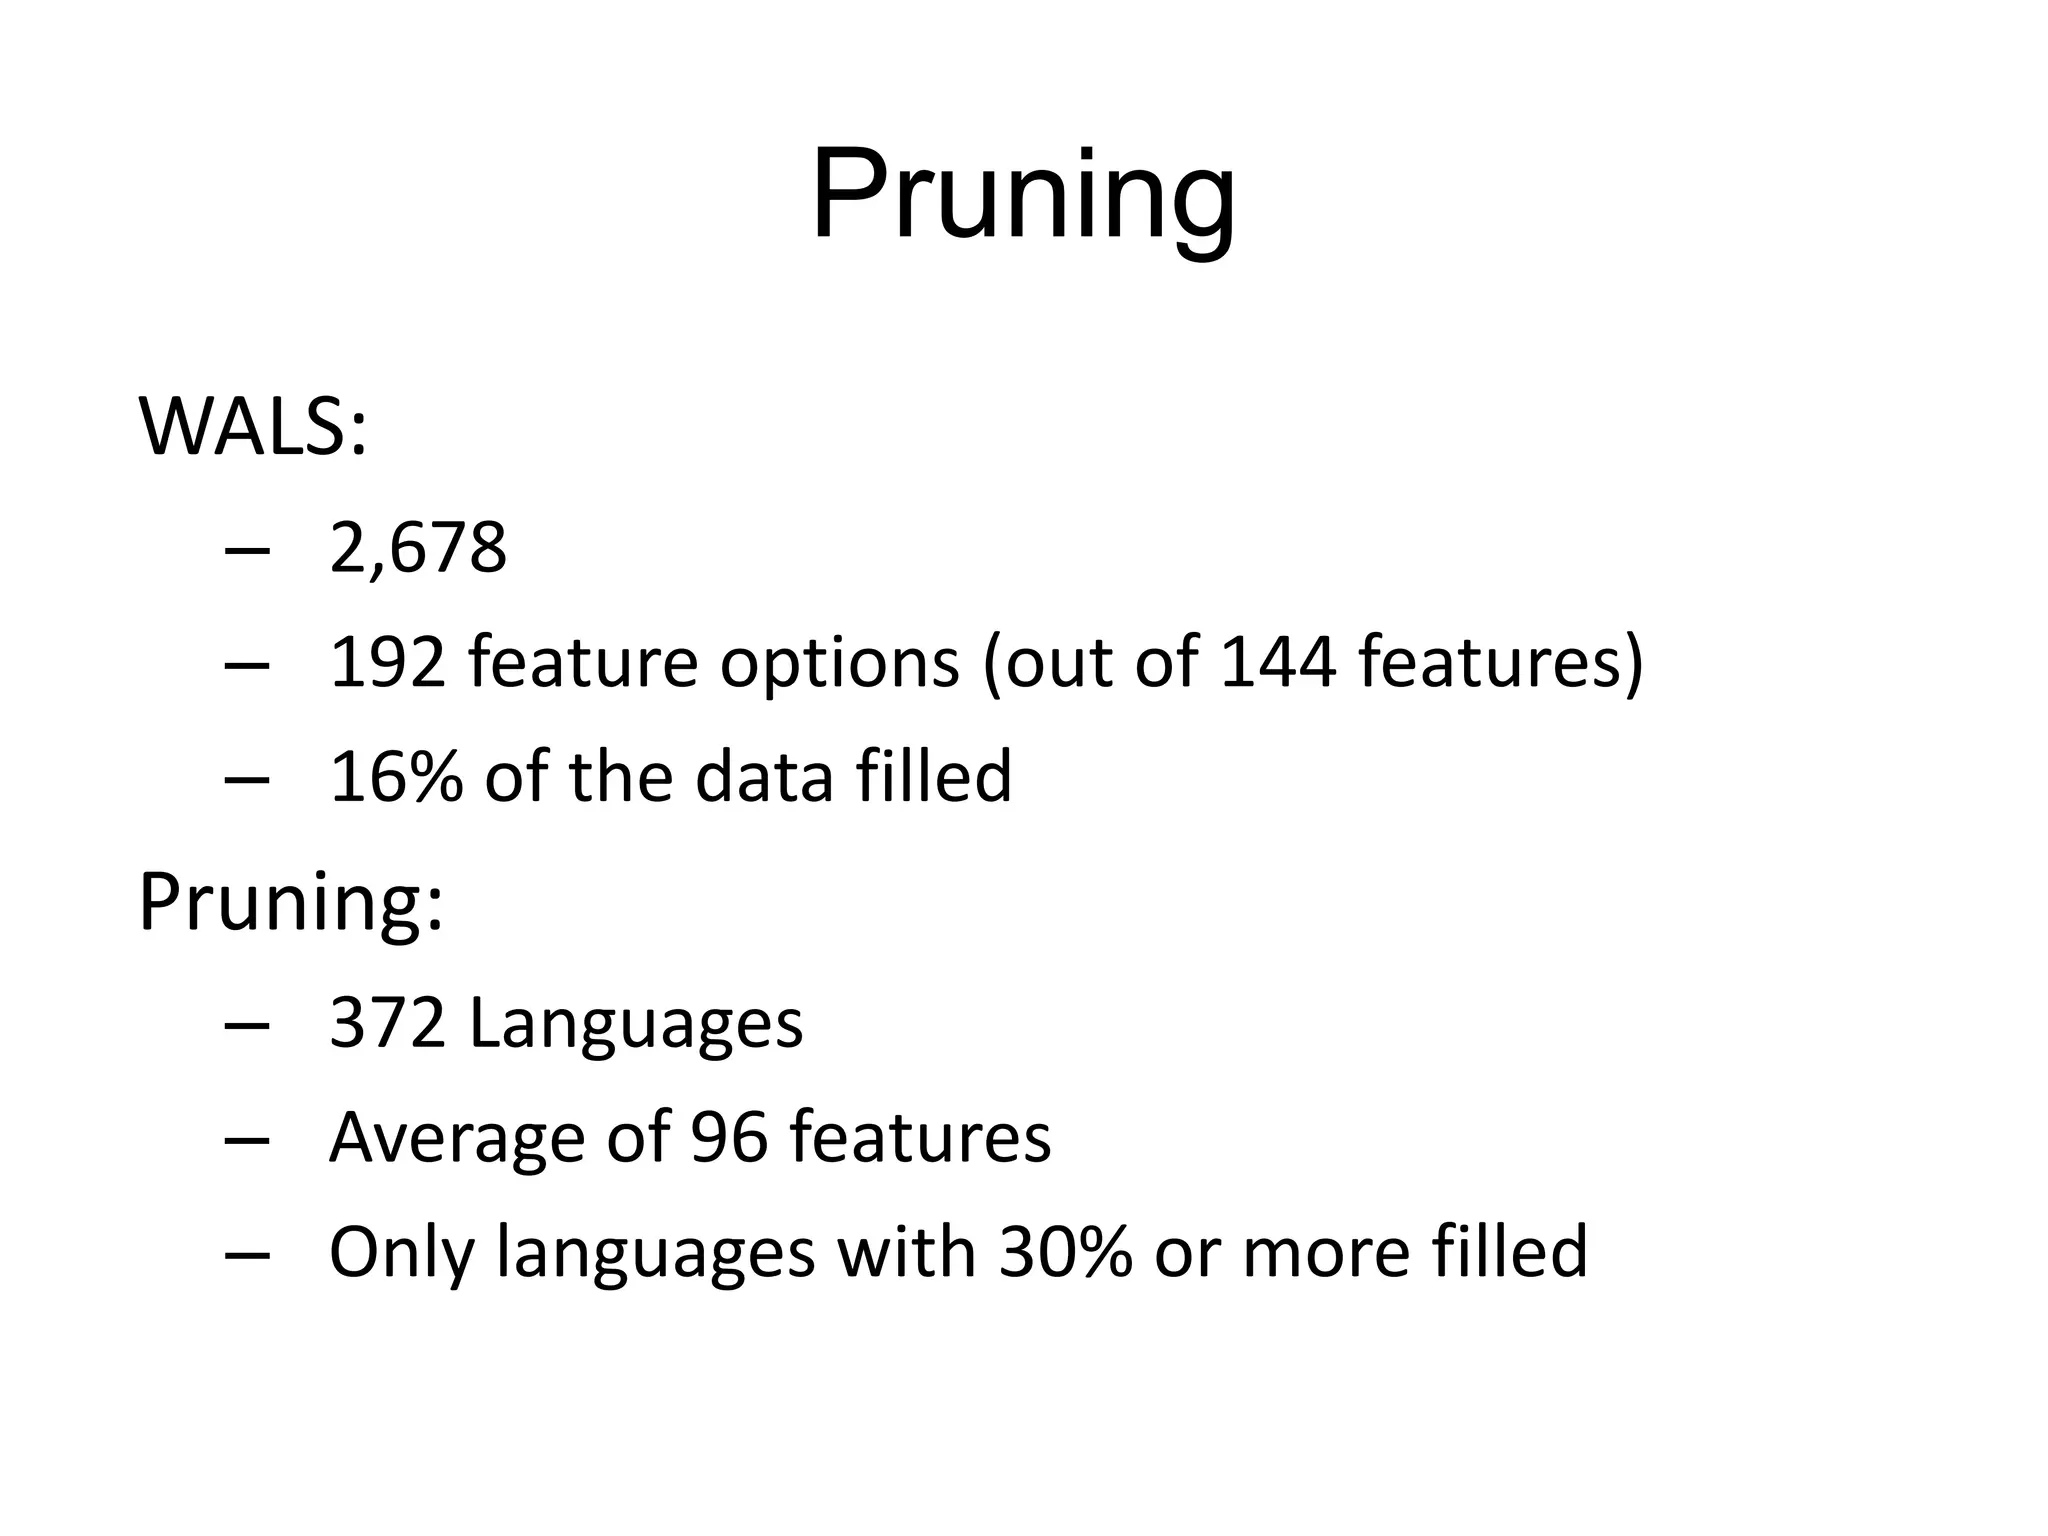
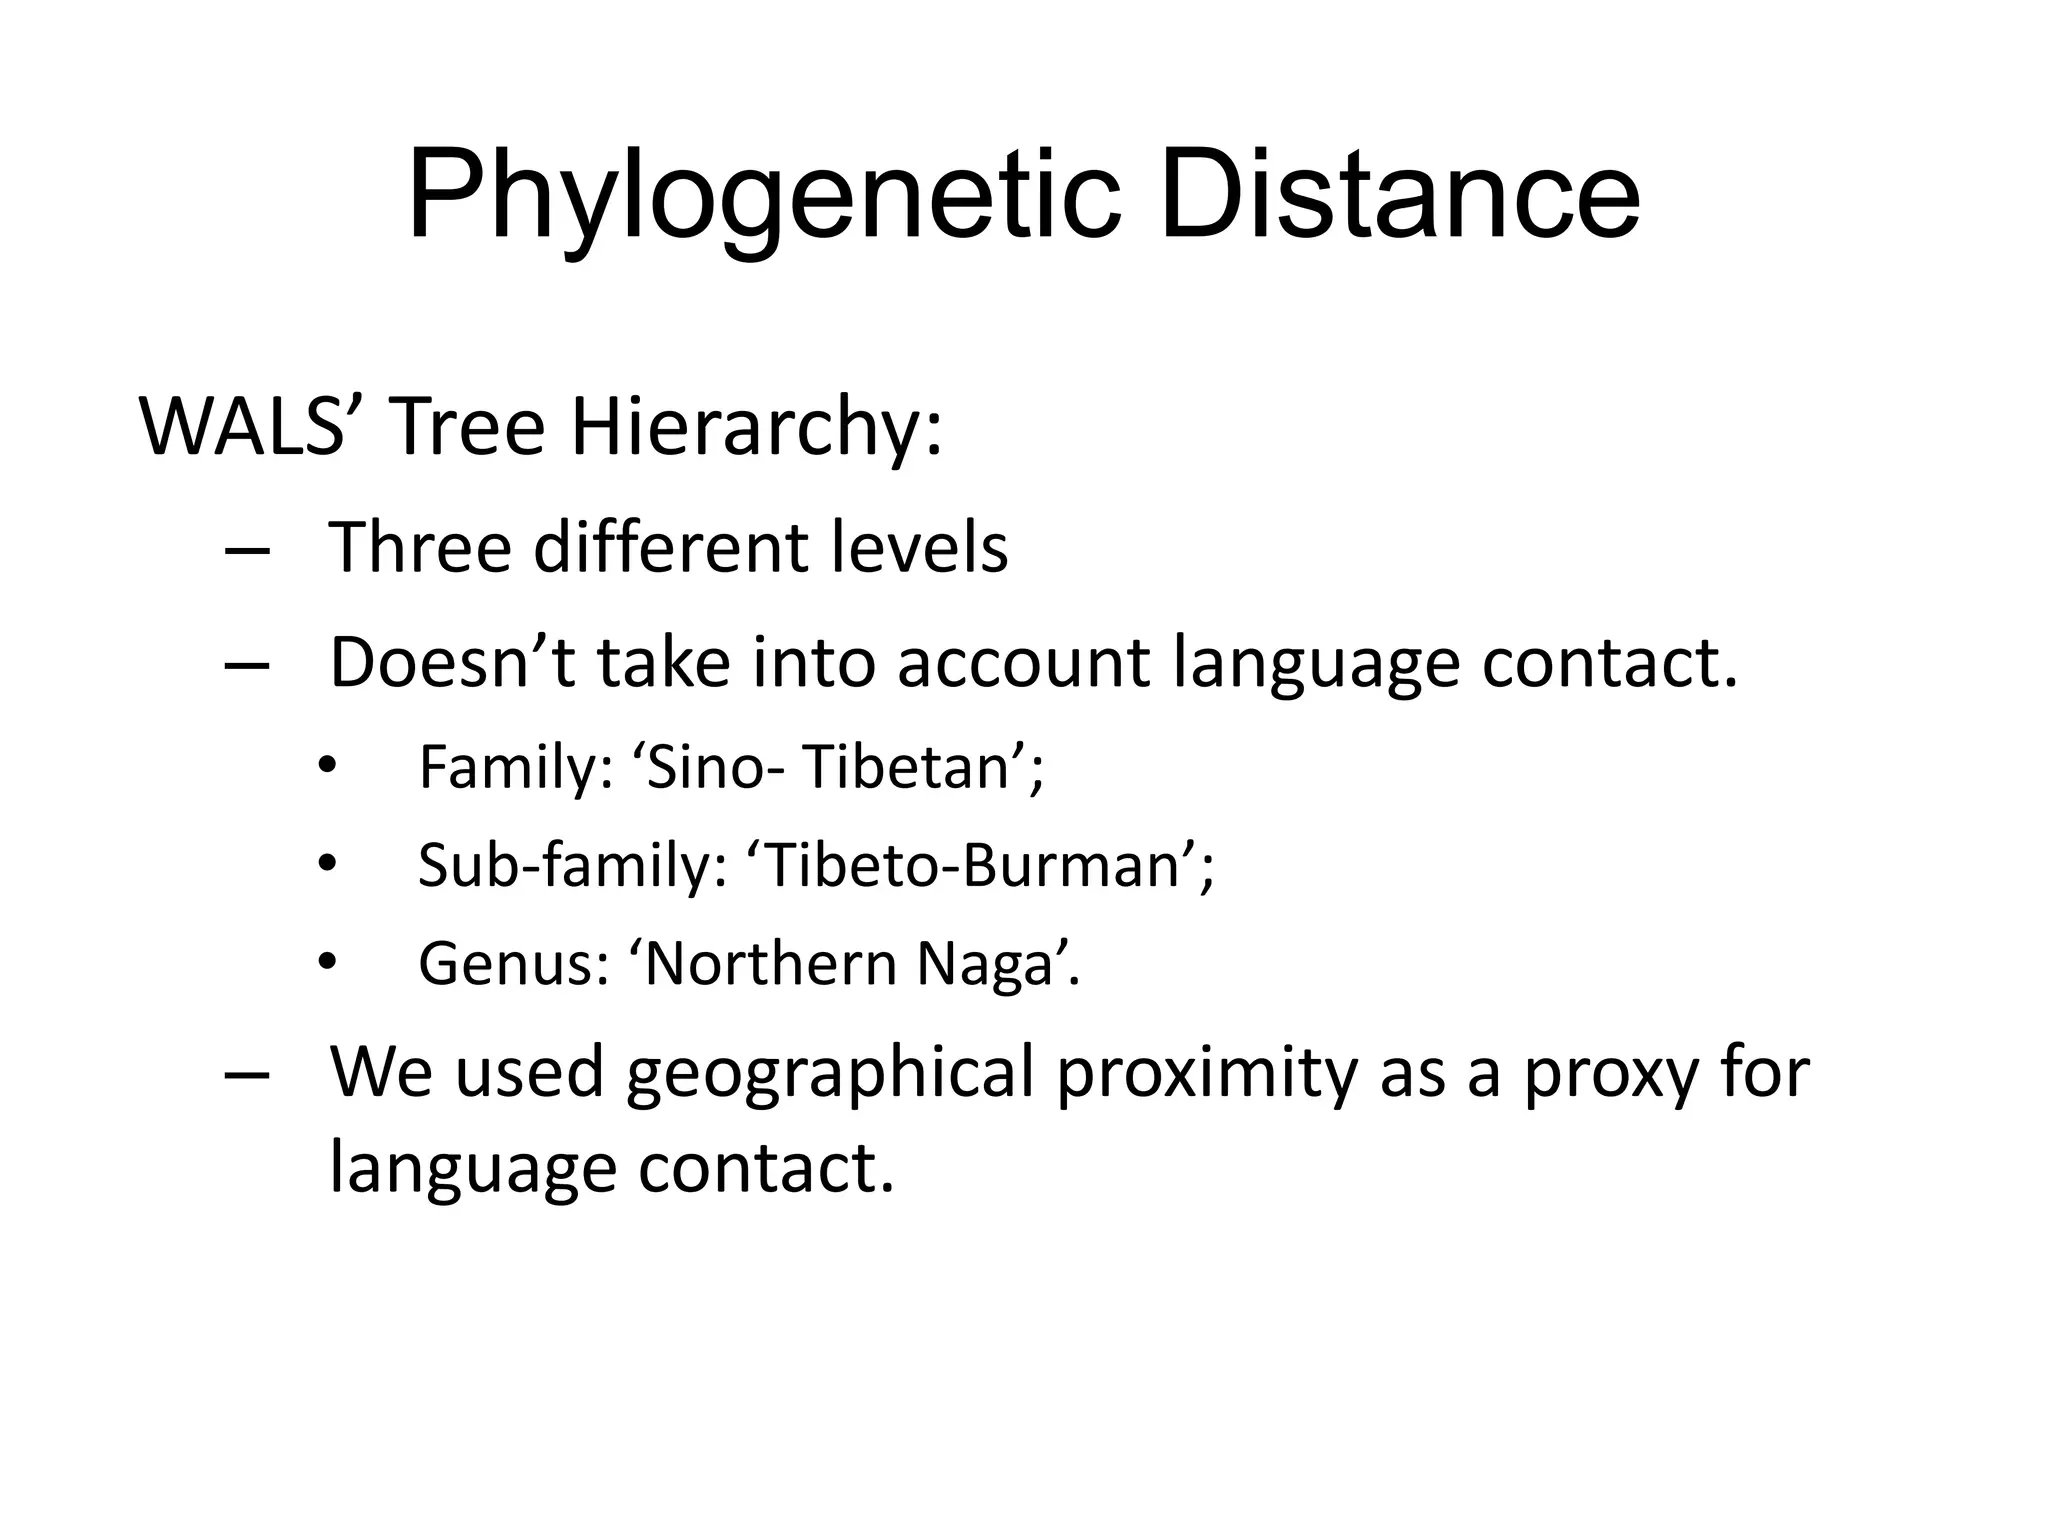
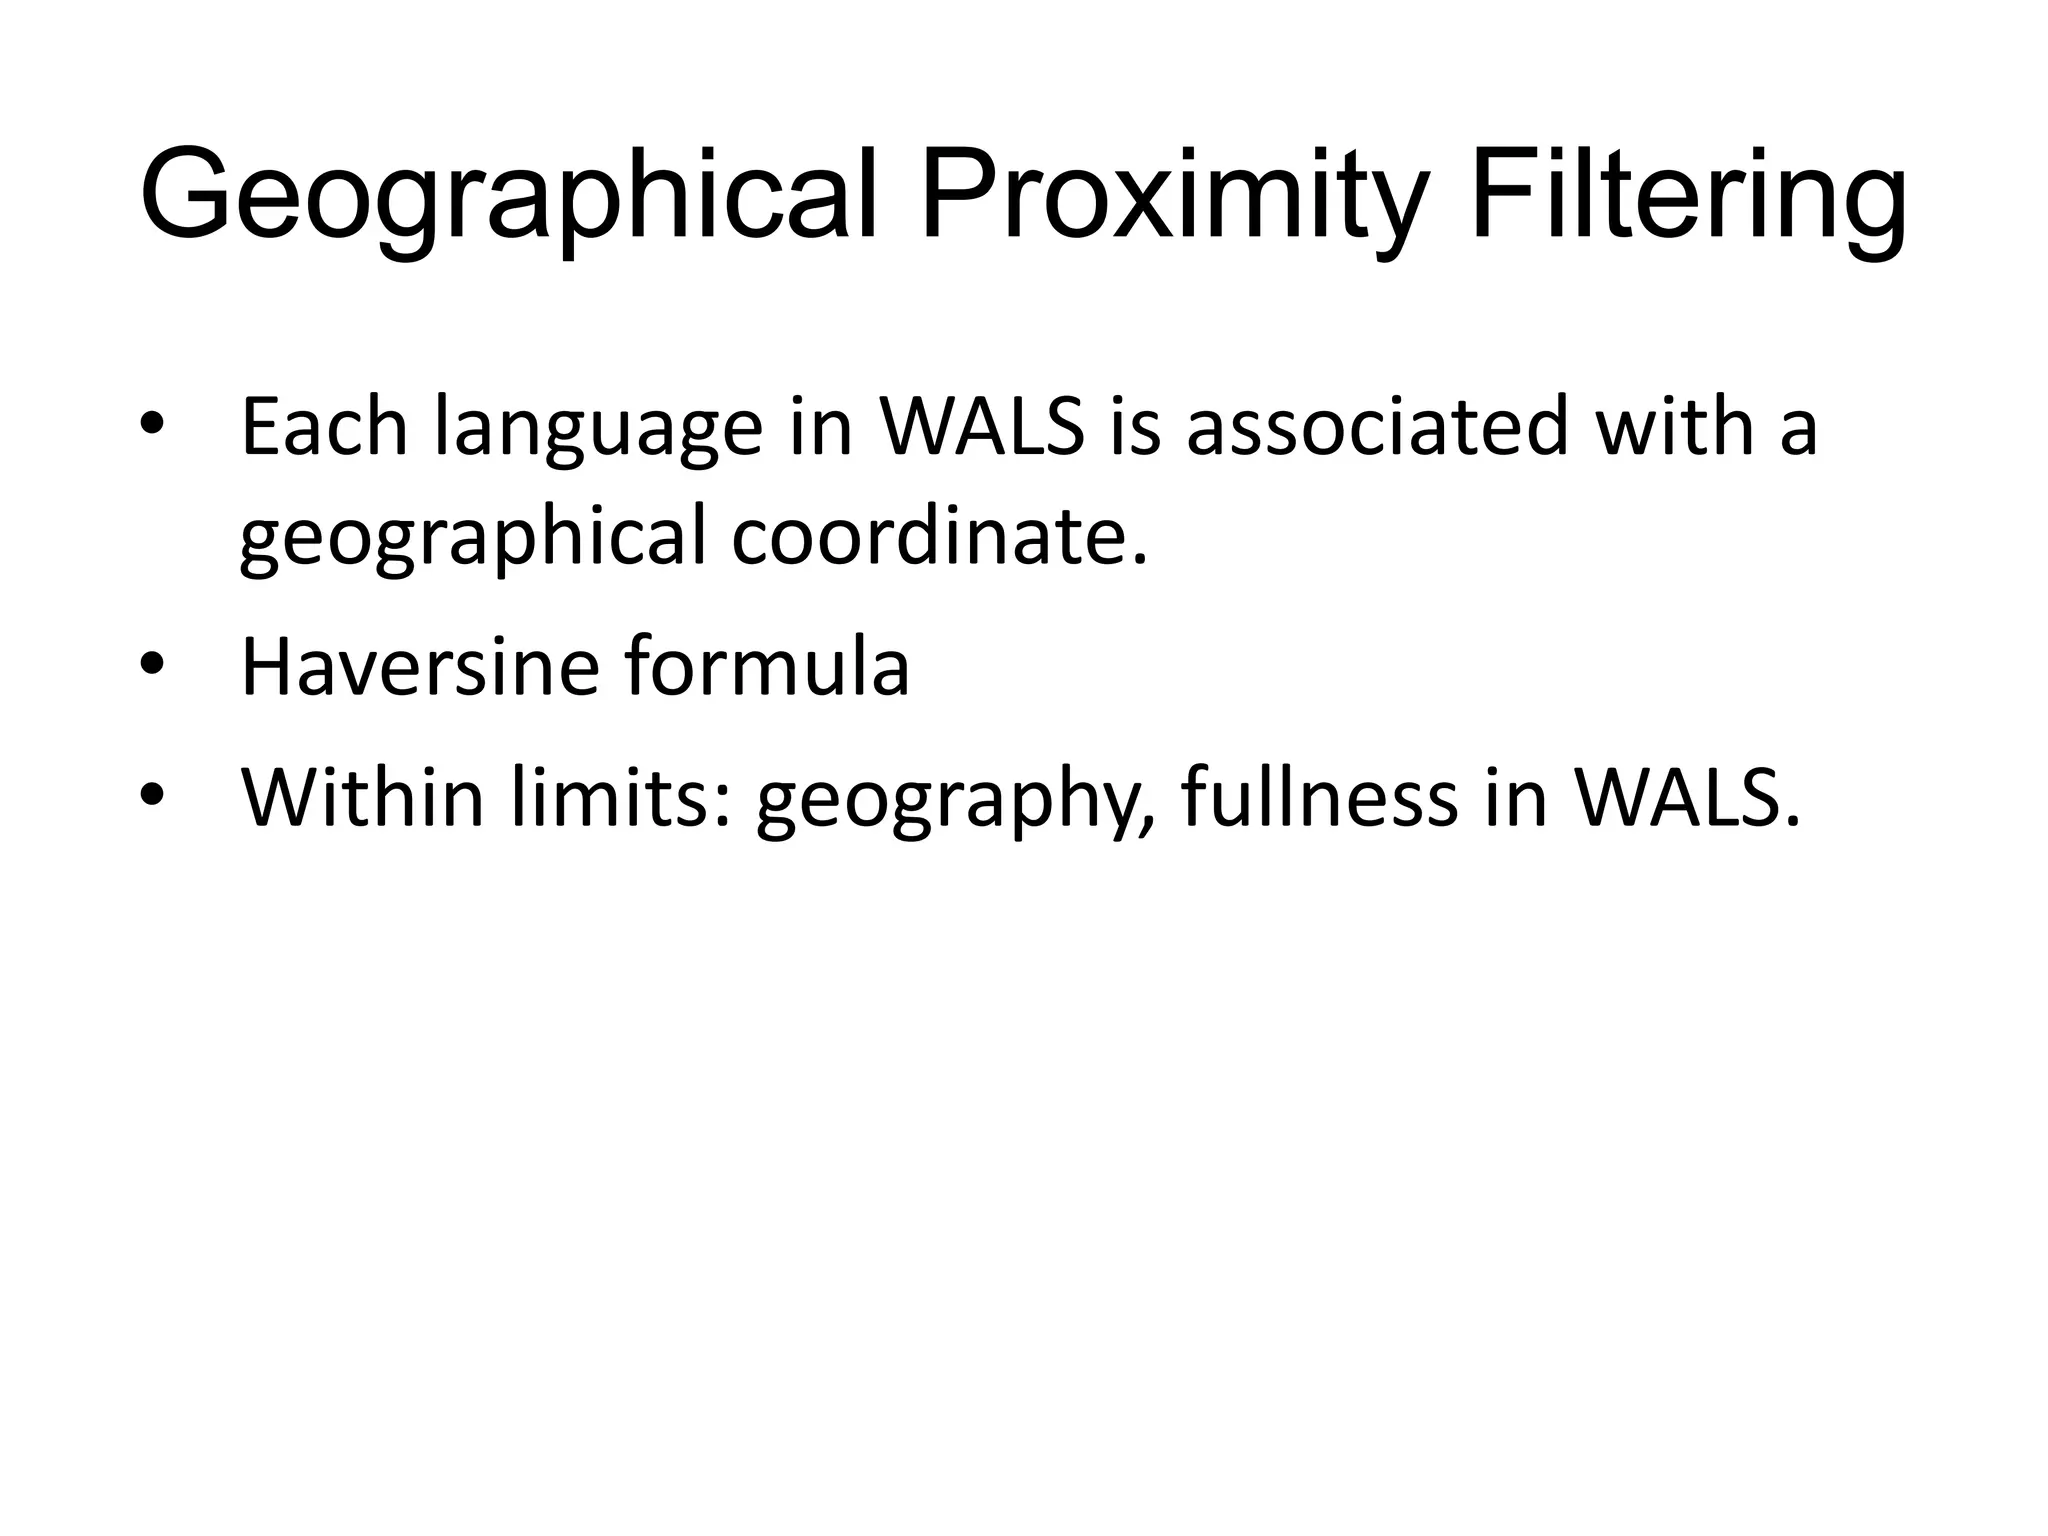
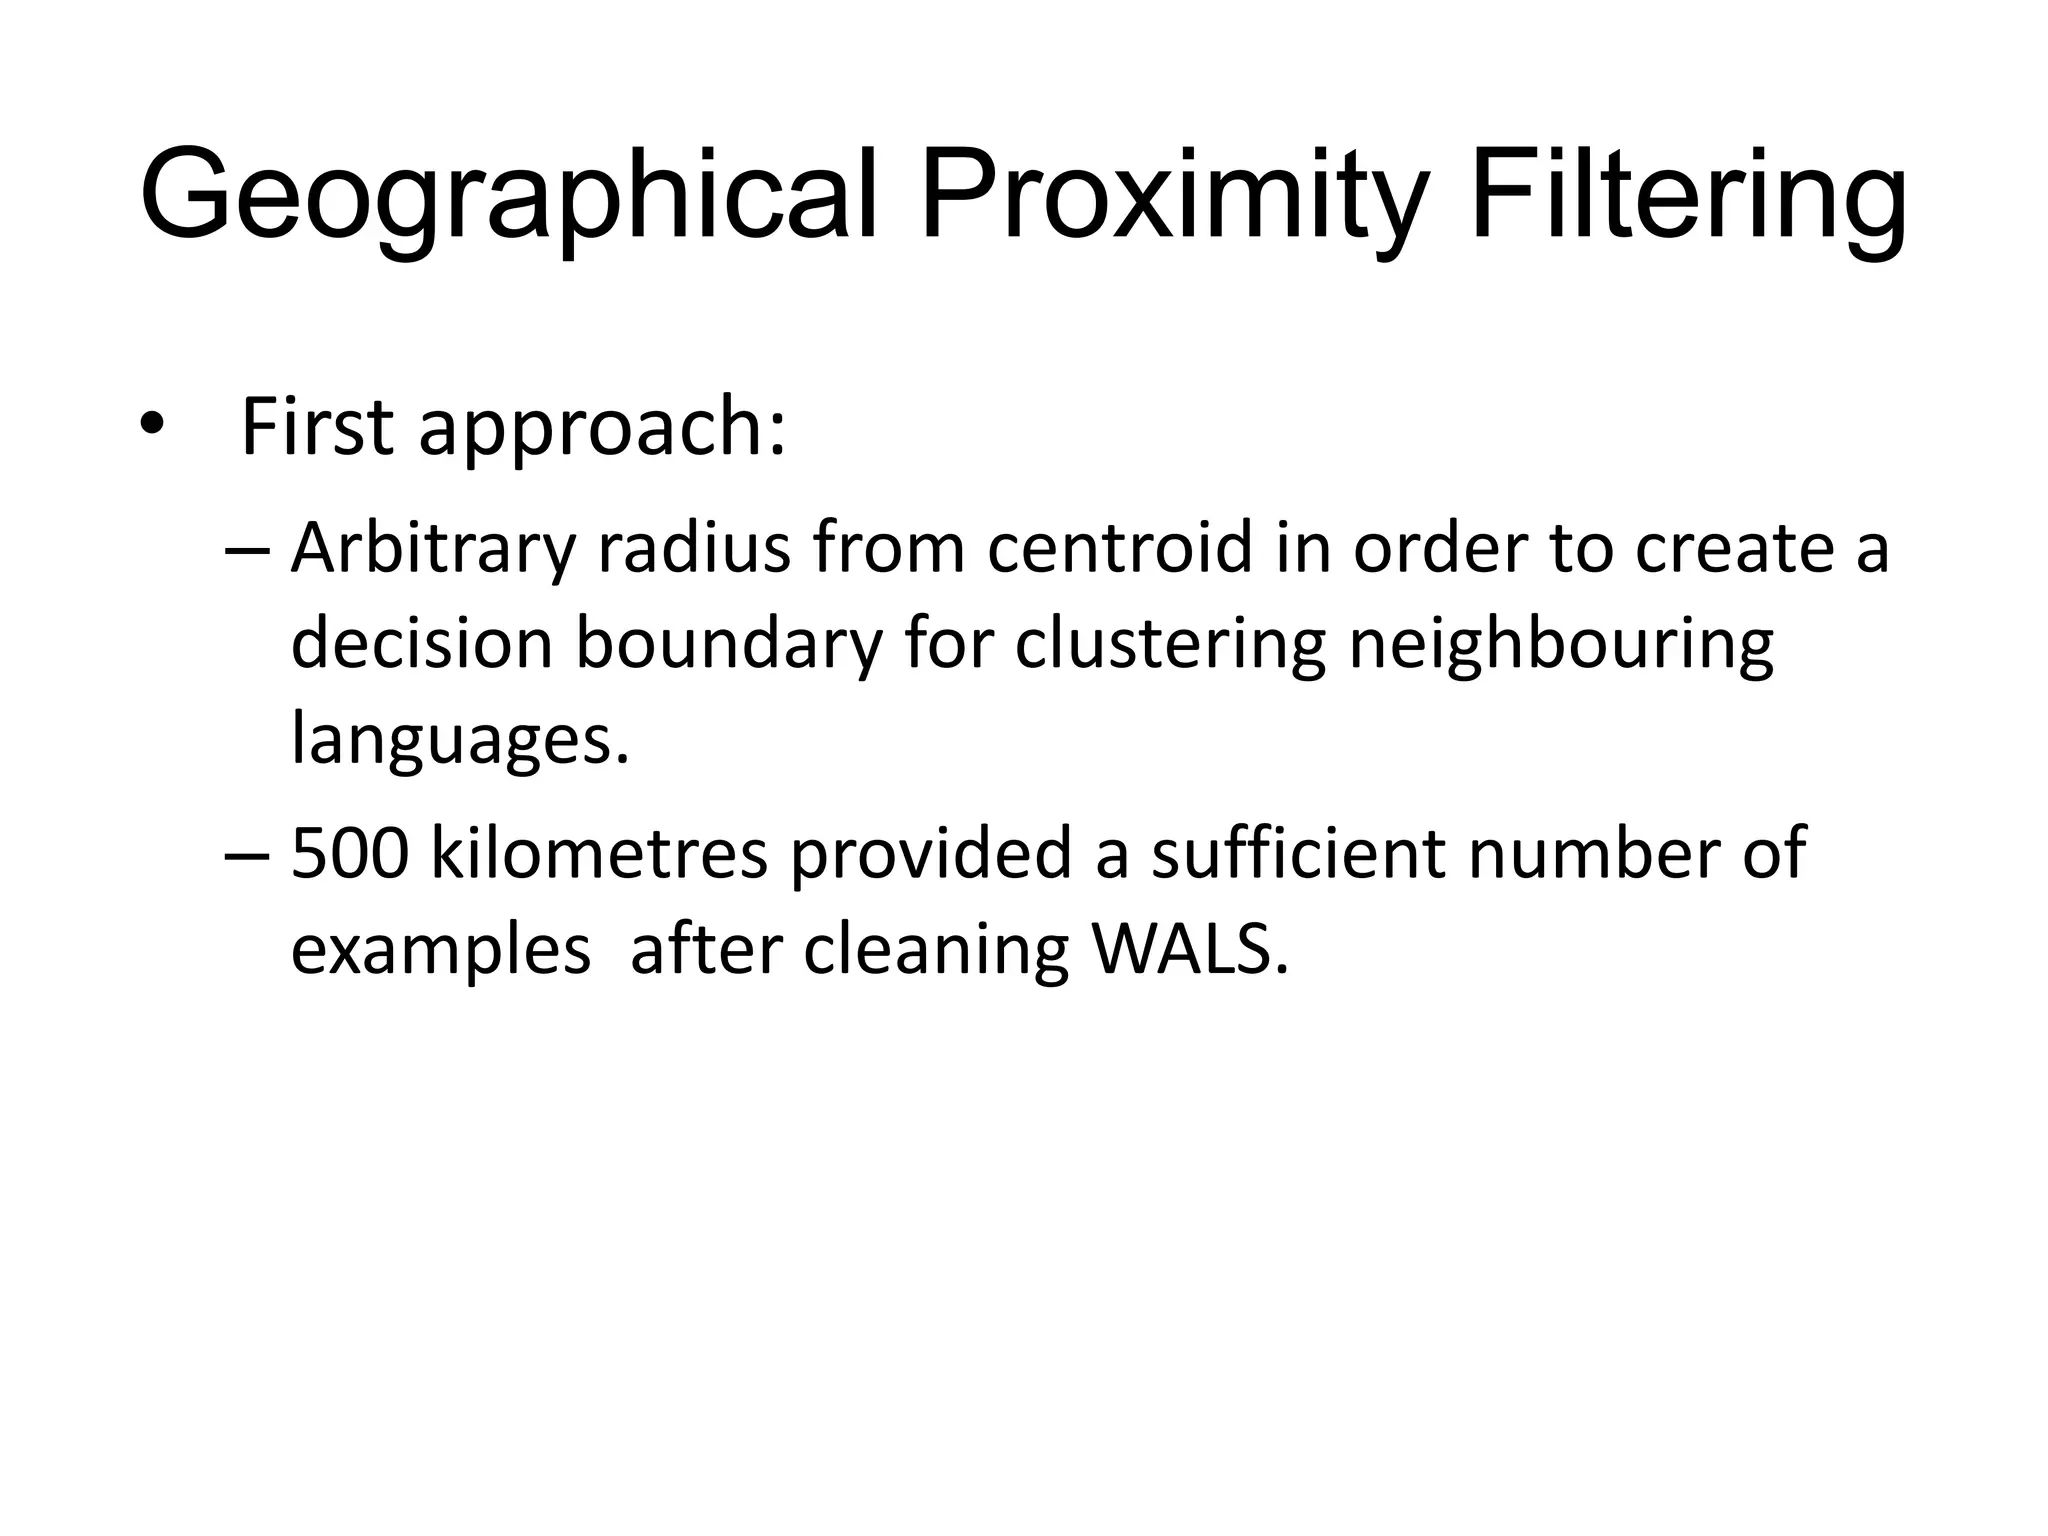
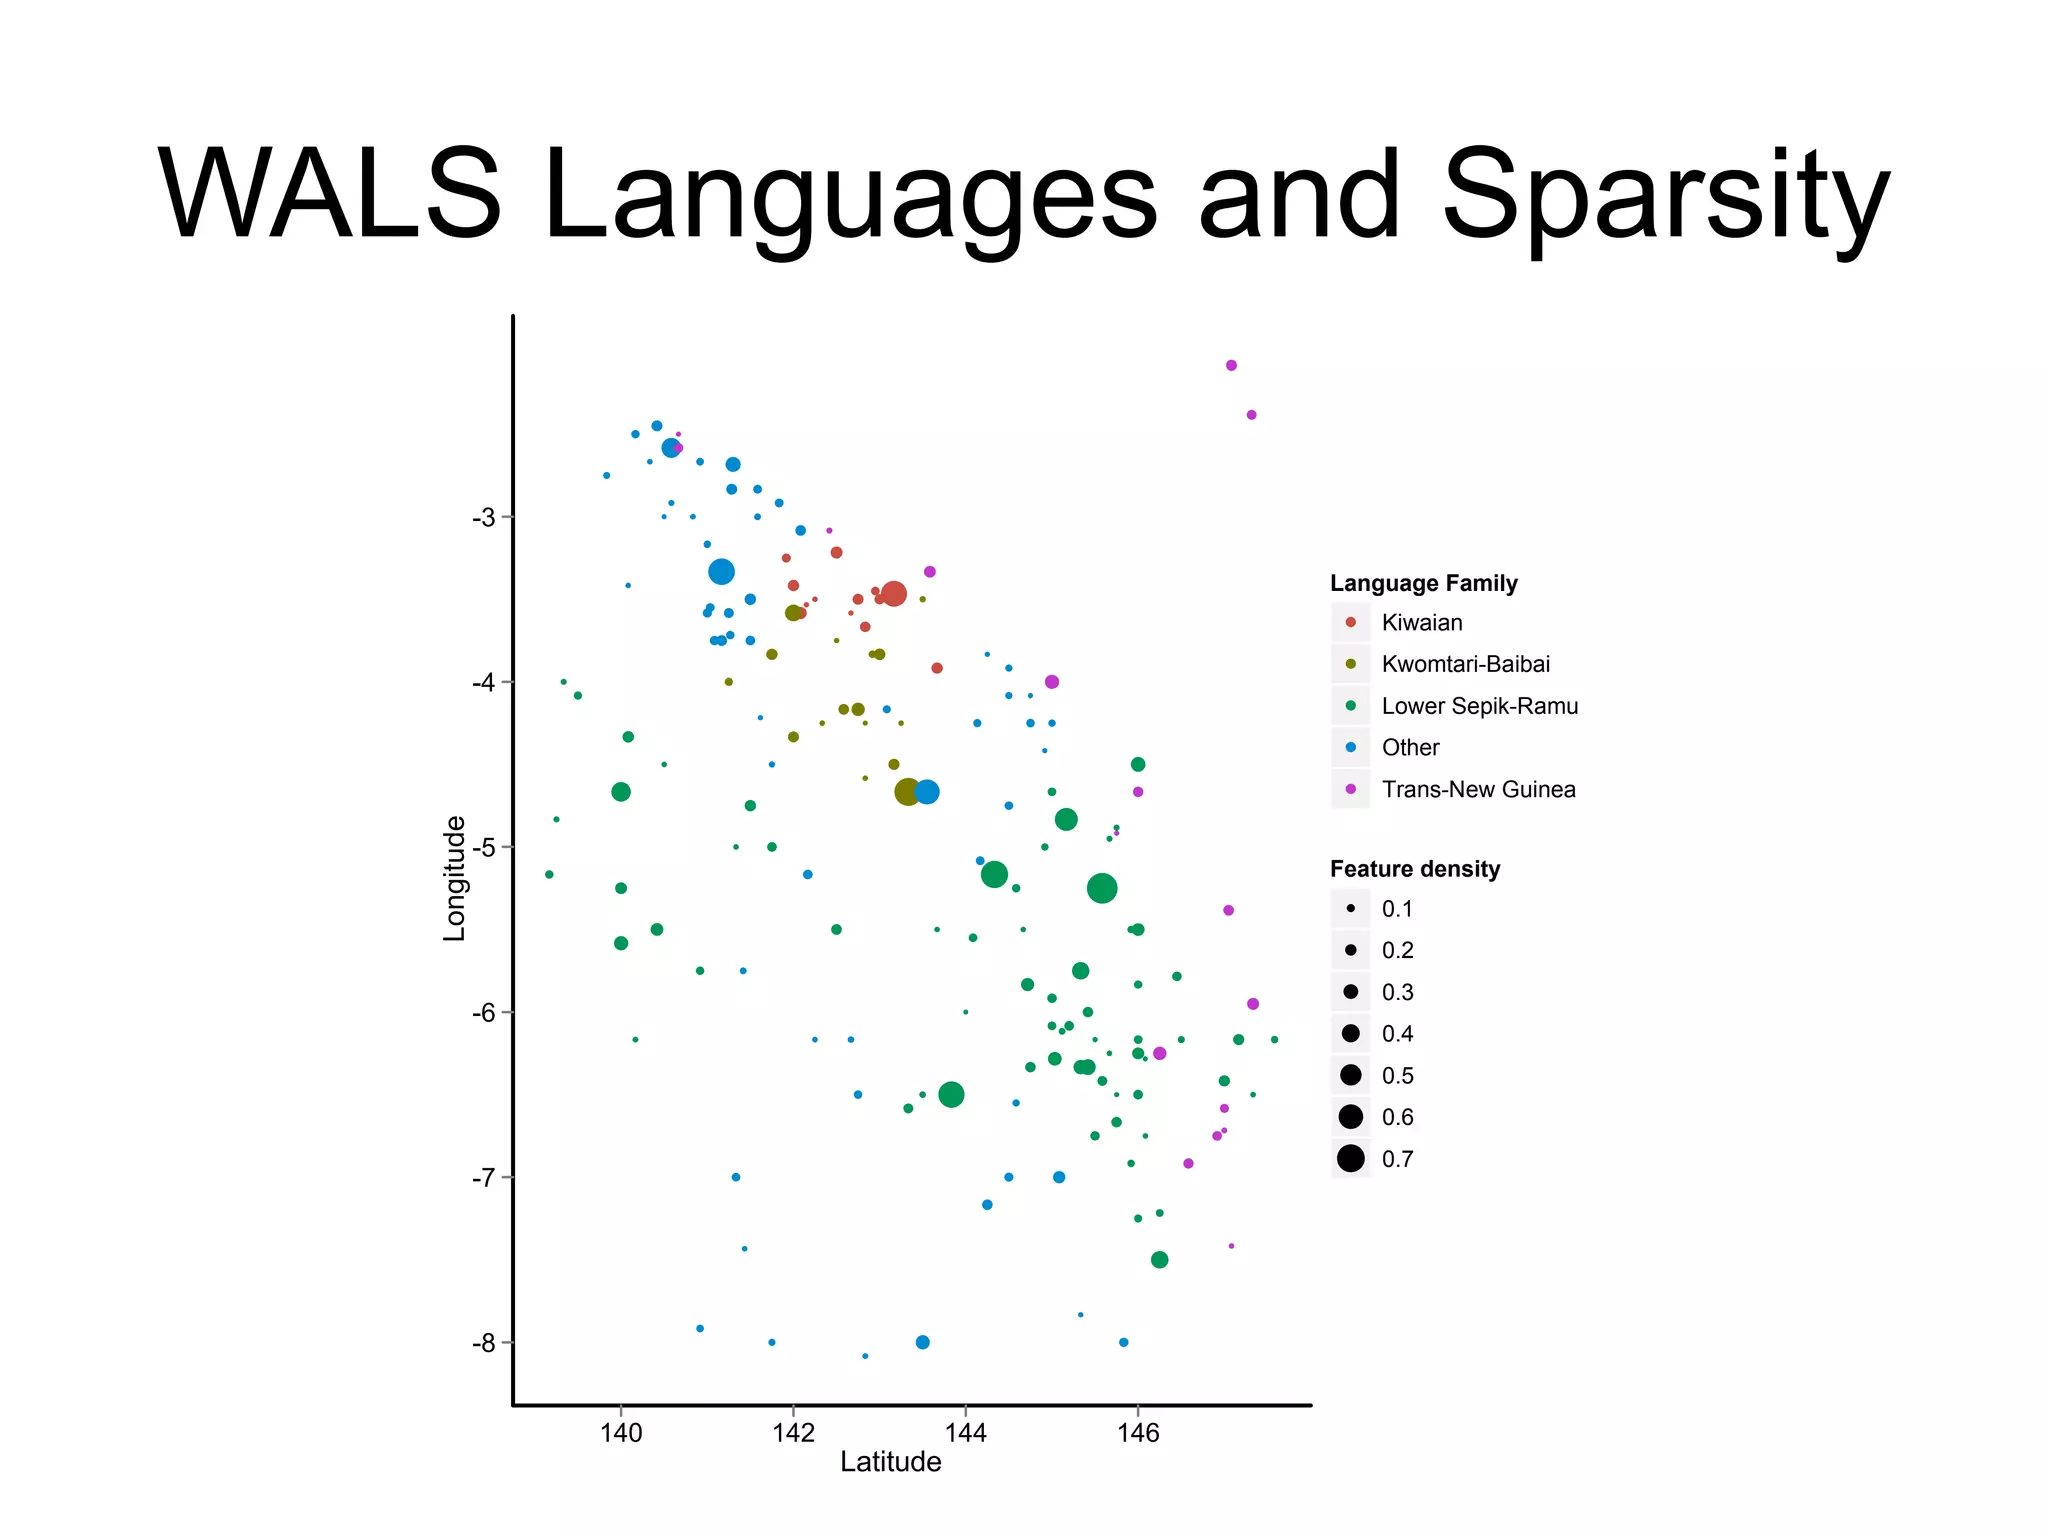
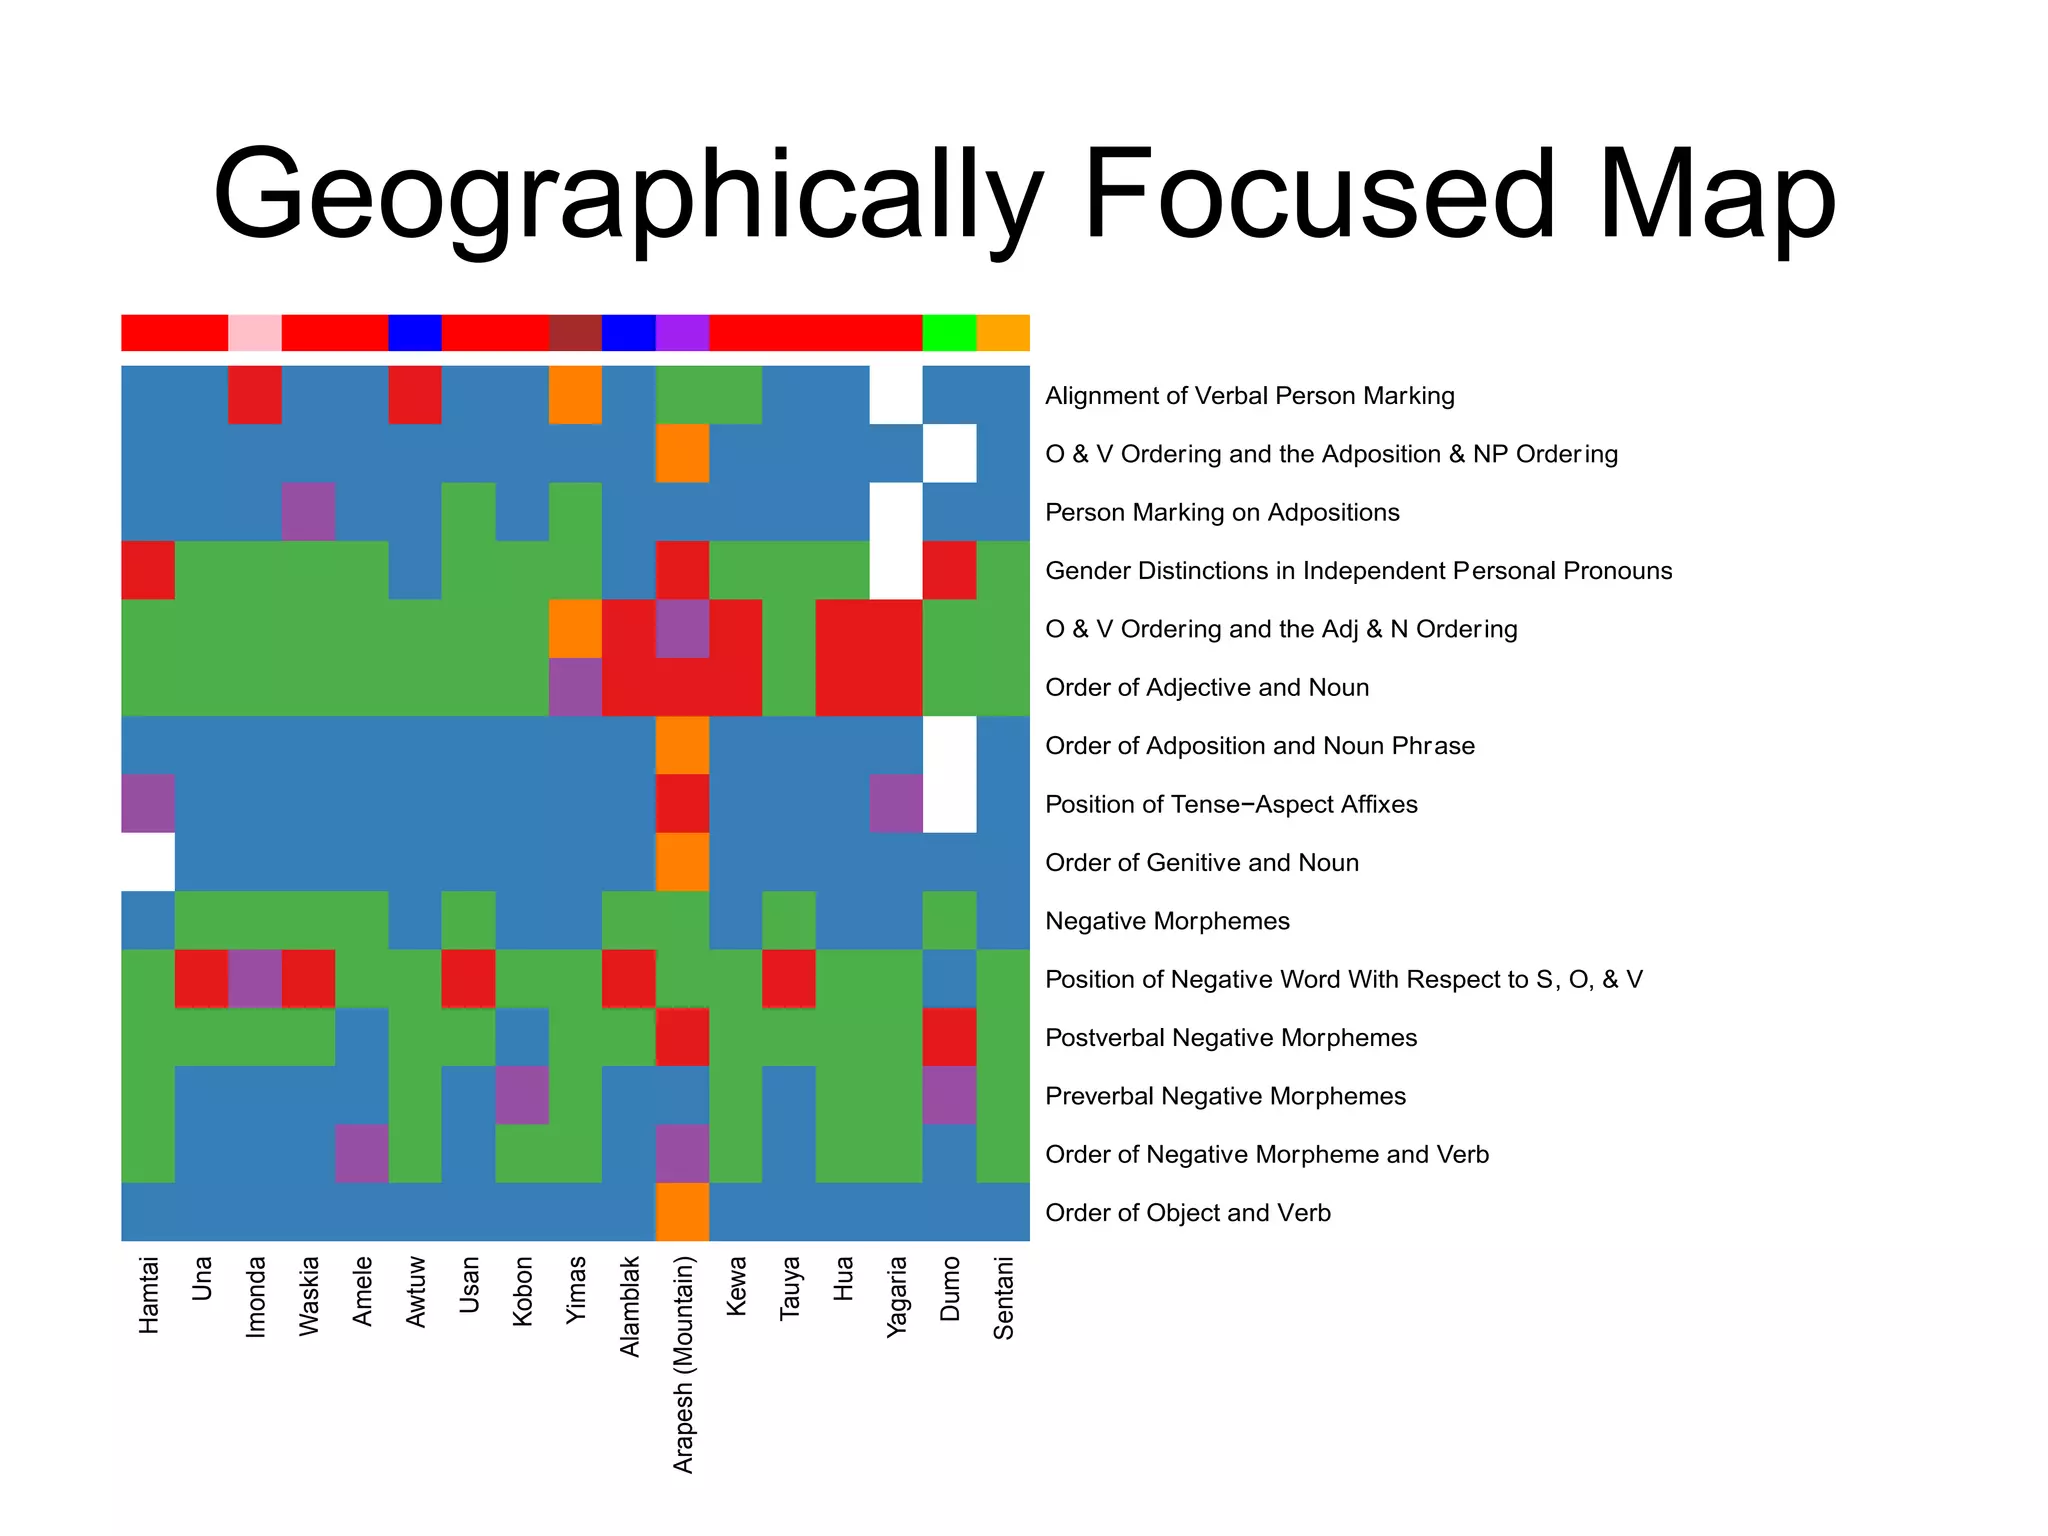
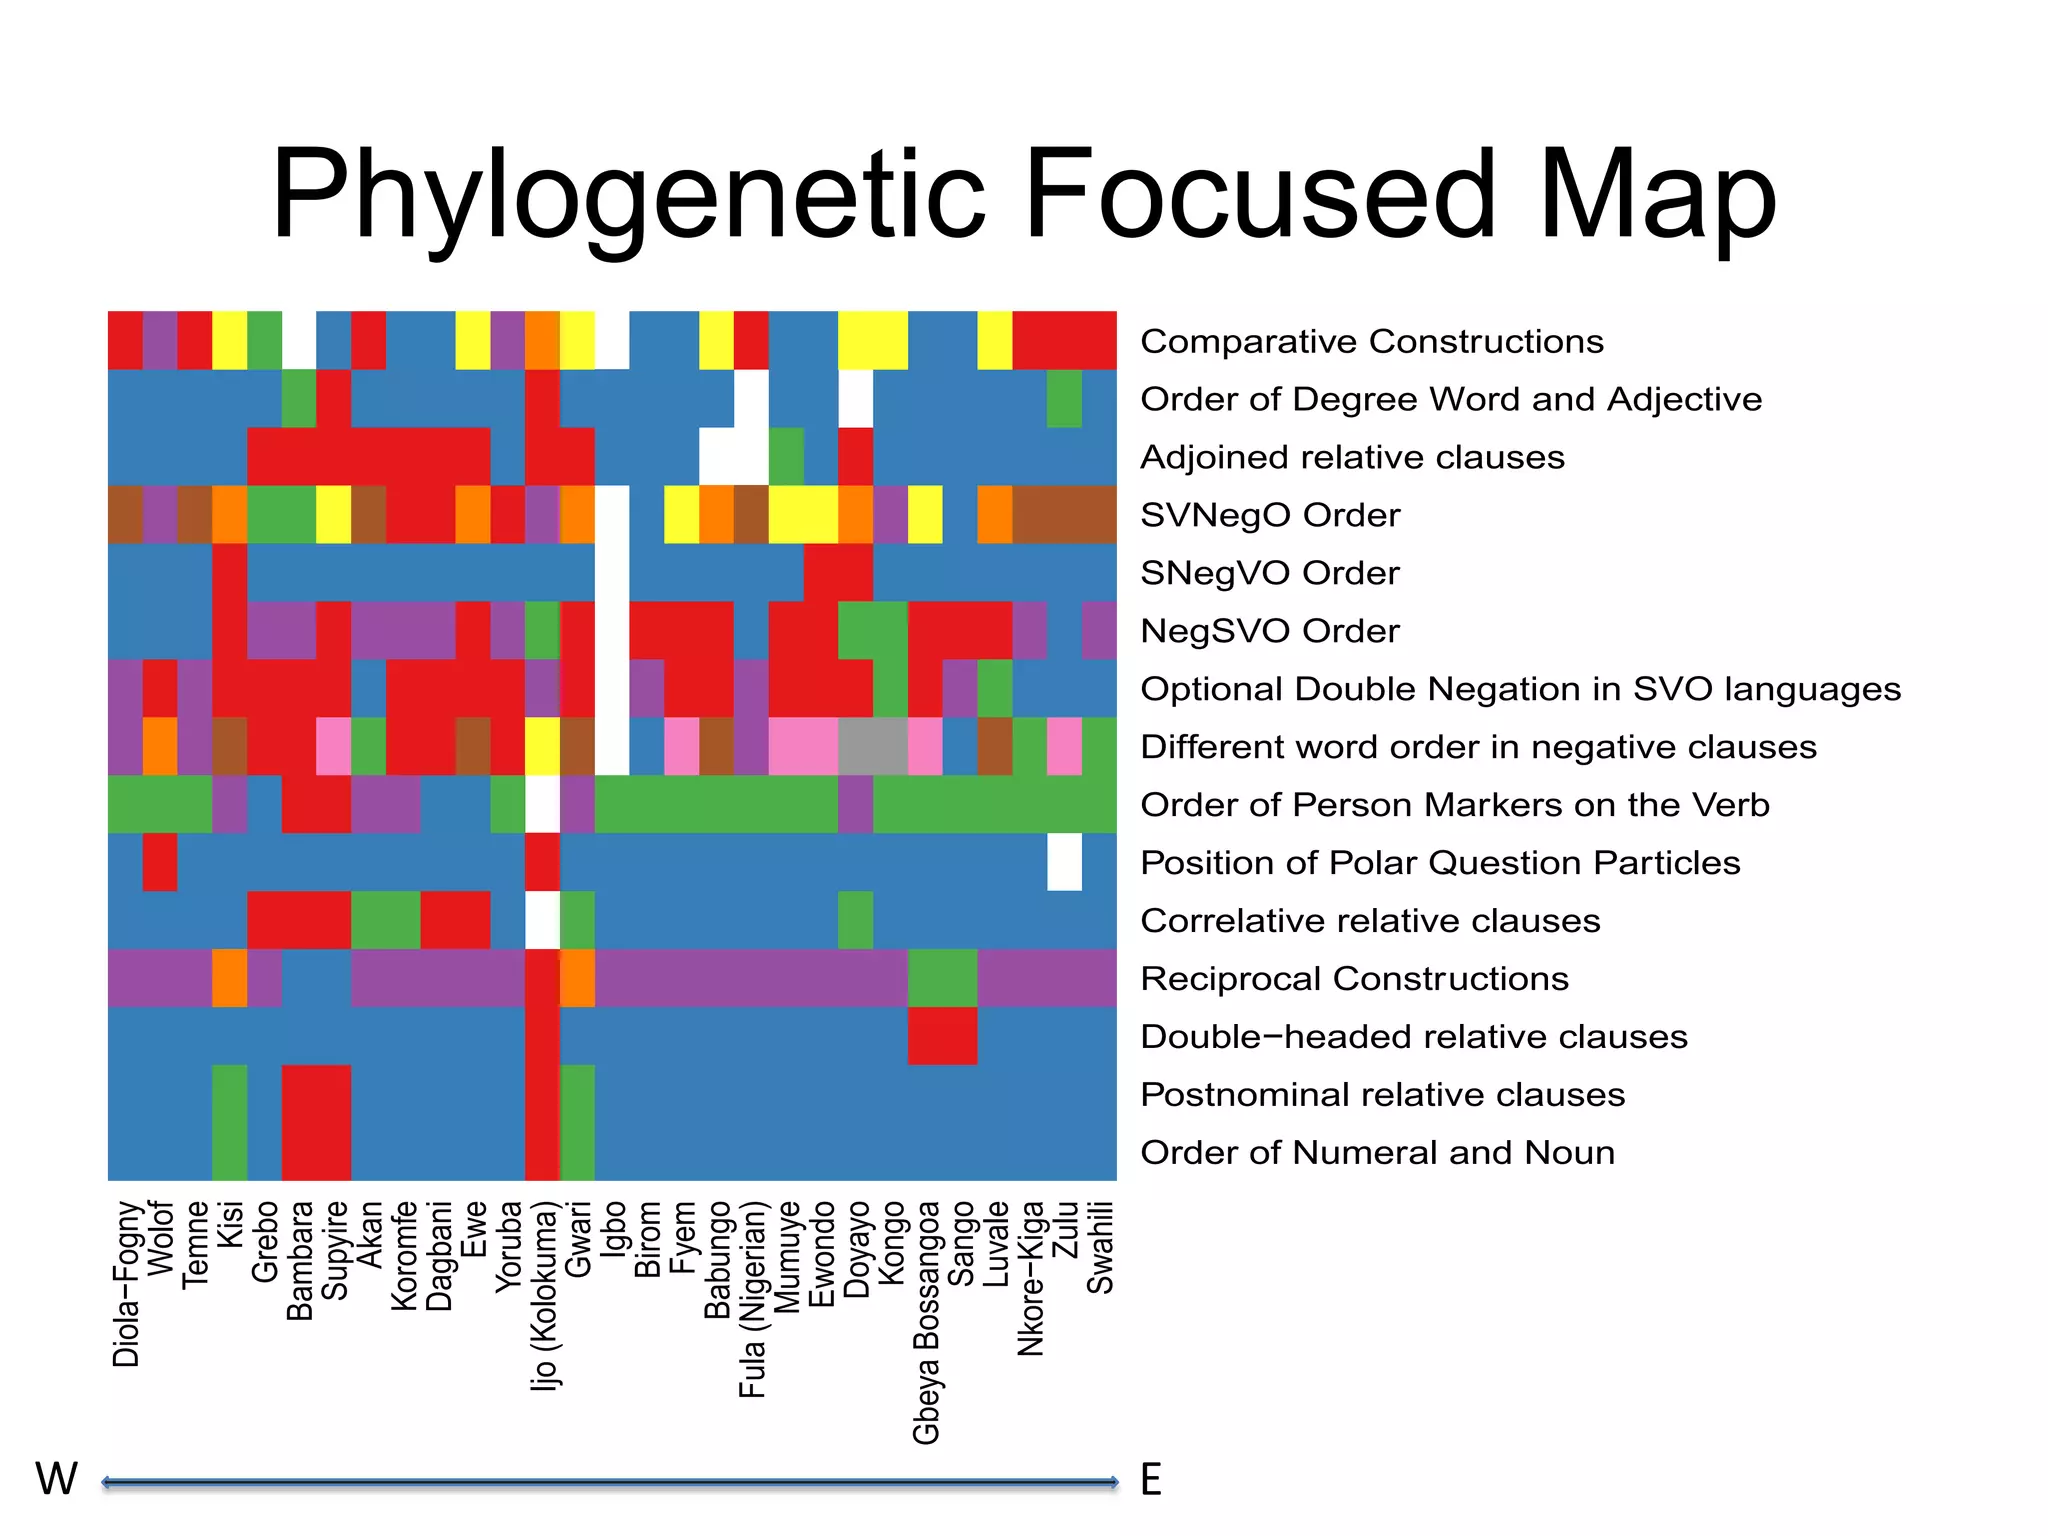
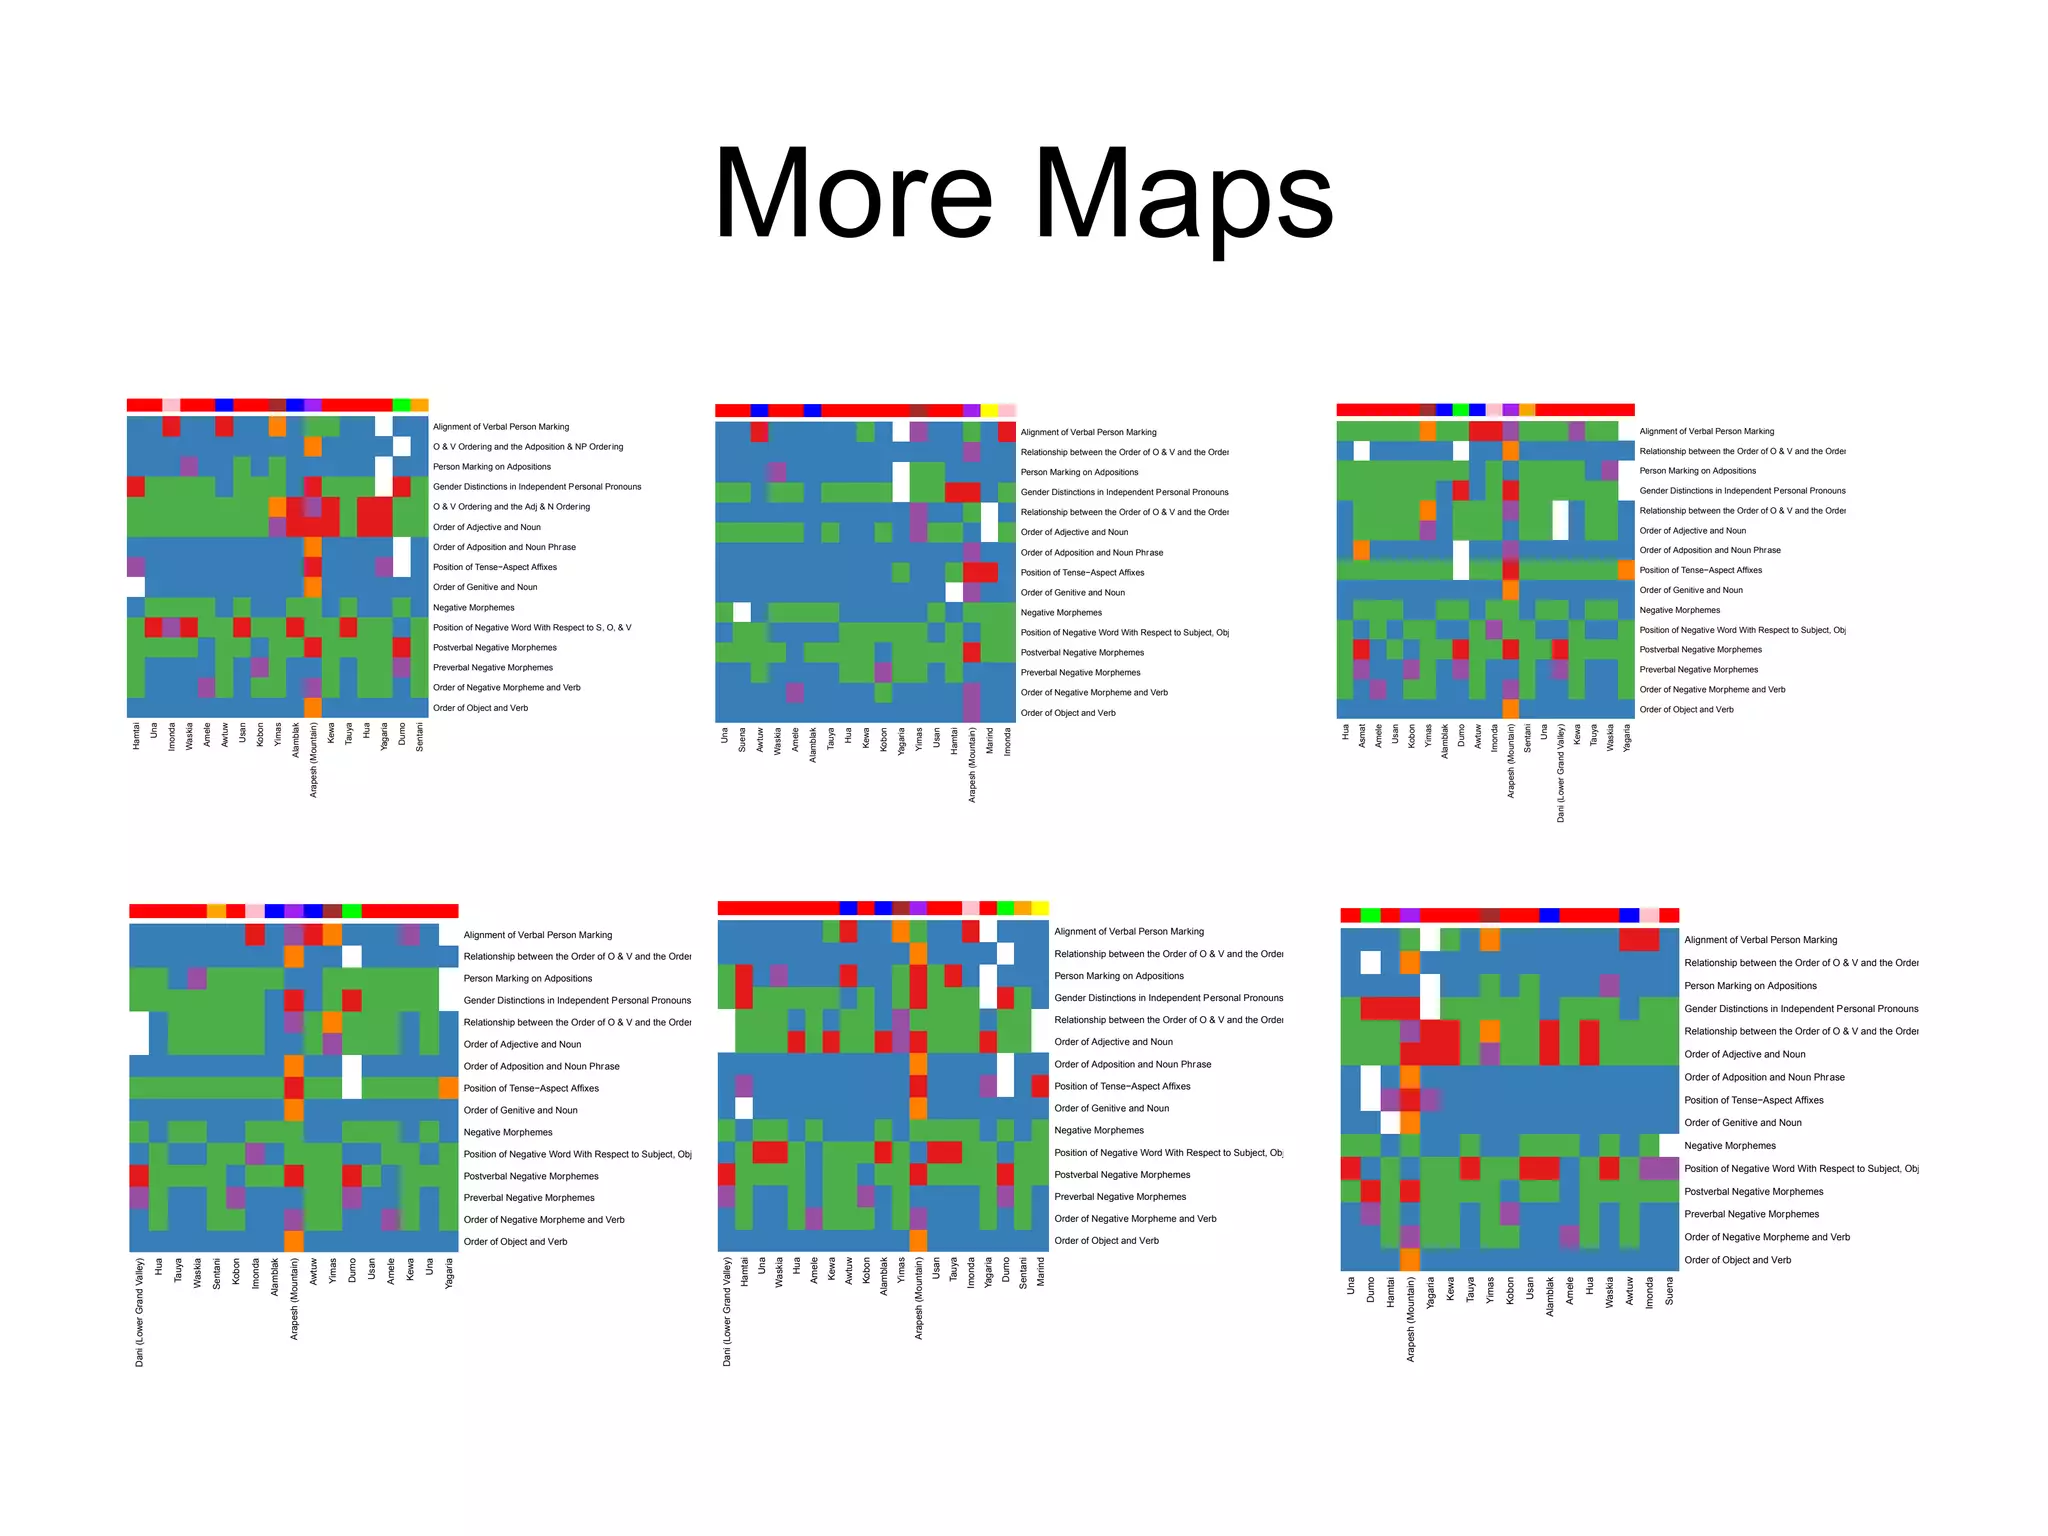

This document describes a new method for visualizing typological relationships by plotting data from the World Atlas of Language Structures (WALS) on heat maps. It combines geographic, phylogenetic, and linguistic data to show typological diversity visually. Previous related work on visualizing language typology, phylogeny, and geographic variation is discussed. The method is applied to 372 languages from WALS to generate heat maps of 14 linguistic features, showing potential for illuminating new areas of linguistic research.


![Basics of-english-grammar[1]](https://cdn.slidesharecdn.com/ss_thumbnails/basics-of-english-grammar1-130418054318-phpapp01-thumbnail.jpg?width=640&height=640&fit=bounds)


![Vibe Coding vs. Spec-Driven Development [Free Meetup]](https://cdn.slidesharecdn.com/ss_thumbnails/vibecodingvsspecdrivendevelopment-251209105622-43f455e7-thumbnail.jpg?width=640&height=640&fit=bounds)


