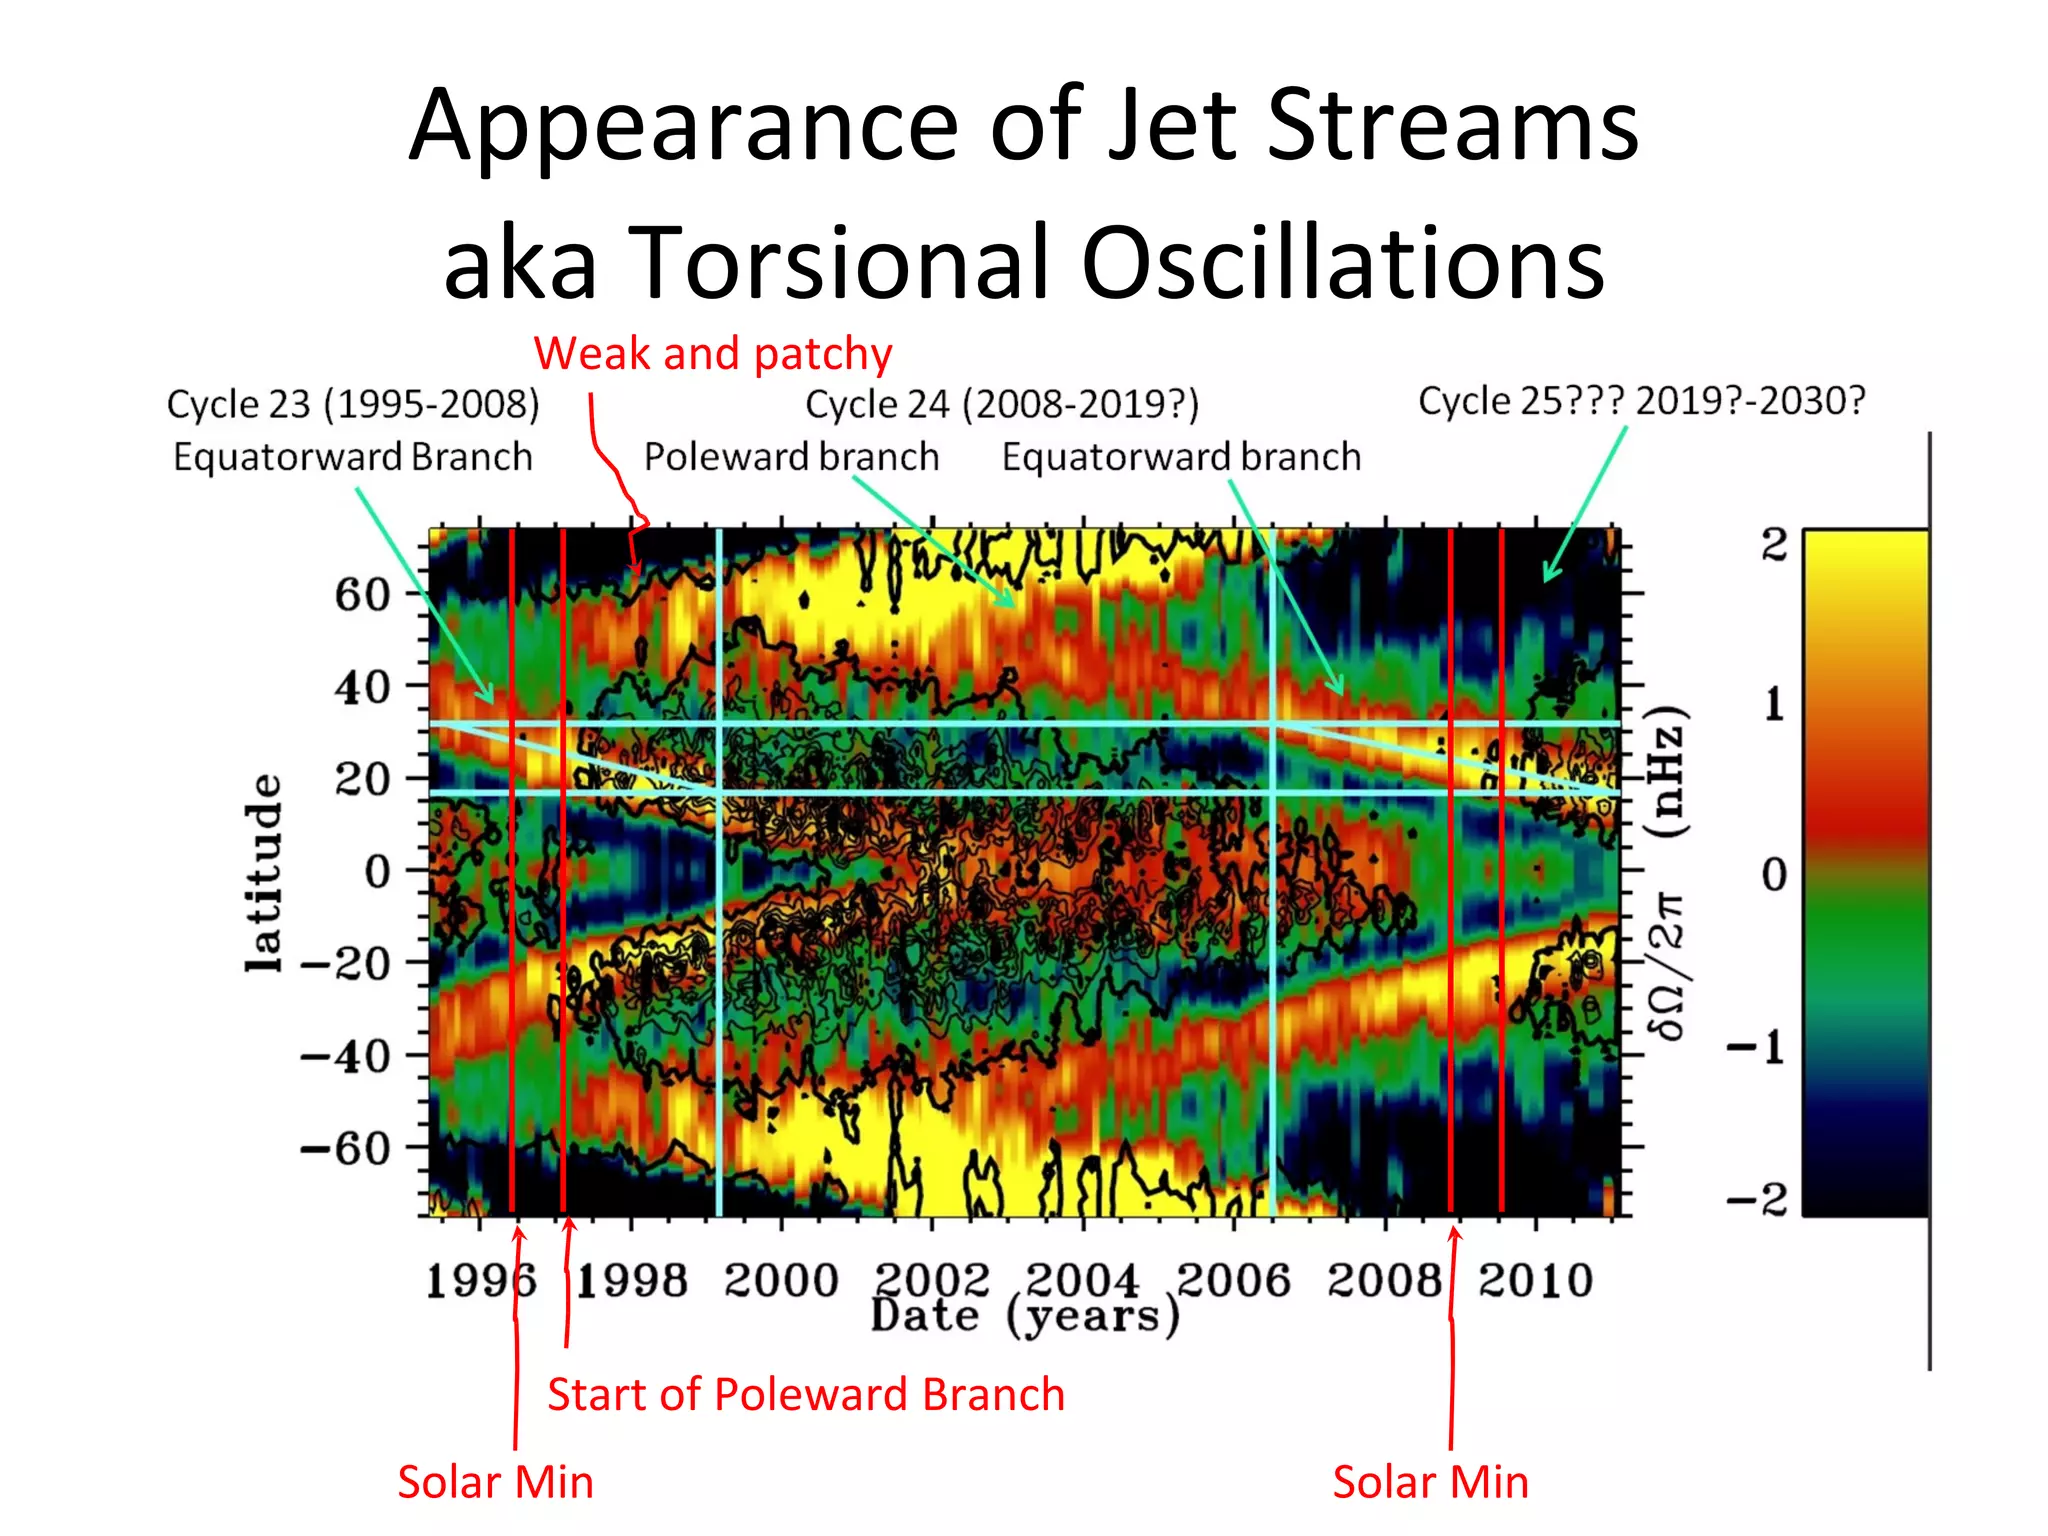
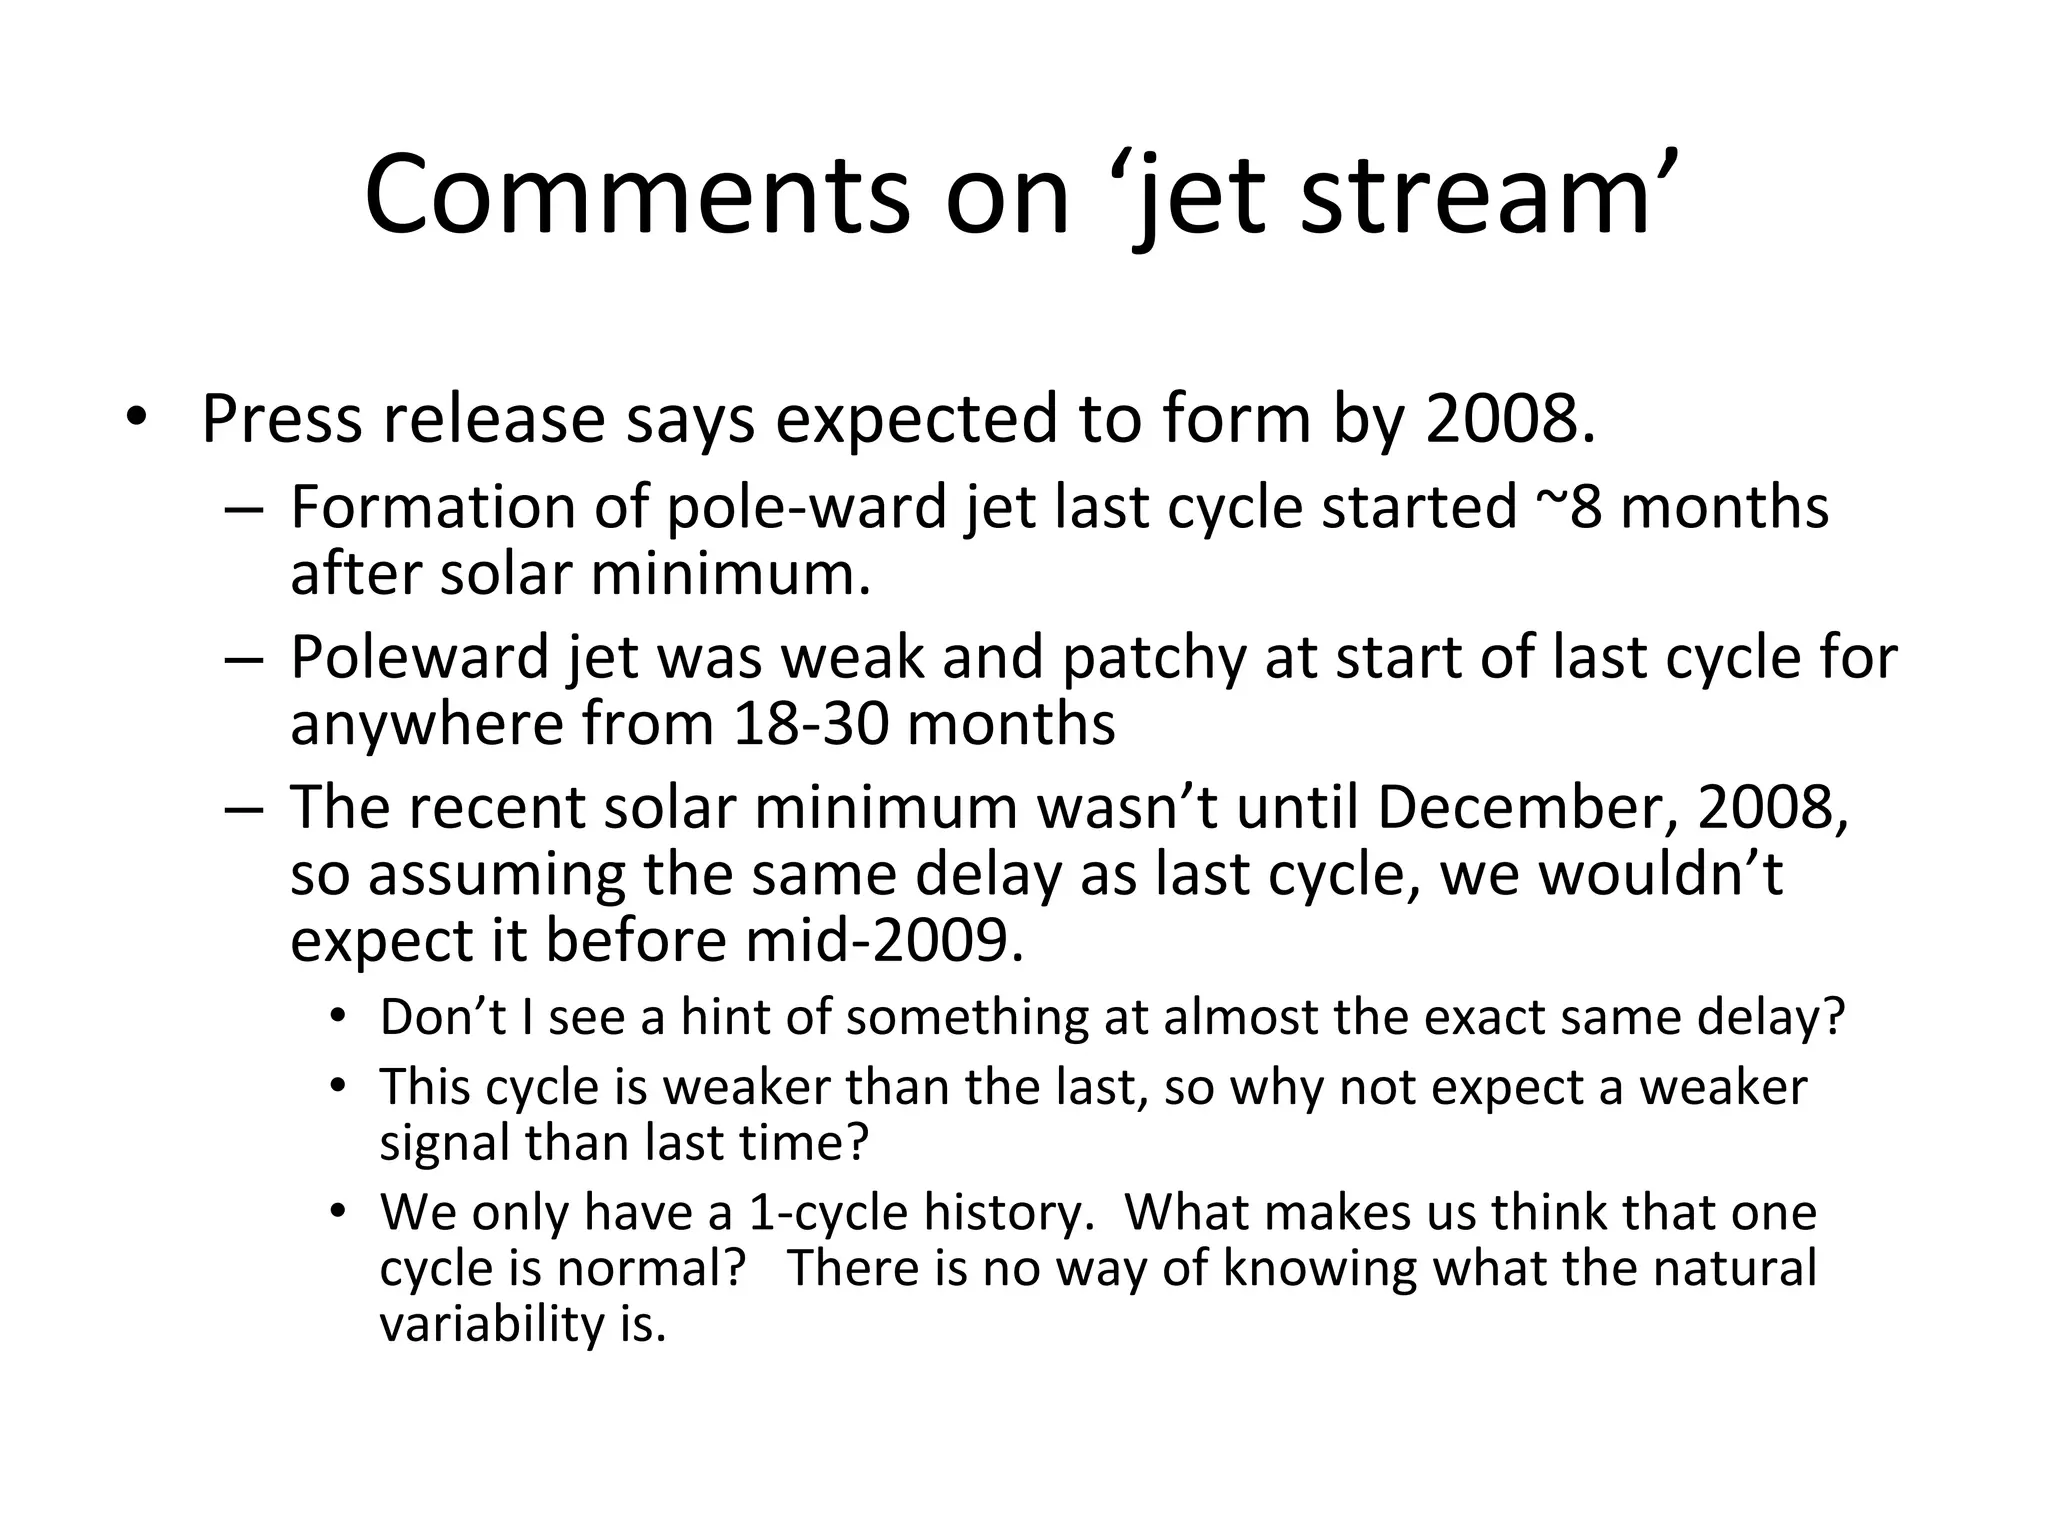
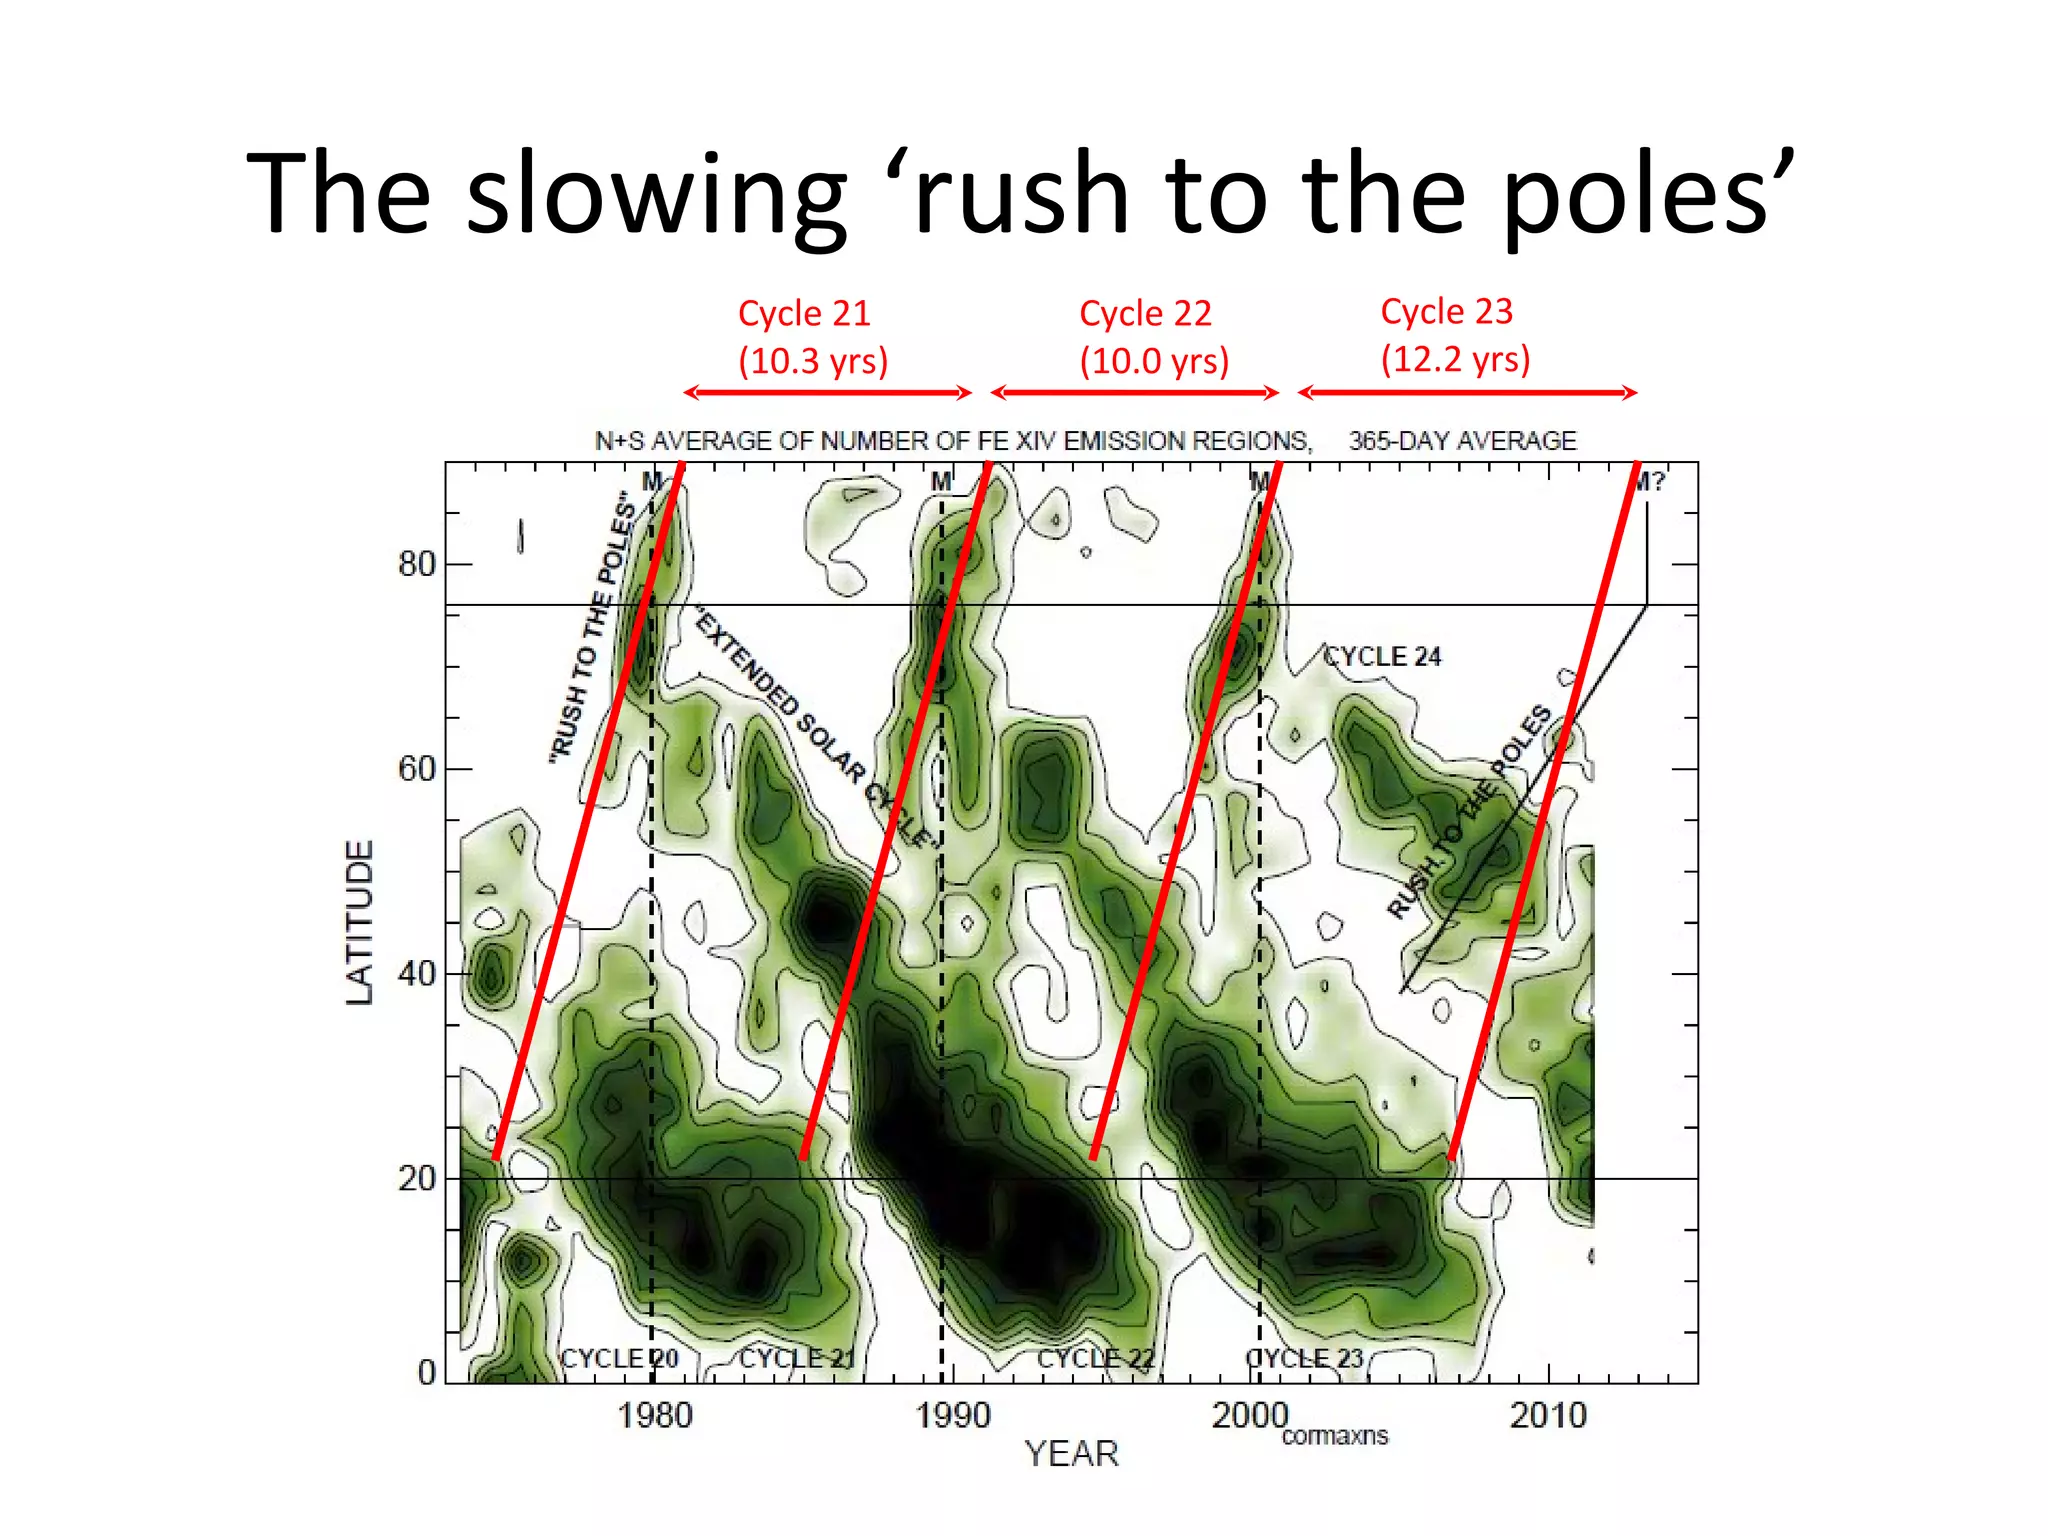
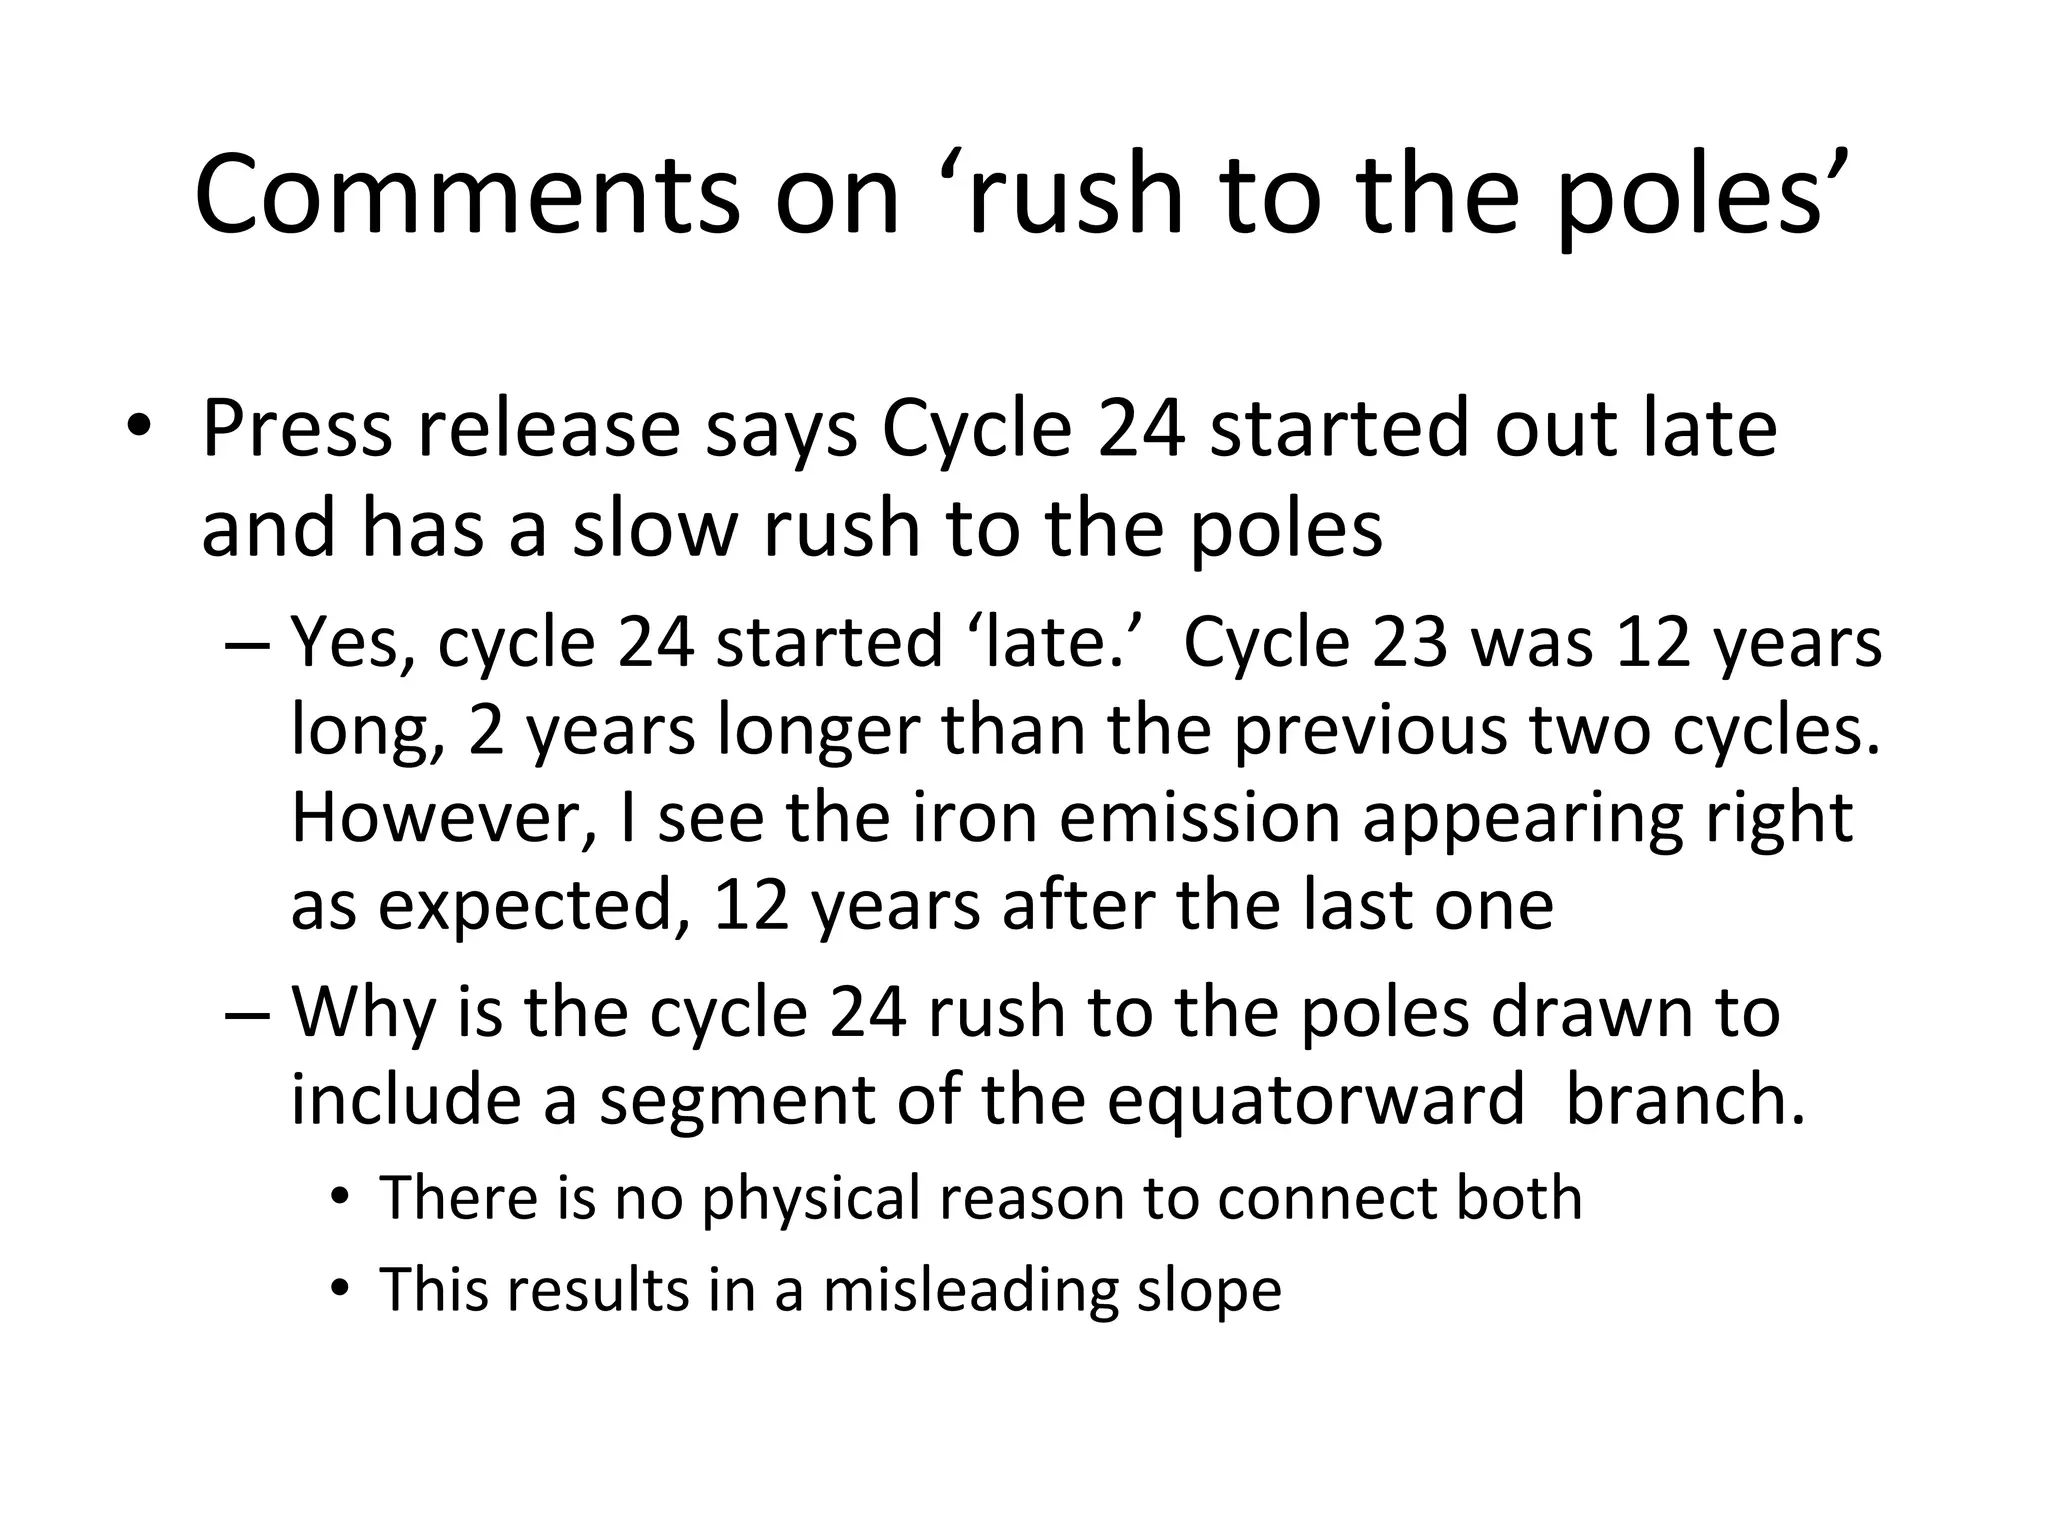
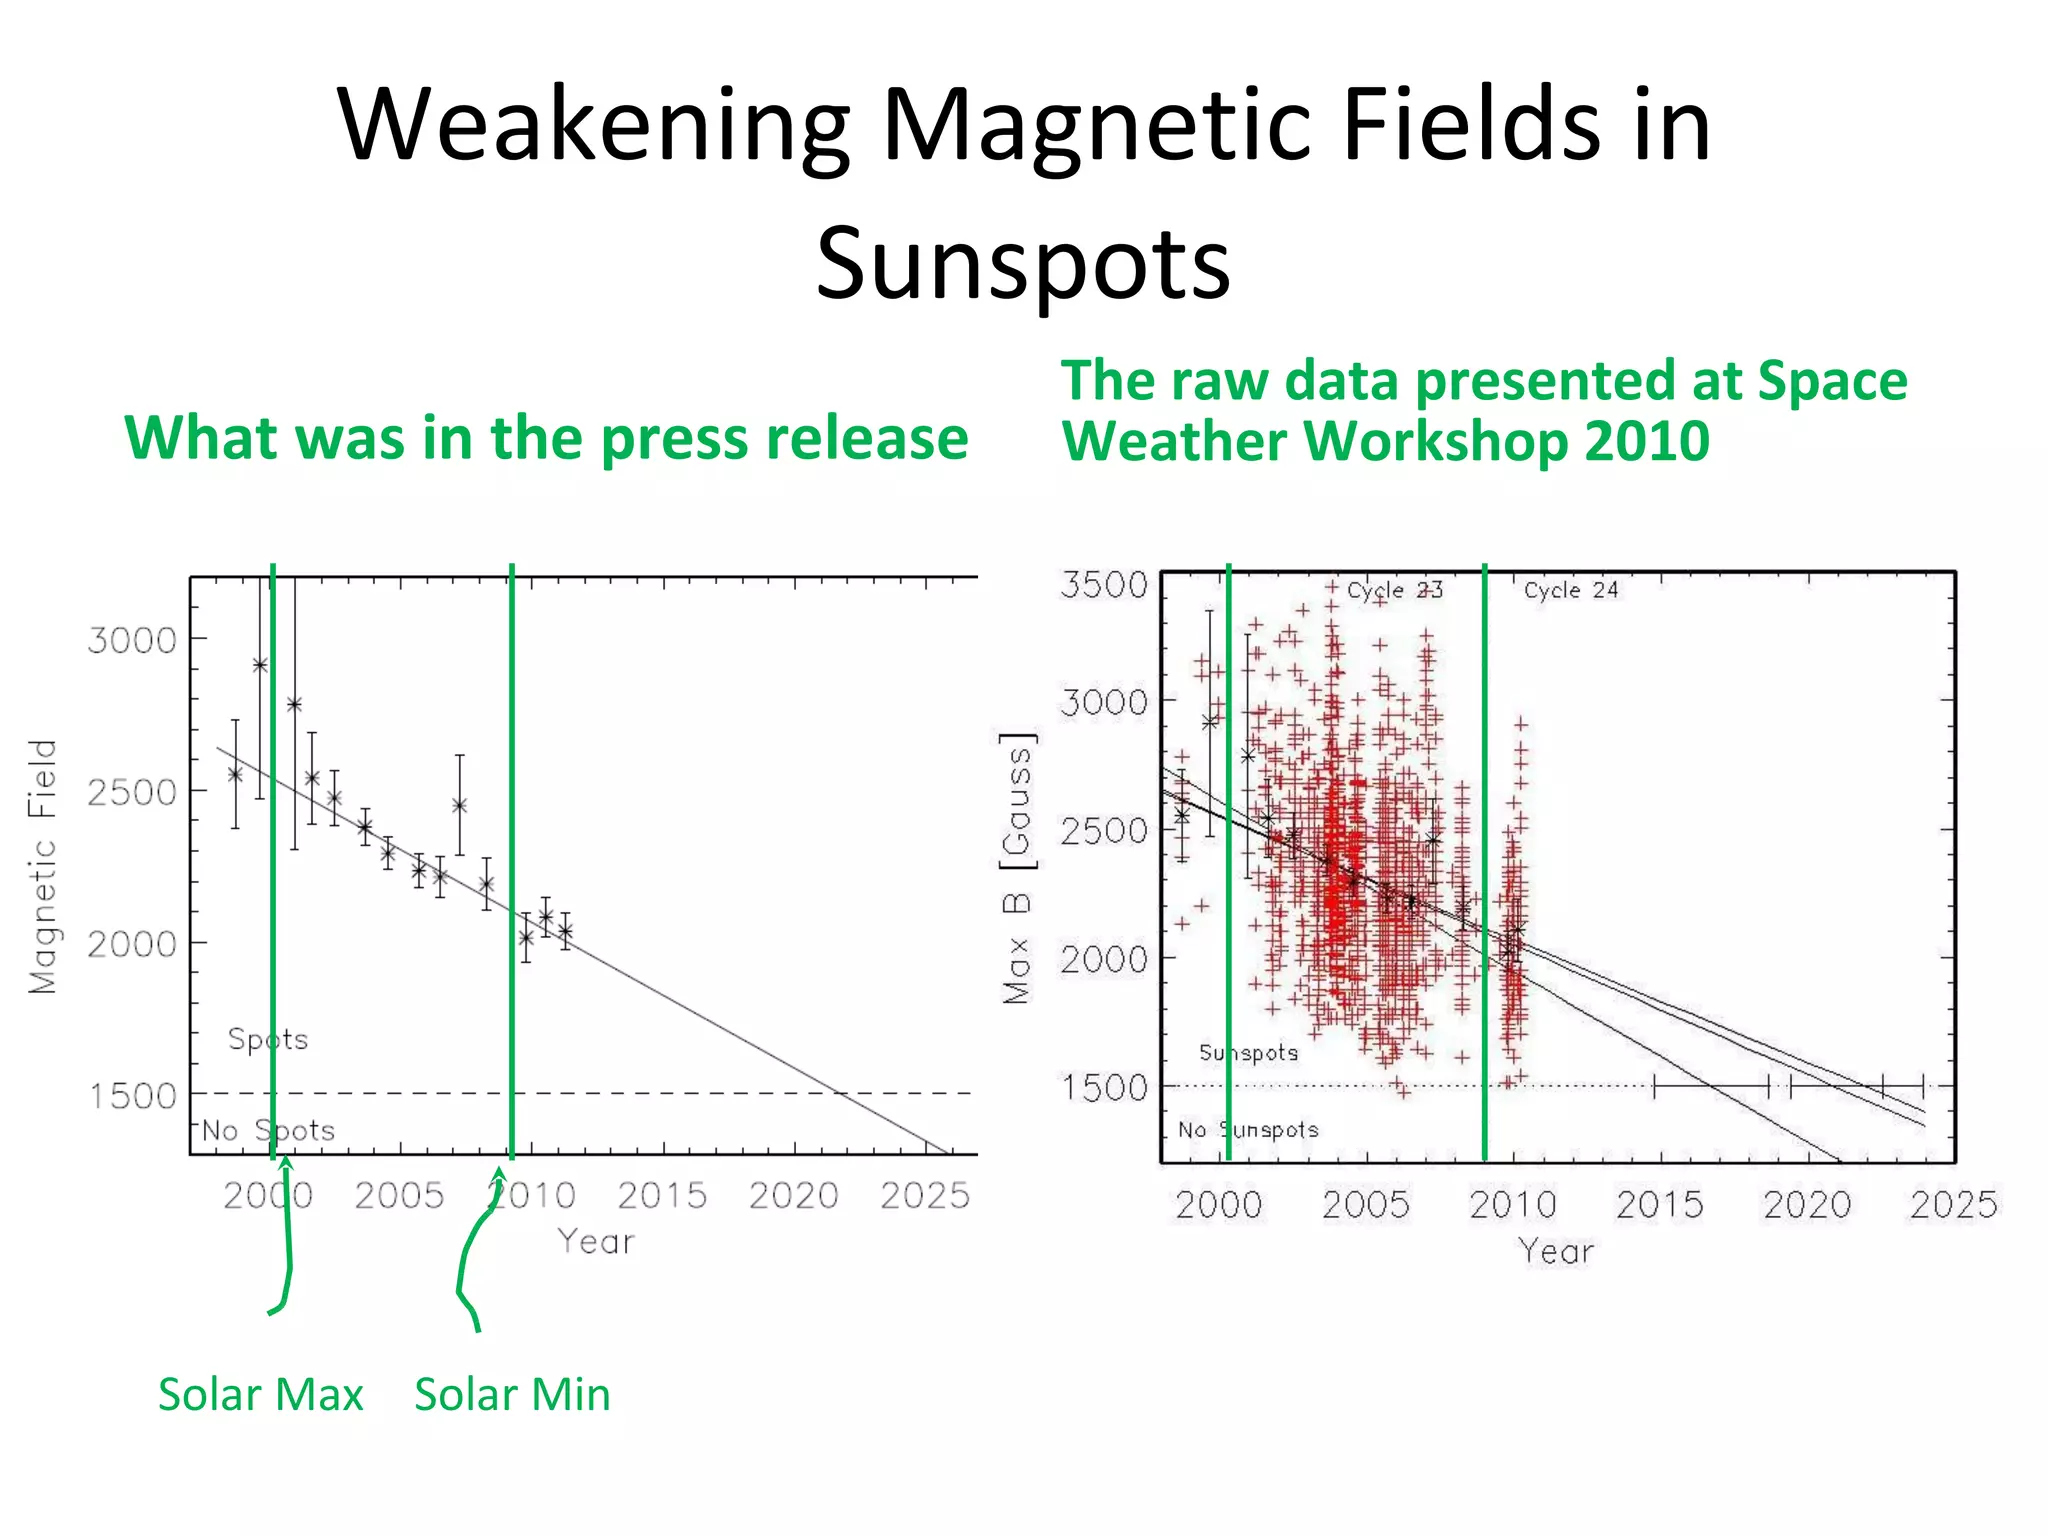
Why there is no evidence for a new Maunder Minimum Doug Biesecker
Appearance of Jet Streams aka Torsional Oscillations Solar Min Start of Poleward Branch Solar Min Weak and patchy
Comments on ‘jet stream’ Press release says expected to form by 2008.  Formation of pole-ward jet last cycle started ~8 months after solar minimum. Poleward jet was weak and patchy at start of last cycle for anywhere from 18-30 months The recent solar minimum wasn’t until December, 2008, so assuming the same delay as last cycle, we wouldn’t expect it before mid-2009. Don’t I see a hint of something at almost the exact same delay? This cycle is weaker than the last, so why not expect a weaker signal than last time? We only have a 1-cycle history.  What makes us think that one cycle is normal?  There is no way of knowing what the natural variability is.
The slowing ‘rush to the poles’ Cycle 21 (10.3 yrs) Cycle 22 (10.0 yrs) Cycle 23 (12.2 yrs)
Comments on ‘rush to the poles’ Press release says Cycle 24 started out late and has a slow rush to the poles Yes, cycle 24 started ‘late.’  Cycle 23 was 12 years long, 2 years longer than the previous two cycles.  However, I see the iron emission appearing right as expected, 12 years after the last one Why is the cycle 24 rush to the poles drawn to include a segment of the equatorward  branch.  There is no physical reason to connect both This results in a misleading slope
Weakening Magnetic Fields in Sunspots What was in the press release The raw data presented at Space Weather Workshop 2010 Solar Max Solar Min
Comments on weakening magnetic field in sunspots Press release says that >13 years of data show 50 Gauss per year drop in magnetic field The figure used in the press release, available at  http://www.boulder.swri.edu/~deforest/SPD-sunspot-release/   is somewhat misleading (I know, it does have error bars), but the reality is the data before and at solar max is incredibly sparse. There is no obvious reason that a straight line is the appropriate fit to these data.  A curve that follows the solar cycle may in fact provide a better reduced chi square. That is, an increase in the magnetic field strength before solar maximum and also an increase after solar minimum looks completely consistent with the data

Why there is no evidence for a new Maunder Minimum

  • 1.
    Why there isno evidence for a new Maunder Minimum Doug Biesecker
  • 2.
    Appearance of JetStreams aka Torsional Oscillations Solar Min Start of Poleward Branch Solar Min Weak and patchy
  • 3.
    Comments on ‘jetstream’ Press release says expected to form by 2008. Formation of pole-ward jet last cycle started ~8 months after solar minimum. Poleward jet was weak and patchy at start of last cycle for anywhere from 18-30 months The recent solar minimum wasn’t until December, 2008, so assuming the same delay as last cycle, we wouldn’t expect it before mid-2009. Don’t I see a hint of something at almost the exact same delay? This cycle is weaker than the last, so why not expect a weaker signal than last time? We only have a 1-cycle history. What makes us think that one cycle is normal? There is no way of knowing what the natural variability is.
  • 4.
    The slowing ‘rushto the poles’ Cycle 21 (10.3 yrs) Cycle 22 (10.0 yrs) Cycle 23 (12.2 yrs)
  • 5.
    Comments on ‘rushto the poles’ Press release says Cycle 24 started out late and has a slow rush to the poles Yes, cycle 24 started ‘late.’ Cycle 23 was 12 years long, 2 years longer than the previous two cycles. However, I see the iron emission appearing right as expected, 12 years after the last one Why is the cycle 24 rush to the poles drawn to include a segment of the equatorward branch. There is no physical reason to connect both This results in a misleading slope
  • 6.
    Weakening Magnetic Fieldsin Sunspots What was in the press release The raw data presented at Space Weather Workshop 2010 Solar Max Solar Min
  • 7.
    Comments on weakeningmagnetic field in sunspots Press release says that >13 years of data show 50 Gauss per year drop in magnetic field The figure used in the press release, available at http://www.boulder.swri.edu/~deforest/SPD-sunspot-release/ is somewhat misleading (I know, it does have error bars), but the reality is the data before and at solar max is incredibly sparse. There is no obvious reason that a straight line is the appropriate fit to these data. A curve that follows the solar cycle may in fact provide a better reduced chi square. That is, an increase in the magnetic field strength before solar maximum and also an increase after solar minimum looks completely consistent with the data